1 (12) The Global Macroeconomy
1. Discovering Data In this problem you will use data from the Bureau of Economic
Analysis (BEA) to investigate the dependence of the United States on foreign markets
over time. Go to the BEA website at www.bea.gov and under the “National” tab open the
interactive table for “GDP and the National Income and Product Account (NIPA)
Historical Tables.” Open Table 4.1 for “Foreign Transactions” and download the data
going back to 1969.
a. The current account is the difference between “current payments to the rest of the
world” and “current receipts from the rest of the world.” What is the latest estimate of
the current account?
Answer: After downloading the data for the “Foreign Transactions” table of the BEA
National Income and Product Accounts and subtracting “current payments to the rest
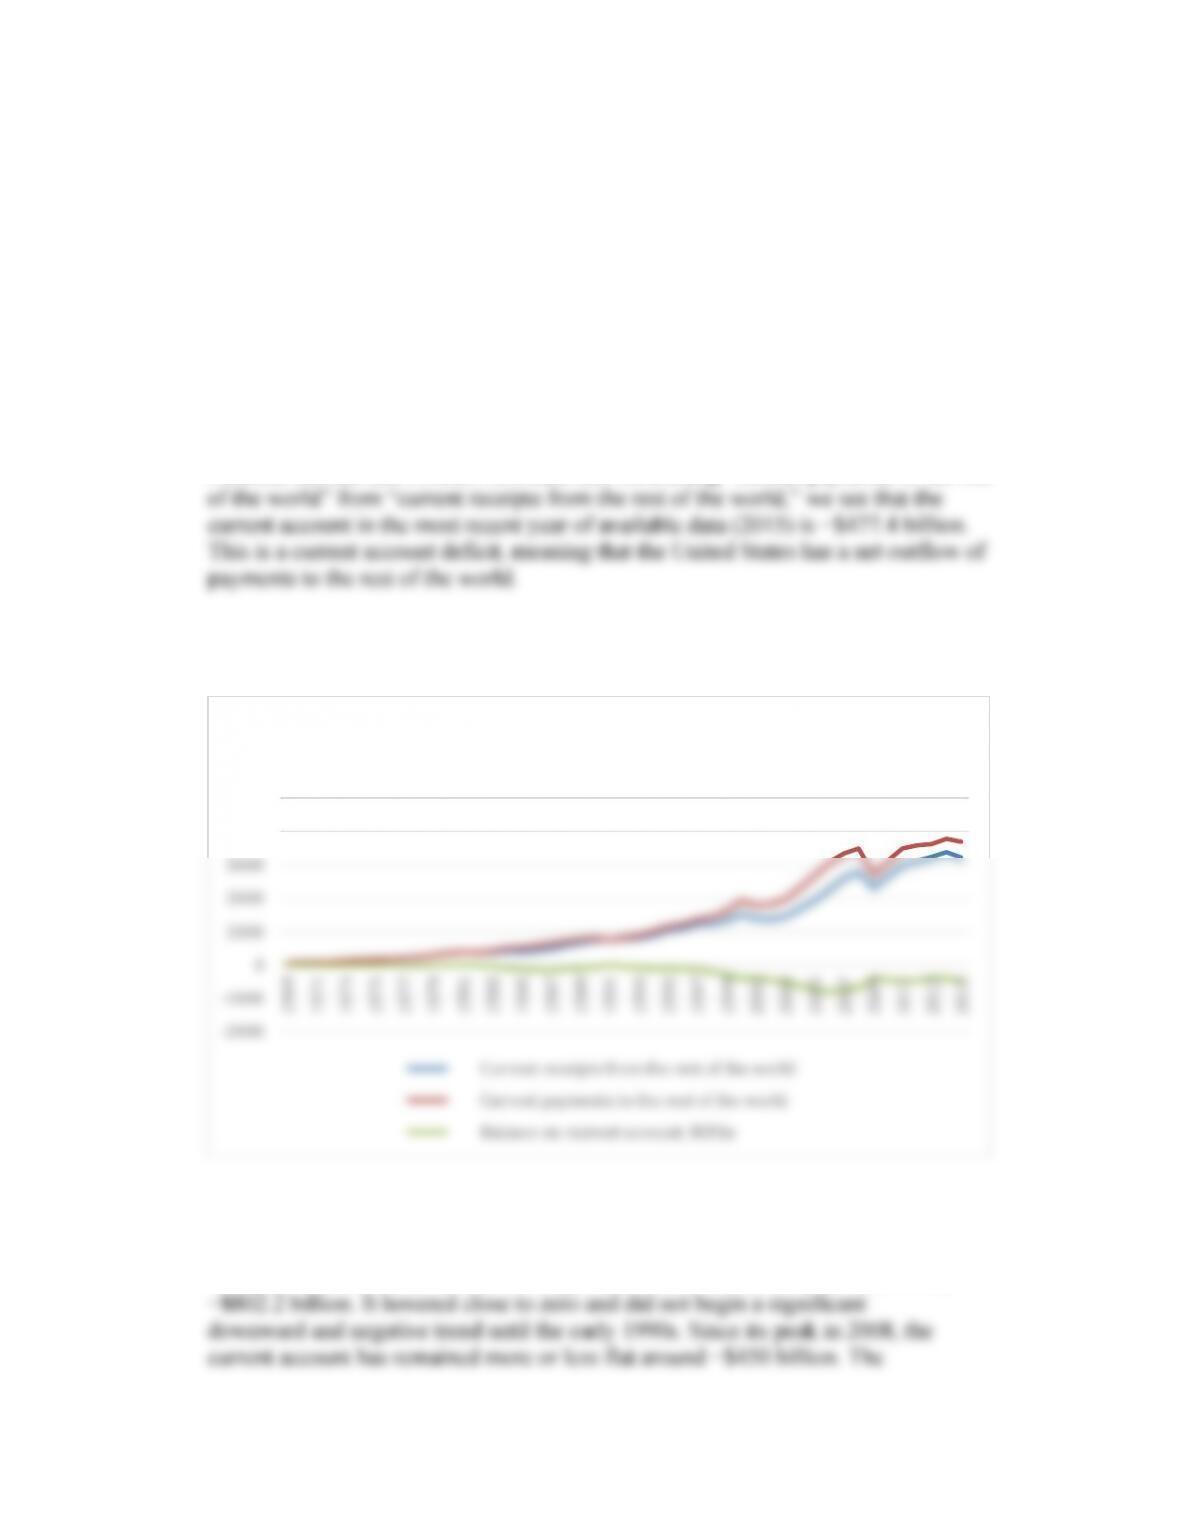
b. Create a graph that shows: Current receipts, Current payments, and Current
account over time.
Answer:
-1000
0
1000
2000
3000
4000
5000
Payments, Receipts, and the Current Account
(Retrieved: March 2016)
d. The United States current account deficit grew significantly from the 1990s up
until the financial crisis of 2008. In principle, this growth could have occurred
because of falling receipts from abroad or increasing payments to foreign countries,
or both. Which factor appears to have driven the growth in the current account deficit
in this period?
e. What does the evolution of the three trends you plotted in part (b) tell you about the
reliance of the United States on foreign markets? Does the country appear to be
growing more open or more closed over time?
Answer: These trends indicate a greater reliance of the United States on foreign
markets. Even if the current account were balanced (it is not), the steady increase in
2. The data in Figure 1-1(12-1) end in 2015. Visit
https://research.stlouisfed.org/fred2/series/DEXCHUS and
https://research.stlouisfed.org/fred2/series/DESUSEU (or another site with daily
exchange rate data) and download data on the same exchange rates (yuan per dollar
and dollar per euro) for the past 12 months. What are the rates today? What were they
a year ago? By what percentage amount did the rates change? Do you think the rates
are floating or fixed? Why?
Answer: Answers will depend on the latest data update. The yuan per dollar
3. Visit the Financial Times website to download data for country risk today. (Hint: Try
searching for “Data Archive Financial Times” to find the Data Archive web page;
then look for “FT500, Fixed incomes, Commodities, Interest rates.”) You may need
to download the most recent daily report (pdf) for interest rates, and look for the table
containing high-yield emerging market rates. Which three emerging market countries
have the highest spreads on their U.S. dollar debt? Which three have the lowest?
Answer: Answers will depend on the latest data update. The spread also depends on
the date of maturity for these bonds. In the sample of countries in the Financial
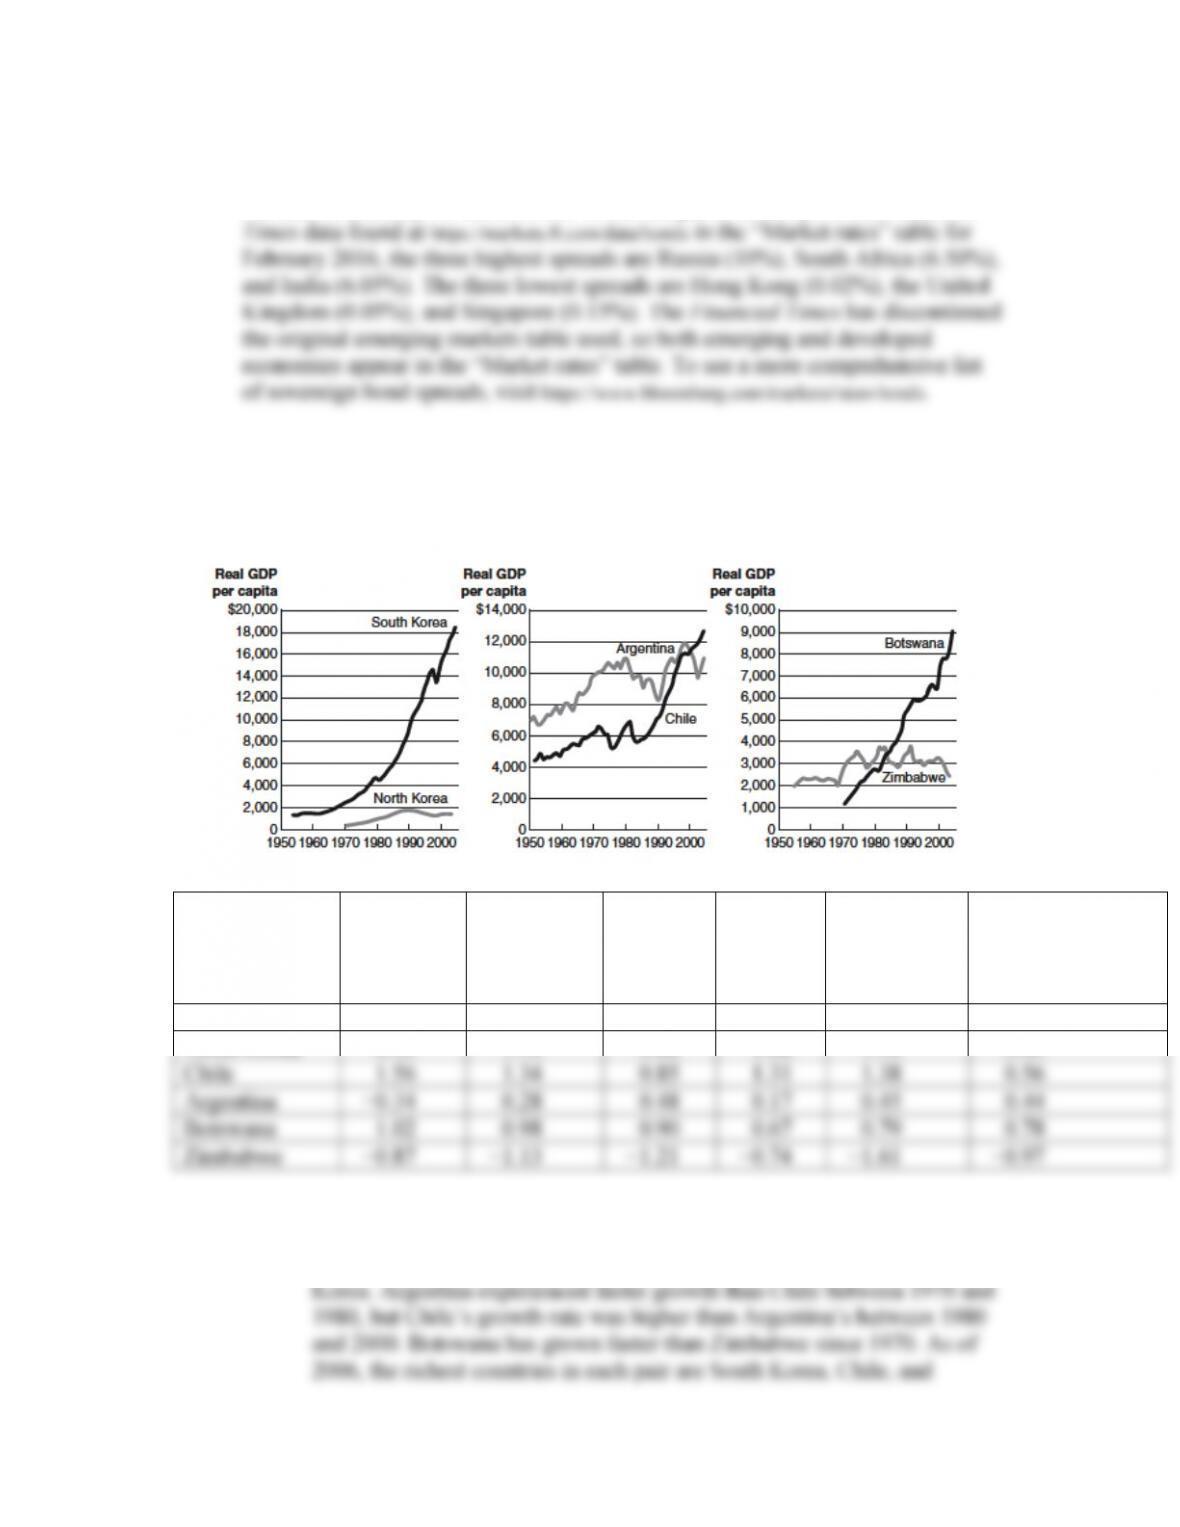
4. The charts below show the growth of real GDP per capita in three pairs of
geographically adjacent countries: North and South Korea, Argentina and Chile,
Zimbabwe and Botswana (using data from the Penn World Table).
Control of
Corruption
Government
Effectiveness
Political
Stability
and
Absence of
Violence
Rule of
Law
Regulatory
Quality
Voice and
Accountability
South Korea
0.37
0.63
0.49
0.64
0.47
0.76
North Korea
−0.93
−1.10
−0.66
−1.08
−1.70
−2.02
Chile
1.56
1.34
0.85
1.31
1.38
0.56
Argentina
−0.34
0.28
0.48
0.17
0.45
0.44
Botswana
1.02
0.98
0.90
0.67
0.79
0.78
Zimbabwe
−0.87
−1.13
−1.21
−0.74
−1.61
−0.97
a. Which country in each pair experienced faster growth in GDP per capita? Which
one is now richest?
Answer: South Korea experienced faster growth than North
b. The World Bank’s World Governance Indicators for each country in 2000 were as
shown in the table (higher is better).Based on these data, do you think institutions
can explain the divergent outcomes in these countries? Explain. Why do you think
it helps to compare countries that are physically contiguous?
5. Visit one of the many websites that list all of the current exchange rates between
different currencies around the world. Try a financial newspaper’s site such as ft.com
(follow the links to “Market Data,” and then “Currencies”), or try websites devoted to
foreign exchange market data such as oanda.com or xe.com (dig down—don’t just
look at the major currency tables). According to these lists, how many distinct
currencies exist around the world today? Are some currencies used in more than one
country?
Answer: Answers will depend on the latest data update. This answer is based on
information obtained from the Market Data section in the Wall Street Journal for