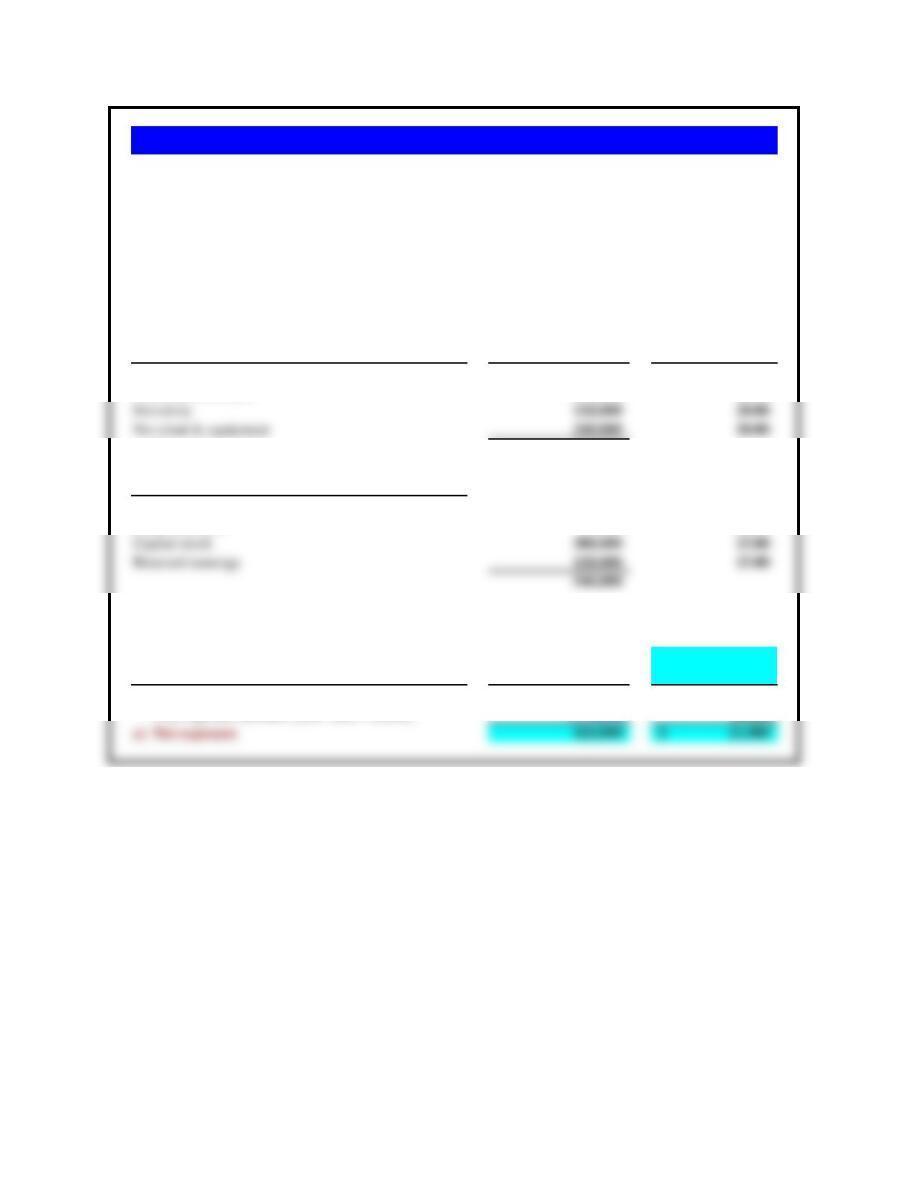
(a)
Exchange Rate Exchange Rate
(₺/€) (₺/€)
Cash 10,600,000 5.2 € 2,038,462 5.5 € 1,927,273
Accounts receivable 30,200,000 5.2 5,807,692 5.5 5,490,909
Liabilities and Net Worth
Accounts payable 8,000,000 5.2 € 1,538,462 5.5 € 1,454,545
Short-term bank debt 10,600,000 5.2 2,038,462 5.5 1,927,273
Long-term debt 10,600,000 5.2 2,038,462 5.5 1,927,273
Common stock 10,800,000 5.276 2,047,005 5.276 2,047,005
Retained earnings 62,000,000 5.2000(a) 11,923,076 5.2000(b) 11,923,076
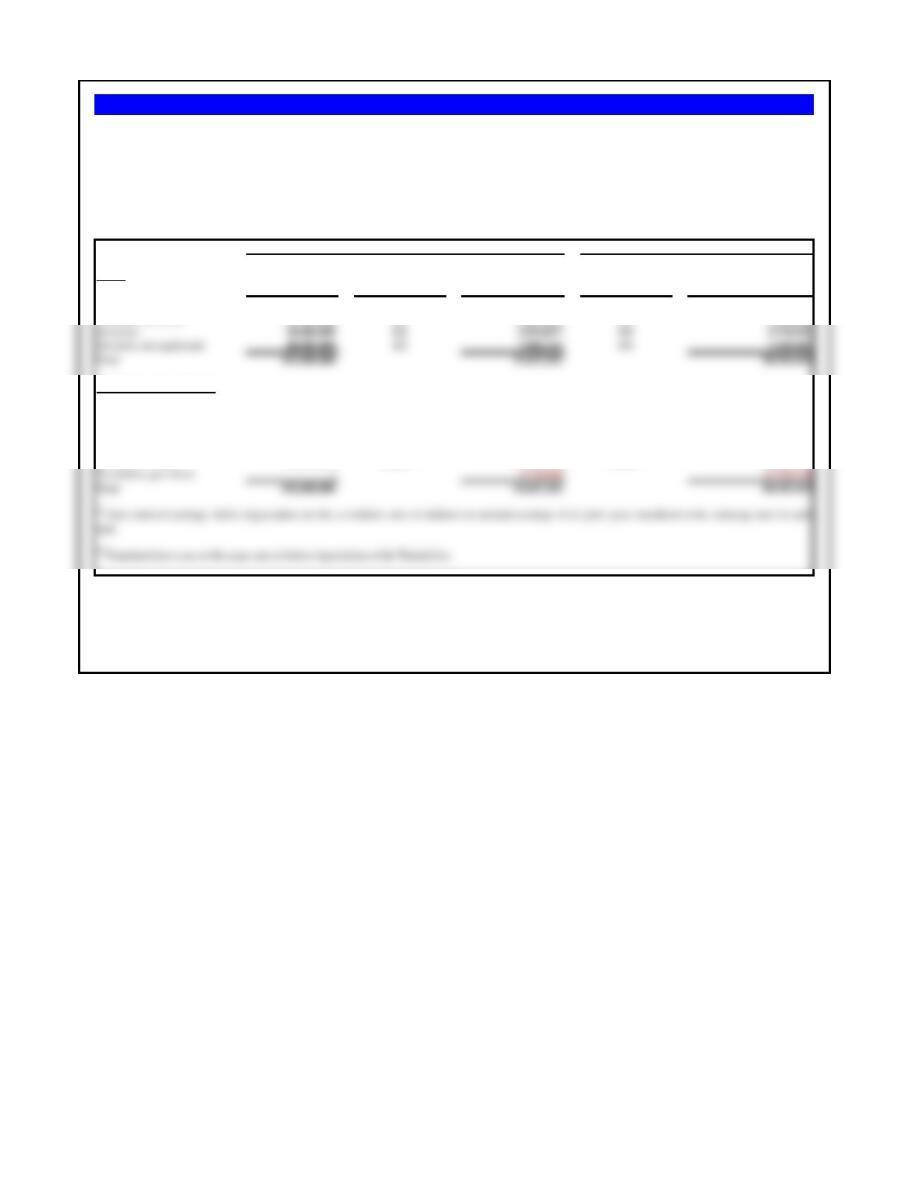
The translation loss is €733,718.
(b)
The translation loss is reflected as a decrease in the equity account.
Translated Accounts (€)
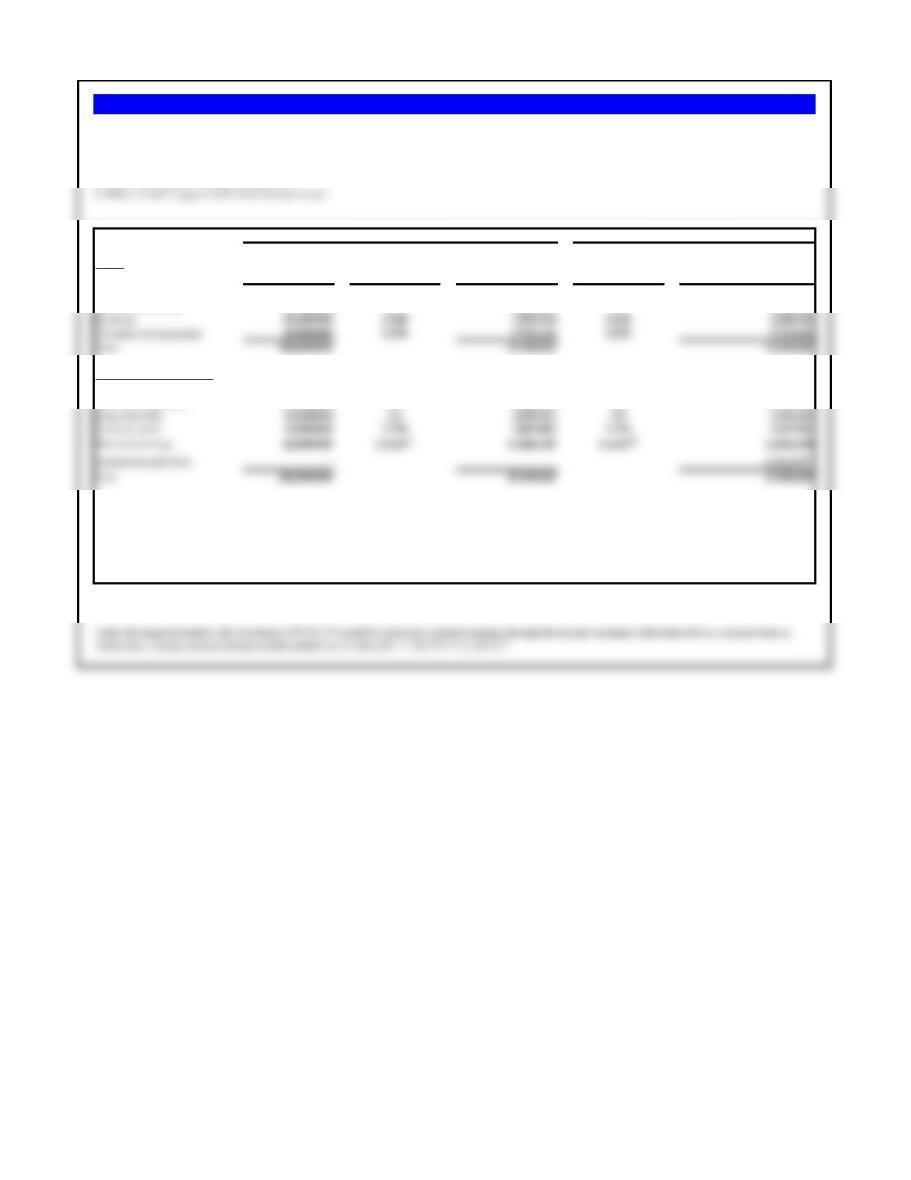
Problem 11.1 Aidan Turkey (A).
Using the facts outlined for Aidan Turkey, assume the exchange rate on January 2, 2016, in Exhibit 11.4 dropped in value from ₺5.2000/€ to
₺5.5000/€ (rather than to ₺6.0000/€). Recalculate Aidan Turkey’s translated balance sheet for January 2, 2016, with the new exchange rate using the current rate
method.
a. What is the amount of translation gain or loss?
b. Where should the translation gain or loss appear in the financial statements?
December 31, 2015
January 2, 2016
Assets
In Turkish lira (₺)
Translated Accounts
(€)
(a)
Exchange Rate Exchange Rate
(₺/€) (₺/€)
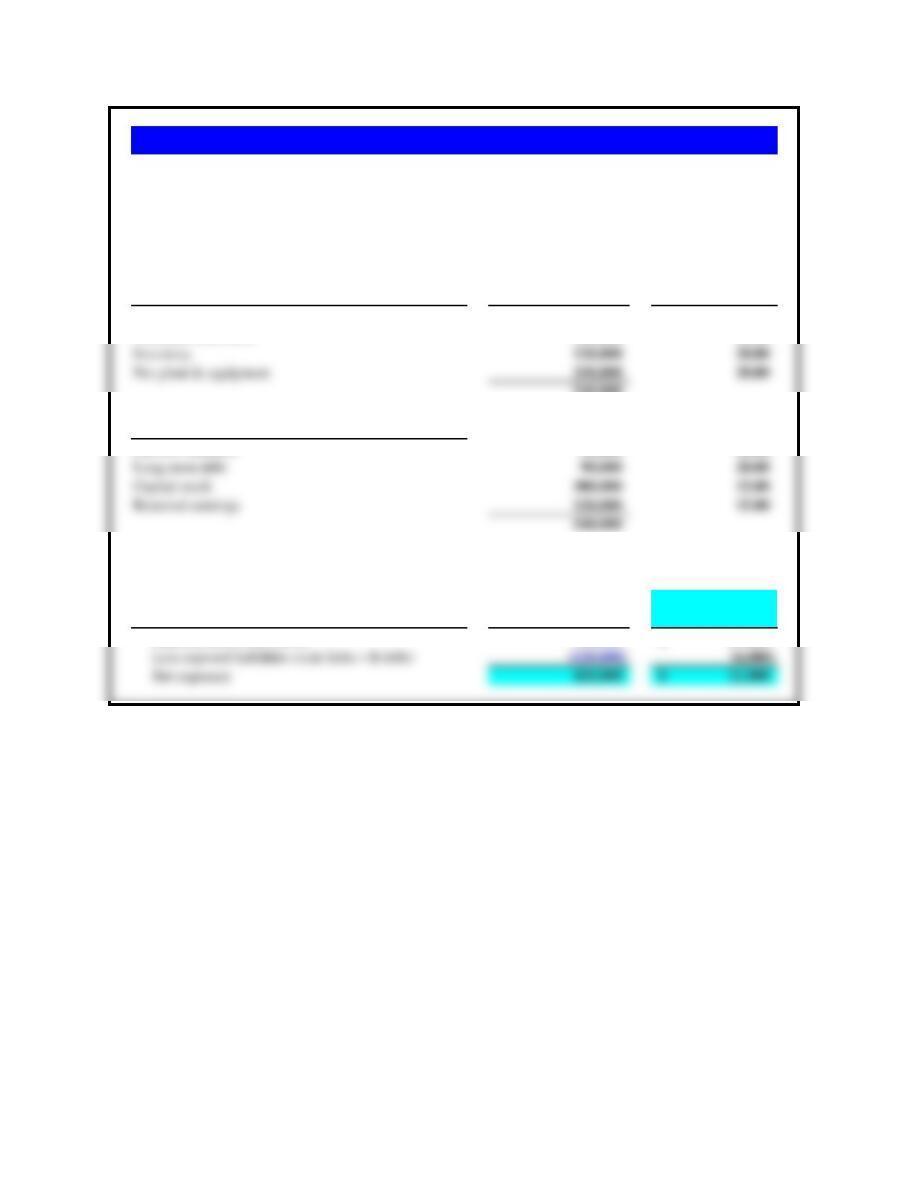
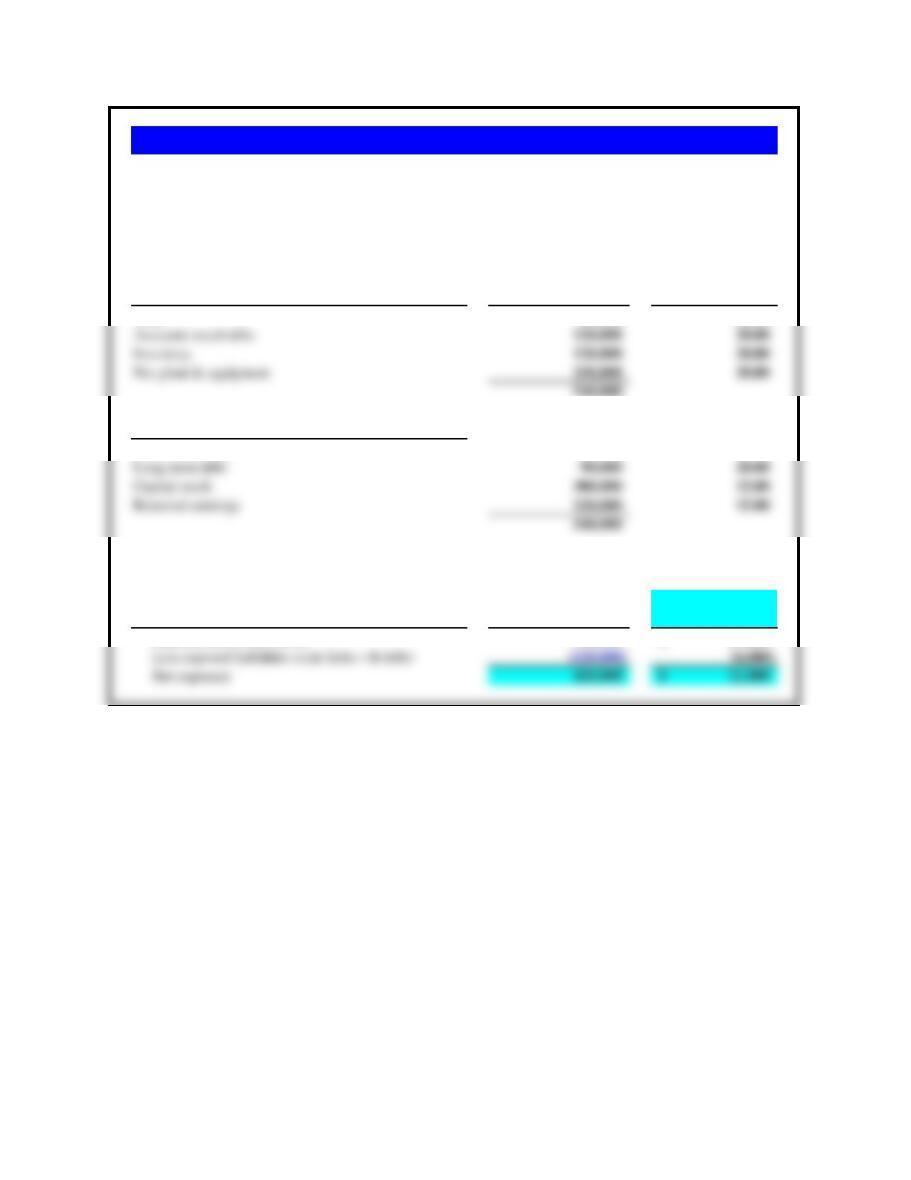
Cash 10,600,000 5.2 € 2,038,462 5.5 € 1,927,273
Accounts receivable 30,200,000 5.2 5,807,692 5.5 5,490,909
Inventory 20,400,000 5.218 3,909,544 5.218 3,909,544
Net plant and equipment 40,800,000 5.276 7,733,131 5.276 7,733,131
Total 102,000,000 19,488,829 19,060,857
Liabilities and Net Worth
Accounts payable 8,000,000 5.2 € 1,538,462 5.5 € 1,454,545
Short-term bank debt 10,600,000 5.2 2,038,462 5.5 1,927,273
Long-term debt 10,600,000 5.2 2,038,462 5.5 1,927,273
Common stock 10,800,000 5.276 2,047,005 5.276 2,047,005
Total 102,000,000 19,488,829 19,060,857
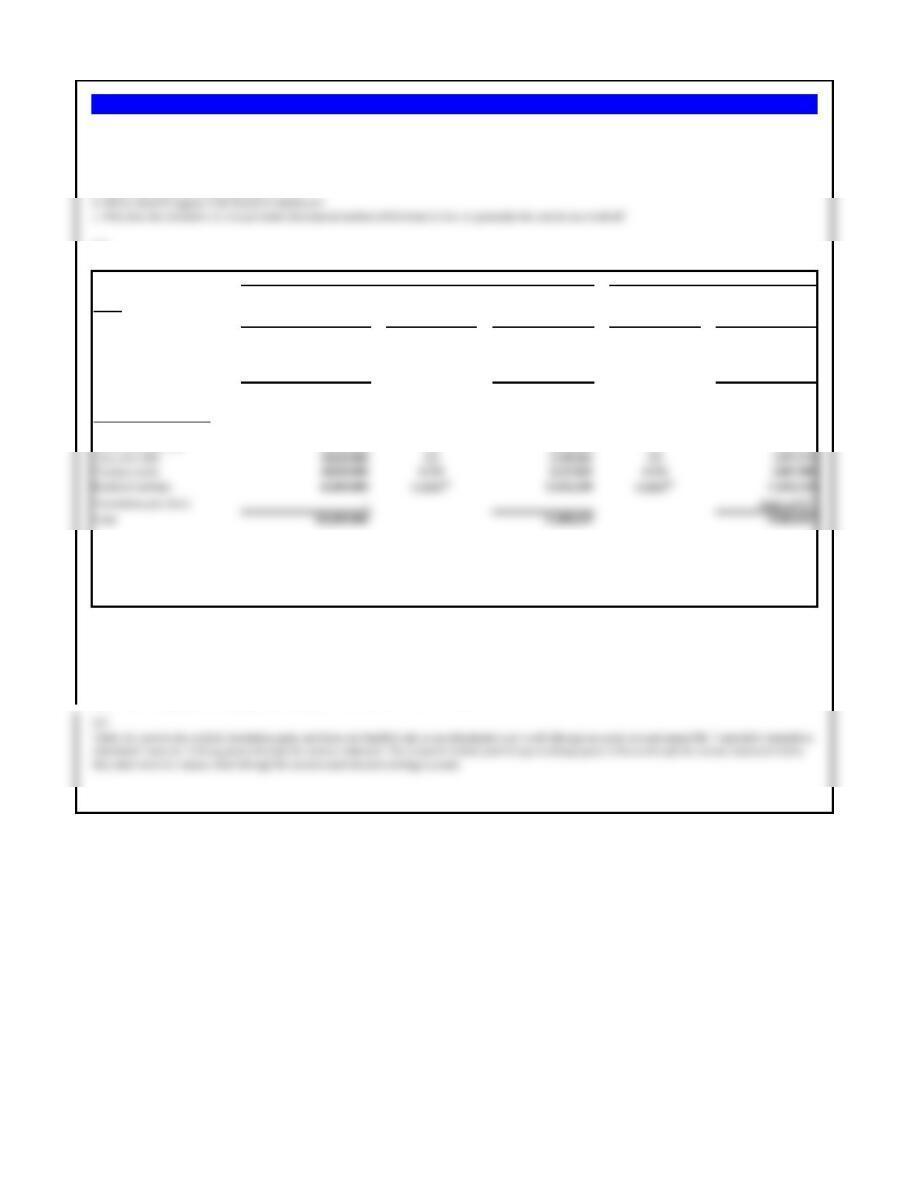
The translation loss is €121,677
(b)
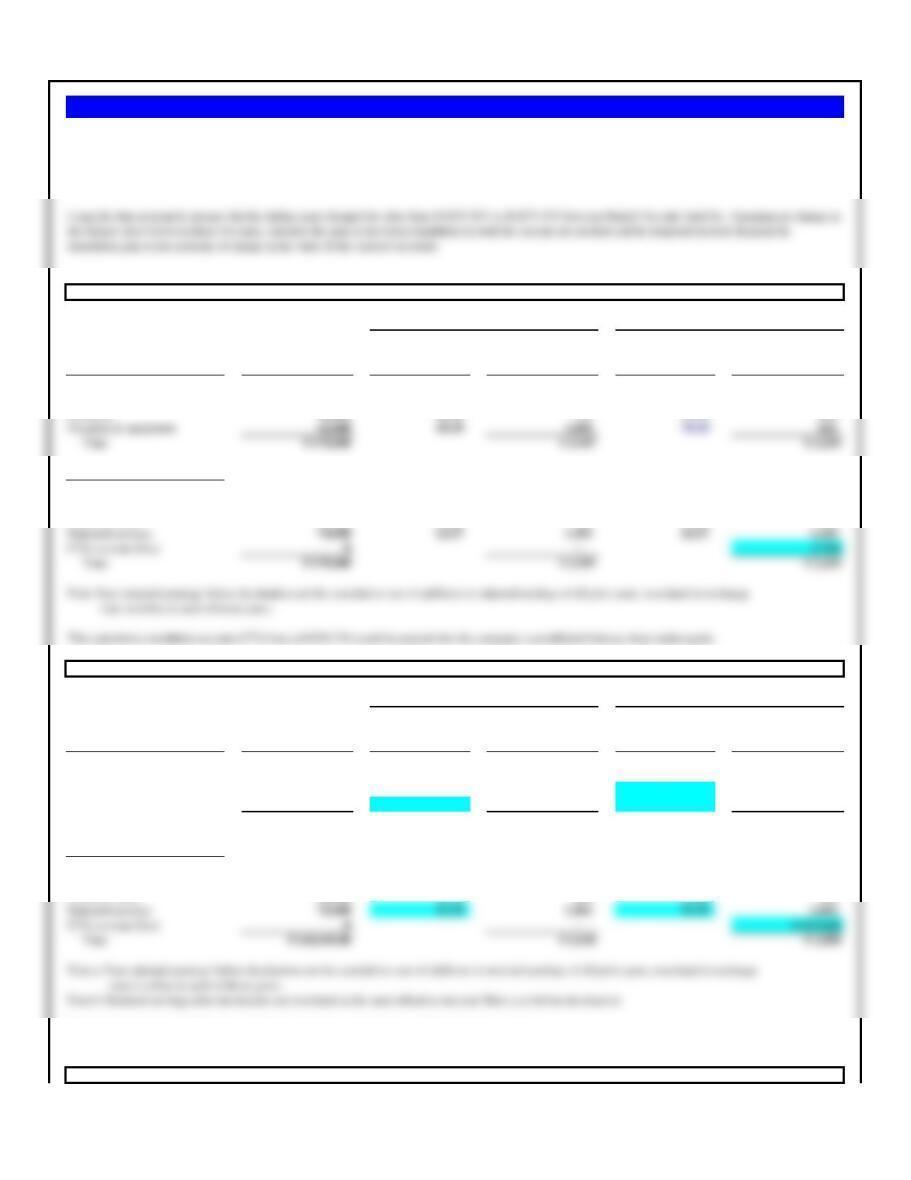
Problem 11.2 Aidan Turkey (B).
Using the facts outlined for Aidan Turkey, assume as in Problem 11.1 that the exchange rate on January 2, 2016, in Exhibit 11.4 dropped from
₺5.2000/€ to ₺5.5000/€ (rather than to ₺6.0000/€). Recalculate Aidan Turkey’s translated balance sheet for January 2, 2016, with the new exchange rate using the
temporal rate method.
December 31, 2015
January 2, 2016
Assets
In Turkish lira (₺)
Translated Accounts
(€)
Translated Accounts
(€)
(a) Euro retained earnings before depreciation are the cumulative sum of additions to retained earnings of all prior years, translated at the exchange rates in each year.
(b) Translated into euros at the same rate as before depreciation of the Turkish lira.
(c) Under the temporal method, the translation of €121,677 would be closed into retained earnings through the income statement rather than left as a separate item as
shown here. Ending retained earnings would actually be €11,826,438 – €121,677 = €11,704,761.
Under the temporal method, the translation of €121,677 would be closed into retained earnings through the income statement rather than left as a separate item as
shown here. Ending retained earnings would actually be €11,826,438 – €121,677 = €11,704,761
Exchange Rate Exchange Rate
(₺/€) (₺/€)
Cash 10,600,000 5.2 € 2,038,462 4.9 € 2,163,265
Accounts receivable 30,200,000 5.2 5,807,692 4.9 6,163,265
Inventory 20,400,000 5.2 3,923,077 4.9 4,163,265
Net plant and equipment 40,800,000 5.2 7,846,154 4.9 8,326,531
Total 102,000,000 19,615,385 20,816,326
Liabilities and Net Worth
Accounts payable 8,000,000 5.2 € 1,538,462 4.9 € 1,632,653
Short-term bank debt 10,600,000 5.2 2,038,462 4.9 2,163,265
Long-term debt 10,600,000 5.2 2,038,462 4.9 2,163,265
Common stock 10,800,000 5.276 2,047,005 5.276 2,047,005
Translation gain (loss) –-€ 29,918 € 887,062
Total 102,000,000 19,615,385 20,816,326
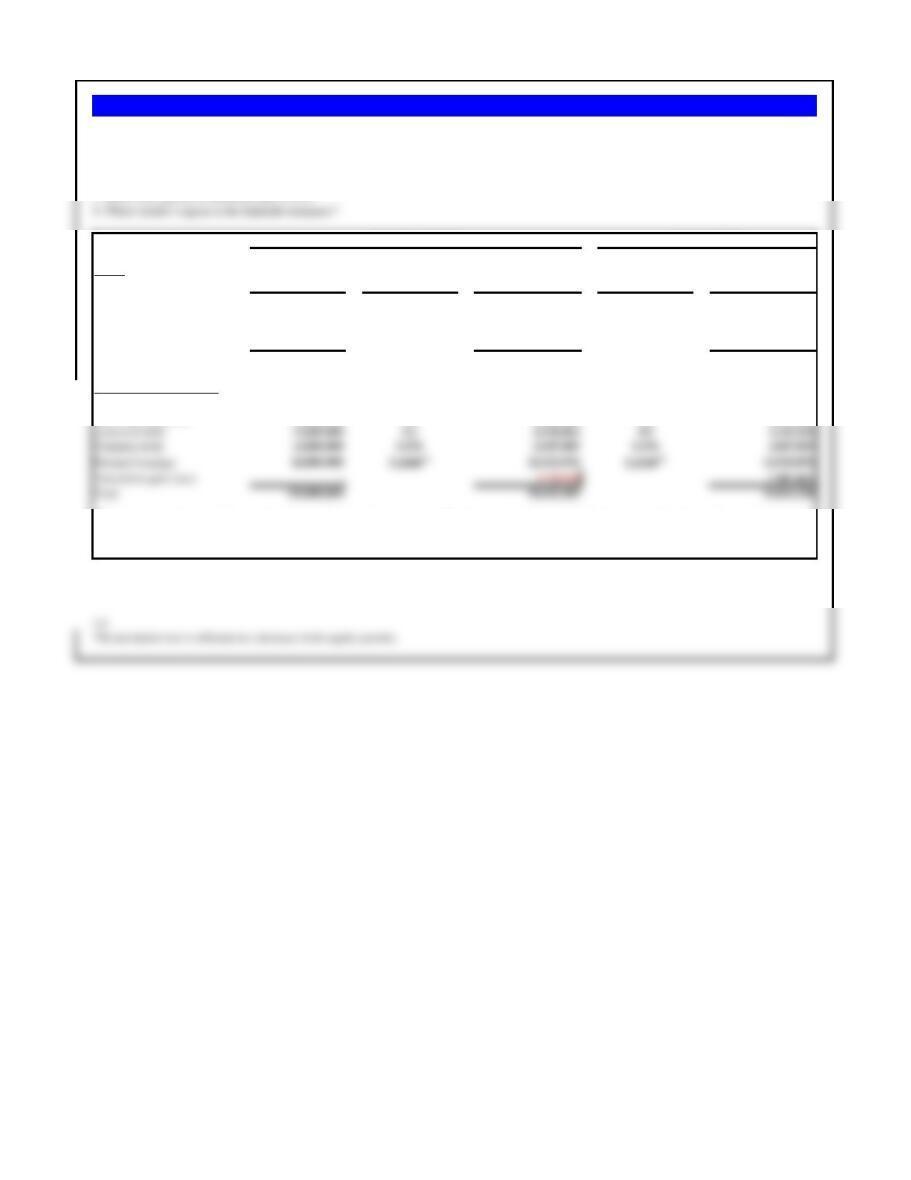
The translation gain is €887,062.
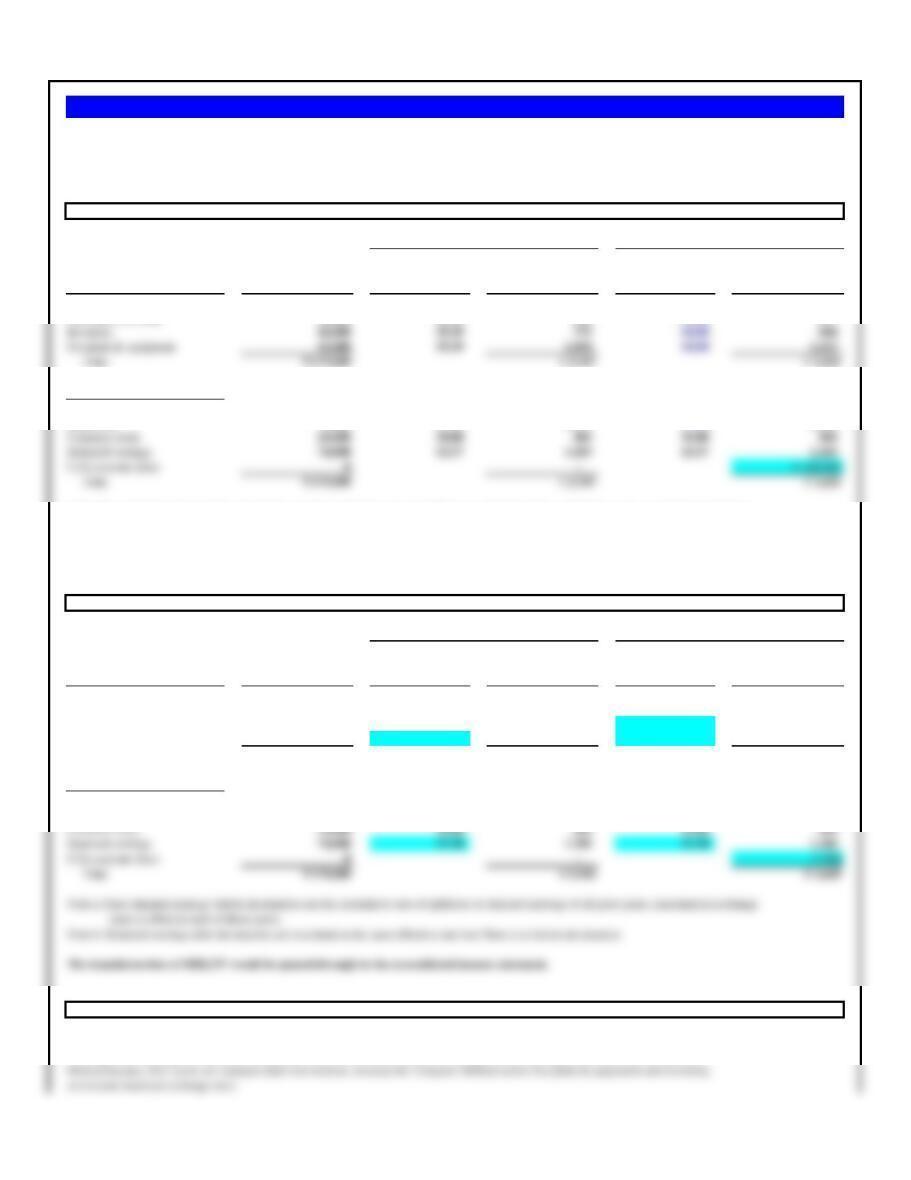
Problem 11.3 Aidan Turkey (C).
December 31, 2015
January 2, 2016
Translated Accounts
(€)
(a) Euro retained earnings before appreciation are the cumulative sum of additions to retained earnings of all prior years, translated at the exchange rates in
each year.
(b) Translated into euros at the same rate as before appreciation of the Turkish lira.
Using the facts outlined for Aidan Turkey, assume the exchange rate on January 2, 2016, in Exhibit 11.4 appreciated from ₺5.2000/€
to ₺4.9000/€. Calculate Aidan Turkey’s translated balance sheet for January 2, 2016, with the new exchange rate using the current rate method.
Assets
In Turkish lira (₺)
Translated Accounts
(€)
Exchange Rate Exchange Rate
(₺/€) (₺/€)
Cash 10,600,000 5.2 € 2,038,462 4.9 € 2,163,265
Accounts receivable 30,200,000 5.2 5,807,692 4.9 6,163,265
Liabilities and Net Worth
Accounts payable 8,000,000 5.2 € 1,538,462 4.9 € 1,632,653
Short-term bank debt 10,600,000 5.2 2,038,462 4.9 2,163,265
Long-term debt 10,600,000 5.2 2,038,462 4.9 2,163,265
Common stock 10,800,000 5.276 2,047,005 5.276 2,047,005
(b)
Problem 11.4 Aidan Turkey (D).
Using the facts outlined for Aidan Turkey, assume that the exchange rate on January 2, 2016, in Exhibit 11.4 appreciated from
₺5.2000/€ to ₺4.9000/€. Calculate Aidan Turkey’s translated balance sheet for January 2, 2016, with the new exchange rate using the temporal method.
January 2, 2016
December 31, 2015
(b) Translated into euros at the same rate as before appreciation of the Turkish lira.
(c) Under the temporal method, the translation of €136,579 would be closed into retained earnings through the income statement rather than left as a separate item as
shown here. Ending retained earnings would actually be €11,826,438 + €136,579 = €11,963,017.
Translated Accounts
(€)
Translated Accounts (€)
(a) Euro retained earnings before appreciation are the cumulative sum of additions to retained earnings of all prior years, translated at the exchange rates in each year.
Assets
In Turkish lira (₺)
Balance Sheet (thousands of pesos Uruguayo, $U) Exchange Rate
Assets January 1st ($U/US$)
Cash 60,000 20.00
Accounts receivable 120,000 20.00
540,000
Liabilities & Net Worth
Current liabilities 30,000 20.00
Long-term debt 90,000 20.00
b) Translation
January 1st
$U/US$
Calculation of Accounting Exposures: $U (000s) 20.00
Exposed assets (all assets) 540,000 27,000$
Problem 11.5 Tristan Narvaja, S.A. (A)
Tristan Narvaja, S.A., is the Uruguayan subsidiary of a U.S. manufacturing company. Its balance sheet for
January 1 follows. The January 1st exchange rate between the U.S. dollar and the peso Uruguayo ($U) is
$U20/$.
Determine Tristan Narvaja’s contribution to the translation exposure of its parent on January 1, using the
current rate method.
Balance Sheet (thousands of pesos Uruguayo, $U) Exchange Rate
Assets January 1st ($U/US$)
Cash 60,000 20.00
540,000
Liabilities & Net Worth
January 1st
$U/US$
Calculation of Accounting Exposures: $U (000s) 20.00
Problem 11.6 Tristan Narvaja, S.A. (B)
Calculate Tristan Narvaja’s contribution to its parent’s translation loss if the exchange rate on December
31st is $U22/$. Assume all peso accounts remain as they were at the beginning of the year.
Balance Sheet (thousands of pesos Uruguayo, $U) Exchange Rate
Assets January 1st ($U/US$)
Cash 60,000 20.00
Liabilities & Net Worth
Current liabilities 30,000 20.00
January 1st
$U/US$
Calculation of Accounting Exposures: $U (000s) 20.00
Problem 11.7 Tristan Narvaja, S.A. (C)
Calculate Tristan Narvaja’s contribution to its parent’s translation gain or loss using the current rate method
if the exchange rate on December 31 is $U12/$. Assume all peso accounts remain as they were at the
beginning of the year.
Balance Sheet (thousands) Translated Translated
Indian Rupee Exchange Rate Accounts Exchange Rate Accounts
Assets Statement
(INR/€) Euros (INR/€) Euros
Cash ₹ 26,000 59.39 € 438 79.19 € 328
Accounts receivable 38,000 59.39 640 79.19 480
Liabilities & Net Worth
Accounts payable ₹ 11,000 59.39 € 185 79.19 € 139
Bank loans 70,000 59.39 1,179 79.19 884
Common stock 20,000 50.00 400 50.00 400
Balance Sheet (thousands) Translated Translated
Thai baht Exchange Rate Accounts Exchange Rate Accounts
Assets Statement
(INR/€) Euros (INR/€) Euros
Cash ₹ 24,000.00 59.39 € 404 79.19 € 303
Accounts receivable 36,000 59.39 606 79.19 455
Inventory 48,000 59.39 808 30.00 1,600
Net plant & equipment 60,000 50.00 1,200 50.00 1,200
Total ₹ 168,000.00 € 3,018 € 3,558
Liabilities & Net Worth
Accounts payable ₹ 18,000.00 59.39 € 303 79.19 € 227
Bank loans 60,000 59.39 1,010 79.19 758
The translation gain of €810,644 would be passed-through to the consolidated income statement.
TRANSLATION BY THE TEMPORAL METHOD
Before Devaluation
After Devaluation
EXPLANATION OF DIFFERENT OUTCOME BY TRANSLATION METHODOLOGY
Problem 11.8 Nataja Mumbai Ltd. (A)
Nataja Mumbai Ltd., the Indian subsidiary of a Belgian corporation, is a cardiothoracic instruments manufacturer. Nataja manufactures the instruments primarily
for the medical industry globally—though with recent advances in cardiovascular surgery, its business has begun to grow rapidly. Sales are primarily to hospitals
based on Europe and Asia. Nataja Mumbai’s balance sheet in thousands of Indian Rupees (INR) as of March 31 is as follows:
TRANSLATION BY THE CURRENT RATE METHOD
Before Devaluation
After Devaluation

The Temporal Method results in a translation gain, as opposed to the CTA loss found under the Current Rate Method, because of the different
exchange rates used against Net plant & equipment and the inventory line items. This gain would be impossible under the Current Rate
Balance Sheet (thousands) Translated Translated
Indian Rupee Exchange Rate Accounts Exchange Rate Accounts
Assets Statement
(INR/€) Euros (INR/€) Euros
Cash ₹ 26,000 59.39 € 438 54.50 € 477
Liabilities & Net Worth
Accounts payable ₹ 11,000 59.39 € 185 54.50 € 202
Note: Euro retained earnings before devaluation are the cumulative sum of additions to retained earnings of all prior years, translated at exchange
rates in effect in each of those years.
This cumulative translation account (CTA) gain of €142,013 would be entered into the company’s consolidated balance sheet under equity.
Balance Sheet (thousands) Translated Translated
Indian Rupee Exchange Rate Accounts Exchange Rate Accounts
Assets Statement
(INR/€) Euros (INR/€) Euros
Cash ₹ 26,000 59.39 € 438 25.00 € 1,040
Accounts receivable 38,000 59.39 640 25.00 1,520
Inventory 46,000 59.39 775 59.39 775
Net plant & equipment 65,000 50.00 1,300 50.00 1,300
Total ₹ 175,000 € 3,152 € 4,635
Liabilities & Net Worth
Accounts payable ₹ 11,000 59.39 € 185 25.00 € 440
Bank loans 70,000 59.39 1,179 25.00 2,800
The Temporal Method results in a translation gain, as opposed to the CTA loss found under the Current Rate Method, because of the different
exchange rates used against Net plant & equipment and the inventory line items. This gain would be impossible under the Current Rate
Before Devaluation
After Devaluation
EXPLANATION OF DIFFERENT OUTCOME BY TRANSLATION METHODOLOGY
Problem 11.9 Nataja Mumbai Ltd. (B)
Using the original data provided for Nataja Mumbai, assume that the Indian rupee appreciated in value from INR59.39/€ to INR54.50/€ between March 31 and
April 1. Assuming no change in balance sheet accounts between those two days, calculate the gain or loss from translation by both the current rate method and the
temporal method. Explain the translation gain or loss in terms of changes in the value of the exposed accounts.
TRANSLATION BY THE CURRENT RATE METHOD
Before Devaluation
After Devaluation
TRANSLATION BY THE TEMPORAL METHOD

Balance Sheet of Cairo Ingot, Ltd. Translated Translated
Egyptian pounds Exchange Rate Accounts Exchange Rate Accounts
Assets Statement
(Egyptian £/UK£)British pounds (Egyptian £/UK£)British pounds
Cash 16,500,000 5.50 £3,000,000.00 6.00 £2,750,000.00
Accounts receivable 33,000,000 5.50 6,000,000 6.00 5,500,000
Liabilities & Net Worth
Accounts payable 24,750,000 5.50 £4,500,000.00 6.00 £4,125,000.00
December 31st End of Quarter
a. Calculation of Actg Exposures: Egyptian pounds 5.50 6.00
Exposed assets (all assets) 165,000,000 £30,000,000.00 £27,500,000.00
Less exposed liabilities (c.liabs + lt debt) (74,250,000) (13,500,000) (12,375,000)
Net exposure 90,750,000 £16,500,000.00 £15,125,000.00
b. Change in translation exposure: Gain (Loss) -£1,375,000.00
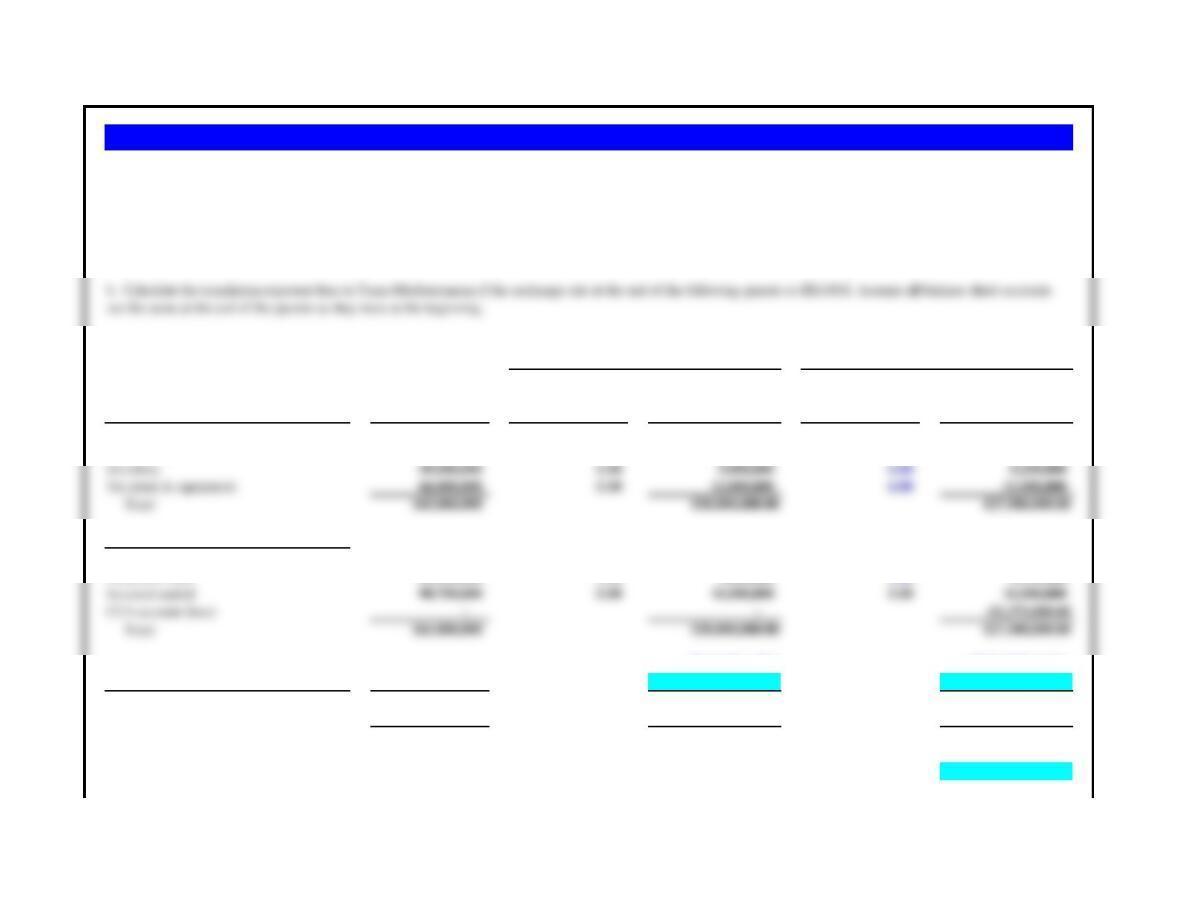
Problem 11.10 Cairo Ingot, Ltd.
Before Exchange Rate Change
After Exchange Rate Change
Cairo Ingot, Ltd., is the Egyptian subsidiary of TransMediterranean Aluminum, a British multinational that fashions automobile engine blocks from aluminum. Trans-
Mediterranean’s home reporting currency is the British pound. Cairo Ingot’s December 31st balance sheet is shown below. At the date of this balance sheet the exchange
rate between Egyptian pounds and British pounds sterling was £E5.50/UK£.
a. What is Cairo Ingot’s contribution to the translation exposure of Trans-Mediterranean on December 31st, using the current rate method?