1 Trade in the Global Economy
Notes to Instructor
Chapter 1 provides a good overview of international trade as well as a summary of what
is covered in each of the chapters in the International Trade textbook.
The goal of the study of international trade is to come to an understanding of the forces
that determine trade among nations. Why do nations trade in goods and services, and
Chapter Summary
This chapter begins by asking why we should even care about international trade. It
answers the question by suggesting that trade opens up new possibilities and
We learn in this chapter that a substantial portion of the world trade in goods and services
occurs between the industrial countries. This interdependence among the industrial
Comments
This chapter serves as a good introduction to the international trade section of the
textbook. However, you may choose to skip over this first chapter because Chapter 2 is
written as a secondary introduction, with an example that is reexamined in later chapters.
Lecture Notes
Introduction
If we only consider merchandise goods, then the largest exporter in 2009 was China with
$1.3 trillion. In second and third place were Germany ($1.17 trillion) and the United
Countries engage in trade for many reasons. In Chapters 2 through 11, we find that
nations benefit from international trade when there are differences in opportunity costs
between trading partners. We examine the winners and losers of international trade when
1 International Trade
The Basics of World Trade The difference between a country’s total value of exports
In the first half of the textbook, we assume that each country maintains a balanced trade.
For example, the United States’ bilateral trade balance with China from 2005 to the
present has been more than $200 billion per year. But, this is a misleading number as the
value added of the final product exported by China is often significantly smaller.
H E A D L I N E S
What we often call “Made in China” may not be made in China at all, but rather only
assembled in China. The parts may have been made in countries all over the globe. Our
trade balance with China does not reflect this and even exaggerates the size of the U.S.
trade deficit with China.
Consider the iPhone that is entirely owned and developed by a U.S. company. When the
APPLICATION
Is Trade Today Different Than in the Past?
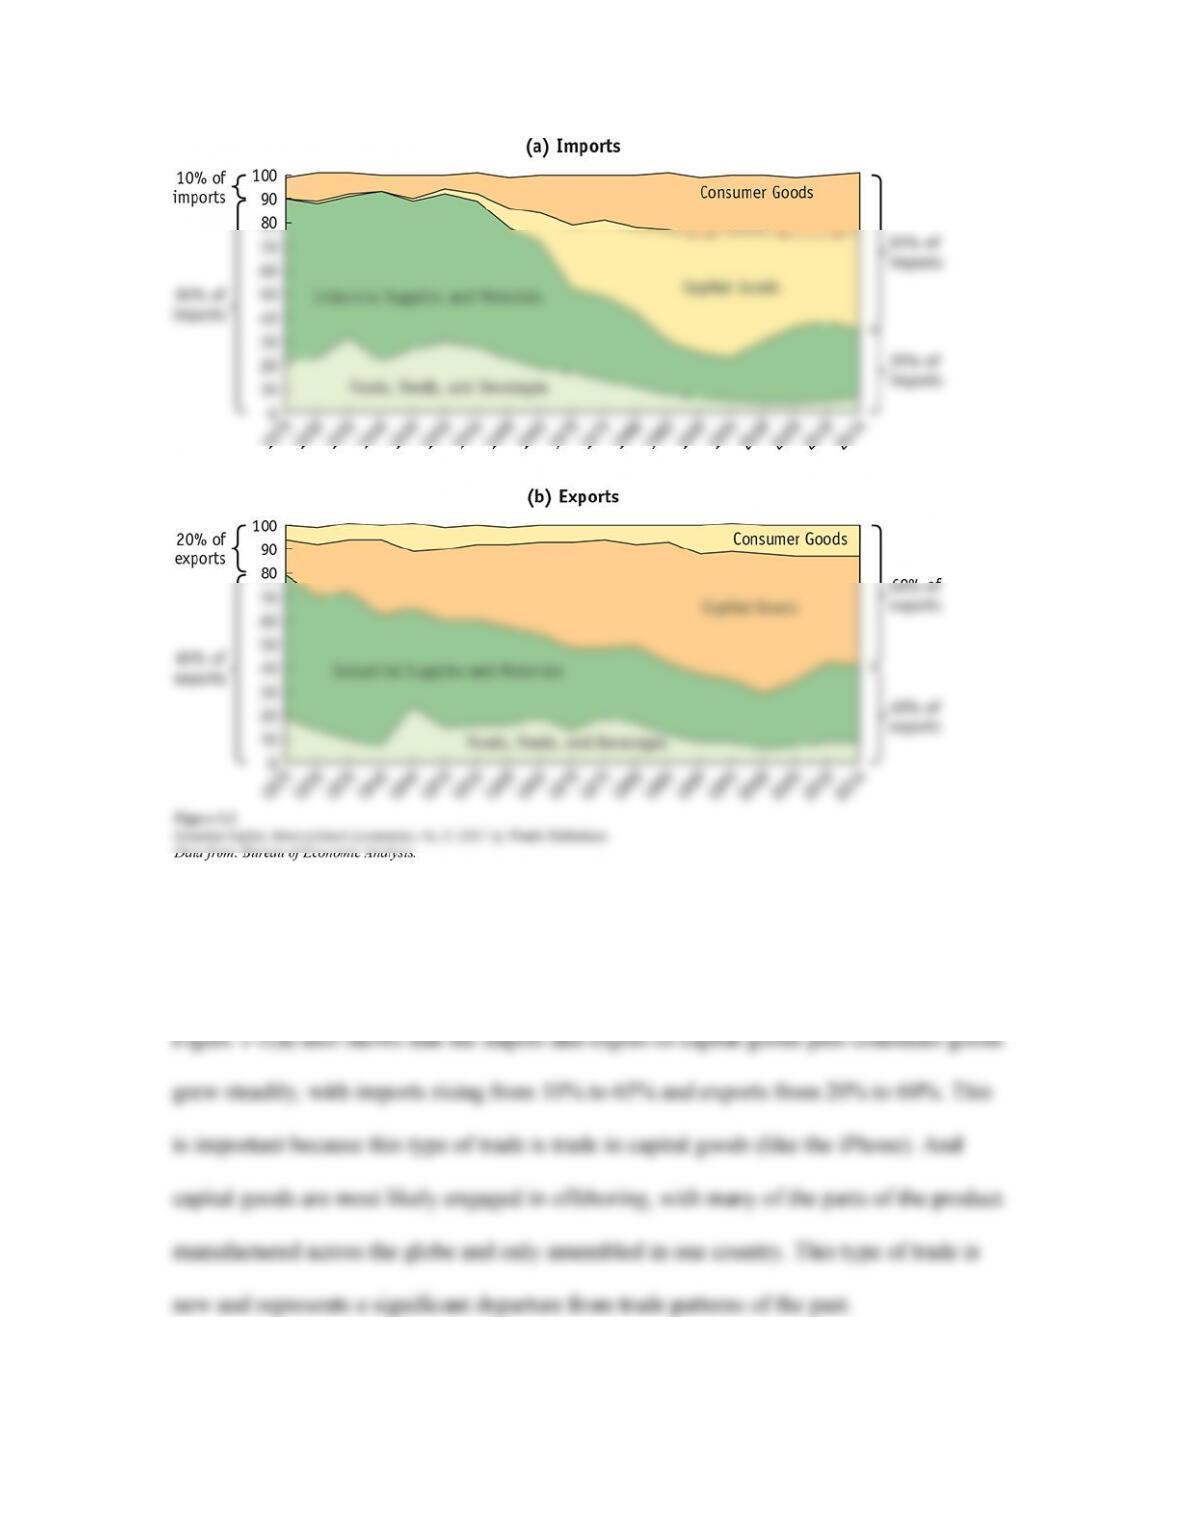
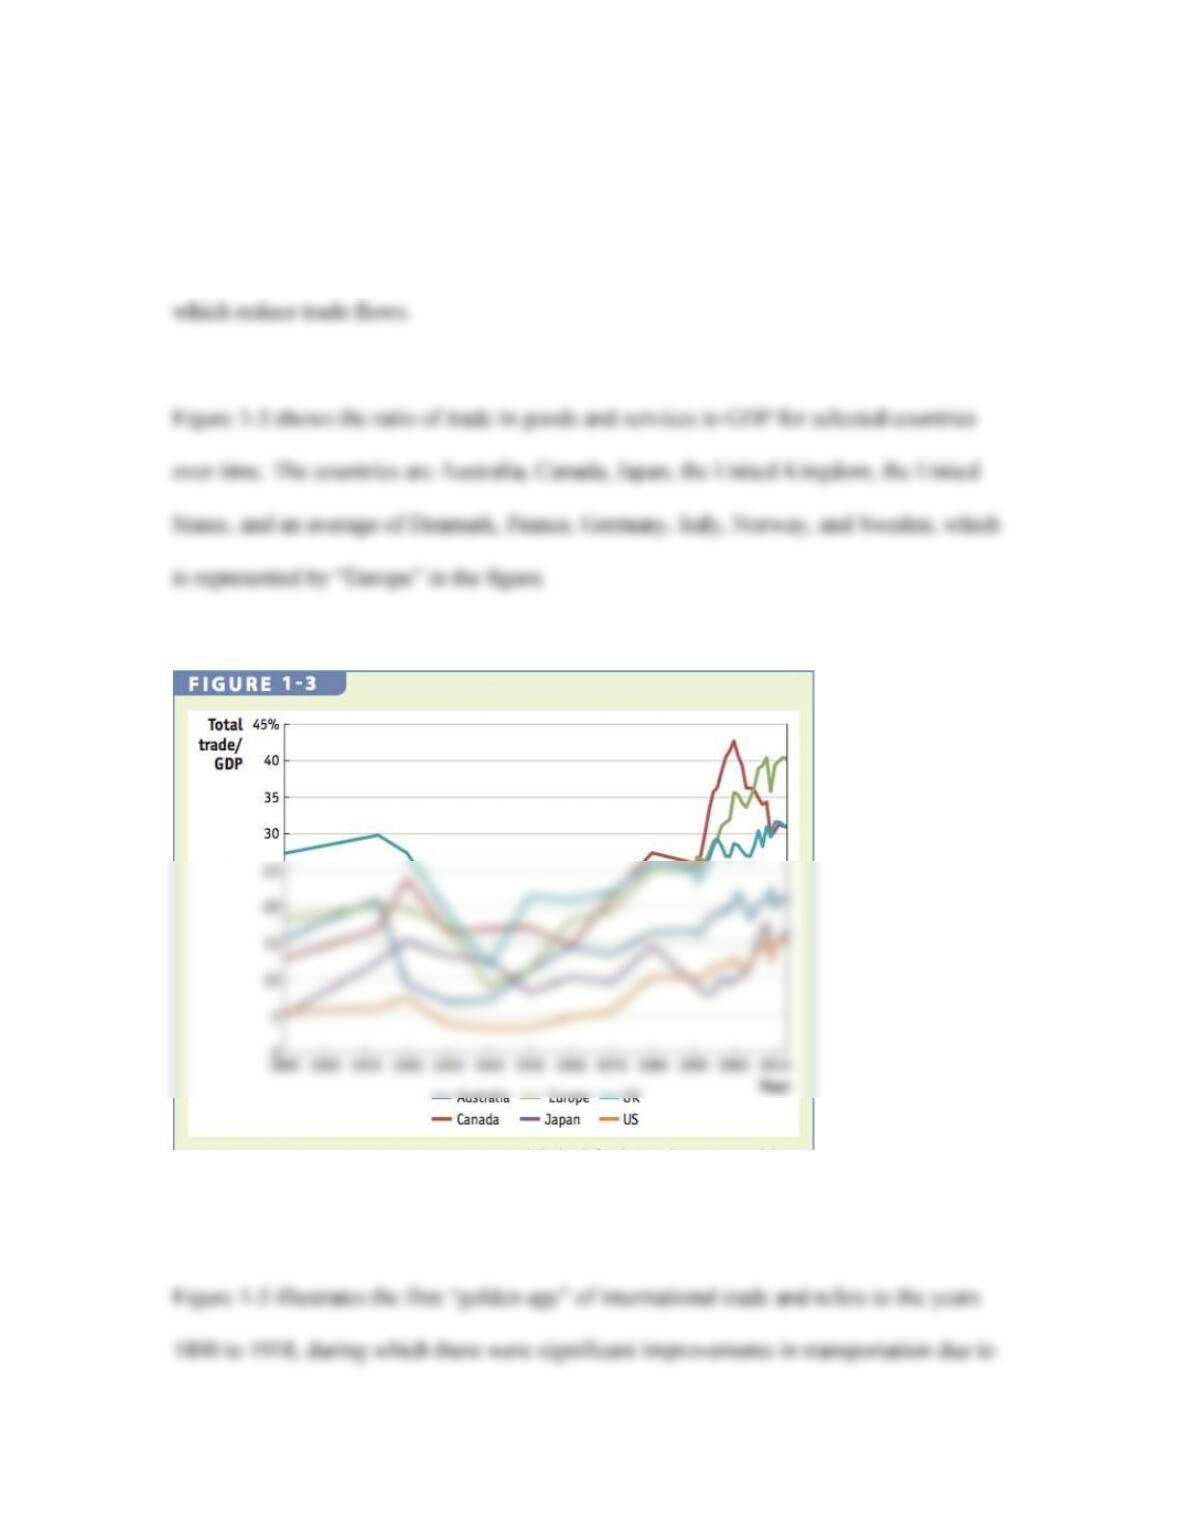
Both the volume and composition of international trade have changed greatly over the
past century. The change in the composition of trade can be made evident by dividing
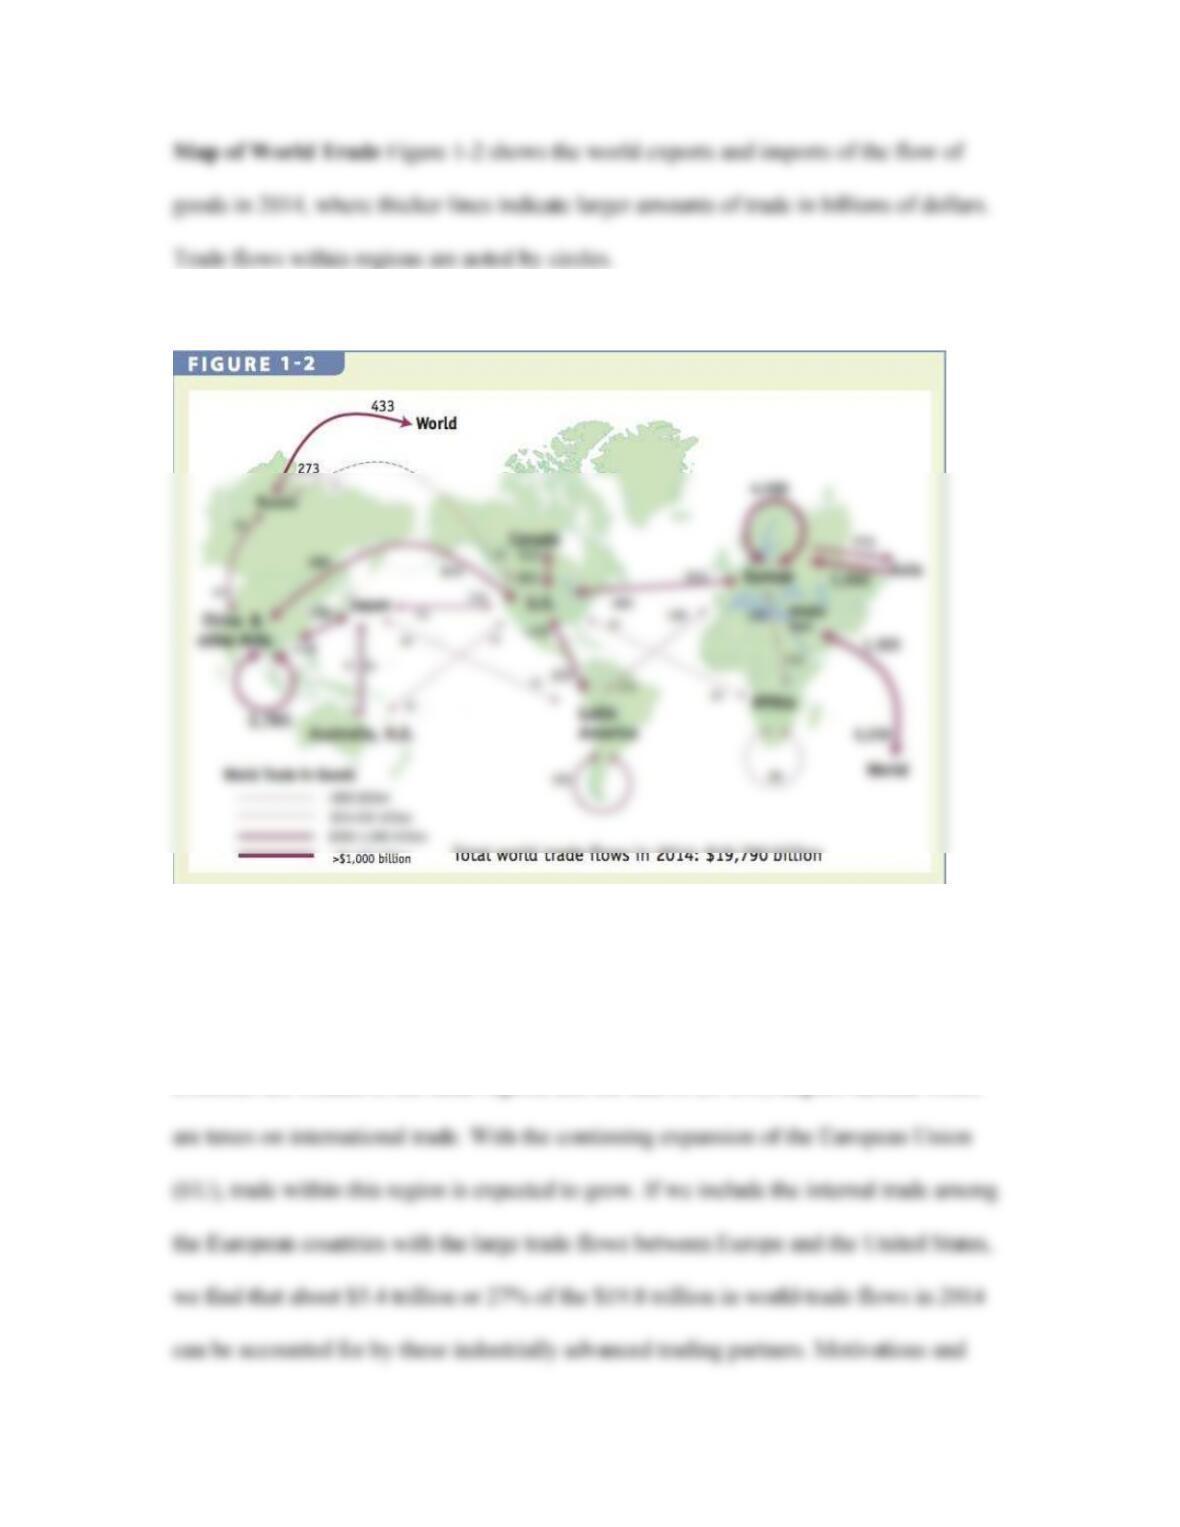
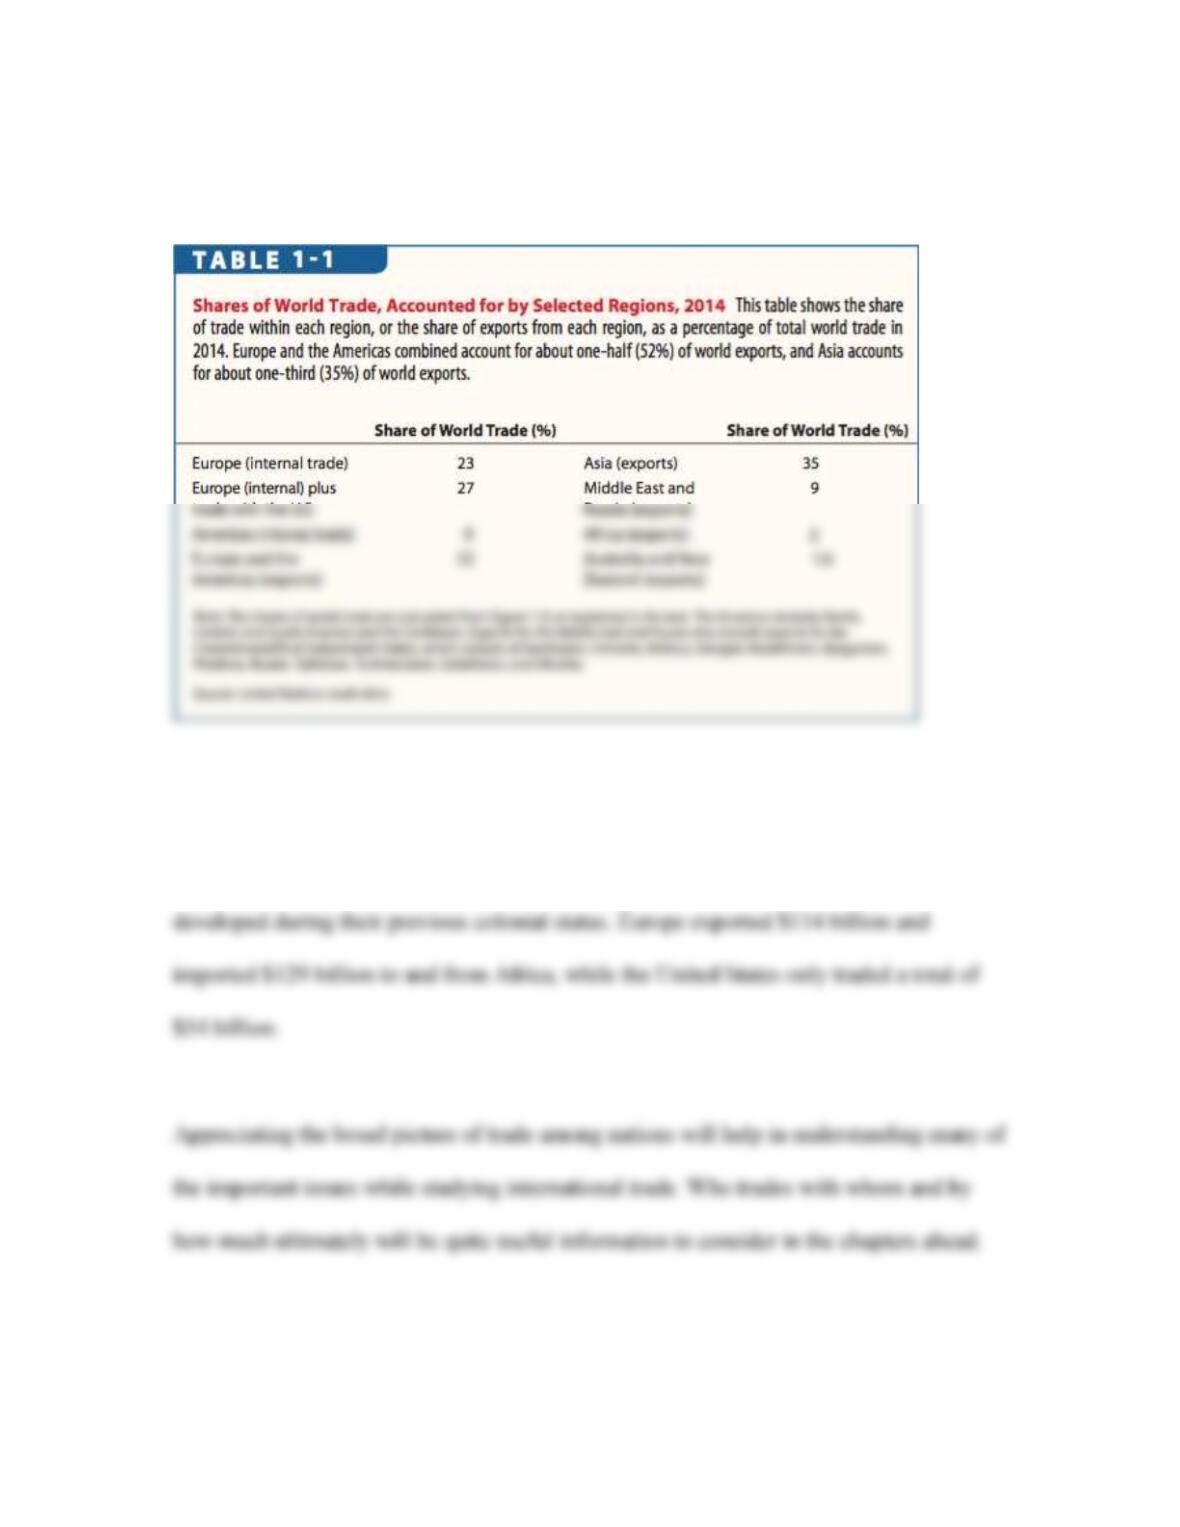
European and U.S. Trade Nearly a quarter of world trade occurred within Europe in
2014 with $4.6 trillion. Reasons for these large trade flows include proximity (many
countries are located in the same region) and the lack of (or low) import tariffs, which
models that explain why countries with similar technological capabilities and
consumption patterns may gain from trade will be discussed in Chapters 2 through 4.
Trade in the Americas Total trade in goods between North, Central, and South America
and the Caribbean accounts for $1.8 trillion or 9% of the world–trade flows in 2014, with
Trade with Asia The amount of trade that occurs between Europe and Asia and the
United States and Asia is also considerable. For example, in 2014, exports from Asia to
The Heckscher‒Ohlin trade model will help us to understand why Asia trades so much.
Reasons for trade that is based on the amounts of the factors of production, land labor and
capital, are best explained using this model. For example, trade might occur due to lower
wages in developing countries or the lower the cost of production, both of which allow
them to produce competitive products in the global market.
Other Regions The oil exported by countries in the Middle East, along with Russia’s
export of oil and natural gas, contributes 9% to world trade, as shown in Table 1-1.
Although half of Russia’s exports and imports are to Europe, only a small amount of
Australia, and other countries.
The African countries’ share of world trade in 2014 amounted to some 2%, with their
closest ties to Europe. This reflects their proximity to Europe as well as the relationships
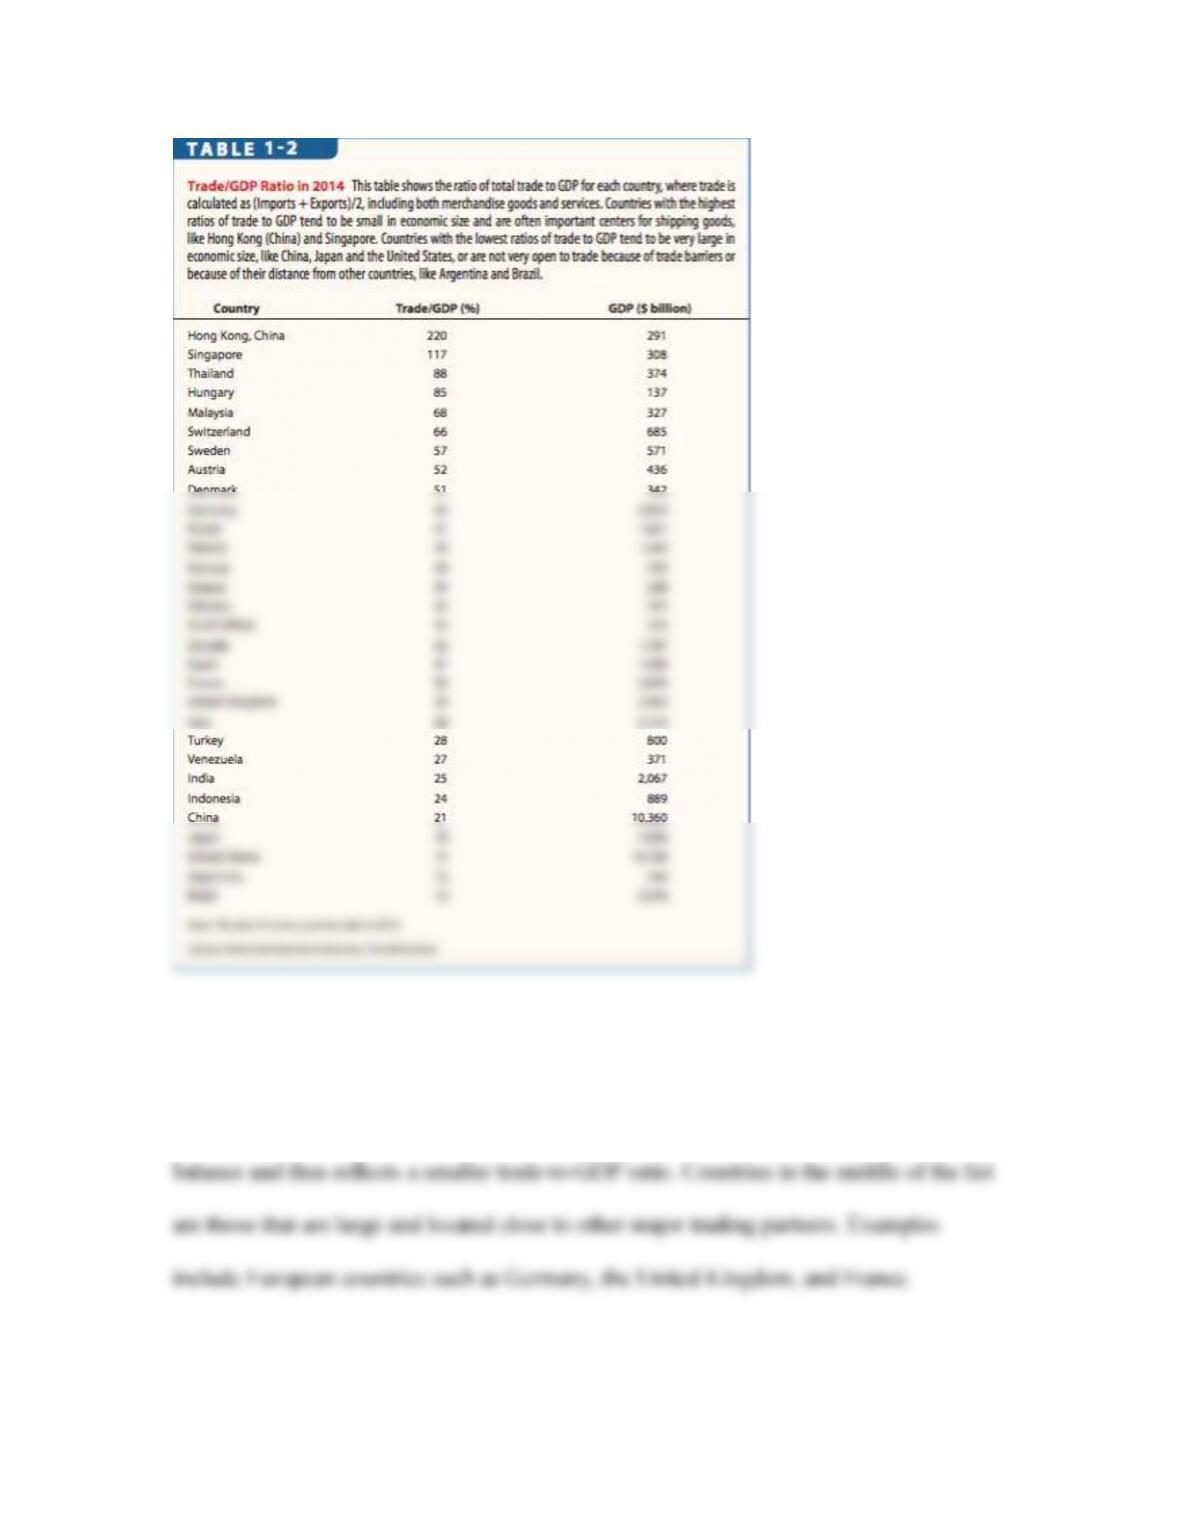
Trade Compared with Gross Domestic Product Table 1-2 shows the ratio of trade to a
country’s gross domestic product (GDP). Relative to its economic size, trade is a
smaller portion of GDP for the United States (15% in 2014) than for countries such as
Hong Kong (220% in 2014). The high trade-to-GDP ratio for Hong Kong is due to the
In contrast, large countries such as the United States tend to experience more trade within
their borders (i.e., among states) than across borders, and this is not added to their trade
Barriers to Trade There are other reasons why the trade/GDP ratio differs across
countries. Other factors that influence trade include trade barriers such as import tariffs,
transportation costs, customs, laws, events such as wars, or even natural disasters—all of
First “Golden Age” of Trade