Reserve Supplemental Exercises Chapter 9 Problem 4
An inspector of flow metering devices used to administer fluid intravenously will perform a
hypothesis test to determine whether the mean flow rate is different from the flow rate setting of
203 milliliters per hour. Based on prior information, the standard deviation of the flow rate is
assumed to be known and equal to 11 milliliters per hour. Suppose that the experimenter had
believed that
13
=
. For each of the following sample sizes and a fixed
0.05
=
, find the
probability of a type II error if the true mean is 206 millileters per hour.
(a)
20:n=
=
(b)
50:n=
=
(c)
100:n=
=
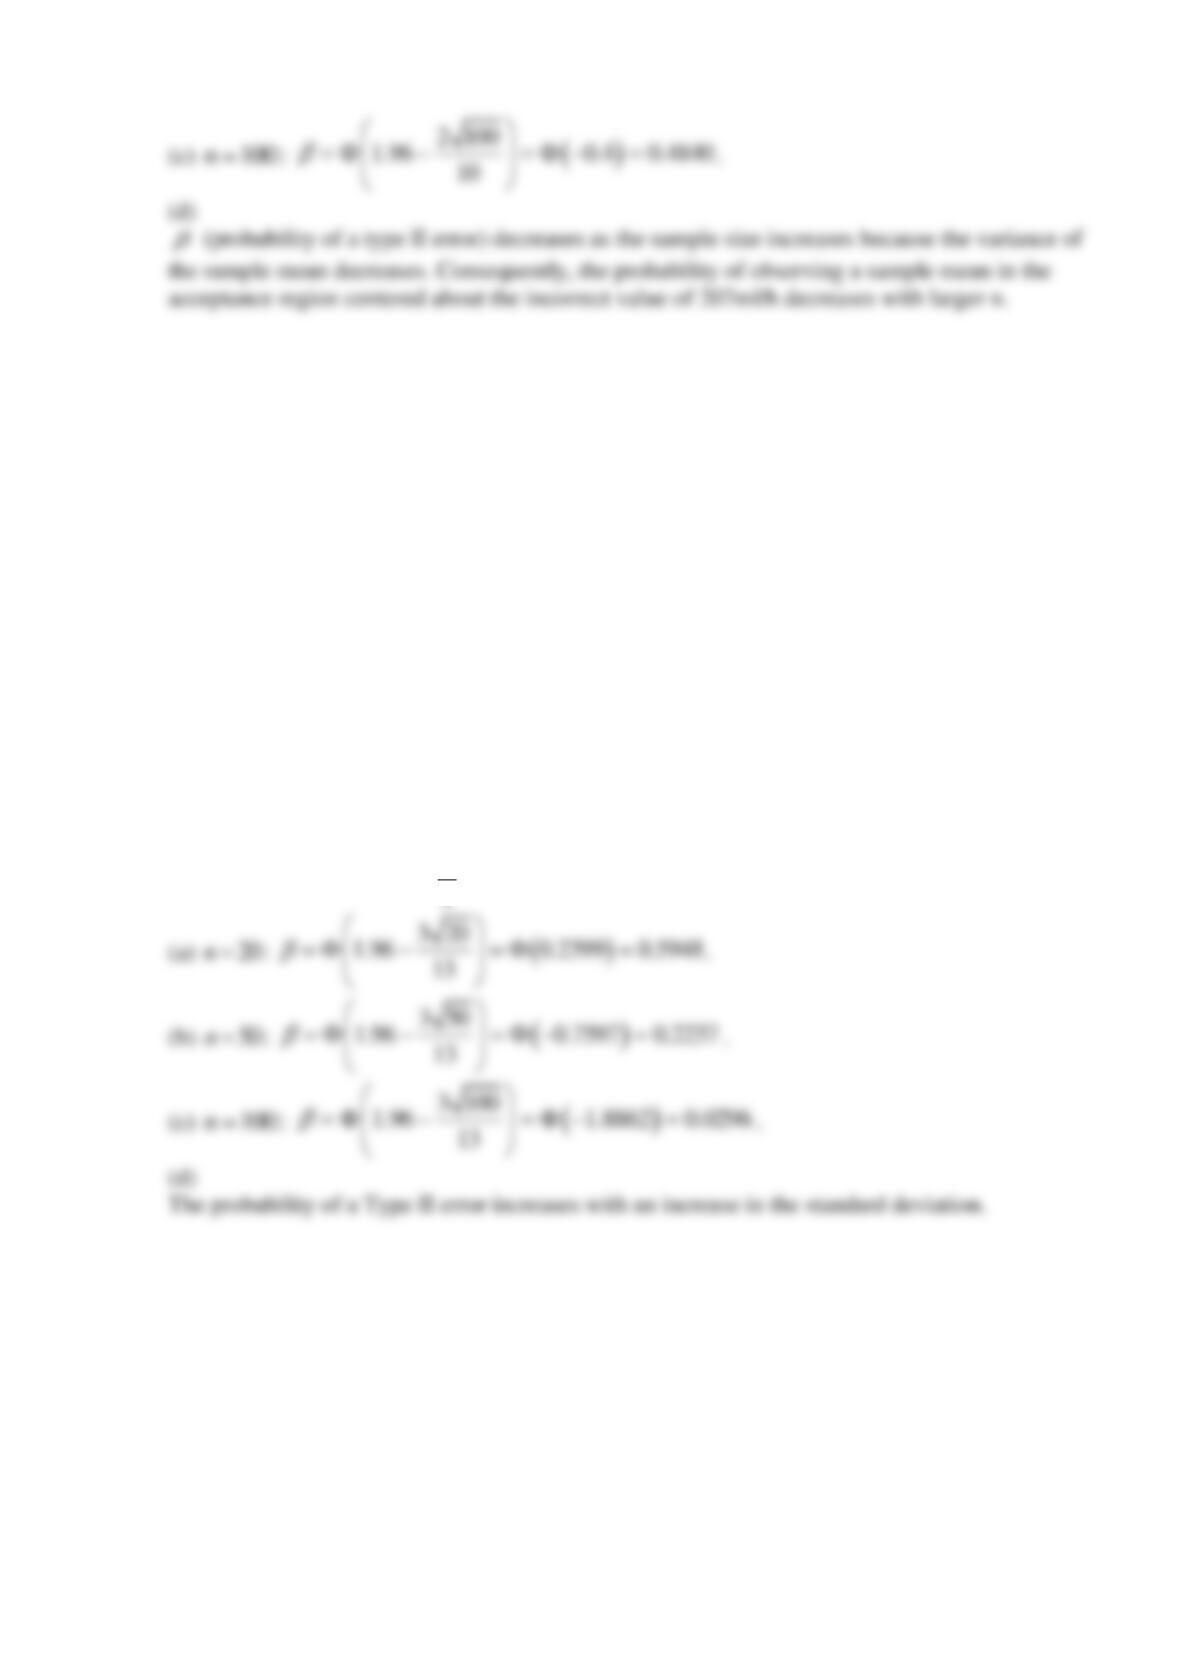
(d) Does the probability of a type II error increase or decrease with the increase in standard
deviation?
SOLUTION
13
=
,
0.025
206 203 3, 0.025, 1.96
2z
= − = = =
20:n=
50:n=
100:n=
Reserve Supplemental Exercises Chapter 9 Problem 5
The marketers of shampoo products know that customers like their product to have a lot of foam.
A manufacturer of shampoo claims that the foam height of its product exceeds 202 millimeters.
It is known from prior experience that the standard deviation of foam height is 10millimeters.
For each of the following sample sizes and with a fixed
0.05
=
, find the power of the test if the
true mean is 205 millimeters.
(a)
20:n=
power =
100:n=
(b)
50:n=
power =
(c)
100:n=
power =
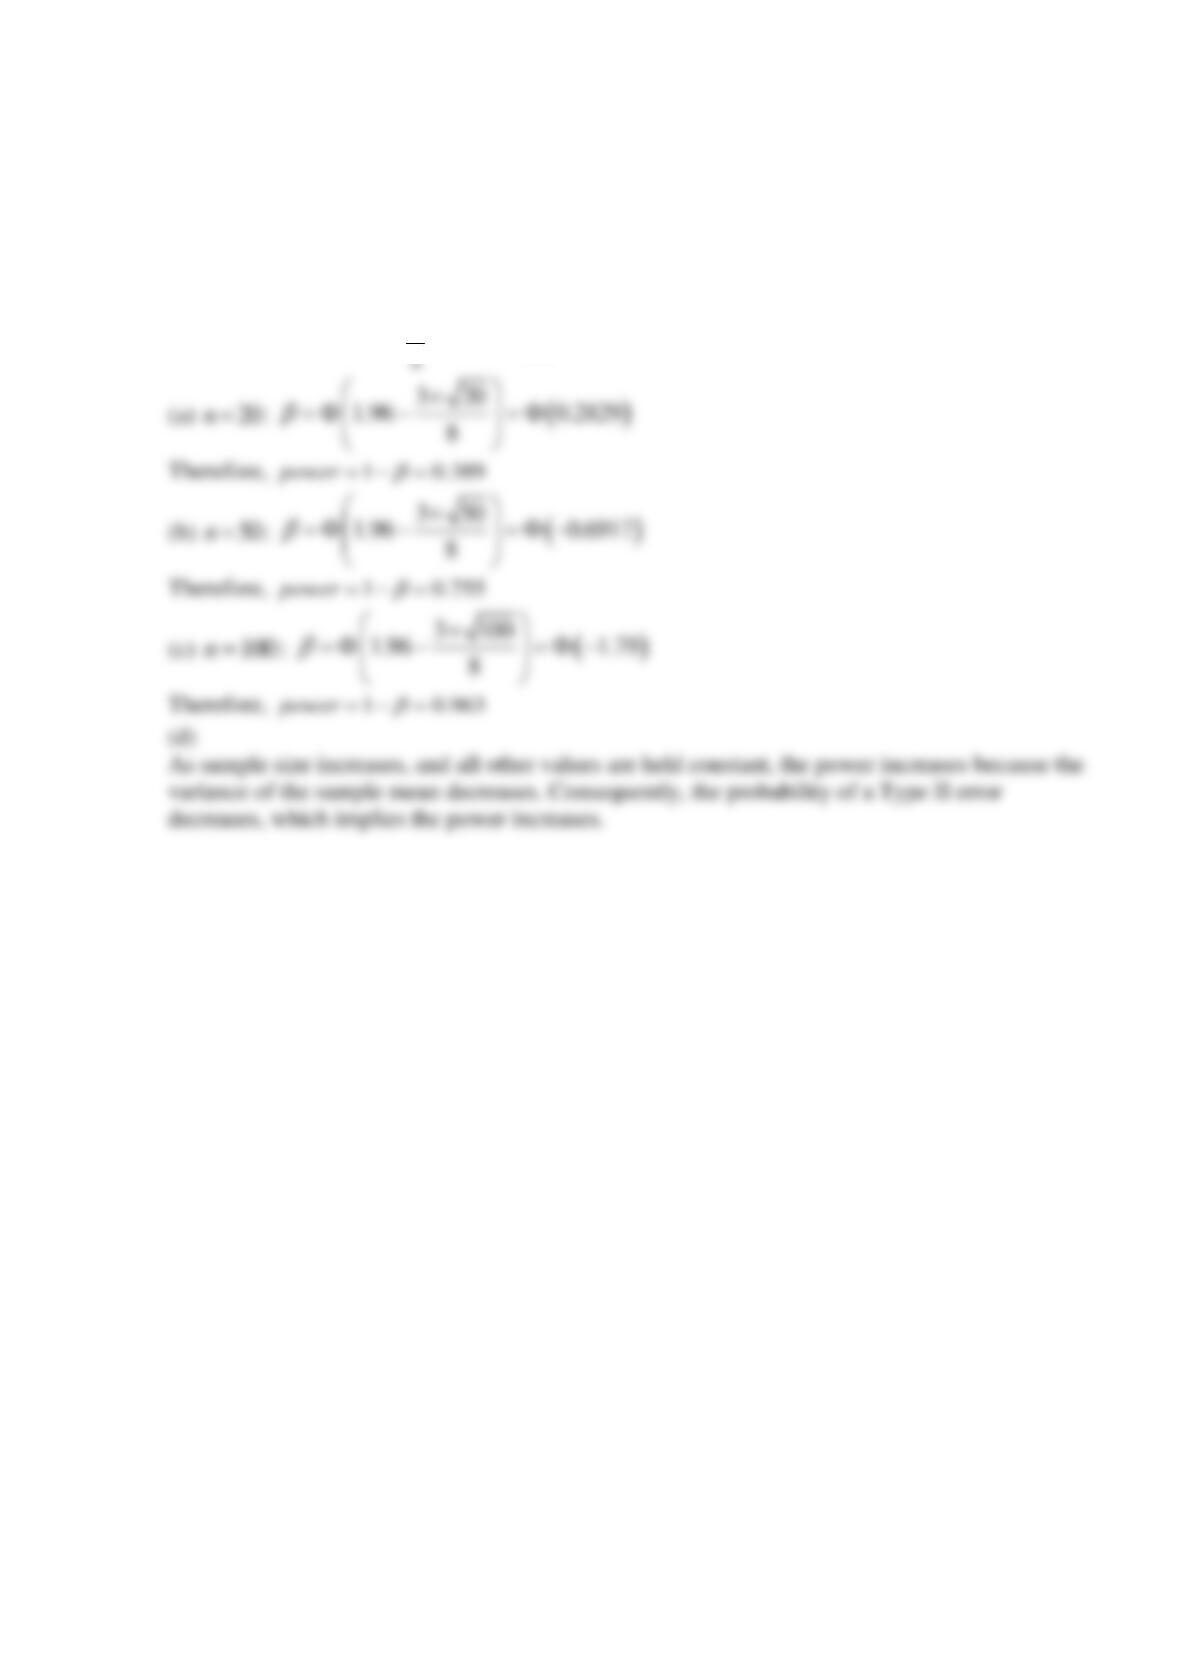
(d) Does the power of the test increase or decrease as the sample size increases? Explain your
answer.
SOLUTION
0.025
8, 204 201 3, 0.025, 1.96
= = − = = =
Reserve Supplemental Exercises Chapter 9 Problem 6
The mean pull-off force of an adhesive used in manufacturing a connector for an automotive
engine application should be at least 75 pounds. This adhesive will be used unless there is strong
evidence that the pull-off force does not meet this requirement. A test of an appropriate
hypothesis is to be conducted with sample size
10n=
and
0.05
=
. Assume that the pull-off
force is normally distributed, and
is not known.
(a) If the true standard deviation is
1
=
, what is the risk that the adhesive will be judged
acceptable when the true mean pull-off force is only 71 pounds? Only 70 pounds?
(b) What sample size is required to give a 90% chance of detecting that the true mean is only 73
pounds when
1
=
?
(c) If the true standard deviation is
2
=
, what is the risk that the adhesive will be judged
acceptable when the true mean pull-off force is only 73 pounds? Only 72 pounds? What sample
size is required to give a 95% chance of detecting that the true mean is only 73 pounds when
2
=
?
(d) How much impact does increasing the value of
have on the answers you obtain?
SOLUTION
20:n=
50:n=
100:n=
(a)
071 75 44
1
d
−−
= = = = =
1
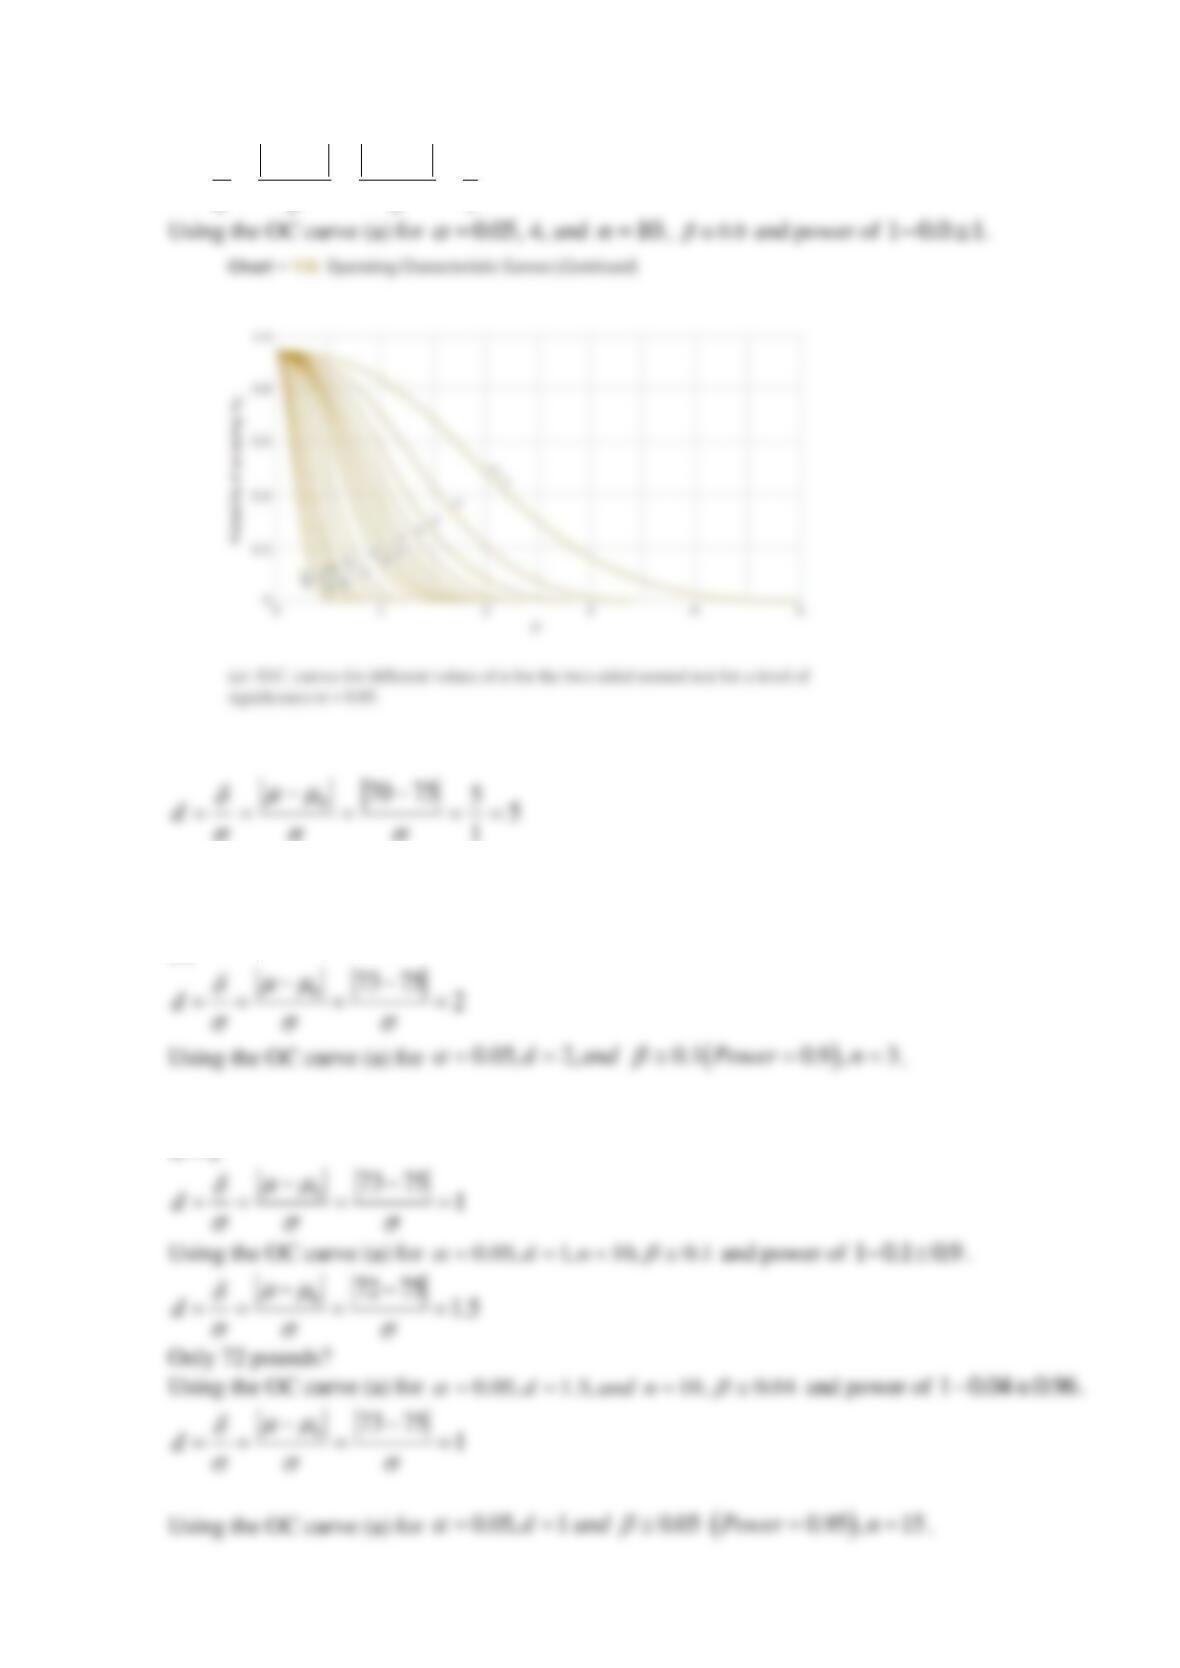
Only 72 pounds?
Using the OC curve (a) for
0.05, 5, and 10, 0.0dn
= = =
and power of
1 0.0 1−
.
(b)
(c)
1 0.0 1−
Reserve Supplemental Exercises Chapter 9 Problem 7
Consider the 40 observations collected on the number of nonconforming coil springs in
production batches of size 50 given in the following table.
9
12
6
9
7
14
12
4
6
7
8
5
9
7
8
11
3
6
7
7
11
4
4
8
7
5
6
4
5
8
19
19
18
12
11
17
15
17
13
13
(a) Based on the description of the random variable and these 40 observations, is a binomial
distribution an appropriate model? Perform a goodness-of-fit procedure at
0.05
=
. Let the
expected frequencies be at least three.
(b) Calculate the P-value for this test.
SOLUTION
(a)
0
3
3
2
1
1
0
2
1
2
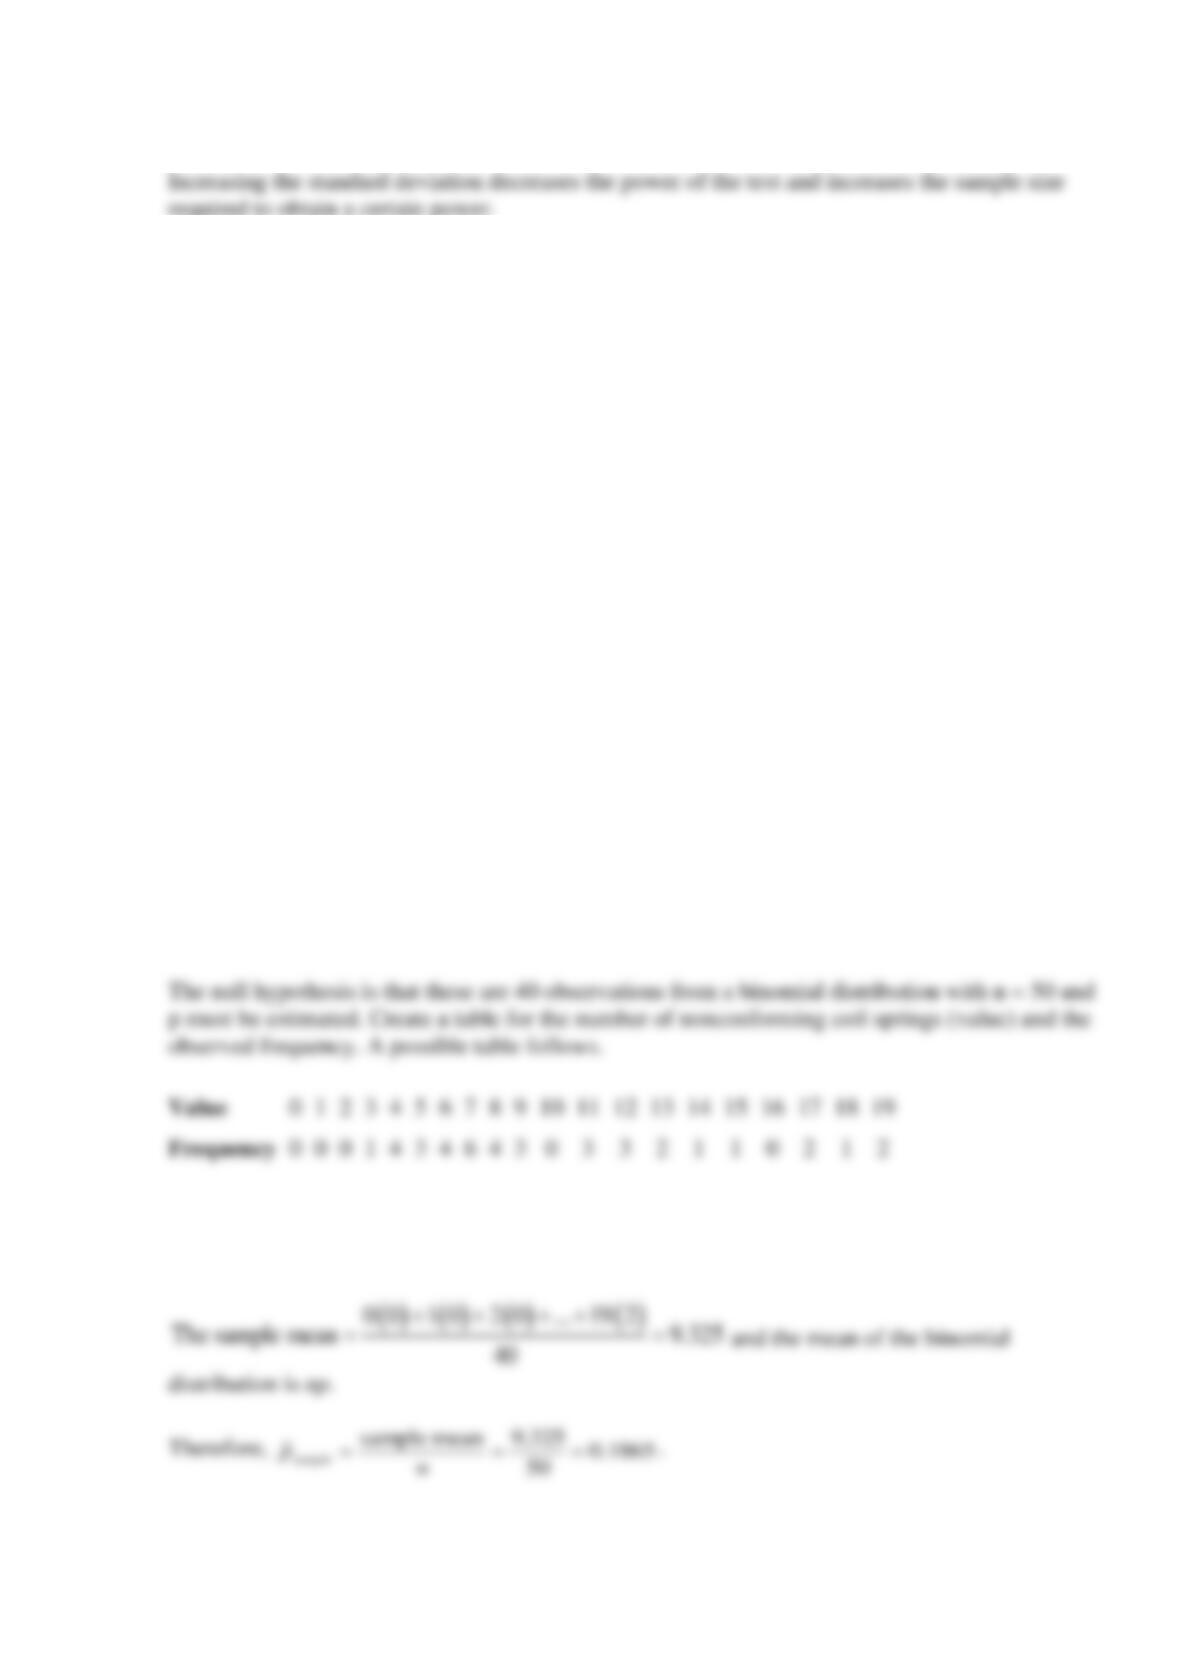
The value of p must be estimated. Let the estimate be denoted by
ˆsample
p
.
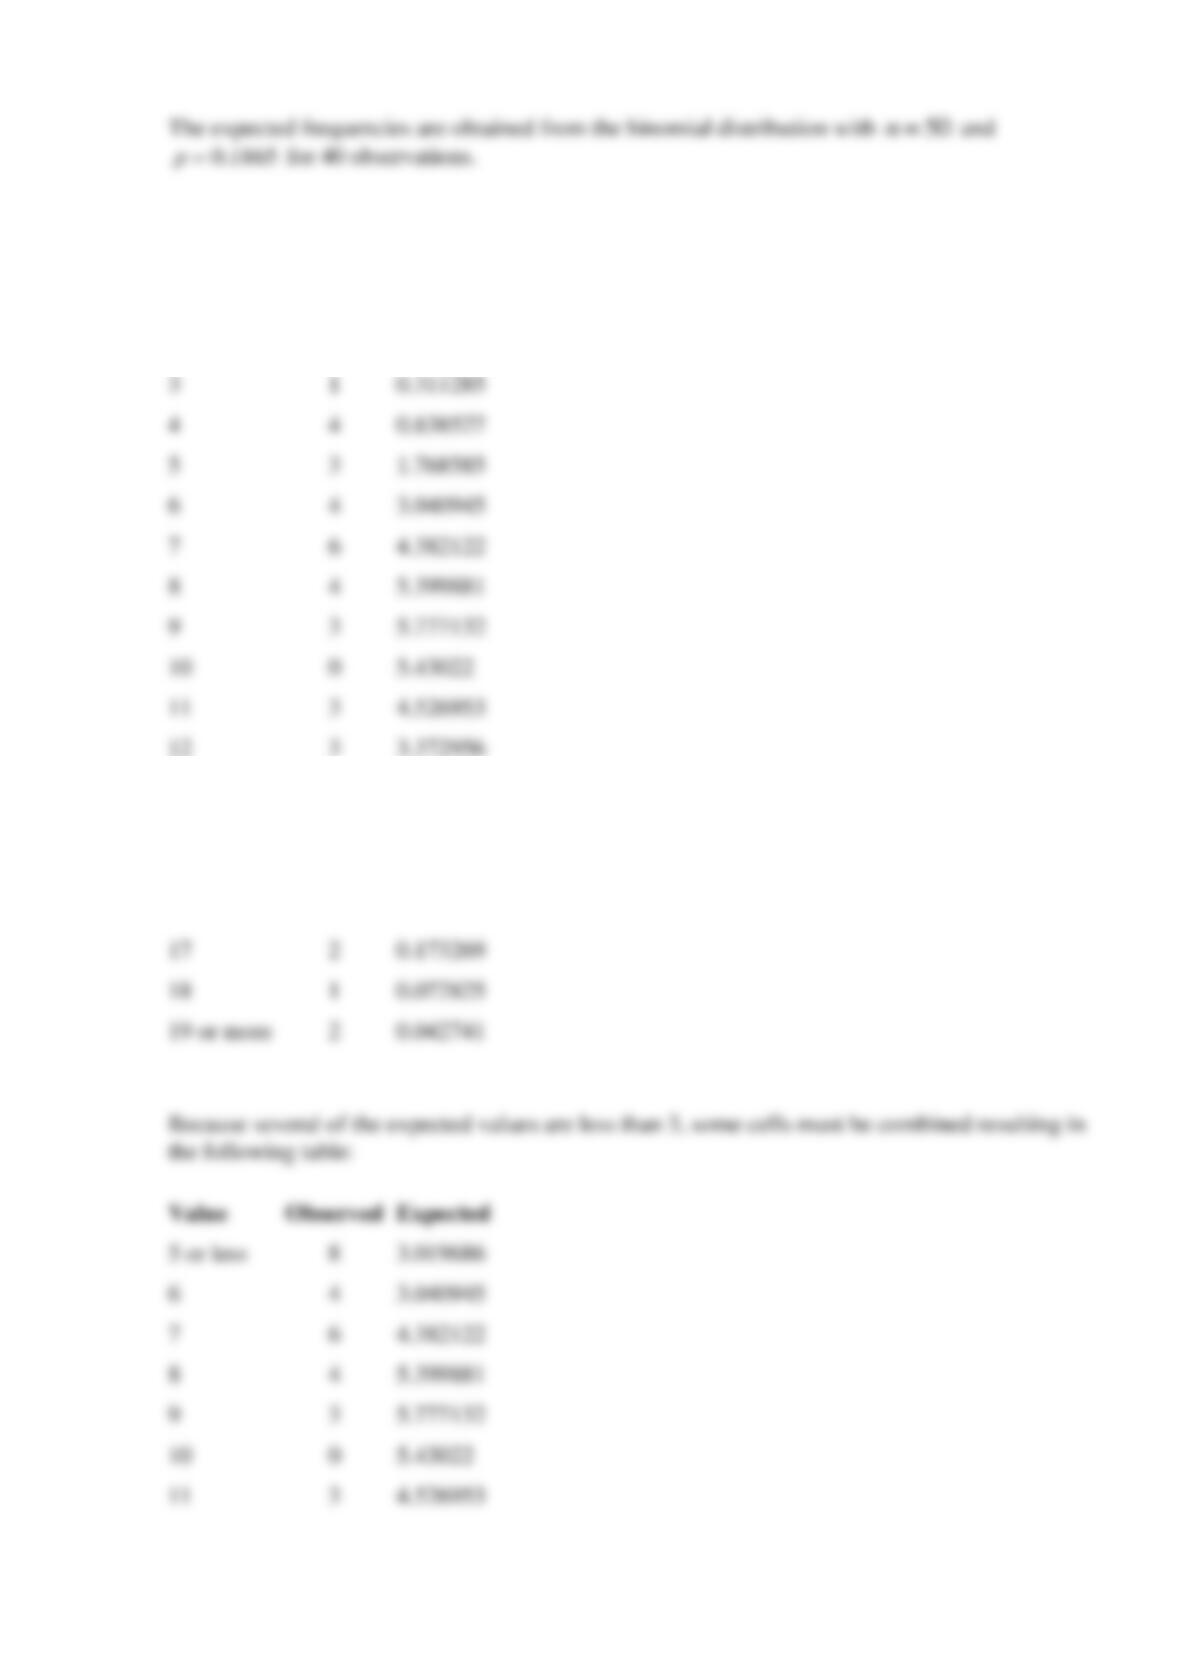
Value
Observed
Expected
0
0
0.001318
1
0
0.015109
2
0
0.084863
3
1
0.311285
4
4
0.838527
5
3
1.768585
6
4
3.040945
7
6
4.382122
8
4
5.399881
9
3
5.777132
10
0
5.43022
11
3
4.526953
12
3
3.372956
13
2
2.260332
14
1
1.369516
15
1
0.753528
16
0
0.377893
17
2
0.173269
18
1
0.072825
19 or more
2
0.042741
Value
Observed
Expected
5 or less
8
3.019686
6
4
3.040945
7
6
4.382122
8
4
5.399881
9
3
5.777132
10
0
5.43022
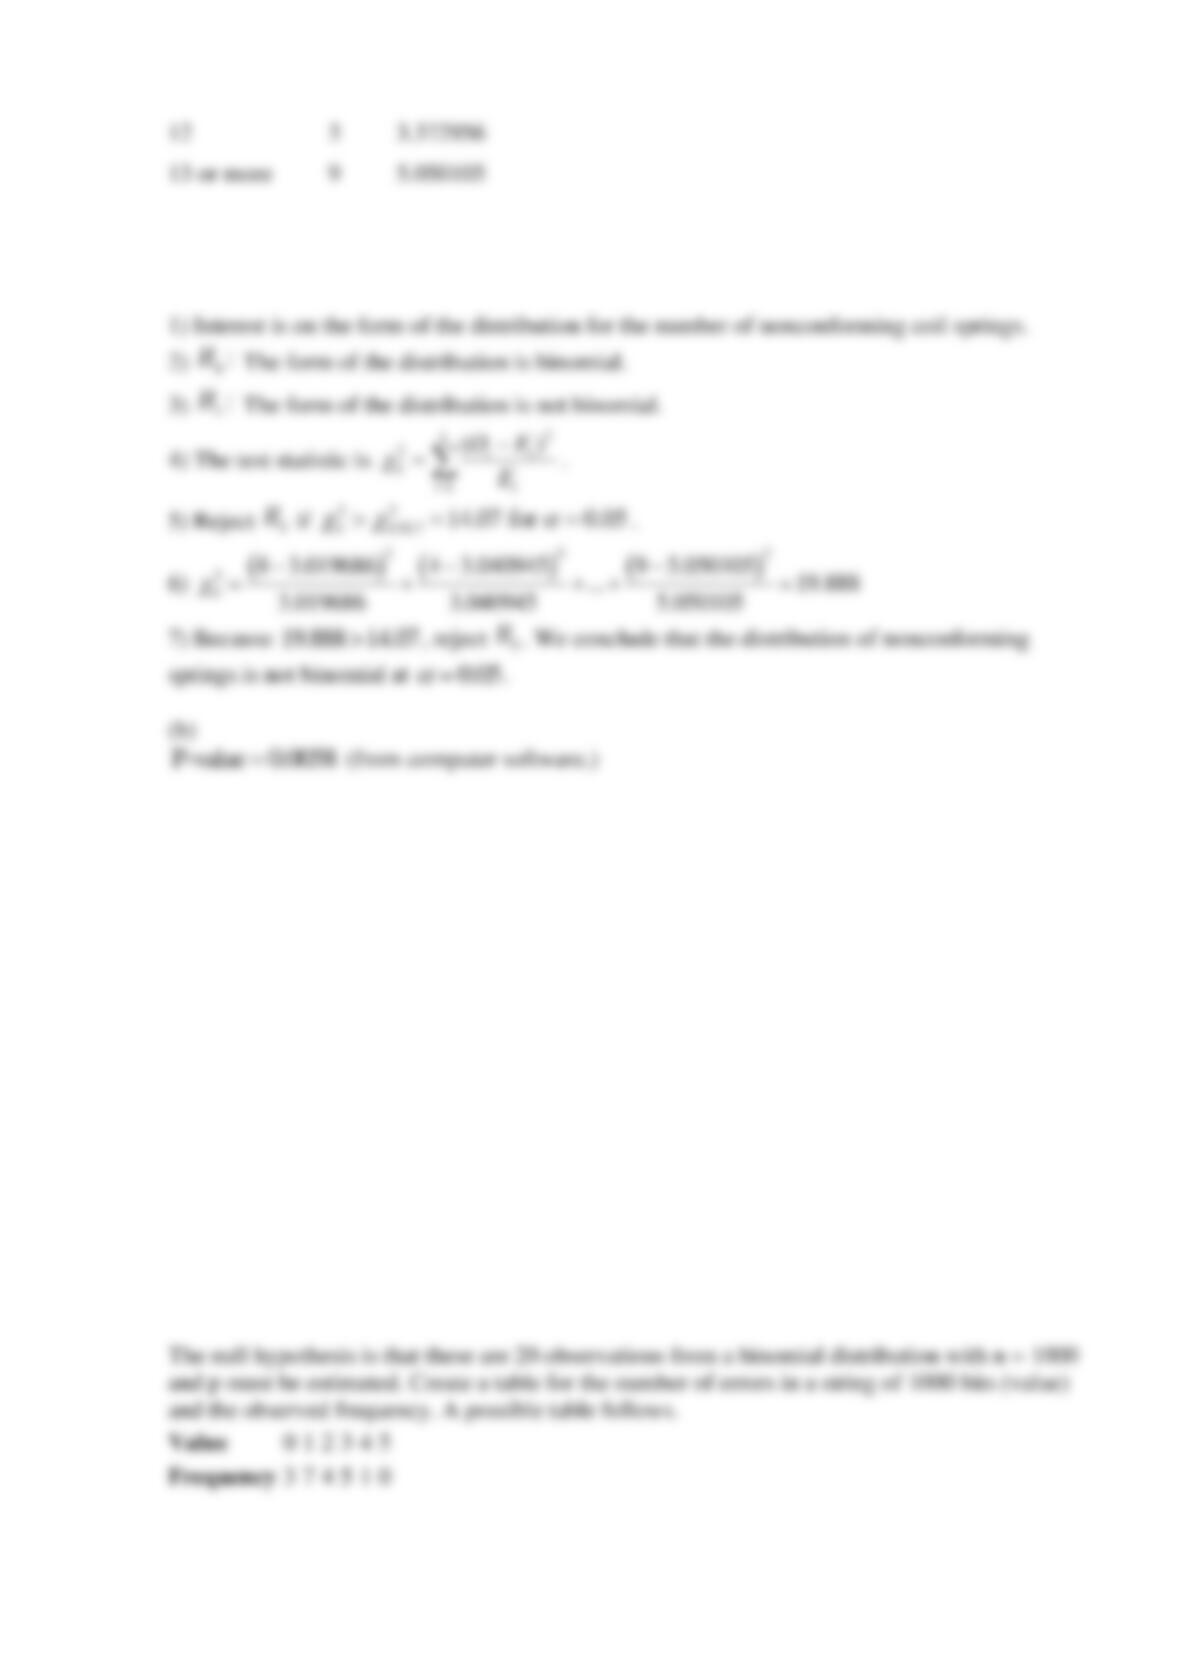
The degrees of freedom are
1 9 1 1 7kp− − = − − =
.
Reserve Supplemental Exercises Chapter 9 Problem 8
A communication channel is being monitored by recording the number of errors in a string of
1000 bits. Data for 20 of these strings follow:
3
1
0
1
3
2
4
1
3
1
1
1
2
3
3
2
0
2
0
1
Consider the 20 observations collected on the number of errors in a string of 1000 bits of a
communication channel.
(a) Based on the description of the random variable and these 20 observations, is a binomial
distribution an appropriate model? Perform a goodness-of-fit procedure with
0.05
=
. Let the
expected frequencies be at least three.
(b) Calculate the P-value for this test.
SOLUTION
(a)
0
1
2
3
4
5
12
3.372956
13 or more
5.050105
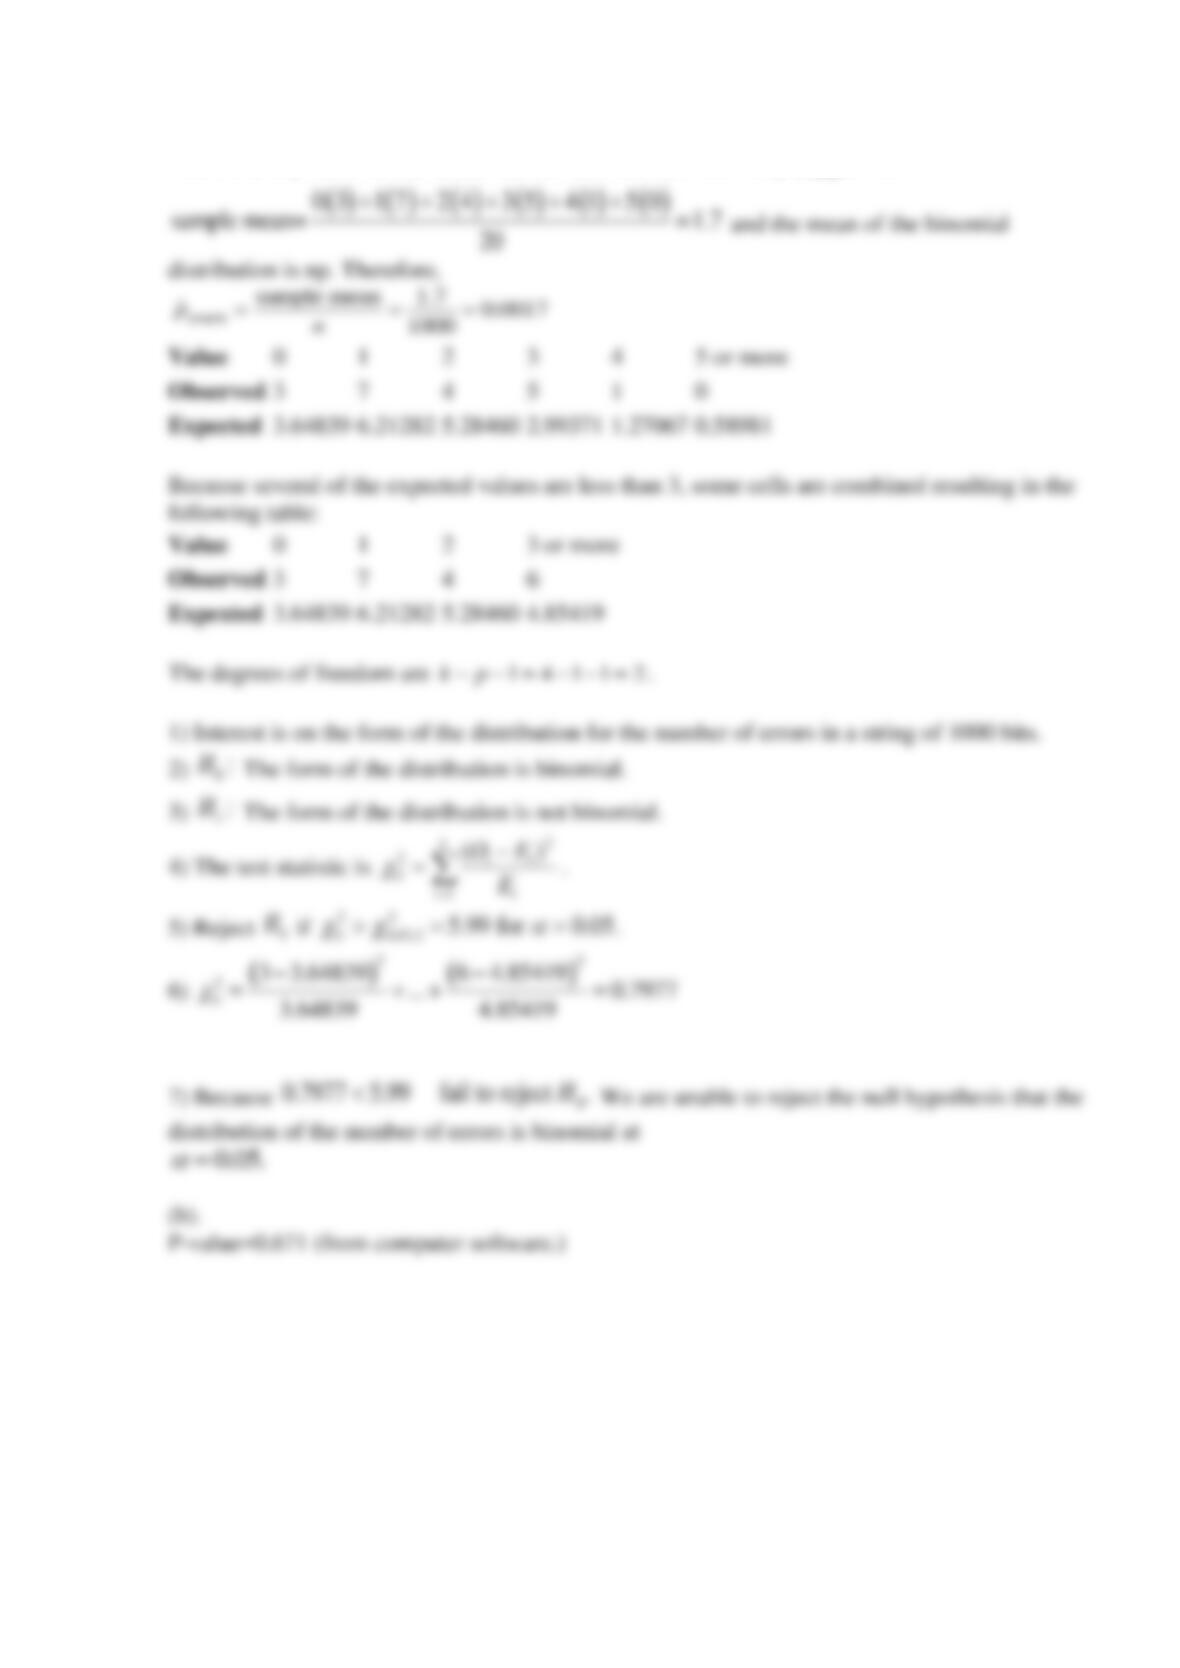
The value of p must be estimated. Let the estimate be denoted by
ˆsample
p
. The
Reserve Supplemental Exercises Chapter 9 Problem 9
An article in the ASCE Journal of Energy Engineering [“Overview of Reservoir Release
Improvements at 20 TVA Dams” (Vol. 125, April 1999, pp. 1-17)] presents data on dissolved
oxygen concentrations in streams below 20 dams in the Tennessee Valley Authority system. The
observations are (in milligrams per liter): 5.0, 3.4, 3.9, 1.3, 0.2, 0.9, 2.7, 3.7, 3.8, 4.1, 1.0, 1.0,
0.8, 0.4, 3.8, 4.5, 5.3, 6.1, 6.9, and 6.5. Water quality engineers are interested in knowing
whether these data support a claim that mean dissolved oxygen concentration is 2.5 milligrams
per liter.
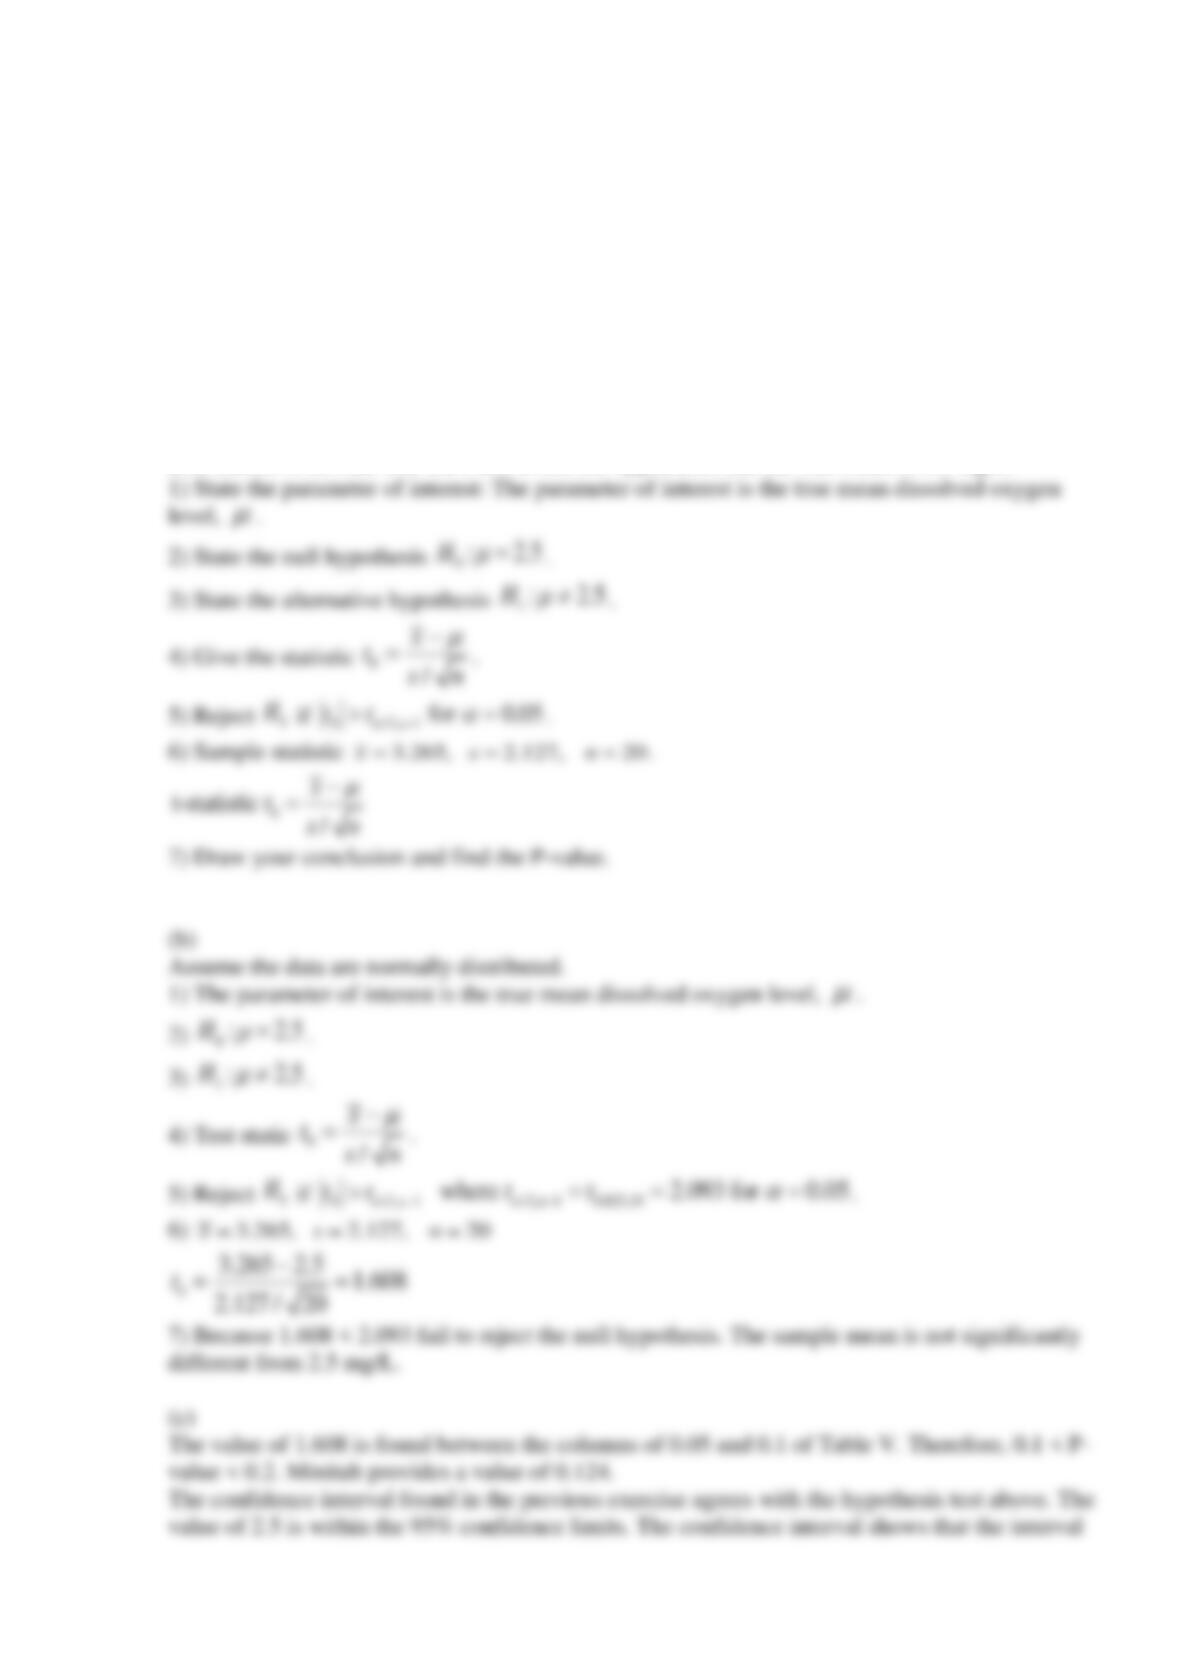
(a) Formulate an appropriate hypothesis testing procedure to investigate this claim.
(b) Test these hypothesis and draw conclusions, using
0.05
=
.
(c) Find the
P value−
for this test.
SOLUTION
(a)
In order to use t statistics in hypothesis testing, we need to assume that the underlying
distribution is normal. Use the t-test to test the hypothesis that the true mean is 2.5 mg/L.
Reserve Supplemental Exercises Chapter 9 Problem 10
An article in Food Chemistry [“A Study of Factors Affecting Extraction of Peanut (Arachis
Hypgaea L.) Solids with Water” (1991, Vol. 42(2), pp. 153-165)] reported that the percent
protein extracted from peanut milk as follows:
78.3
77.1
71.3
84.5
87.8
75.7
64.8
72.5
78.2
91.2
86.2
80.9
82.1
89.3
89.4
81.6
(a) Can you support a claim that the mean percent protein extracted exceeds 80 percent? Use
0.05
=
.
(b) What is the P-value of the test statistic computed in part (a)? Use bounds for P-value.
SOLUTION
(a)
1) The parameter of interest is the true mean percent protein,
.
Reserve Supplemental Exercises Chapter 9 Problem 11
An article in the Journal of Electronic Material [“Progress in CdZnTe Substrate Producibility
and Critical Drive of IRFPA Yield Originating with CdZnTe Substrates” (1998, Vol. 27(6), pp.
564-572)] improved the quality of CdZnTe substrates used to produce the HgCdTe infrared focal
plane arrays (IRFPAs) also defined as sensor chip assemblies (SCAs). The cut-on wavelength (
m
) on 11 wafers was measured as follows:
6.06
6.16
6.57
6.67
6.98
6.17
6.17
6.93
6.73
6.87
6.76
(a) Is there evidence that the mean of cut-on wavelength is not
6.50 m
?
(b) What is the P-value for this test? Use bounds for P-value.
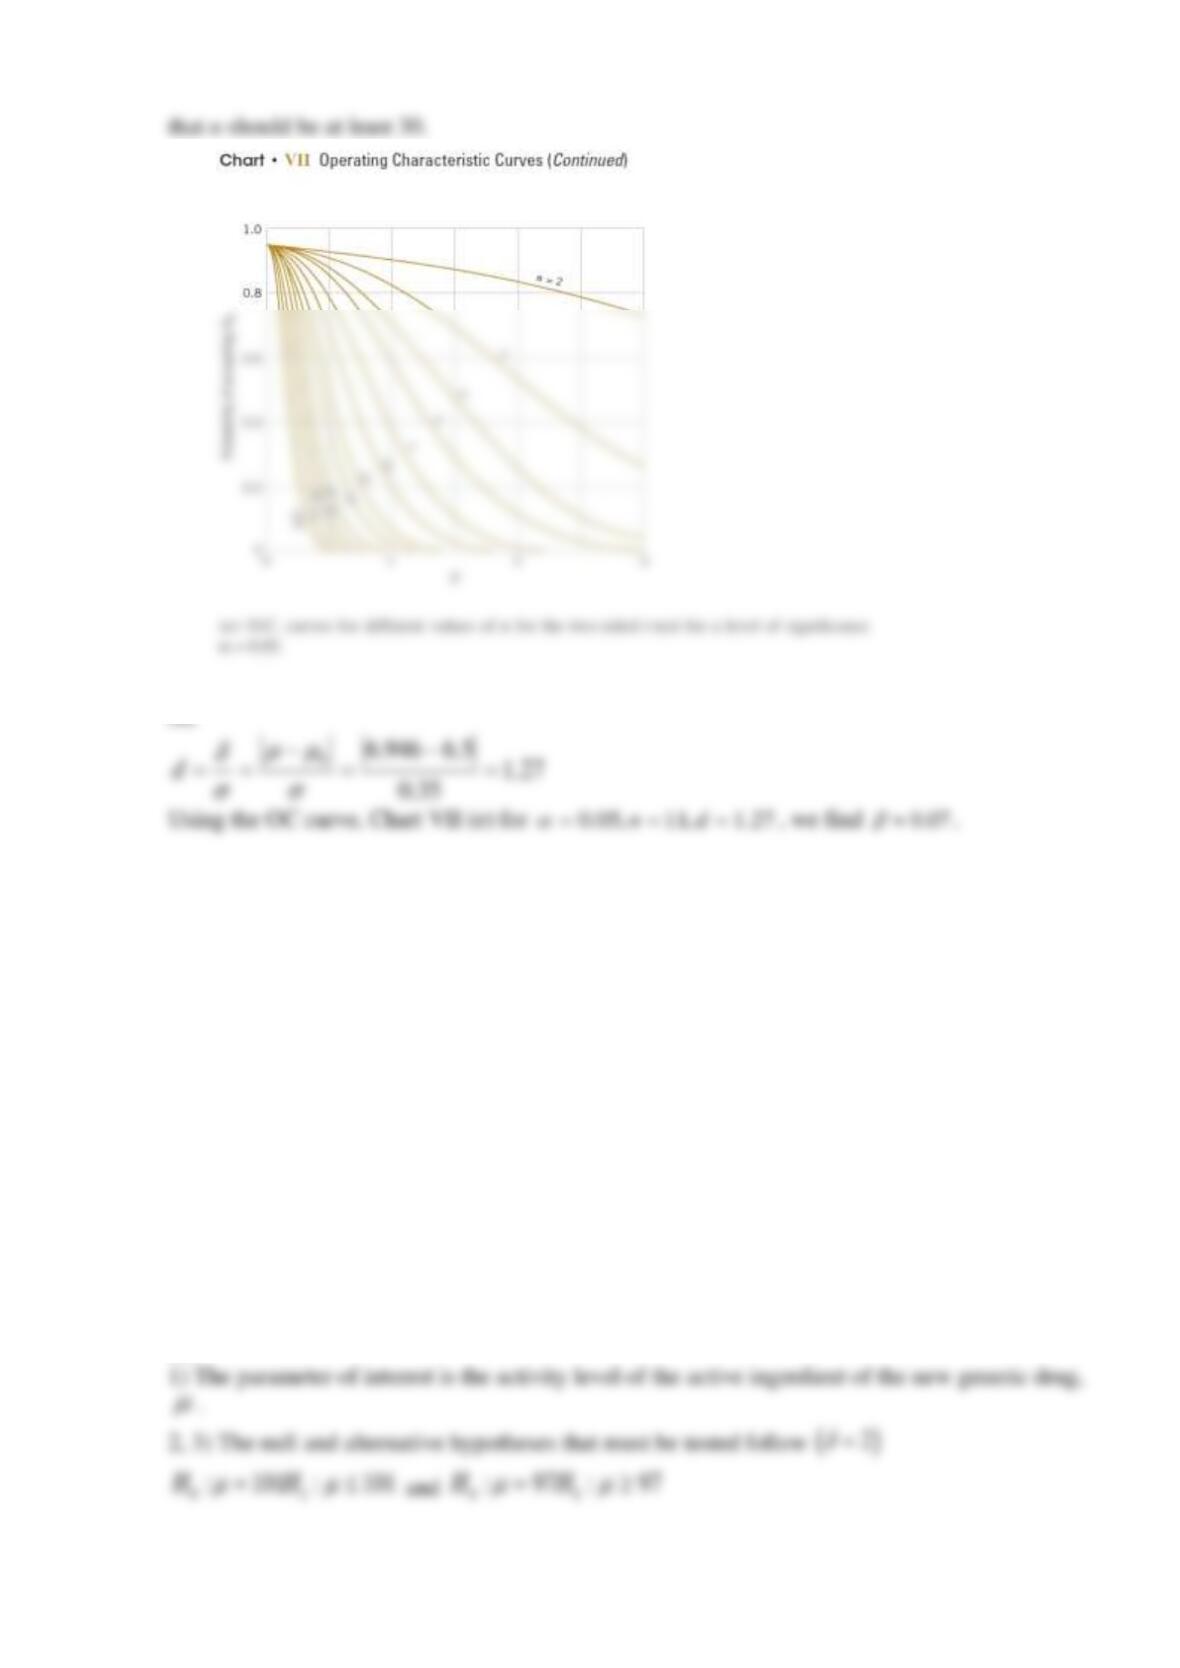
(c) What sample size would be required to detect a true mean cut-on wavelength of 6.241
m
with probability 95%?
(d) What is the type II error probability if the true mean cut-on wavelength is 6.946
m
?
SOLUTION
(a)
1) The parameter of interest is the true mean percent protein,
.
(b)
Reserve Supplemental Exercises Chapter 9 Problem 12
A manufacturer of a pharmaceutical product is developing a generic drug and must show its
equivalence to the current product. The variable of interest is the activity level of the active
ingredient. The current product has an activity level of 99. If the new generic product has an
activity level that is within 2 unit(s) of this value, it will be considered equivalent. A random
sample of 10 units of product is available, and the sample mean and standard deviation of
absorption rate are 95 and 1.5 respectively.
(a) State the appropriate hypothesis that must be used to demonstrate equivalence.
(b) What are your conclusions using
0.05
=
?
SOLUTION
(a)
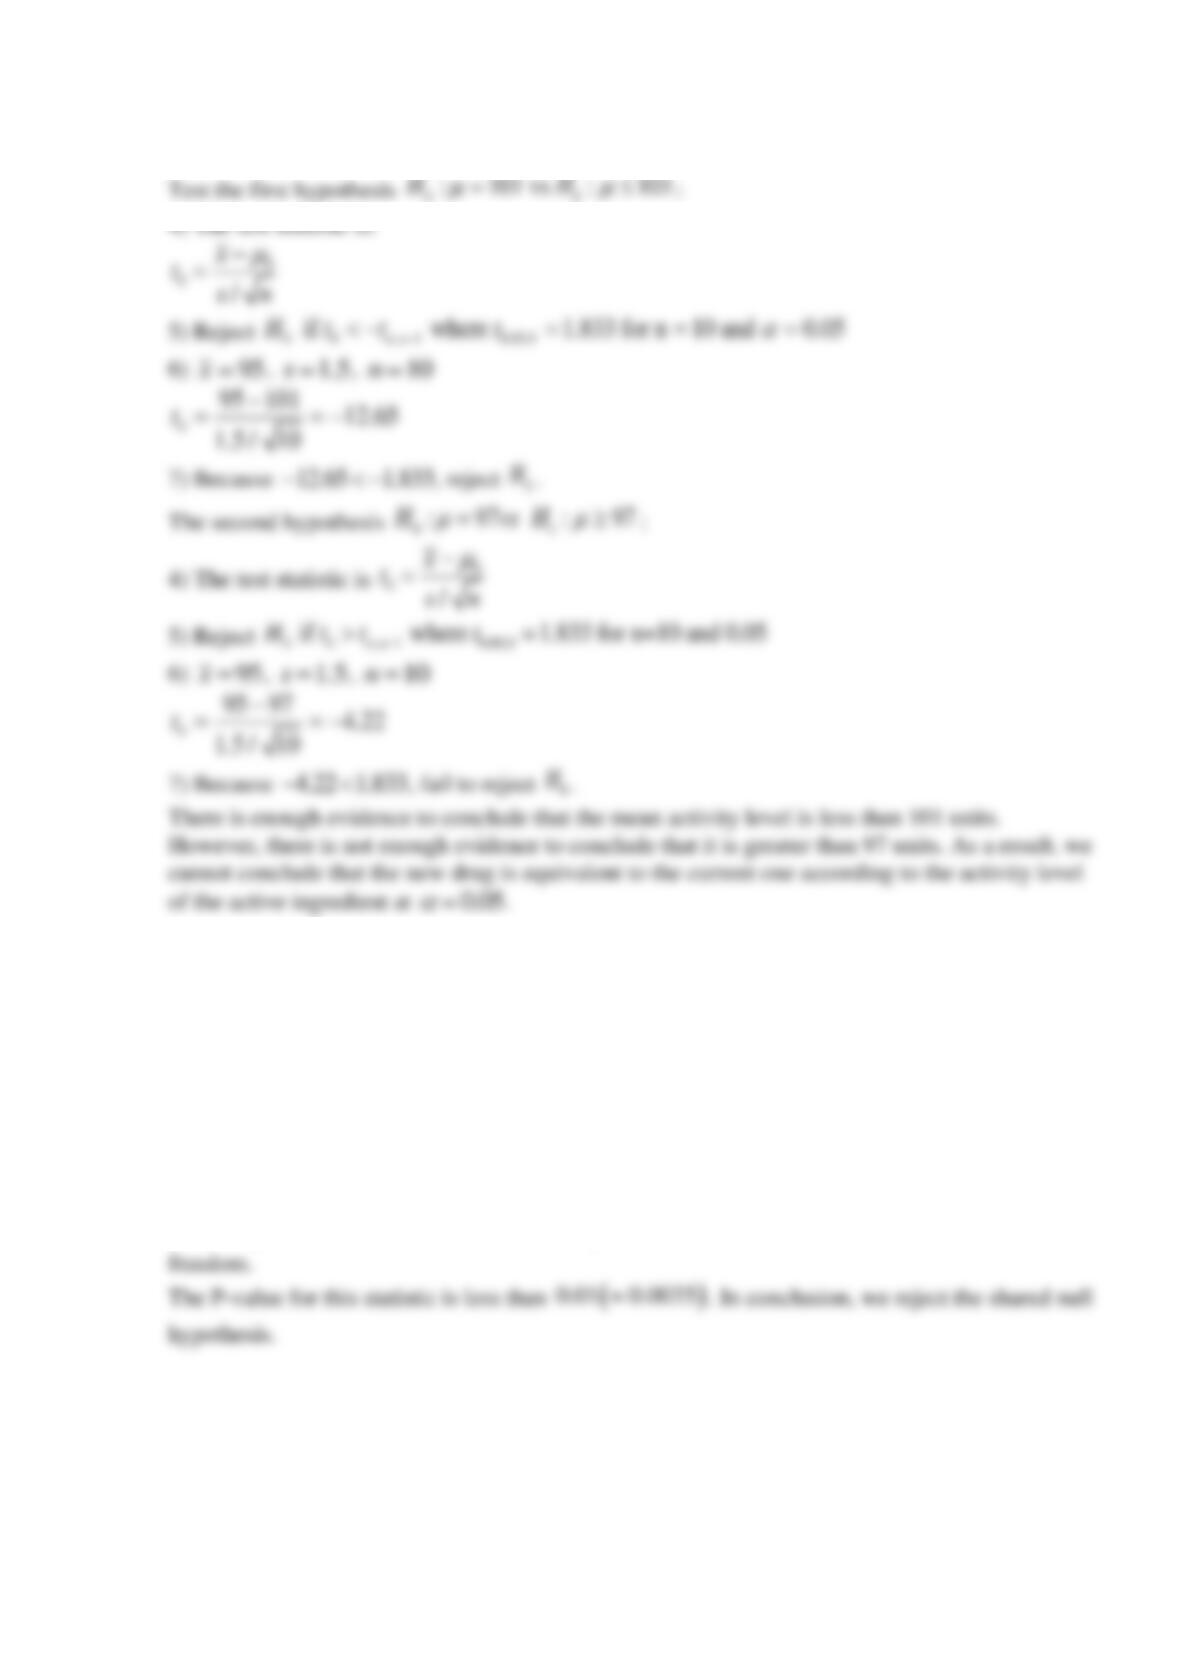
(b)
Reserve Supplemental Exercises Chapter 9 Problem 13
Suppose that 8 sets of hypotheses of the form
0 0 1 0
: , :HH
=
have been tested and that
the P-values of these tests are 0.15, 0.06, 0.67, 0.01, 0.04, 0.08, 0.80, and 0.13. Use Fisher’s
procedure to combine all of the P-values. What conclusions can you draw about these
hypotheses?
SOLUTION
( ) ( ) ( )
2
02 ln 0.15 ln 0.06 … ln 0.13 35.4483
= − + + + =
with
2 2 8 16m= =
degrees of