(b)
(d)
00.638 0.635 0.23
−−
(e)
95% one-sided confidence interval
Reserve Problems Chapter 9 Section 3 Problem 6
An article in the ASCE Journal of Energy Engineering [“Overview of Reservoir Release
Improvements at 20 TVA Dams” (Vol. 125, April 1999, pp. 1–17)] presents data on dissolved
oxygen concentrations in streams below 20 dams in the Tennessee Valley Authority system. The
observations are (in milligrams per liter): 5.0, 3.4, 3.9, 1.3, 0.2, 0.9, 2.7, 3.7, 3.8, 4.1, 1.0, 1.0,
0.8, 0.4, 3.8, 4.5, 5.3, 6.1, 6.9, and 6.5.
(a) Test the hypothesis
0:4H
=
versus
1:4H
. Use
0.01
=
. Is it possible to reject
0
H
hypothesis at the 0.01 level of significance? Find the P-value.
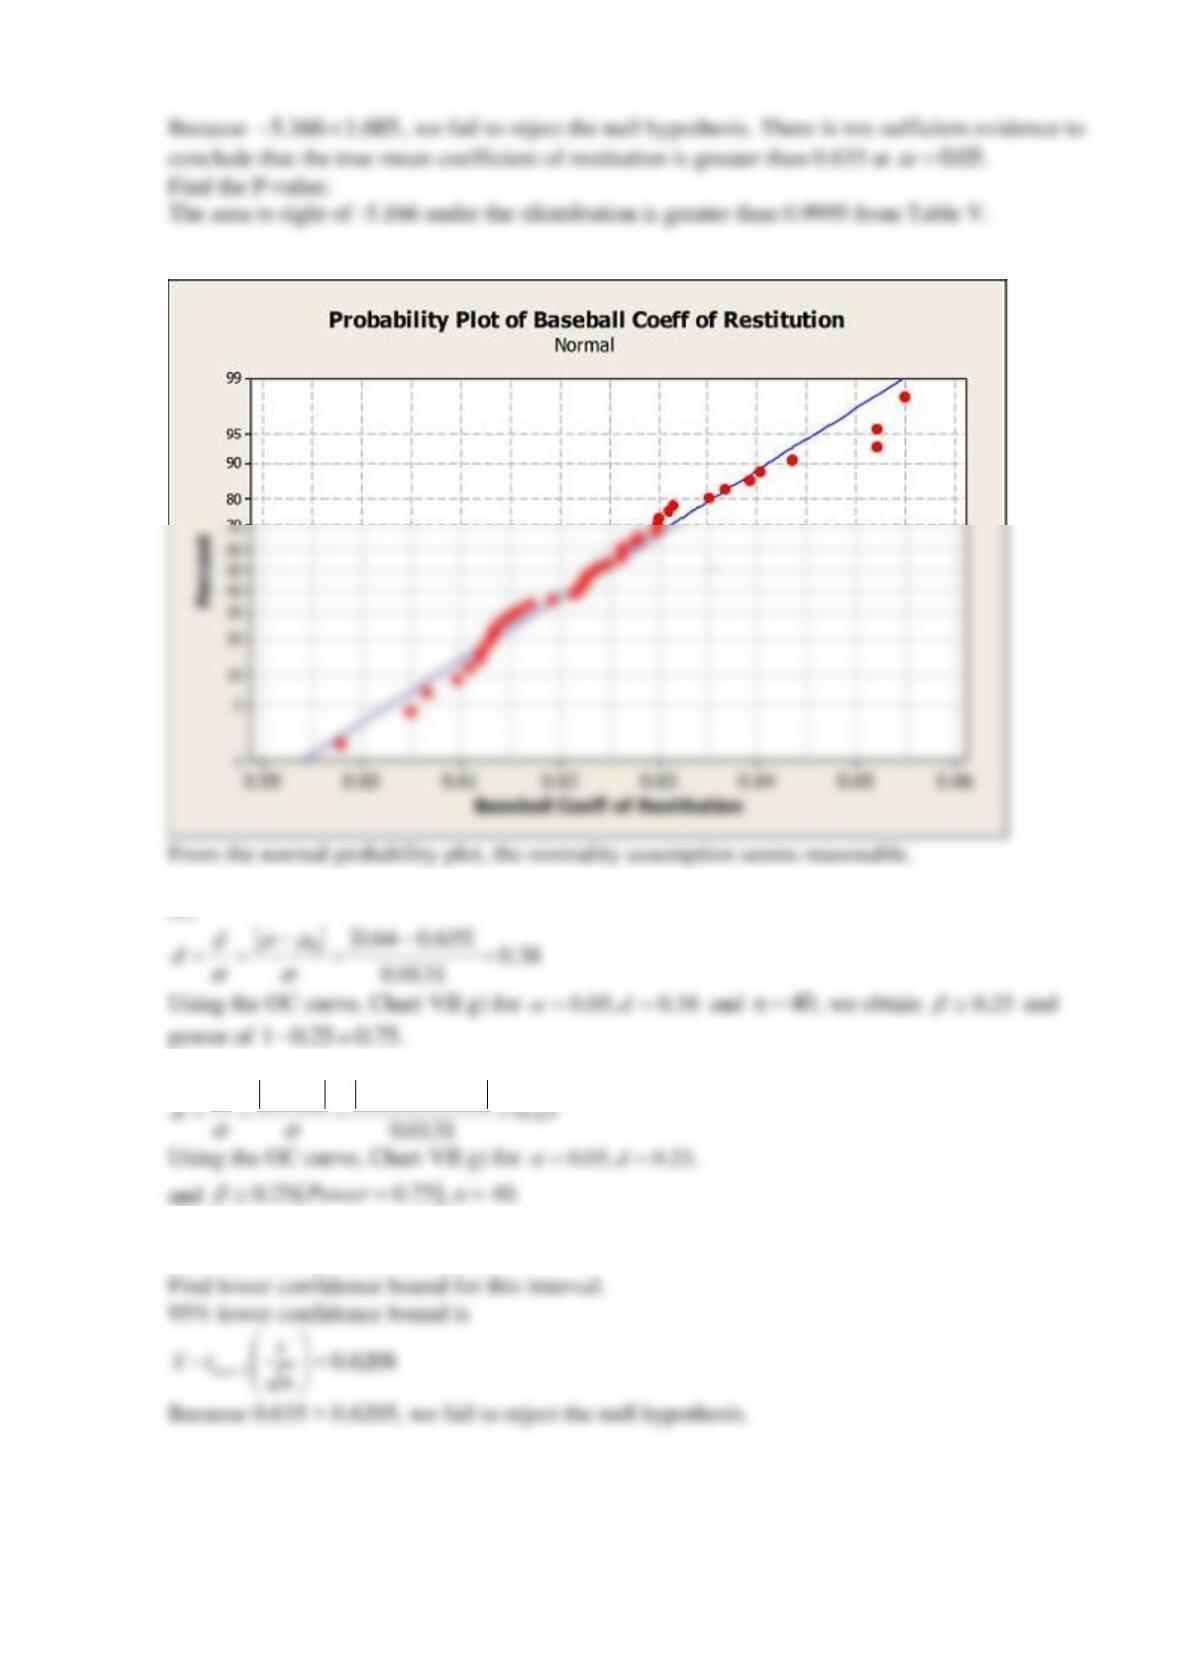
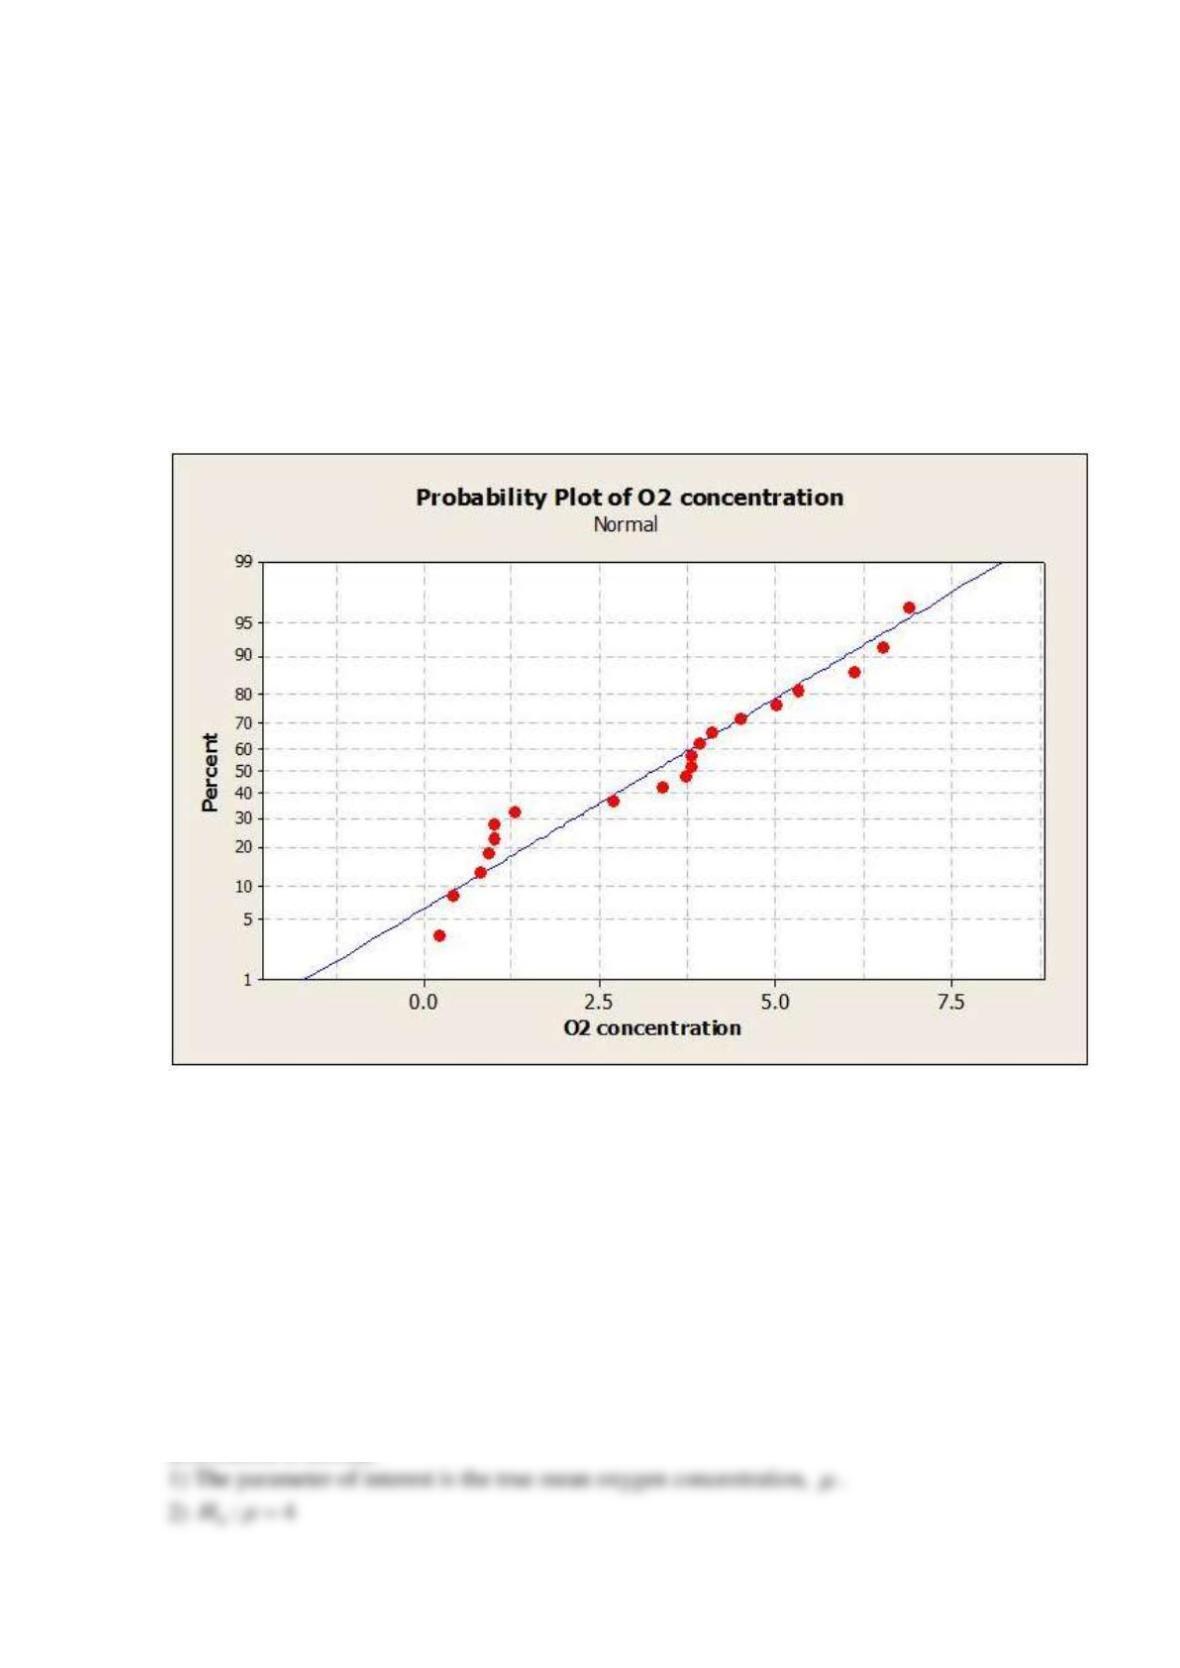
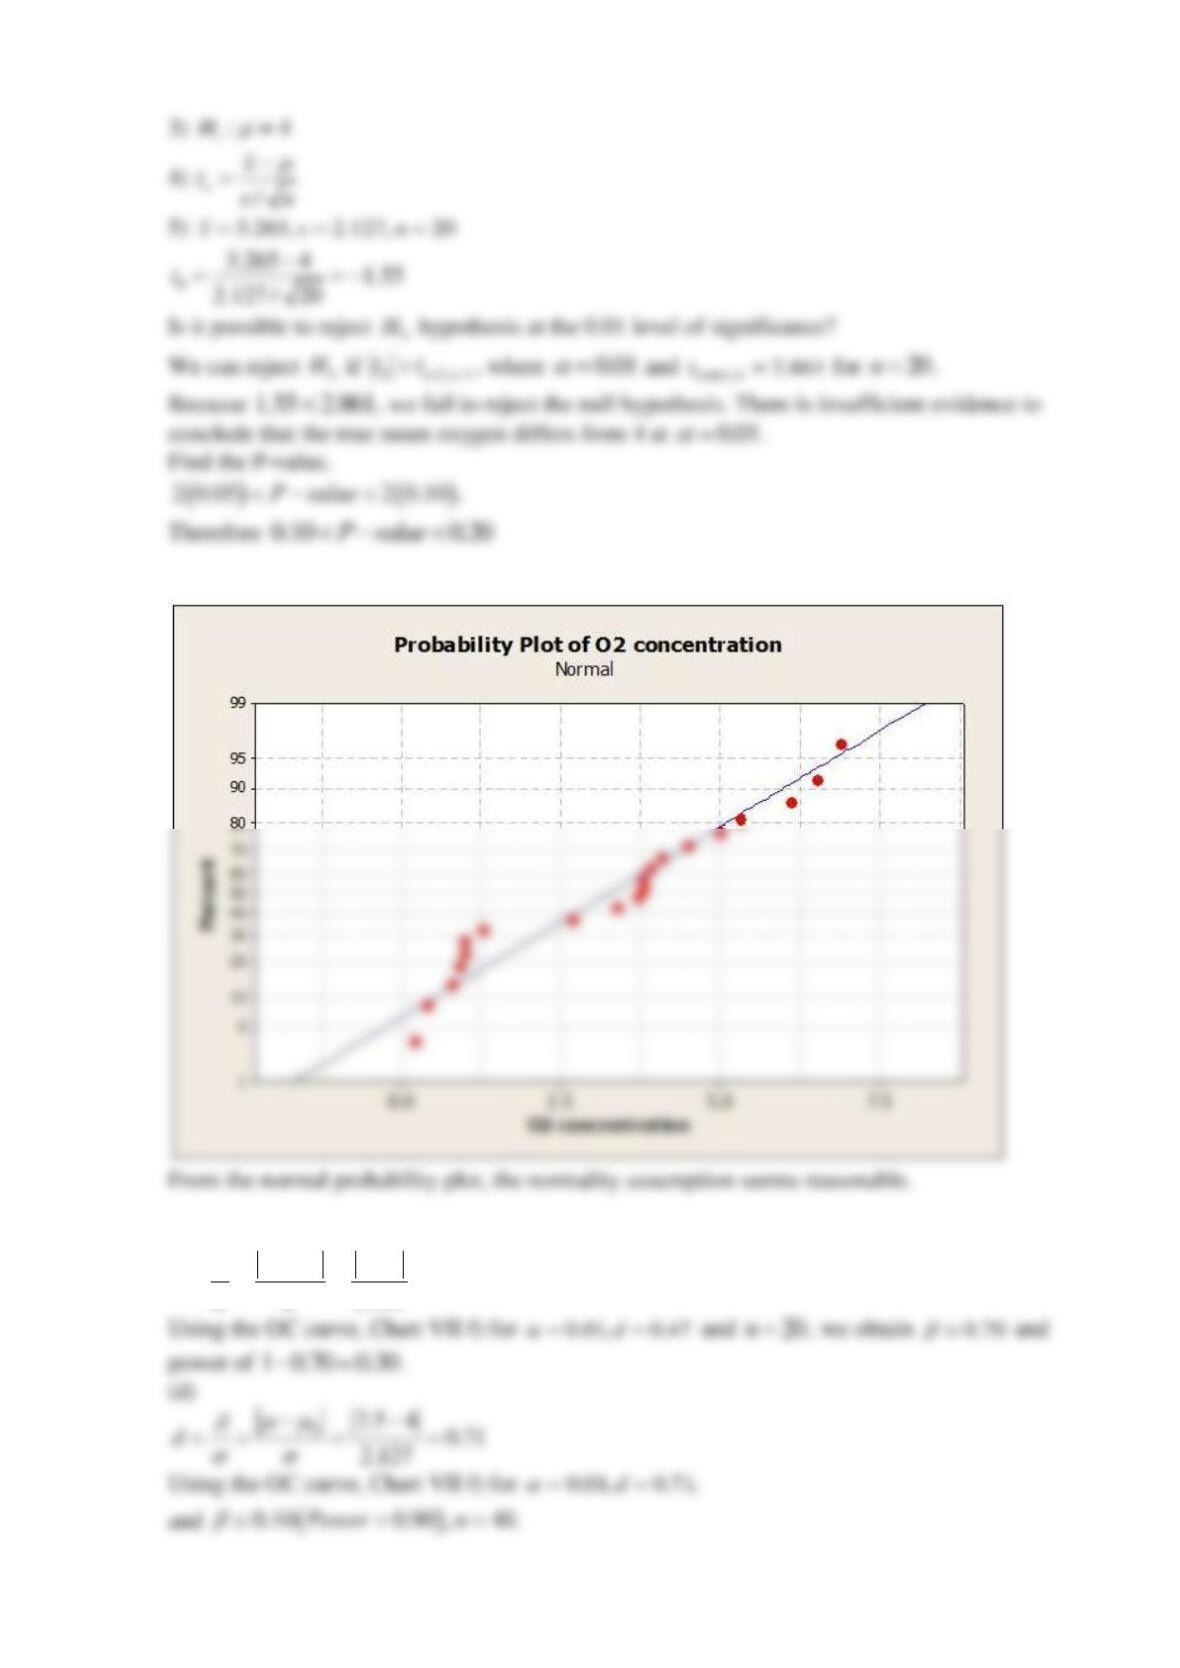
(b) Check the normality assumption, using the normal probability plot.
(c) Compute the power of the test if the true mean dissolved oxygen concentration is as low as 3.
(d) What sample size would be required to detect a true mean dissolved oxygen concentration as
low as 2.5 if you wanted the power of the test to be at least 0.9?
(e) Which confidence interval should be used to consider
0
H
hypothesis? Find upper confidence
bound for this interval.
SOLUTION
(a)
In order to use t statistics in hypothesis testing, we need to assume that the underlying
distribution is normal.
0:4H
(b)
(c)
034 0.47
2.127
d
−−
= = = =
(e)
The 99% two-sided confidence interval.
Reserve Problems Chapter 9 Section 3 Problem 7
A research engineer for a tire manufacturer is investigating tire life for a new rubber compound
and has built 16 tires and tested them to end-of-life in a road test. The sample mean and standard
deviation are 60489.7 and 3645.94 kilometers.
(a) The engineer would like to demonstrate that the mean life of this new tire is in excess of
60,000 kilometers. Formulate the appropriate hypotheses. Test the appropriate hypotheses using
0.05
=
. Find
0
t
. Is it possible to reject
0
H
hypothesis at the 0.05 level of significance?
(b) Suppose that if the mean life is as long as 61,000 kilometers, the engineer would like to
detect this difference with probability at least 0.90. Was the sample size
16n=
used in part (a)
adequate?
SOLUTION
(a)
The parameter of interest is the true mean tire life, m. roughness.
0: 60000H
=
and
1: 60000H
0.05
=
0
t
0
H
16n=
0
H
Reserve Problems Chapter 9 Section 3 Problem 8
The United States Golf Association tests golf balls to ensure that they conform to the rules of
golf. Balls are tested for weight, diameter, roundness, and overall distance. The overall distance
test is conducted by hitting balls with a driver swung by a mechanical device nicknamed “Iron
Byron” after the legendary great Byron Nelson, who’s swing the machine is said to emulate.
Following are 100 distances (in yards) achieved by a particular brand of golf ball in the overall
distance test.
261.3 259.4 265.7 270.6 274.2 261.4 254.5 283.7
258.1 270.5 255.1 268.9 267.4 253.6 234.3 263.2
254.2 270.7 233.7 263.5 244.5 251.8 259.5 257.5
257.7 272.6 253.7 262.2 252.0 280.3 274.9 233.7
237.9 274.0 264.5 244.8 264.0 268.3 272.1 260.2
255.8 260.7 245.5 279.6 237.8 278.5 273.3 263.7
241.4 260.6 280.3 272.7 261.0 260.0 279.3 252.1
244.3 272.2 248.3 278.7 236.0 271.2 279.8 245.6
241.2 251.1 267.0 273.4 247.7 254.8 272.8 270.5
254.4 232.1 271.5 242.9 273.6 256.1 251.6
256.8 273.0 240.8 276.6 264.5 264.5 226.8
255.3 266.6 250.2 255.8 285.3 255.4 240.5
255.0 273.2 251.4 276.1 277.8 266.8 268.5
(a) Can you support a claim that mean distance achieved by this particular golf ball exceeds 280
yards? Test the hypothesis
0: 280H
=
versus
1: 280H
Use
0.05
=
. Is it possible to
reject
0
H
hypothesis at the 0.05 level of significance? Find the P-value.
(b) Check the normality assumption.
(c) Compute the power of the test if the true mean distance is 290 yards. What sample size would
be required to detect a true mean distance of 290 yards if you wanted the power of the test to be
at least 0.8?
SOLUTION
(a)
In order to use t statistics in hypothesis testing, we need to assume that the underlying
distribution is normal.
0: 280H
=
1: 280H
0
H
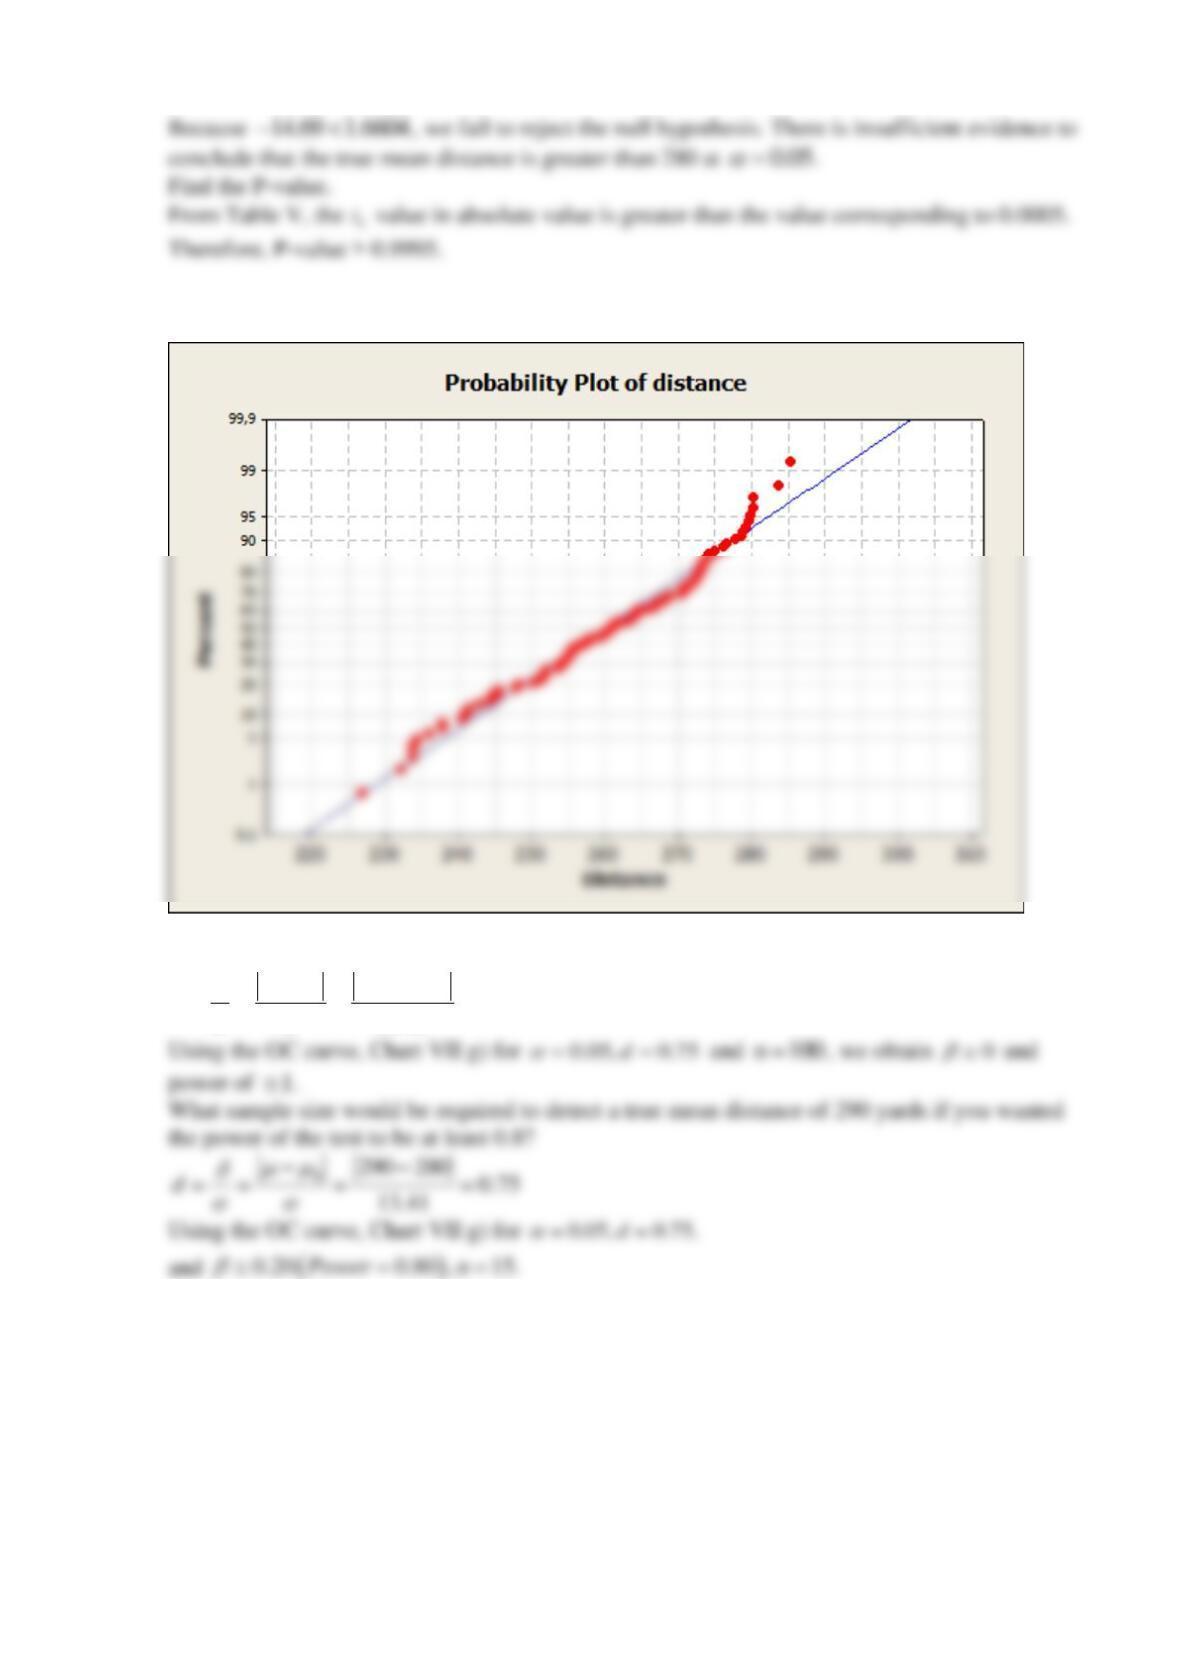
(b)
From the normal probability plot, the normality assumption seems reasonable.
(c)
0290 280 0.75
13.41
d
−−
= = = =
Reserve Problems Chapter 9 Section 3 Problem 9
Human oral normal body temperature is believed to be 98.6° F, but there is evidence that it
actually should be 98.2° F [Mackowiak, Wasserman, Steven and Levine, JAMA (1992, Vol.
268(12), pp. 1578–1580)]. From a sample of 52 healthy adults, the mean oral temperature was
98.285 with a standard deviation of 0.625 degrees.
(a) What are the null and alternative hypotheses?
(b) Test the null hypothesis at
0.05
=
. Find
0
t
. Is it possible to reject
0
H
hypothesis at the
0.05 level of significance?
(c) Construct a 95% confidence interval to answer the same question.
SOLUTION
(a)
(b)
0: 98.2H
=
0
H
0
H
0.05
=
(c)
95% two-sided confidence interval
Reserve Problems Chapter 9 Section 4 Problem 1
A group of 15 students has performed an experiment, they measured the coefficient of thermal
expansion for aluminum. The results are as follows:
22.0
25.9
25.6
23.1
22.7
25.6
24.9
21.9
26.1
24.3
23.5
20.7
21.4
23.5
20.4
a) Is there strong evidence to conclude that the standard deviation in this experiment exceeds 3?
Use
0.05
=
.
0: 98.2H
=
b) Find the P-value for this test.
c) Suppose that the true standard deviation is 1. How many measurements would be required to
detect this difference with the probability of at least 0.9? Use
0.05
=
.
SOLUTION
a) The parameter of interest is the true standard deviation
. However, the solution can be
found by performing a hypothesis test on
2
.
22
0: 3 9H
==
0.05
=
Reserve Problems Chapter 9 Section 4 Problem 2
The quantity of heat that is required to boil 2 liters of water was measured. The experiment was
performed 10 times. The results are as follows (kJ):
656
631
627
644
661
670
623
649
651
658
(a) Is there strong evidence to conclude that the variance in this experiment exceeds 100? Use
0.01
=
.
(b) Find the P-value for this test.
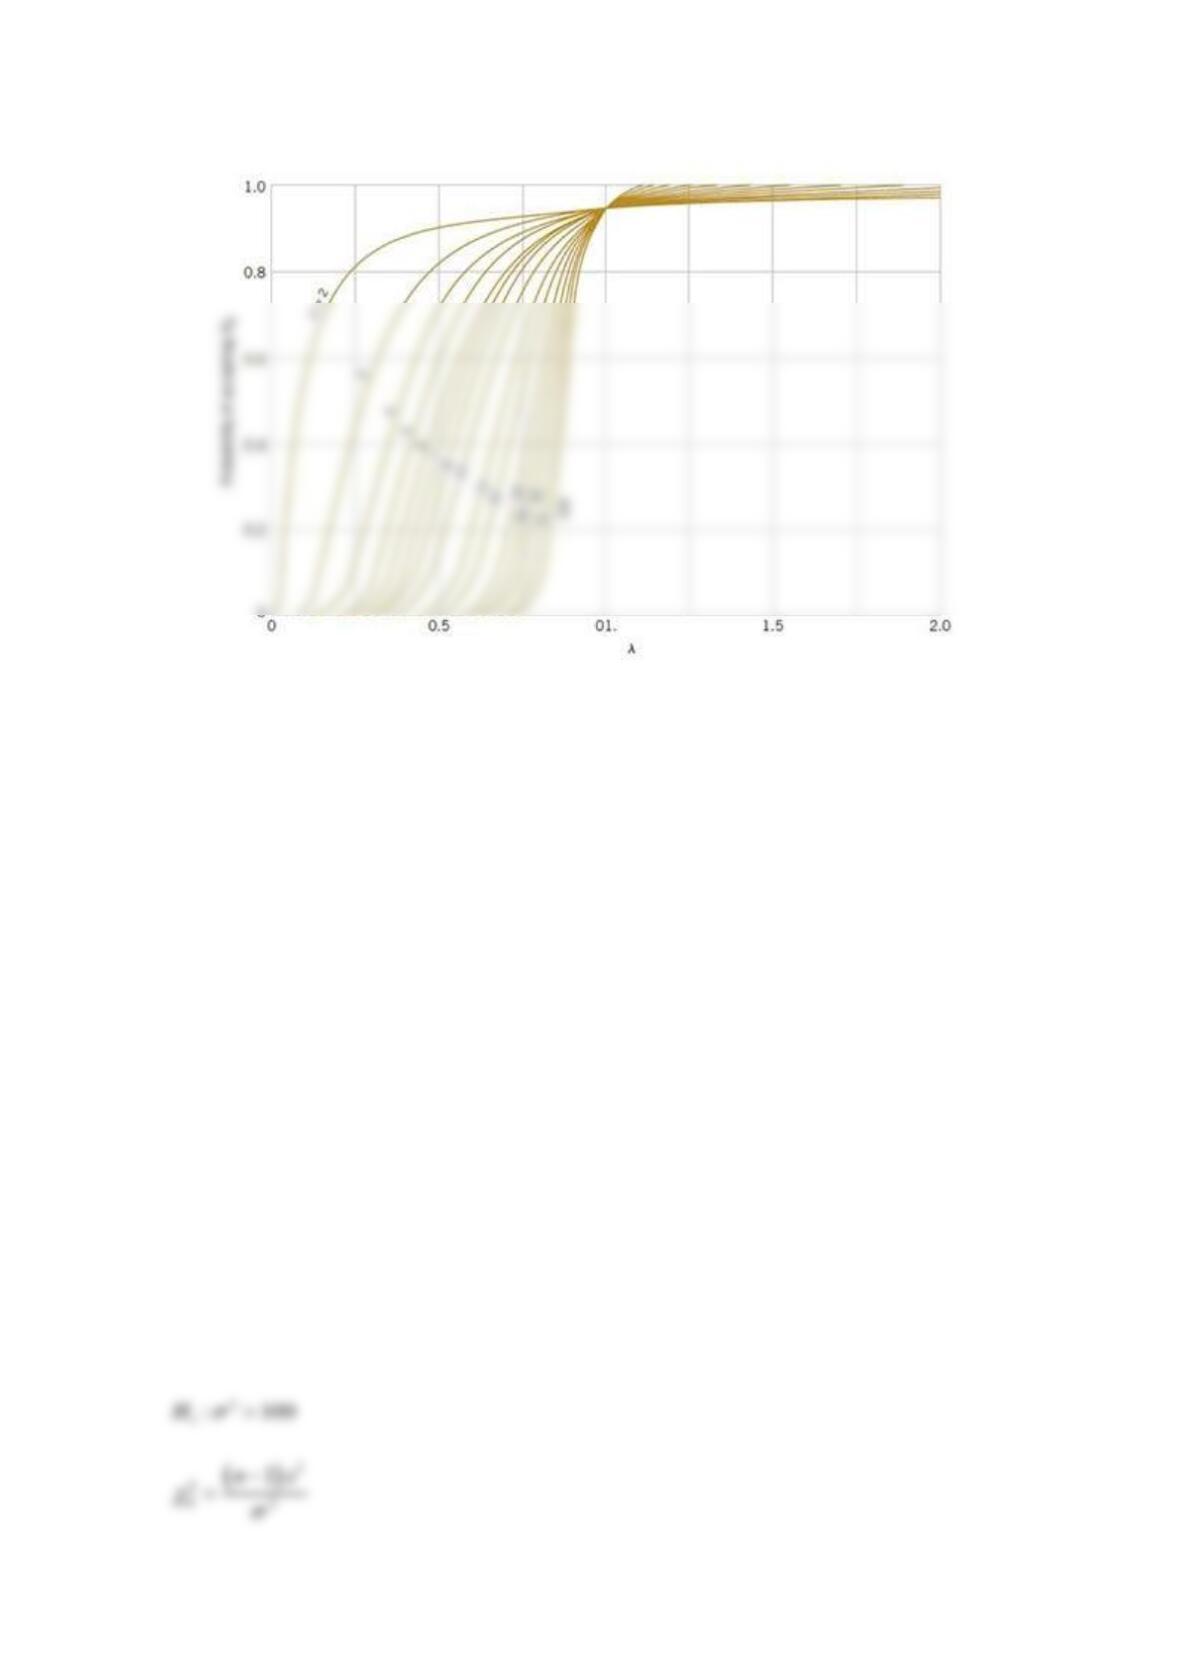
(c) Suppose that the true value of the standard deviation exceeds the hypothesized one by 50%.
What is the probability that this will be detected by performed measurements? Use
0.01
=
.
(d) How many measurements would be required to detect the difference described in (c) with the
probability of at least 0.7? Use
0.01
=
.
SOLUTION
(a) The parameter of interest is the true variance
2
.
2
0: 100H
=
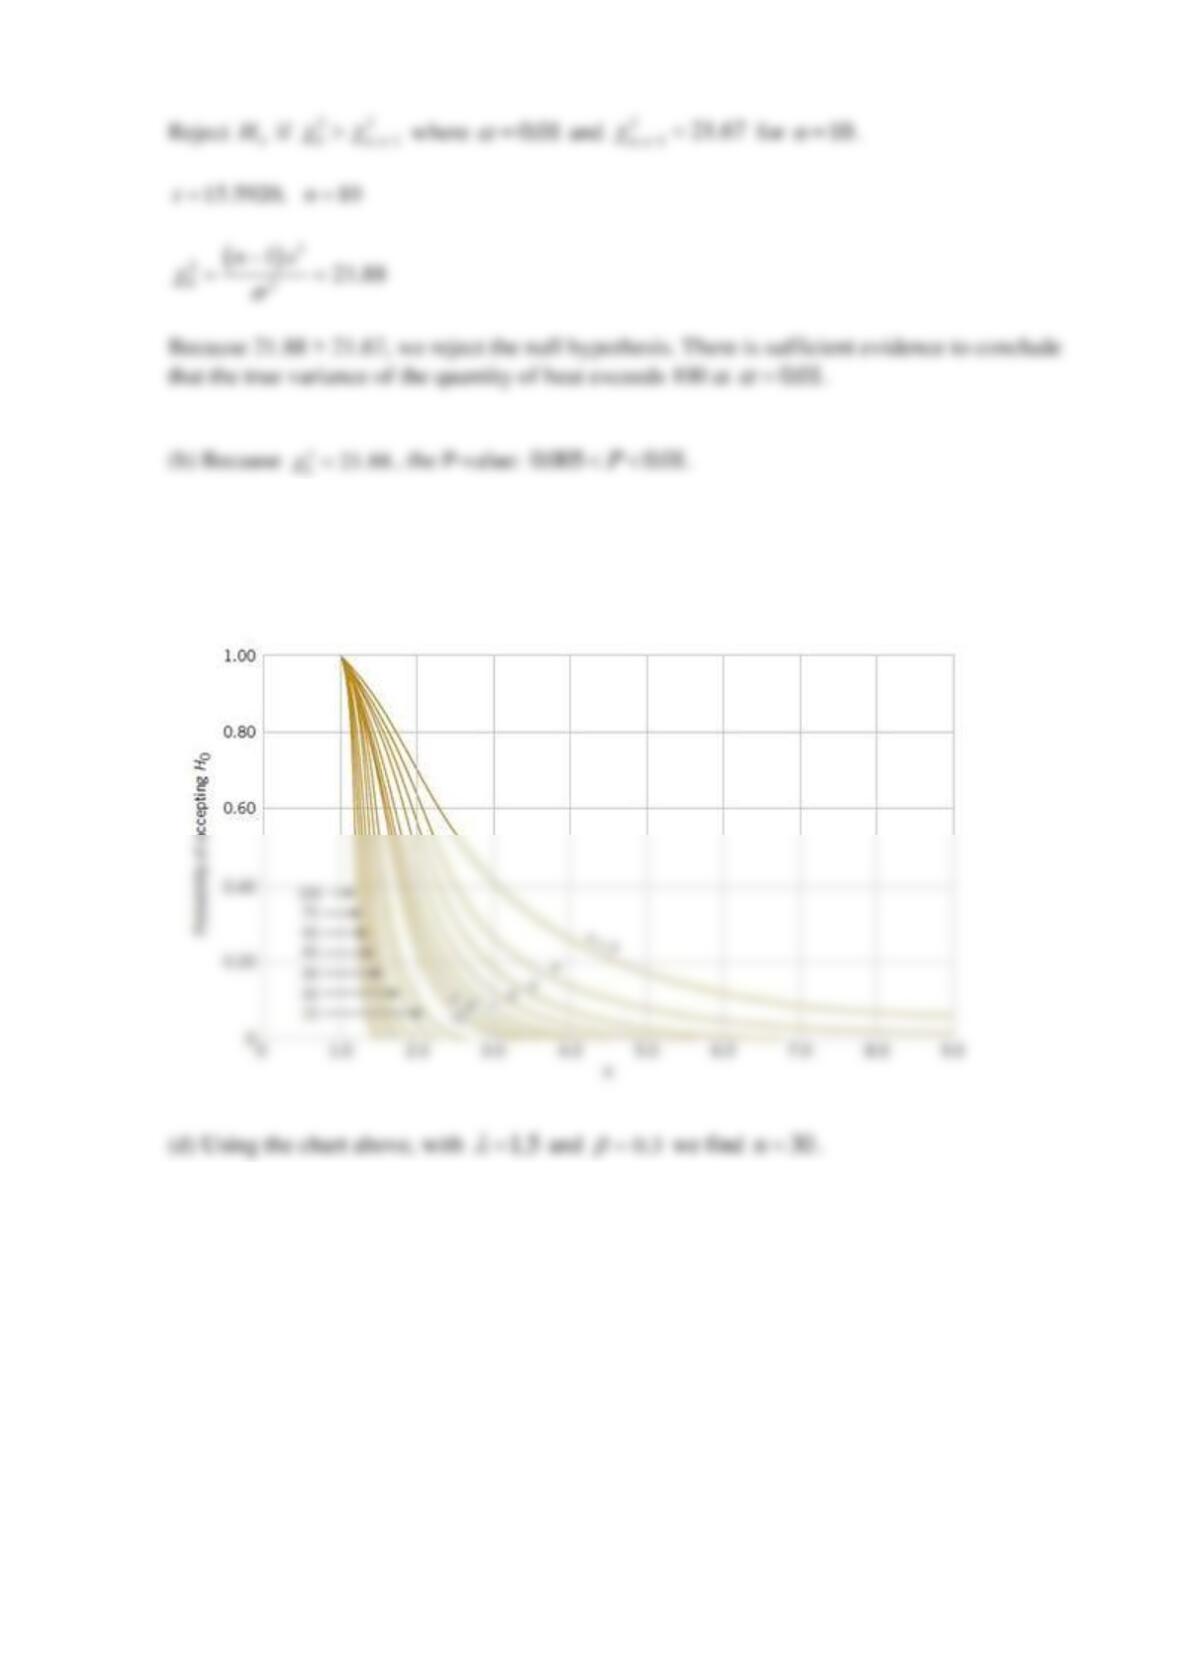
(c) Using the chart below, with
1.5
=
and
10n=
we find
0.7
=
. Therefore, the probability is
only 30%.
1.5
=
0.3
=
30n=
Reserve Problems Chapter 9 Section 4 Problem 3
Consider the test of
2
0:5H
=
against
2
1:5H
. What are the critical values for the test
statistic
2
0
for the following significance levels and sample sizes?
(a)
0.01
=
and
20n=
.
(b)
0.05
=
and
15n=
.
(c)
0.10
=
and
16n=
.
0.01
=
10n=
SOLUTION
a)
0.01
=
,
20n=
, from Table V we find
2
1 , 1 7.63
n
−−
=
.
Reserve Problems Chapter 9 Section 4 Problem 4
Consider the hypothesis test of
2
0:7H
=
against
2
1:7H
.
Approximate the P-value for each of the following test statistics.
(a)
2
025.2
=
and
20n=
.
(b)
2
015.2
=
and
12n=
.
(c)
2
023.0
=
and
15n=
.
SOLUTION
(a)
2
025.2
=
and
20n=
.
2(0.1) < P-value < 2(0.5), then 0.2 < P-value < 1
12n=
2
023.0
=
15n=
Reserve Problems Chapter 9 Section 4 Problem 5
An article in Technometrics (1999, Vol. 41, pp. 202–211) studied the capability of a gauge by
measuring the weight of paper. The data for repeated measurements of one sheet of paper are in
the following table.
Observations
3.481
3.448
3.485
3.475
3.472
3.477
3.472
3.464
3.472
3.470
3.470
3.470
3.477
3.473
3.474
In summary, the sample standard deviation from 15 measurements was 0.0083 grams.
(a) Does the measurement standard deviation differ from 0.01 grams at
0.05
=
?
Find
2
0
if
2 2 2 2
01
: 0.01 , : 0.01 .HH
=
Is it possible to reject
0
H
hypothesis at the 0.05 level
of significance? Find the P-value for this test.
Which confidence interval for
should be used to consider
0
H
hypothesis?
Construct a confidence interval for
to answer the question in part (a).
15n=
16n=
2
1 , 1 8.55
n
−−
=
(b) Find the P-value for this test.
(c) Construct a 99% two-sided confidence interval for
to consider
0
H
hypothesis.
SOLUTION
Does the measurement standard deviation differ from 0.01 grams at
0.05
=
?
Find
2
0
if
2 2 2 2
01
: 0.01 , : 0.01 .HH
=
In order to use the
2
statistic in hypothesis testing and confidence interval construction, we need
to assume that the underlying distribution is normal.
Reserve Problems Chapter 9 Section 4 Problem 6
An Izod impact test was performed on 19 specimens of PVC pipe, the sample standard deviation
was 0.25.
(a) Test the hypothesis that
0.10
=
against an alternative specifying that
0.10
, using
0.01
=
. State any necessary assumptions about the underlying distribution of the data.
Find
2
0
. Is it possible to reject
0
H
hypothesis at the 0.01 level of significance?
0
H
0
H
0
H
0
H
0
H
SOLUTION
(a)
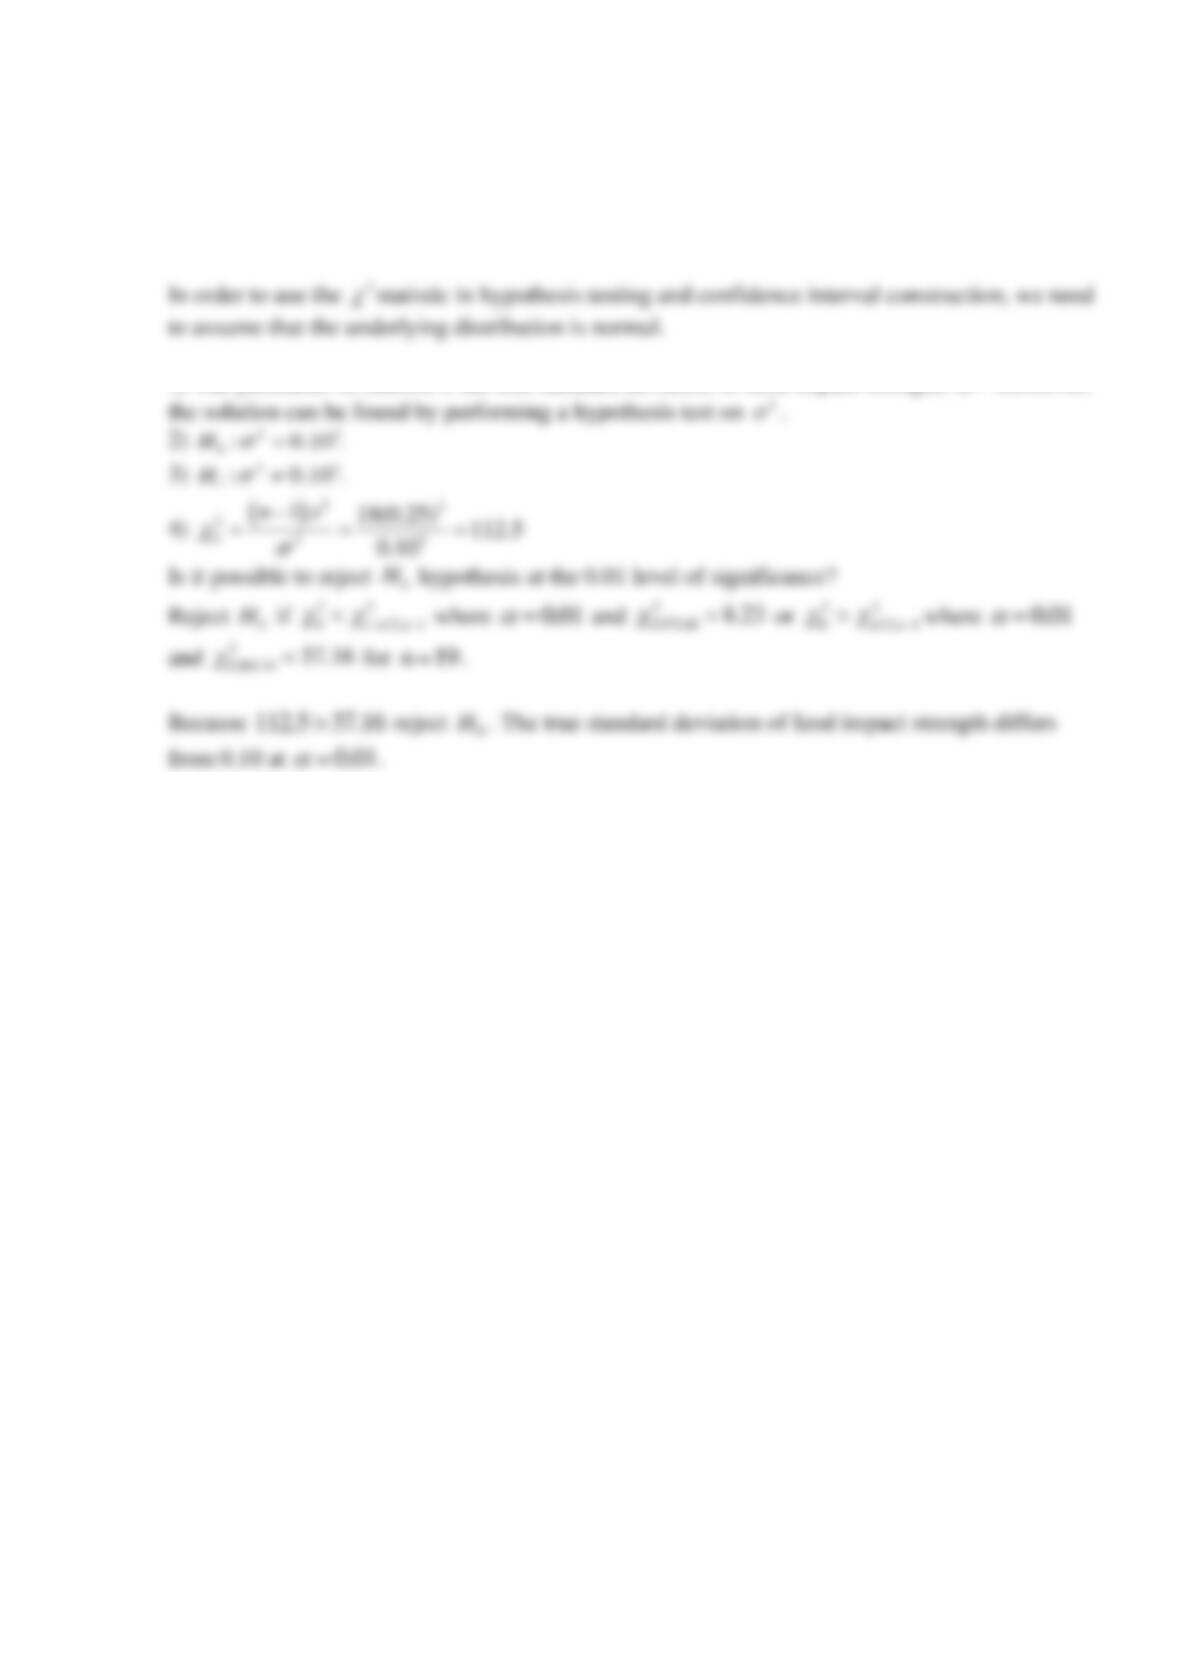
1) The parameter of interest is the true standard deviation of Izod impact strength,
. However,
0
H
0
H
0.01
=
0.01
=
19n=
0
H
Reserve Problems Chapter 9 Section 4 Problem 7
The sugar content of the syrup in canned peaches is normally distributed. Suppose that the
variance is thought to be
22
18 ( )milligrams
=
. A random sample of
10n=
cans yields a
sample standard deviation of
4.8s=
milligrams.
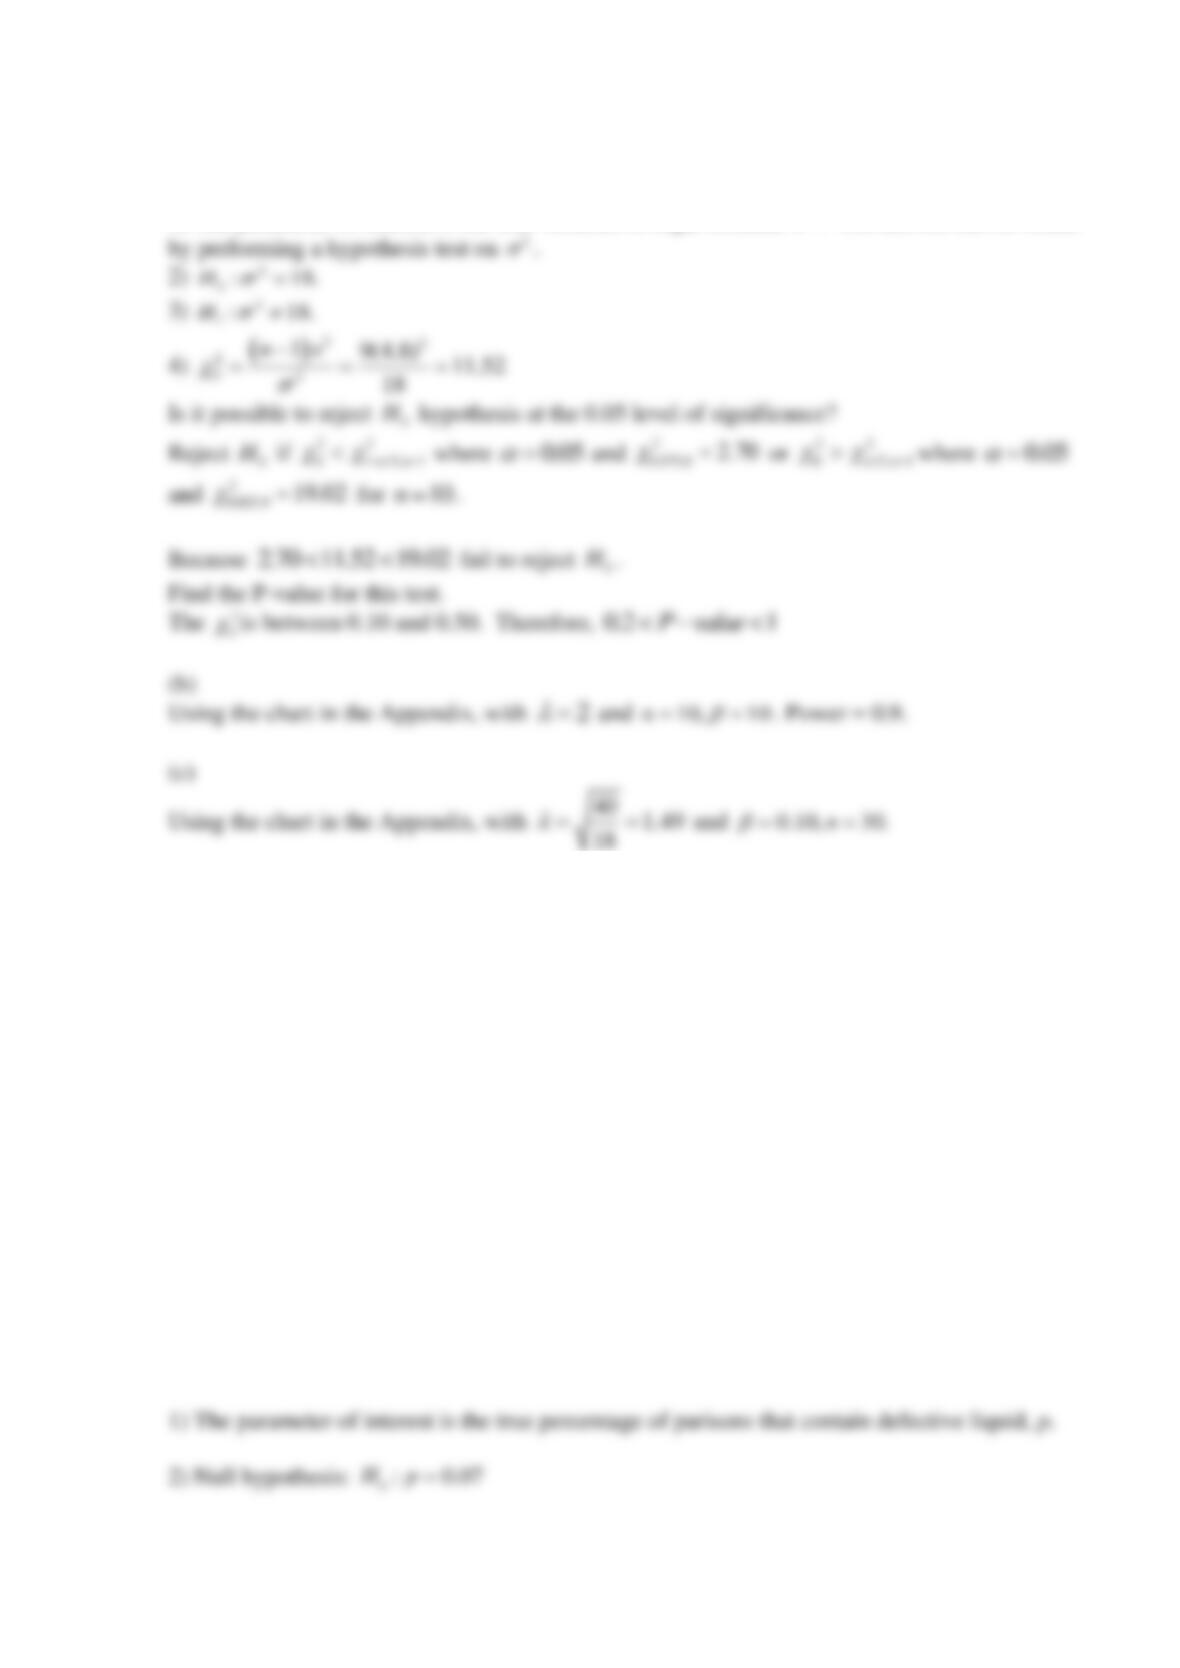
(a) Test the hypothesis
2
0: 18H
=
versus
2
1: 18H
using
0.05
=
Find X2
0 .
Is it possible to reject
0
H
hypothesis at the 0.05 level of significance?
Find the P-value for this test.
(b) Suppose that the actual standard deviation is twice as large as the hypothesized value. What
is the probability that this difference will be detected by the test described in part (a)?
(c) Suppose that the true variance is
240
=
. How large a sample would be required to detect
this difference with probability at least 0.90?
SOLUTION
(a)
In order to use the
2
statistic in hypothesis testing and confidence interval construction, we need
to assume that the underlying distribution is normal.
1) The parameter of interest is the true variance of sugar content,
2
. The answer can be found
Reserve Problems Chapter 9 Section 5 Problem 1
A manufacturer of soap bubble liquid will test a new solution formula. The solution will be
approved, if the percent of produced parisons, in which the content does not allow the bubbles to
inflate, does not exceed 7%. A random sample of 700 parisons contains 55 defective parisons.
Use the z-values rounded to three decimal places to obtain the answers.
(a) Formulate and test an appropriate set of hypotheses to determine whether the solution can be
approved. Use
0.05
=
. Find the P-value.
(b) Find a 95% upper confidence bound on P.
SOLUTION
(a)
2
0.05
=
0.05
=
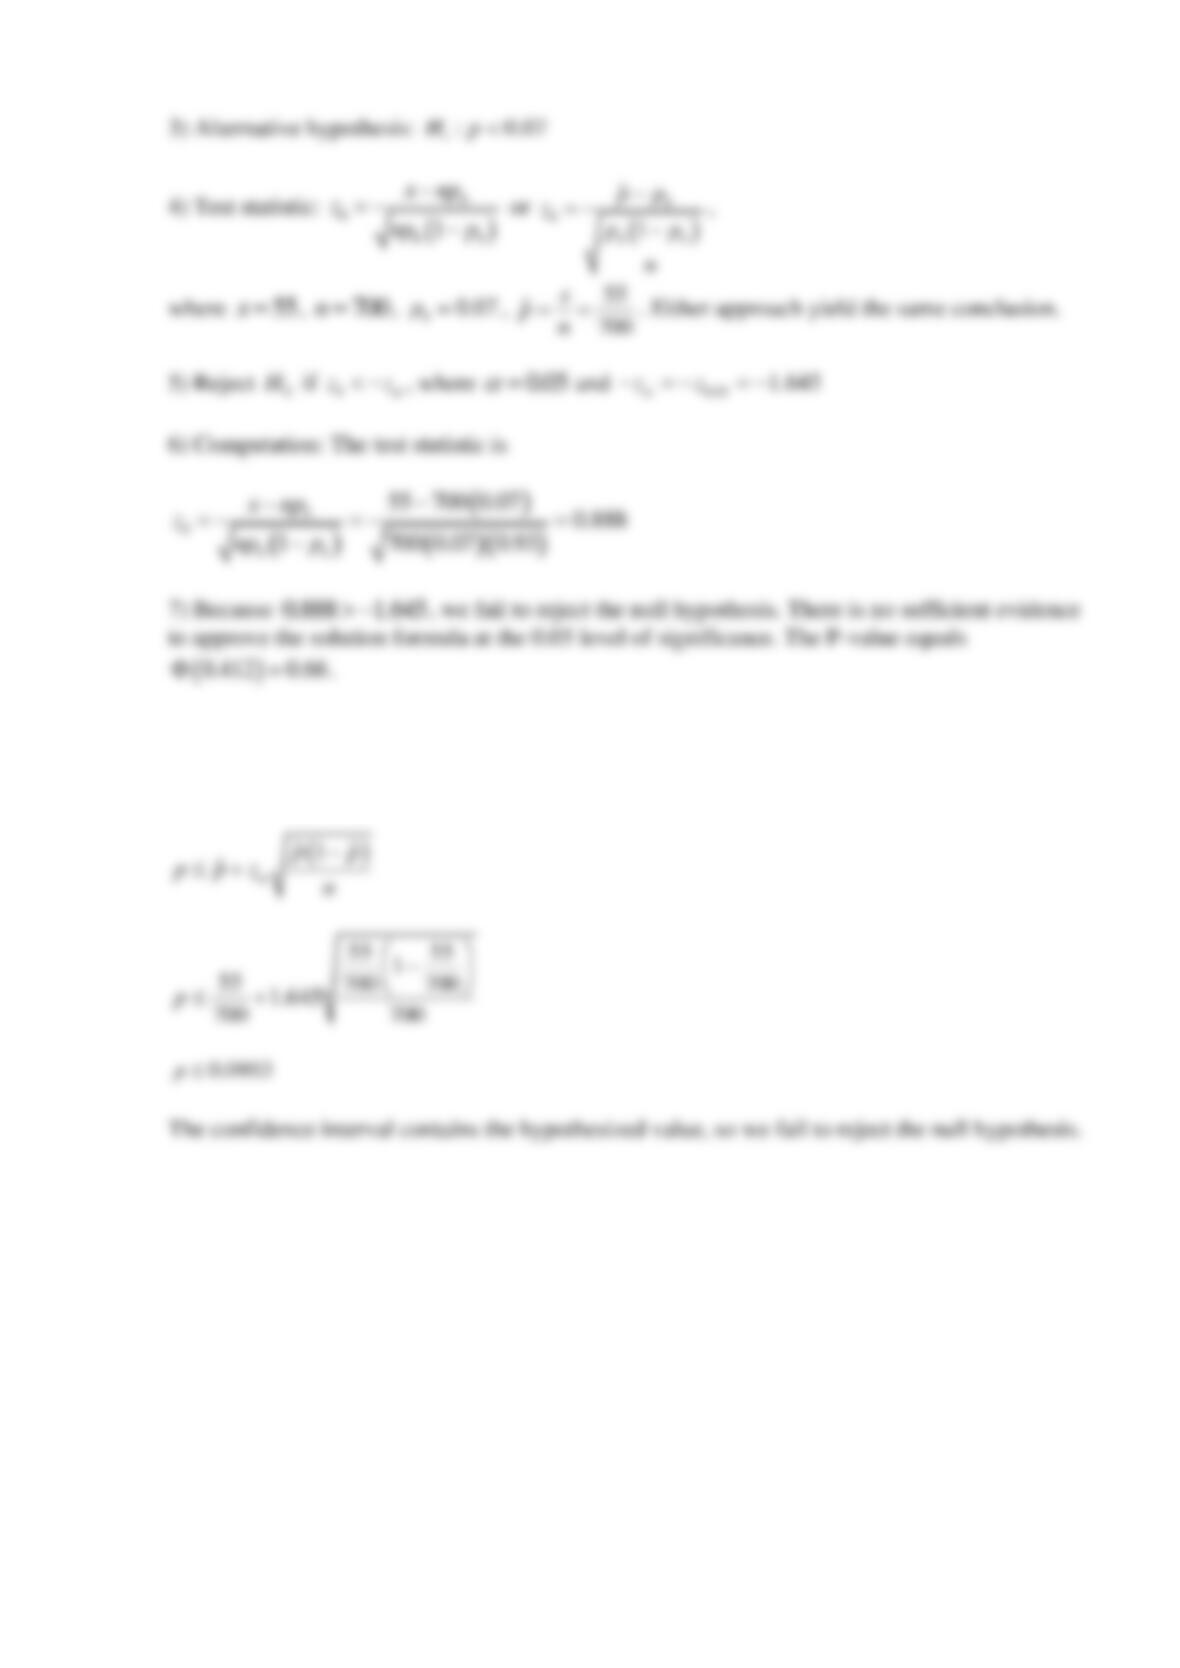
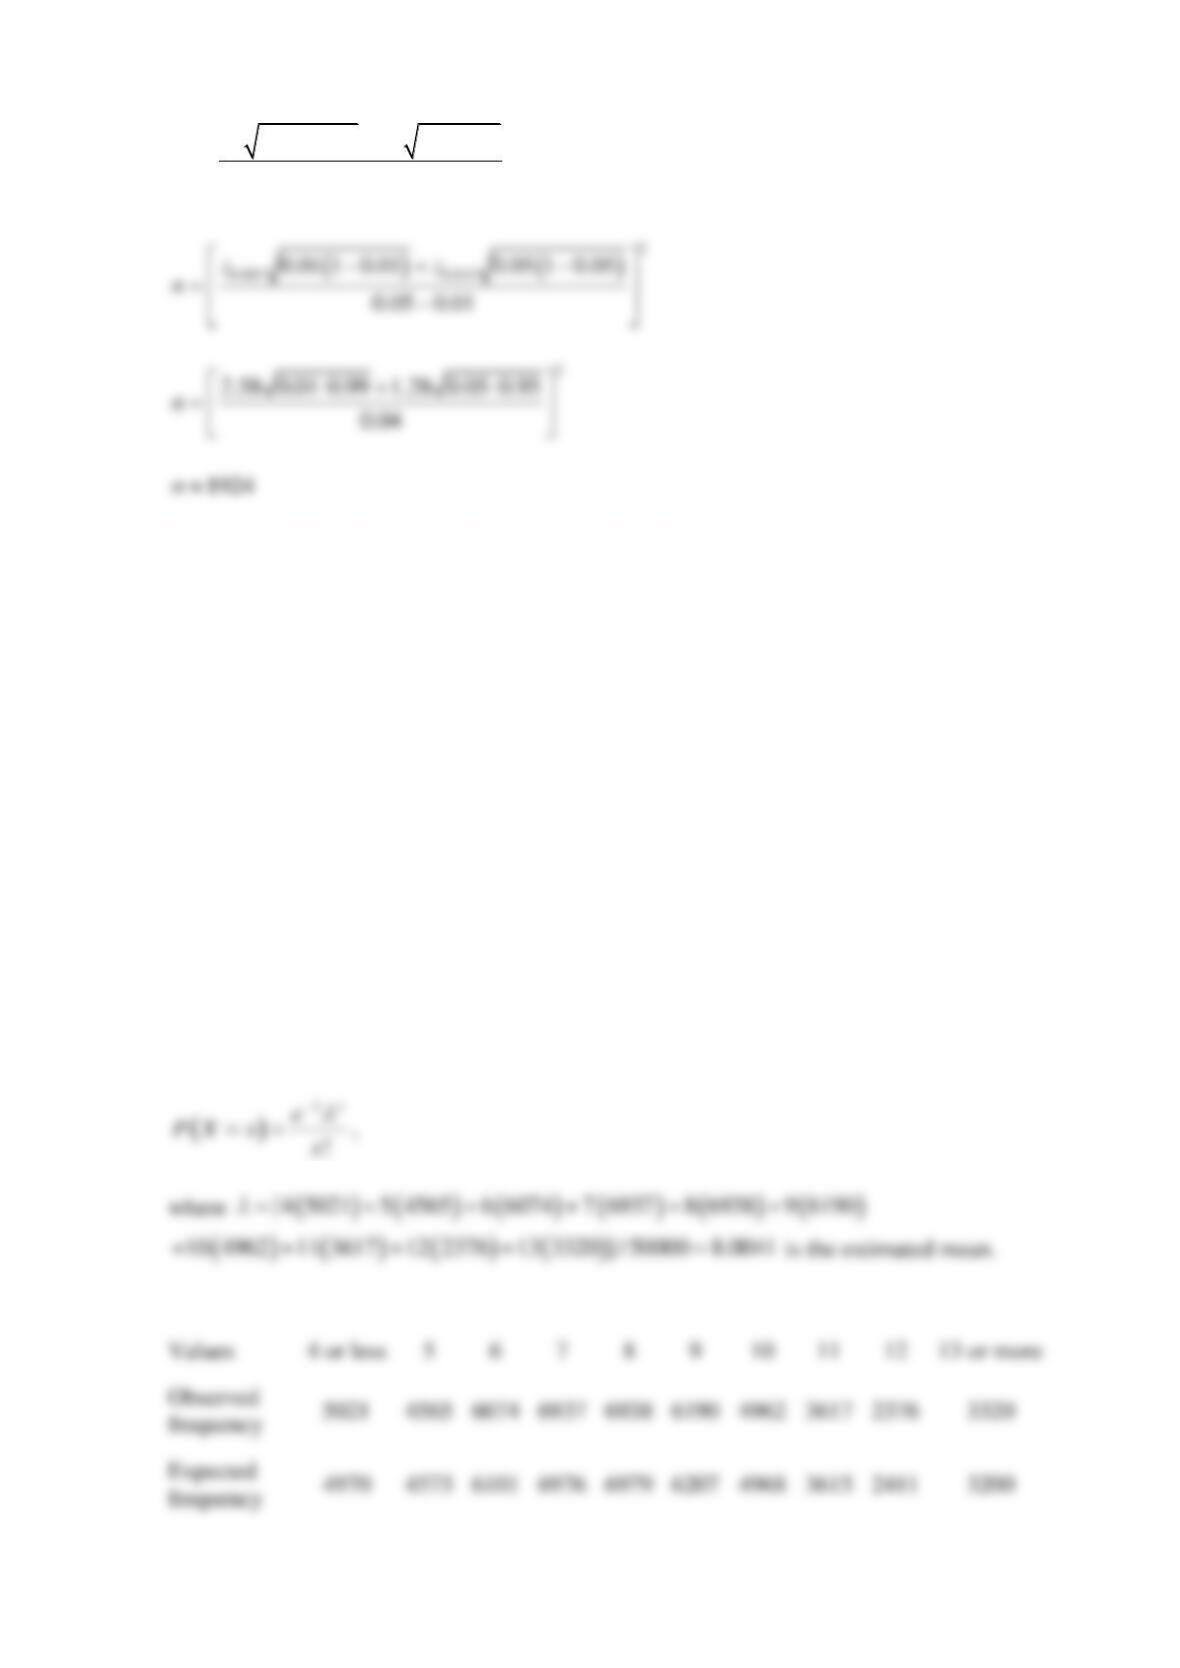
(b) The 95% upper confidence limit is:
Reserve Problems Chapter 9 Section 5 Problem 2
A new technology for the production of integrated circuits is being mastered. The technology
will be rejected if the percentage of the defective integrated circuits exceeds 1%.
How many integrated circuits have to be checked to make sure that the technology gives a
sufficiently small amounts of defects with a probability of 10% if the actual probability is
0.05p=
? Use
0.005
=
.
SOLUTION
( ) ( )
2
00
0
11z p p z p p
npp
− + −
=−
Reserve Problems Chapter 9 Section 5 Problem 3
A new technology for the production of integrated circuits is being mastered. The technology
will be rejected if the percentage of the defective integrated circuits exceeds 1%. 1,000,000
transistors are located in the integrated circuit. The integrated circuit is defective if there are
more than 10 malfunctioning transistors. Let X denote the number of defective transistors
observed in the integrated circuit. Of 50,000 integrated circuits inspected, the following data
were observed for the values of X:
Values
4 or less
5
6
7
8
9
10
11
12
13 or more
Observed
frequency
5021
4565
6074
6937
6938
6190
4962
3617
2376
3320
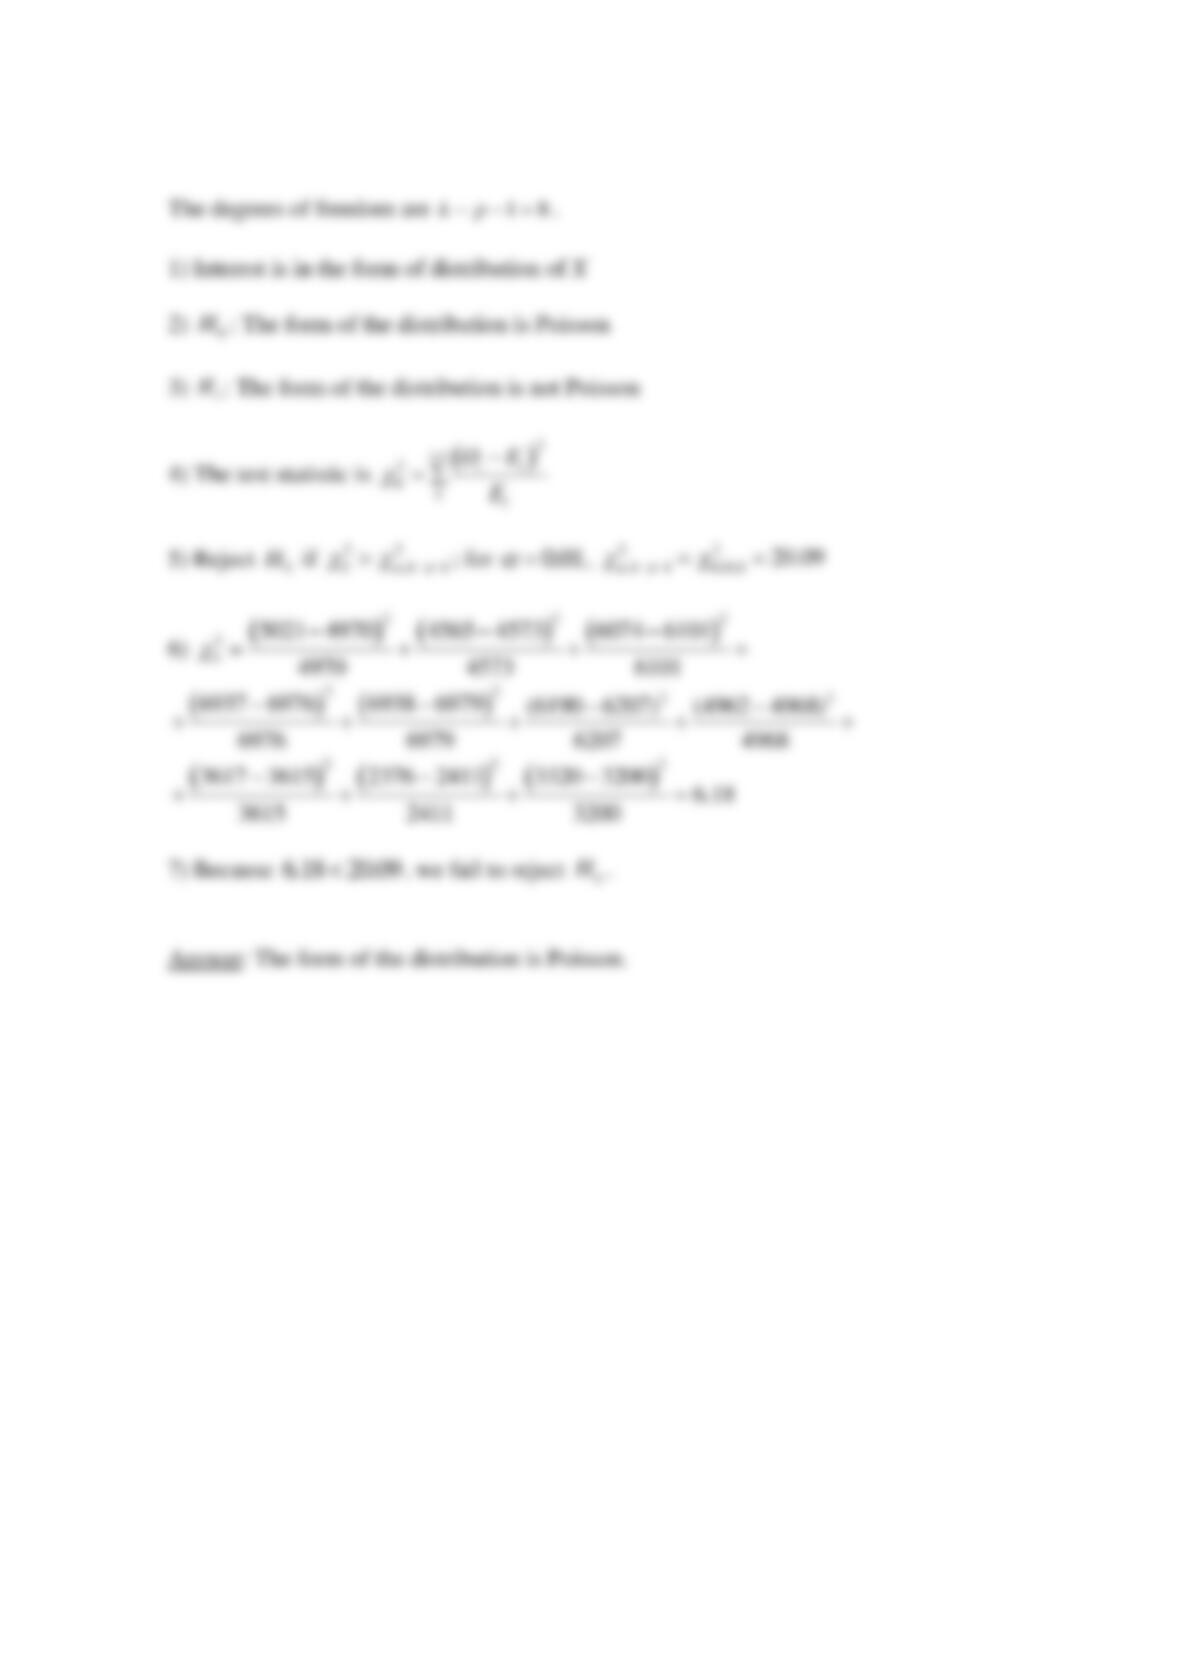
Does the assumption of the Poisson distribution seem appropriate as a probability model for
these data? Use
0.01
=
.
SOLUTION
The expected frequency is found from the Poisson distribution
Reserve Problems Chapter 9 Section 5 Problem 4
A new technology for the production of liquid-crystal displays (LCD) is being mastered.
8,000,000 pixels are located on the LCD. The LCD is defective if there are more than 5
malfunctioning pixels. Let X denote the number of defective pixels observed on the LCD. Of
3000 LCD inspected, the following data were observed for the values of X:
Values
1 or less
2
3
4
5
6
7
8 or more
Observed
frequency
125
266
437
523
517
420
327
385
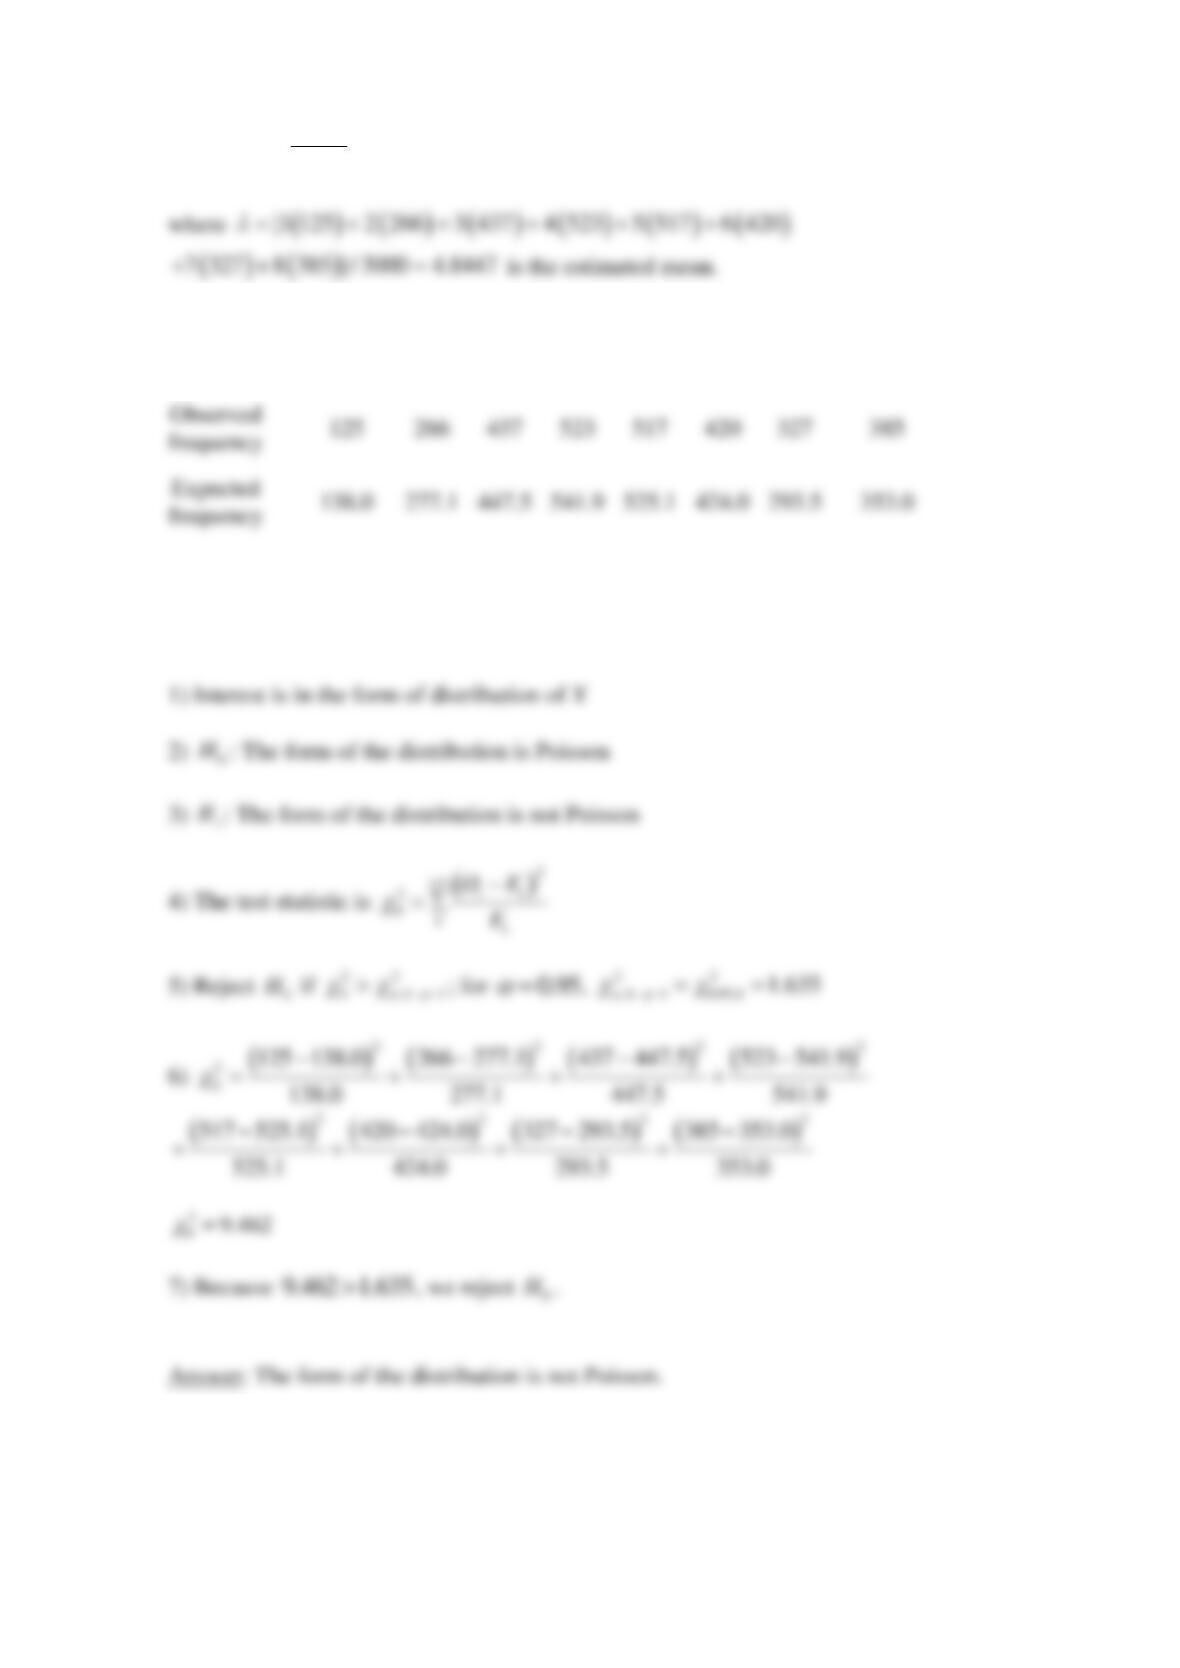
Does the assumption of the Poisson distribution seem appropriate as a probability model for
these data? Use
0.95
=
.
SOLUTION
The expected frequency is found from the Poisson distribution
0.01
=
( )
!
x
e
P X x x
−
==
,
Values
1 or less
2
3
4
5
6
7
8 or more
frequency
frequency
The degrees of freedom are
16kp− − =
.
Reserve Problems Chapter 9 Section 5 Problem 5
Consider the following computer output
Test and CI for One Proportion
Test of
0.6p=
vs
0.6p
X
N
Sample p
95% Upper
Bound
Z-value
P-Value
287
494
?
?
?
?
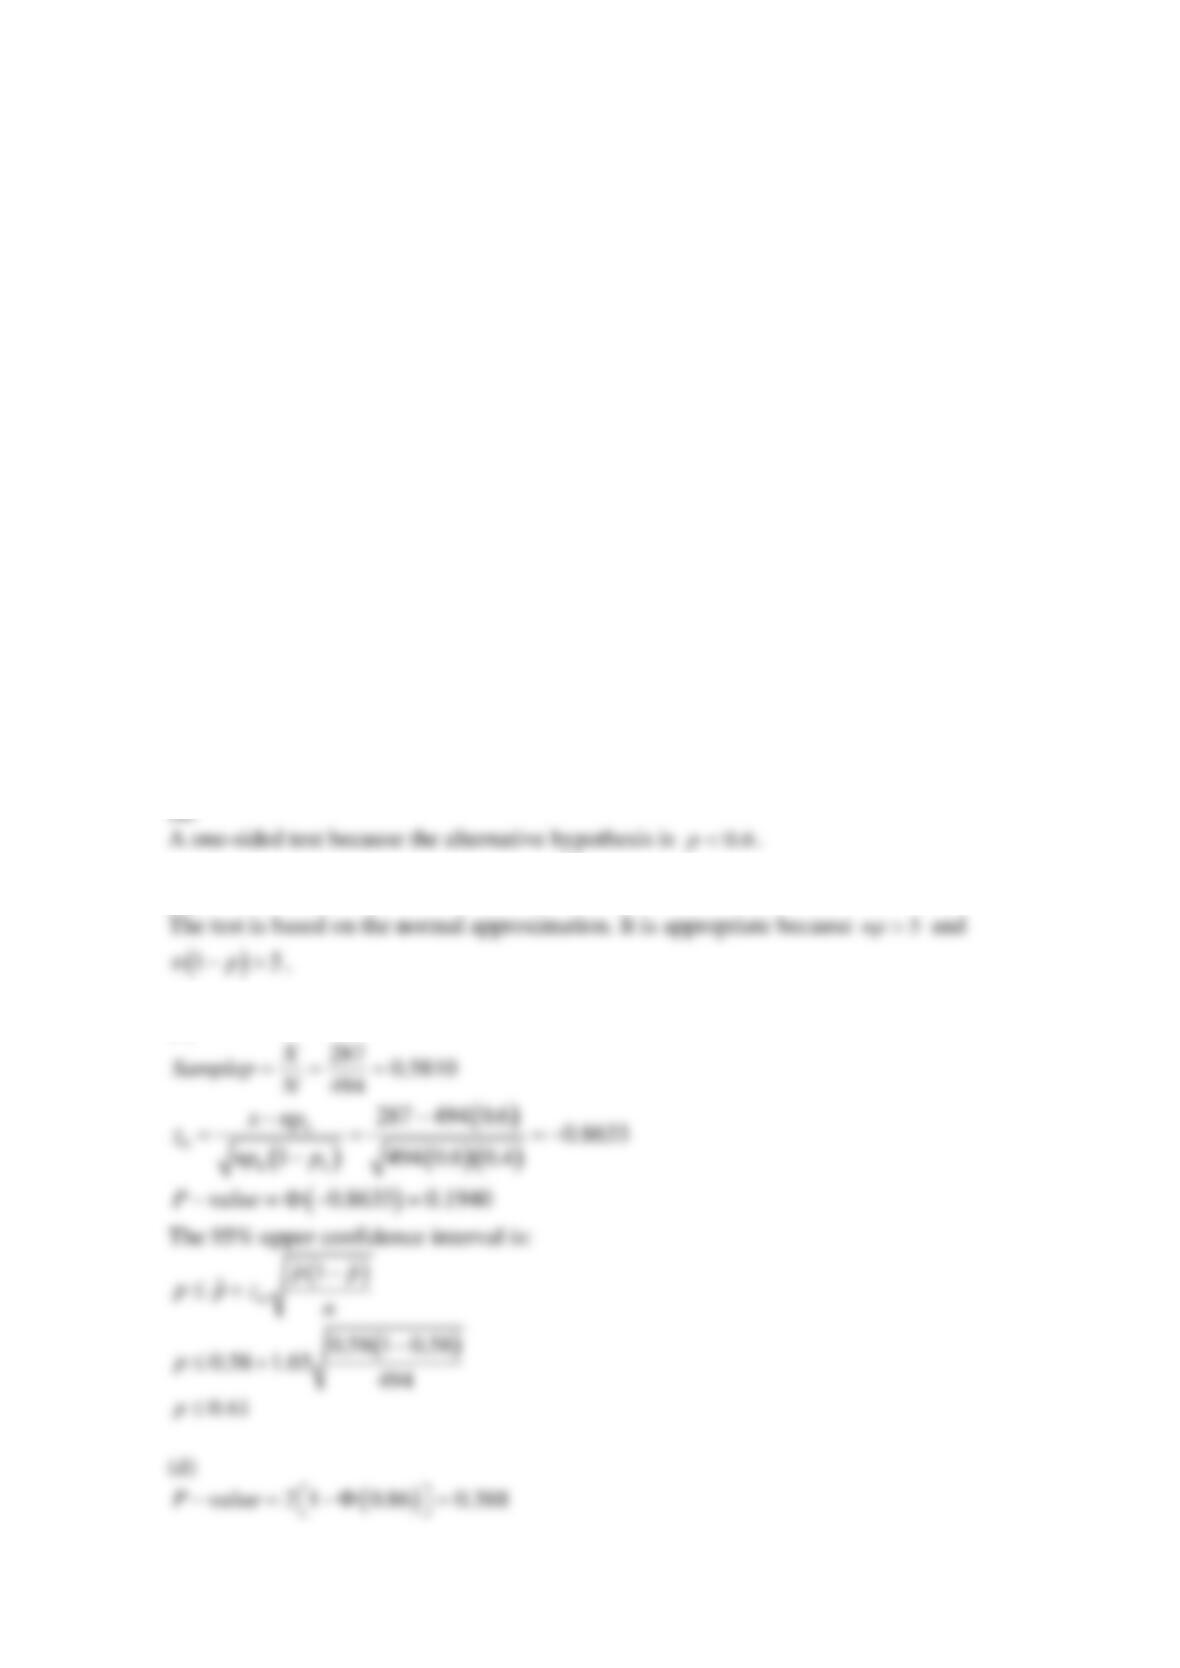
(a) Is this a one-sided or a two-sided test?
(b) Is this a test based on the normal approximation? Is that appropriate?
(c) Complete the missing items.
Round your answers to two decimal places (e.g. 98.76).
Sample p =
95%upper bound =
Z Value−=
P Value−=
(d) Suppose that the alternative hypothesis was two-sided. What is the P-value for this situation?
SOLUTION
(b)
(c)
Reserve Problems Chapter 9 Section 5 Problem 6
In a random sample of 85 automobile engine crankshaft bearings, 10 have a surface finish
roughness that exceeds the specifications. Do these data present strong evidence that the
proportion of crankshaft bearings exhibiting excess surface roughness exceeds 0.10?
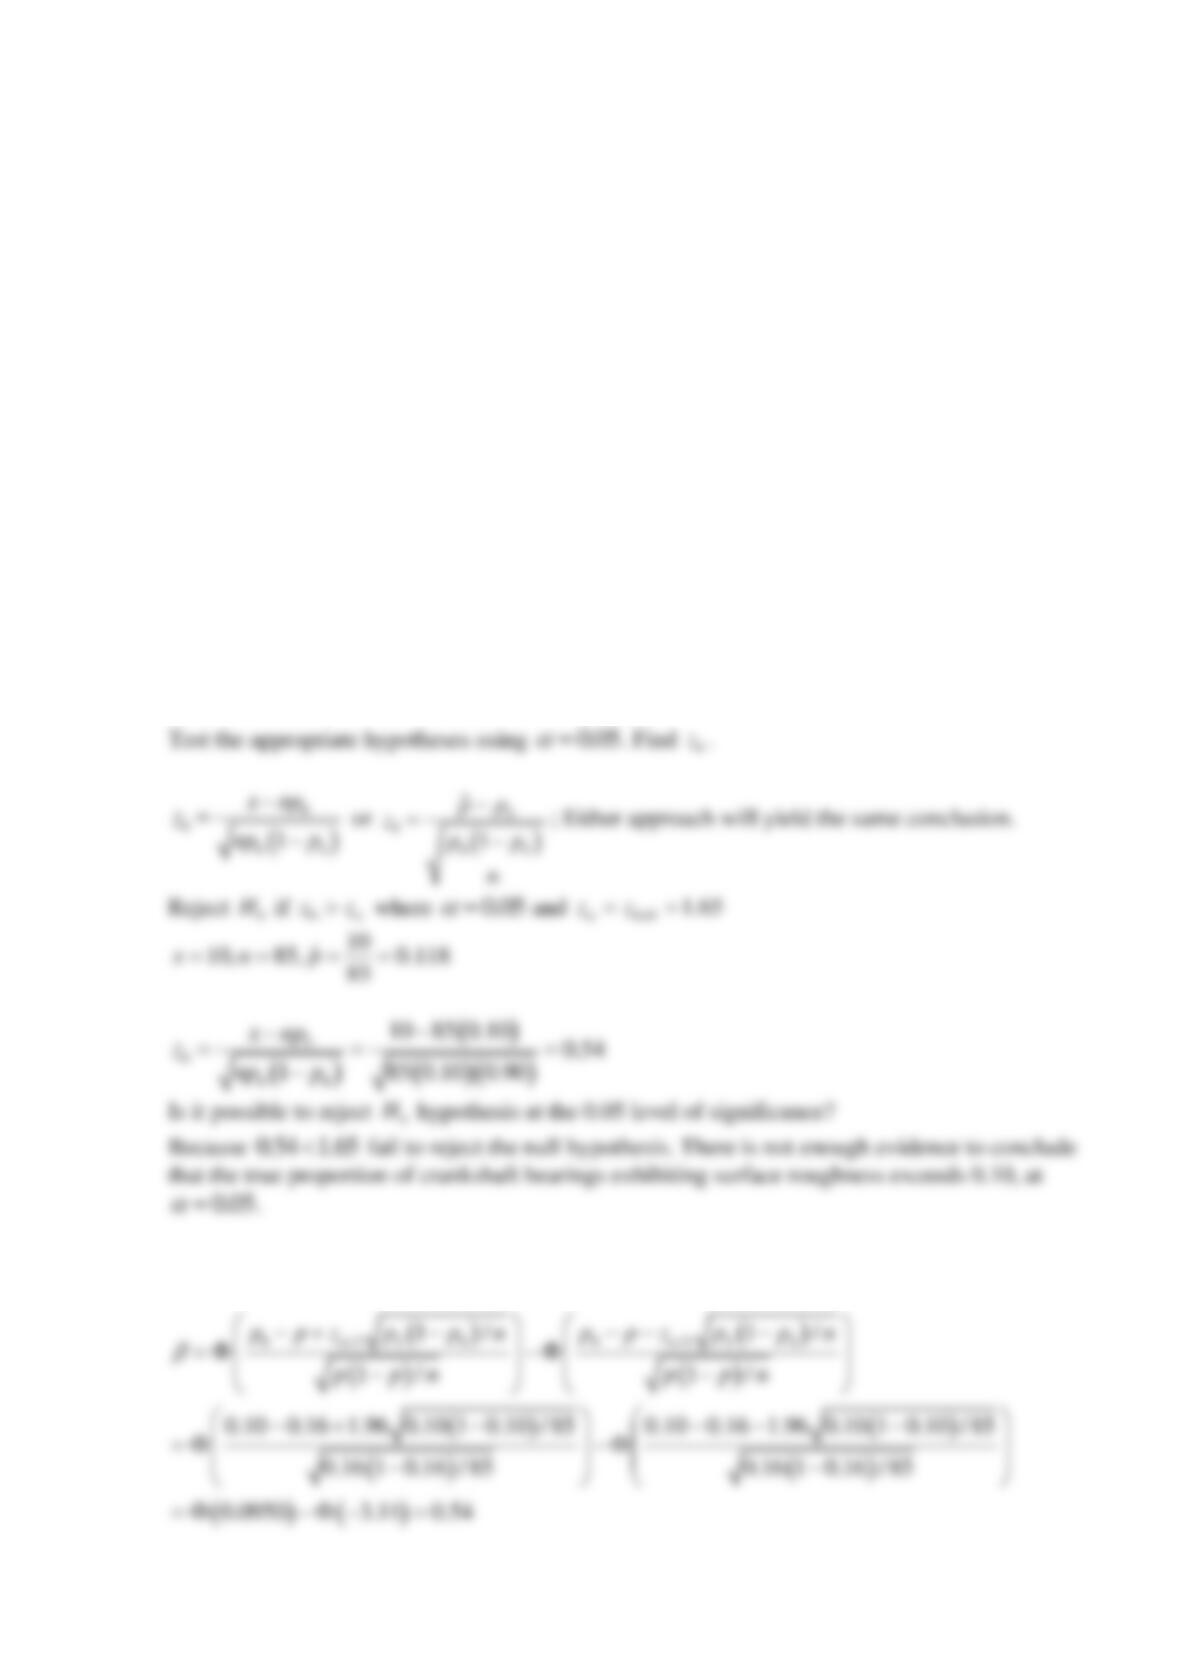
(a) State the appropriate hypotheses. Test the appropriate hypotheses using
0.05
=
. Find
0
z
. Is
it possible to reject
0
H
hypothesis at the 0.05 level of significance?
(b) If it is really the situation that
0.16p=
, how likely is it that the test procedure in part (a) will
not reject the null hypothesis?
(c) If
0.16p=
, how large would the sample size have to be for us to have a probability of
correctly rejecting the null hypothesis of 0.9?
SOLUTION
(a)
The parameter of interest is the true proportion of engine crankshaft bearings exhibiting surface
roughness.
0: 0.10Hp=
and
1: 0.10Hp
(b)
0
0.16, 0.10, 85p p n= = =
and
/2 1.96z
=
0
H
0.05
=
0
H