Applied Statistics and Probability for Engineers, 7th edition 2017
9-1
CHAPTER 9
Section 9.1
9.1.1 a) H0: μ= 25, H1: μ 25 Yes, because the hypothesis is stated in terms of the parameter of interest, inequality is in the
alternative hypothesis, and the value in the null and alternative hypotheses matches.
9.1.3 a)
= P(reject H0 when H0 is true)
9.1.4 a)
= =
−−
==
−=
11.
11.5 1 5
2 4 0
12
( | ) ( )
/ 0.5 / 16
X
XPP P Z
n
.
9.1.5 a)
=11.25,x
then
−
= − =
=
11.25 12 ( 3) 0.00135
0.5 / 4
-value P Z ZP P
Applied Statistics and Probability for Engineers, 7th edition 2017
9-2
9.1.6 a)
( )
= = = = − =11.59 11.5 0.36 1 0.6406 0.359( | ) 4P µ P ZX
9.1.7 a)
= =185 when 5()17P X
9.1.8 a)
= 0.05, n = 10, then the critical value 185.37 (from the previous exercise part b))
9.1.9
+
20
175XZ
n
9.1.10 a)
= = + =()4.85 when 5 5.15 when 5()XPXP
Applied Statistics and Probability for Engineers, 7th edition 2017
9-3
9.1.11 X ~ bin(15, 0.4) H0: p = 0.4 and H1: p 0.4
9.1.12 X ~ bin(10, 0.3) Implicitly, H0: p = 0.3 and H1: p < 0.3
n = 10
Applied Statistics and Probability for Engineers, 7th edition 2017
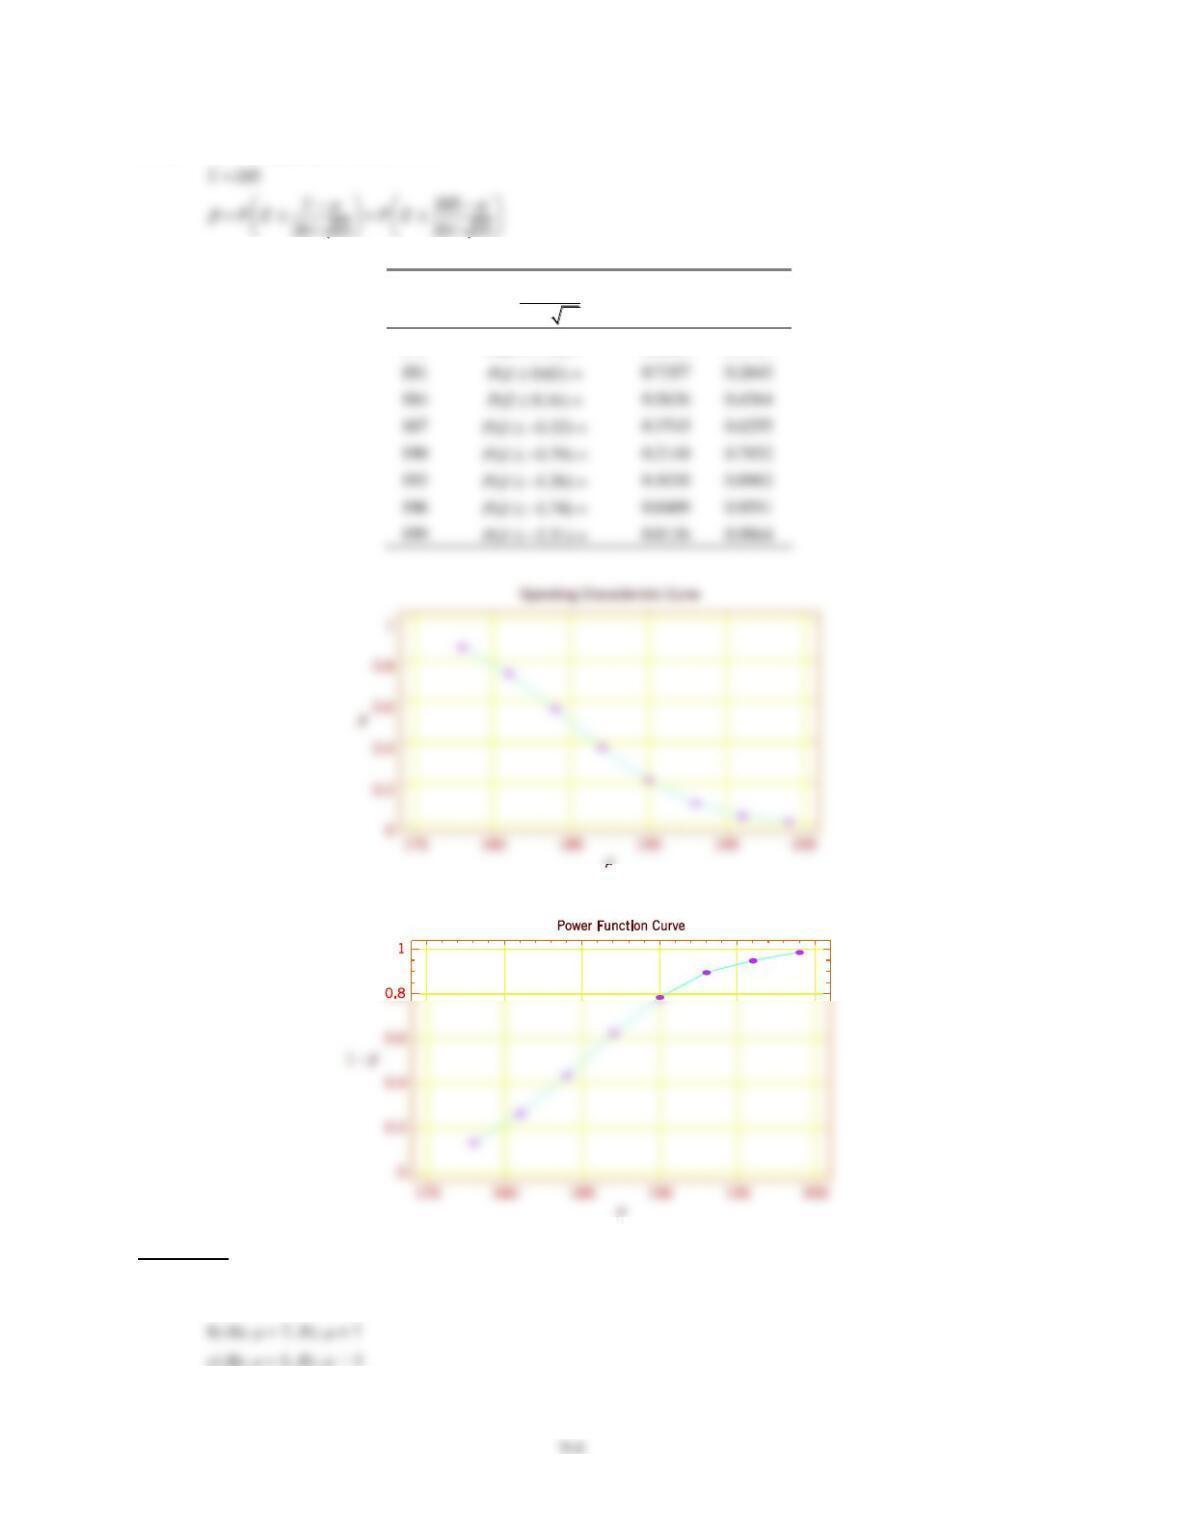
9.1.13 a) Operating characteristic curve:
μ
−
=
185
20 / 10
PZ
1 −
178
P(Z 1.11) =
0.8665
0.1335
181
P(Z 0.63) =
0.7357
0.2643
P(Z 0.16) =
187
0.3745
0.6255
190
0.2148
0.7852
193
0.1038
0.8962
199
0.0136
0.9864
b)
Section 9-2
9.2.1 a) H0: μ = 10, H1: μ > 10
9-5
9.2.2 a)
= 0.01, then a = Z1−
≅ −2.33
9.2.3 a)
==StDev SE Mean 0.7495N
c) 95% CI of the mean is
− +
0.025 0.025
x z x z
nn
9.2.4 a) P-value = 1 − (Z0) = 1 − (2.05) ≅ 0.02
9.2.5 a) SE Mean from the sample
= = =st 2.365 0.6827andard devi 12
ation s
N
9.2.6 a)
1) The parameter of interest is the true mean crankshaft wear,
.
Applied Statistics and Probability for Engineers, 7th edition 2017
9.2.7 a)
1) The parameter of interest is the true mean battery life in hours,
.
9.2.8 a)
1) The parameter of interest is the true mean speed,
.
9-7
9.2.9 a)
1) The parameter of interest is the true average battery life,
.
Applied Statistics and Probability for Engineers, 7th edition 2017
9-8
9.2.10 a) The alternative hypothesis should be one-sided because the scientists are interested in high adhesion.
b)
Section 9-3
9.3.1 a)
= 0.01, n = 20, the critical value = 2.539
9.3.2 a)
= = =
0.717 0.1603
2
SE M 0
ean S
N
9.3.3 a) 2 * 0.025 ≤ p ≤ 2 * 0.05, then 0.05 ≤ p ≤ 0.1
Applied Statistics and Probability for Engineers, 7th edition 2017
9-9
9.3.4 a) degrees of freedom = N – 1 = 16 – 1 = 15
c) 0.01< p-value < 0.02.
9.3.5 a) 1 – 0.05 ≤ p ≤ 1 − 0.025, then 0.95 ≤ p ≤ 0.975
9.3.6 a)
1) The parameter of interest is the true mean interior temperature life,
.
Applied Statistics and Probability for Engineers, 7th edition 2017
9-10
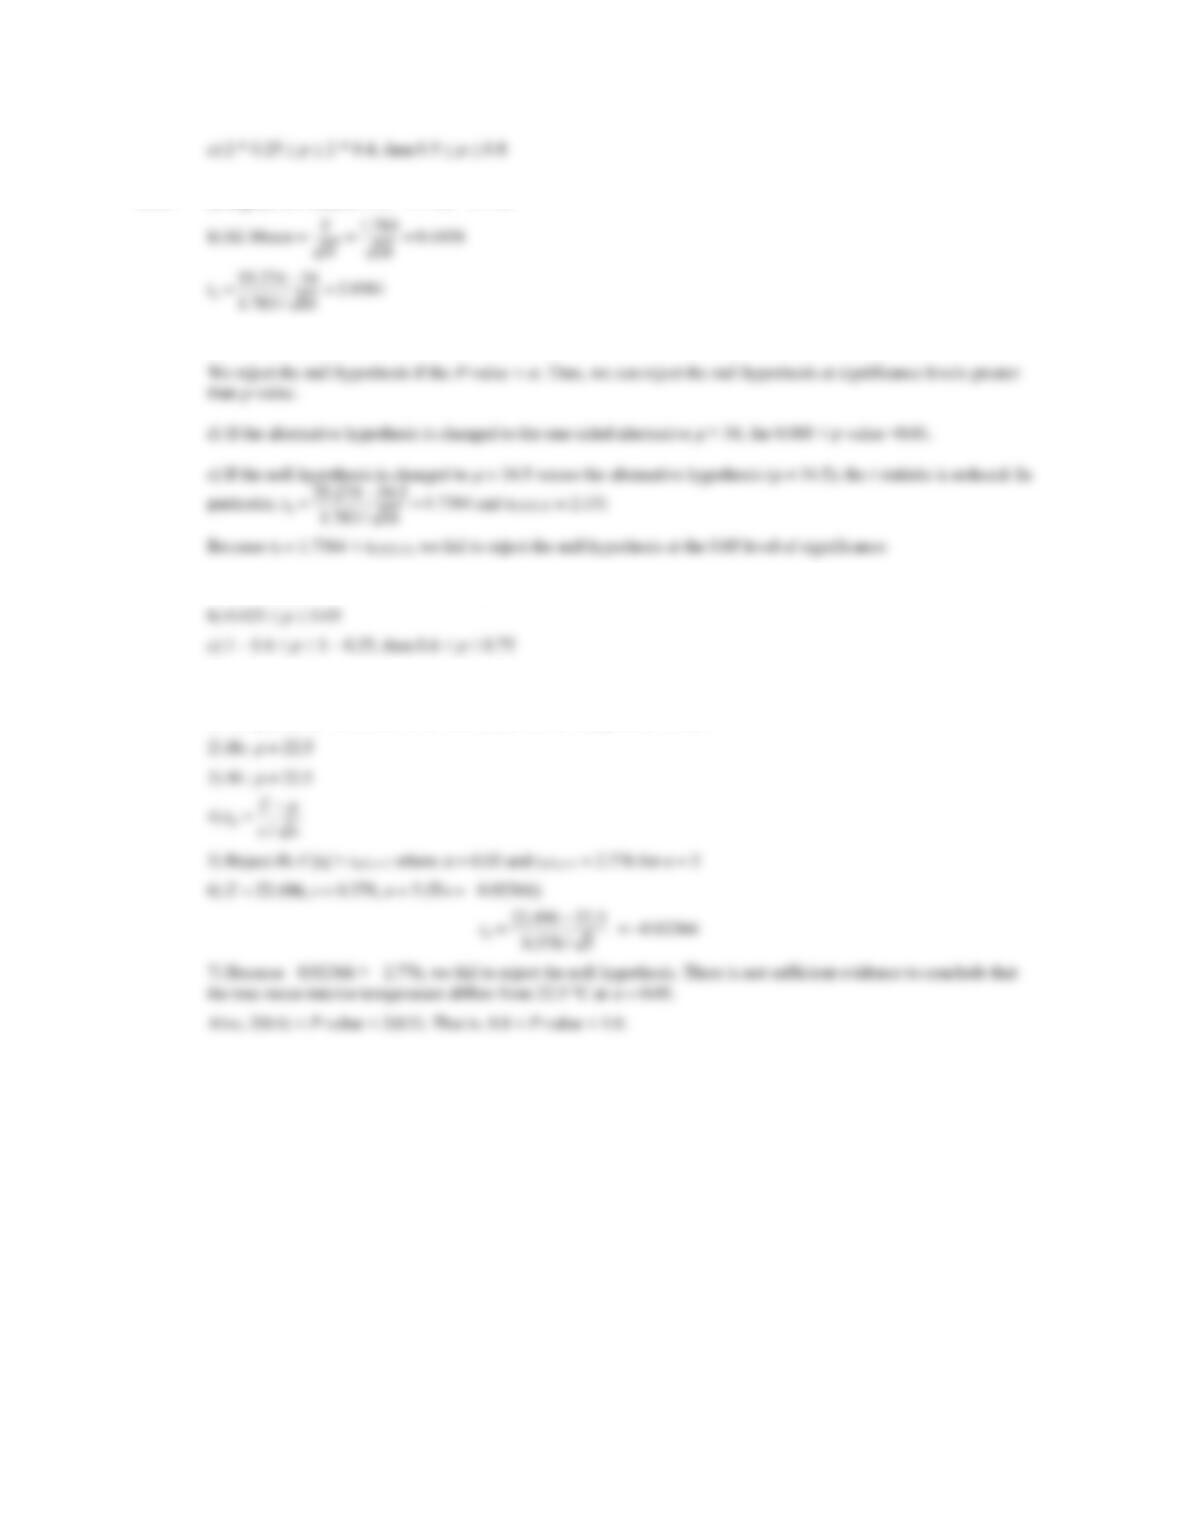
b) The points on the normal probability plot fall along a line. Therefore, the normality assumption is reasonable.
c)
−−
= = == 0
| | | 22.75 22.5 | 0.66
0.378
d
9.3.7 a)
1) The parameter of interest is the true mean of body weight,
.
−−
= = == 0
| | | 22.75 22.5 | 0.66
0.378
d
Applied Statistics and Probability for Engineers, 7th edition 2017
9-11
9.3.8 a)
1) The parameter of interest is the true mean rainfall,
.
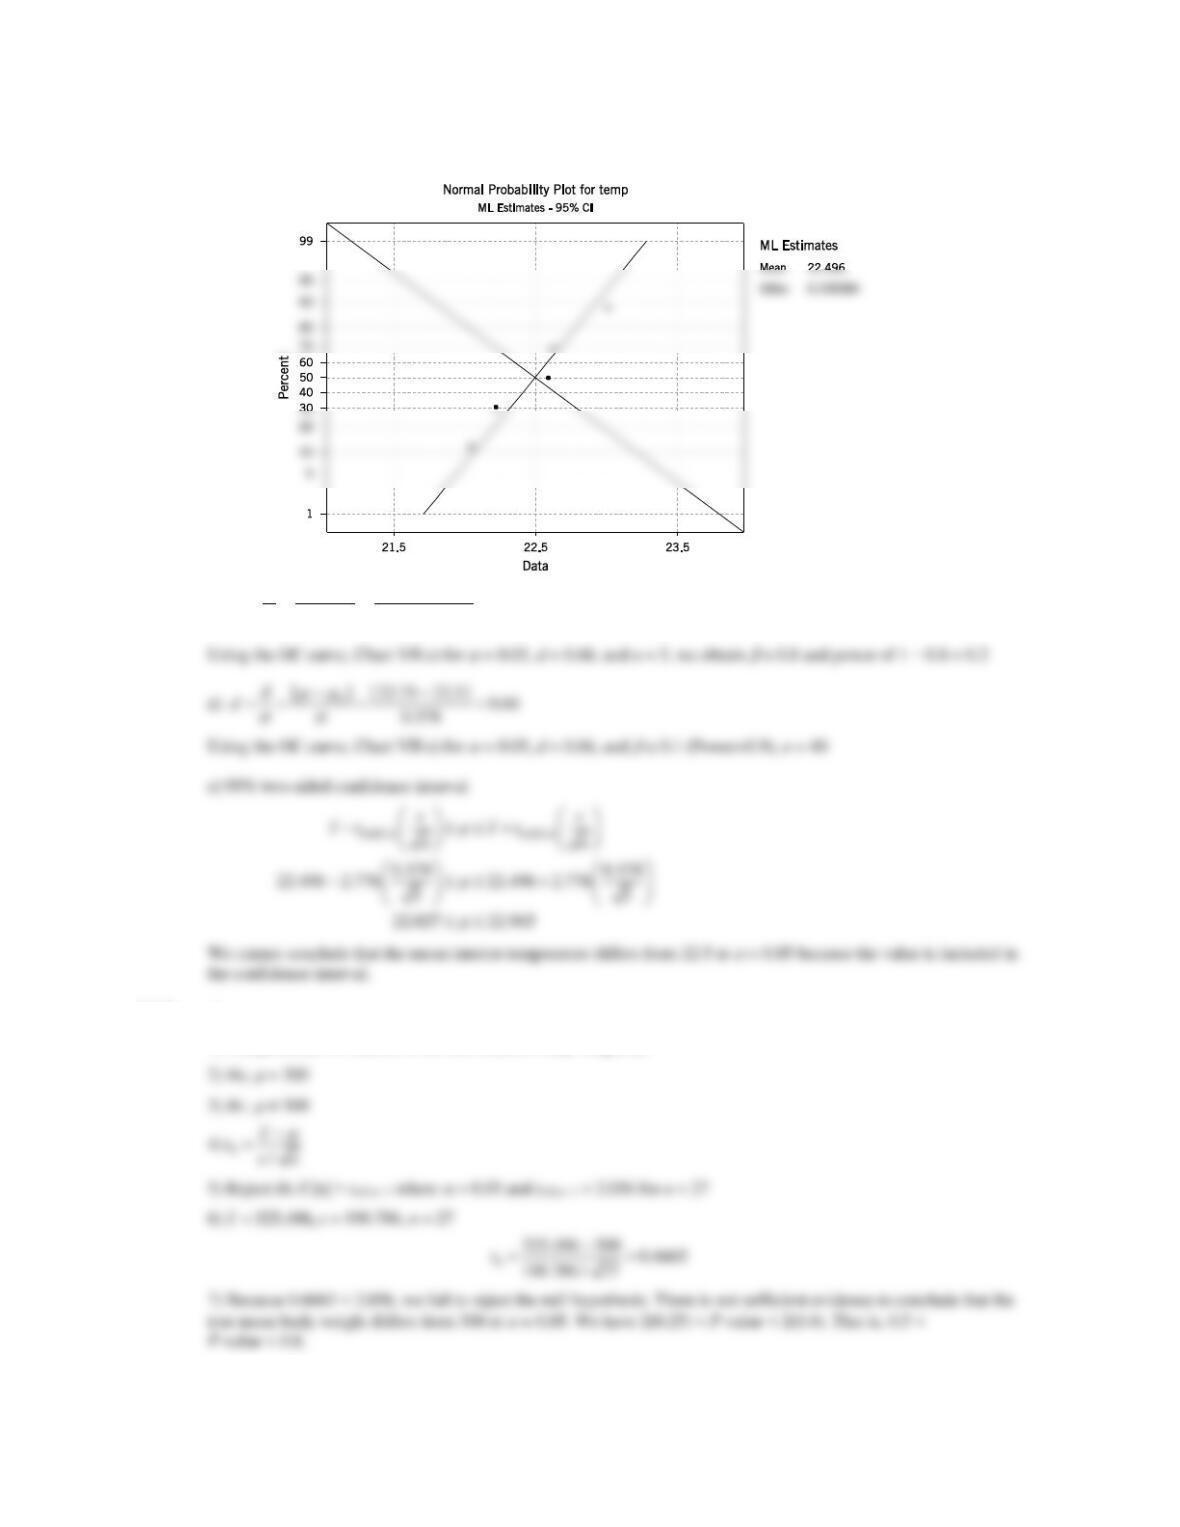
b) The data on the normal probability plot falls along a line. Therefore, the normality assumption is reasonable.
Applied Statistics and Probability for Engineers, 7th edition 2017
9-12
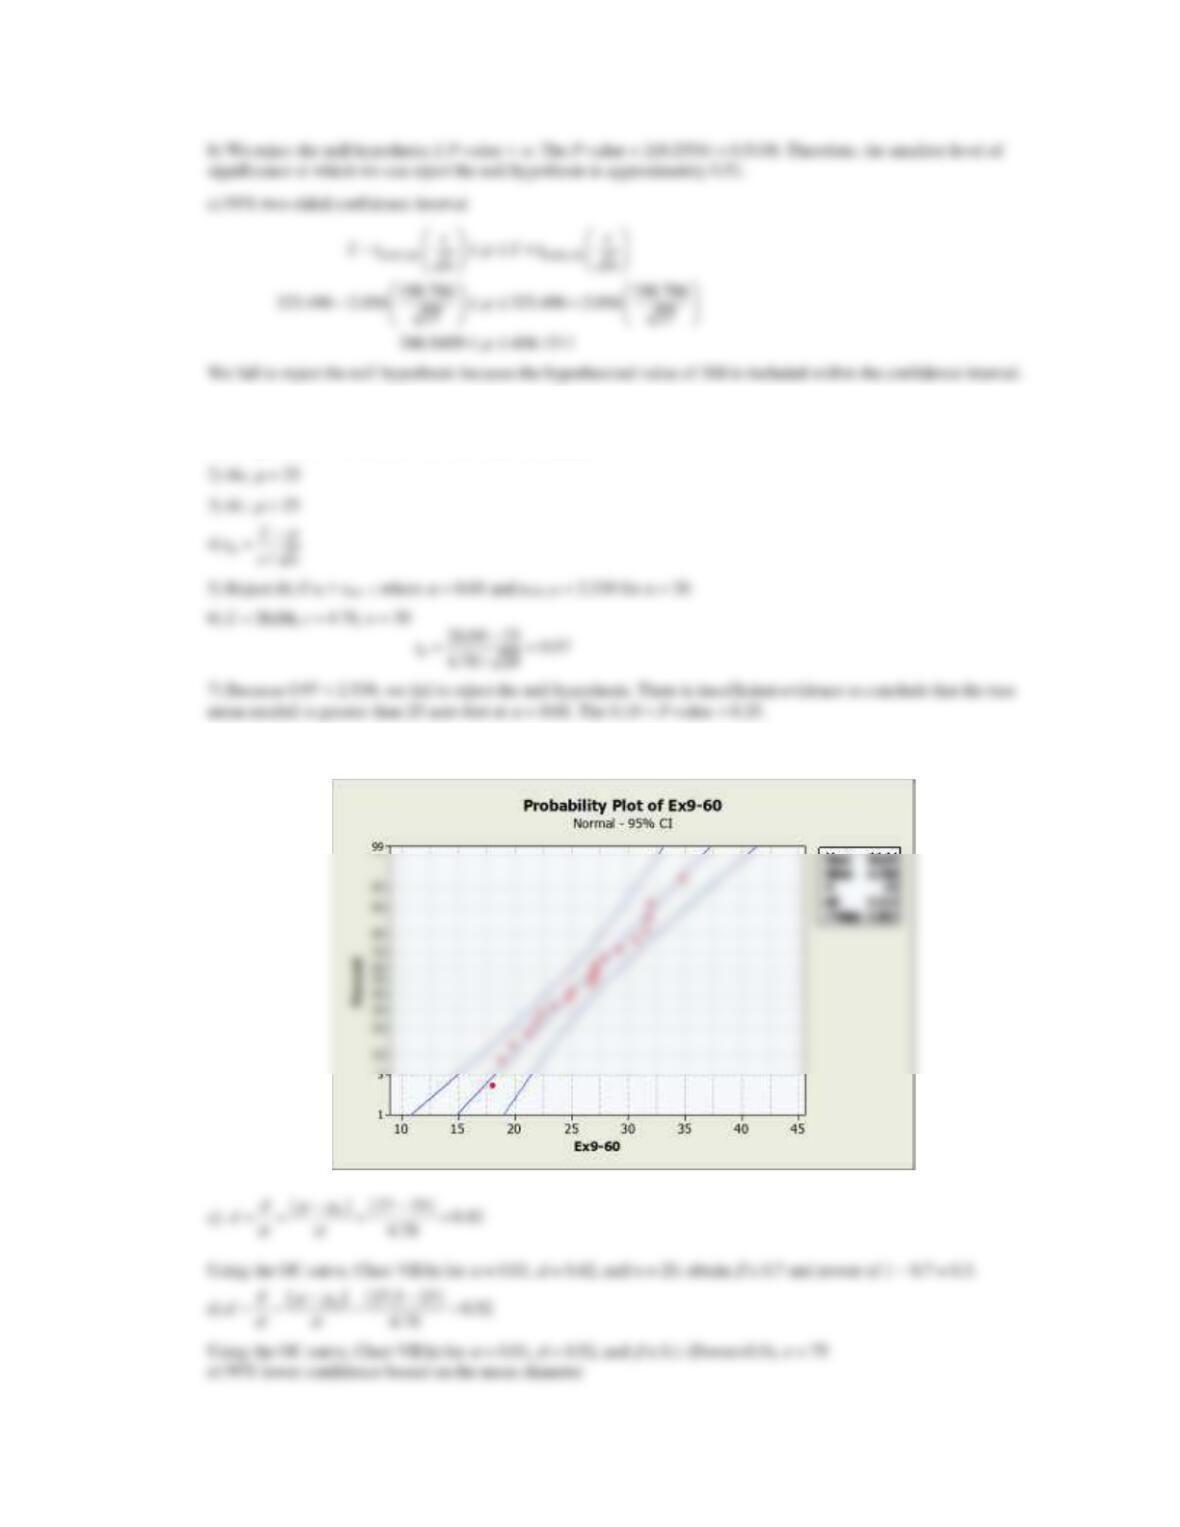
9.3.9 a)
1) The parameter of interest is the true mean female body temperature,
.
b) The data on the normal probability plot falls along a line. The normality assumption is reasonable.
c)
−−
=== =
0
| | | 98 98.6 | 1.24
0.4821
d
Applied Statistics and Probability for Engineers, 7th edition 2017
9-13
9.3.10 a)
1) The parameter of interest is the true mean sodium content,
.
9.3.11 a)
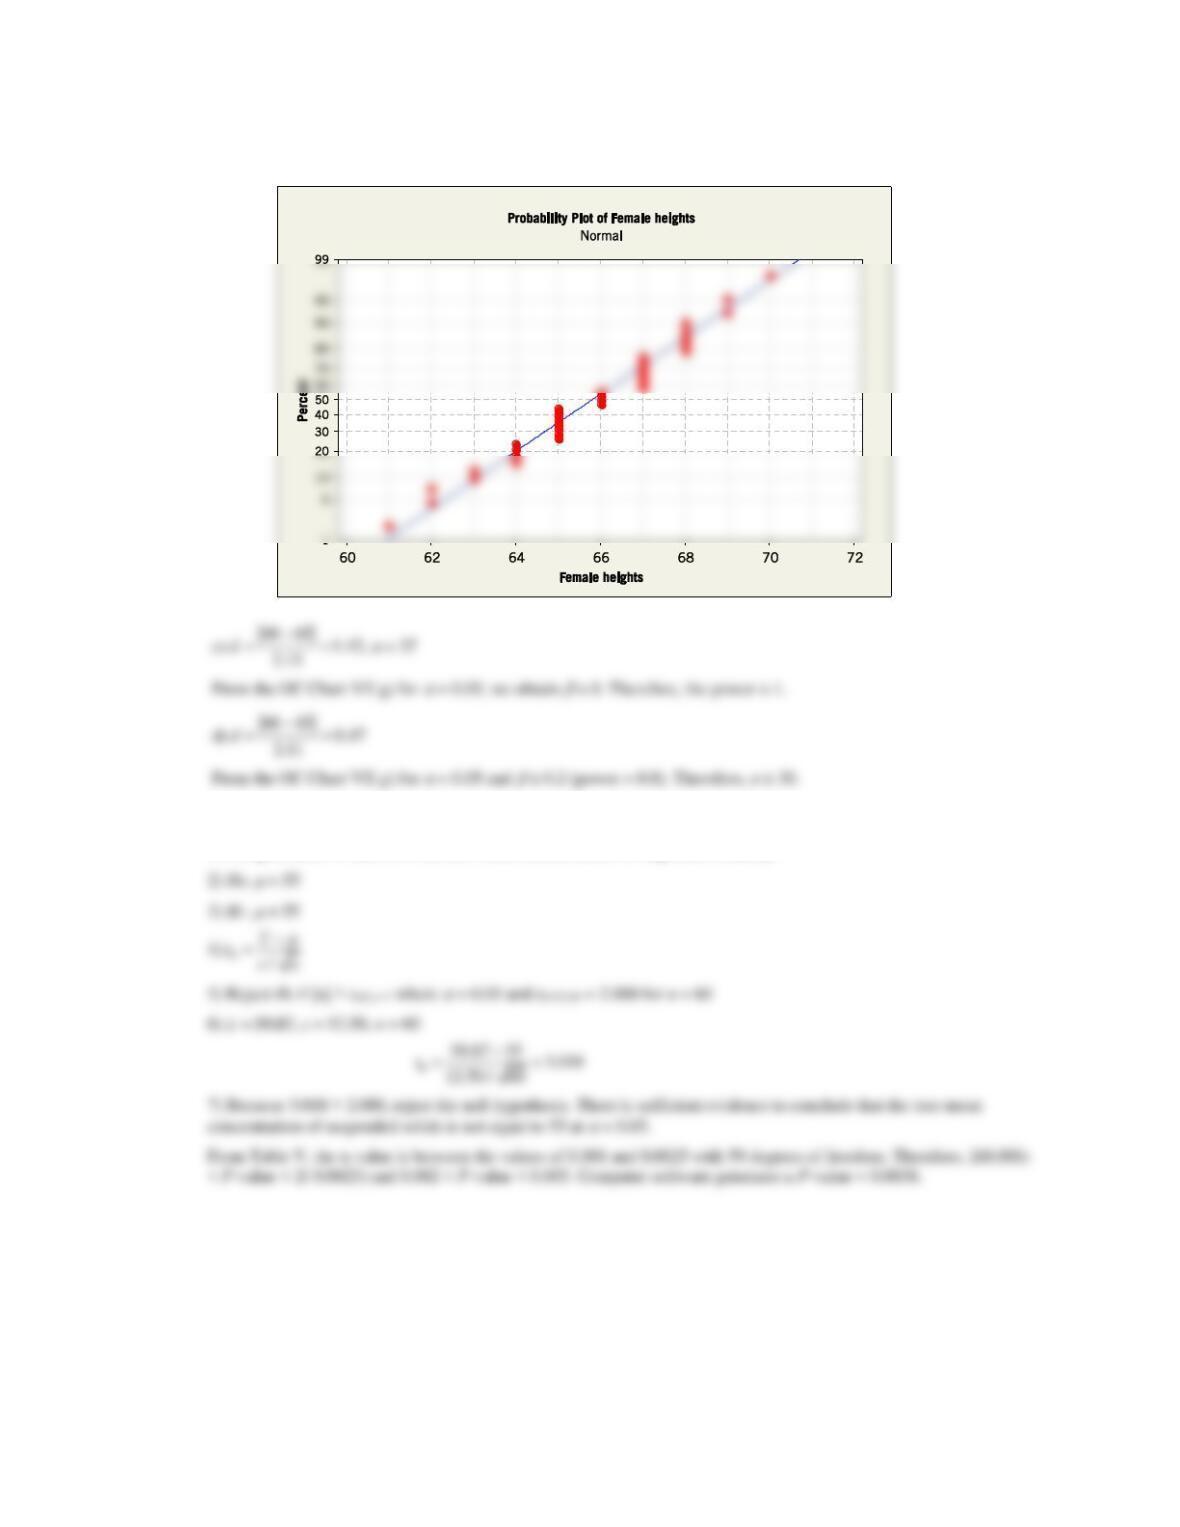
1) The parameter of interest is the true mean height of female engineering students,
.
Applied Statistics and Probability for Engineers, 7th edition 2017
9-14
b) From the normal probability plot, the normality assumption seems reasonable:
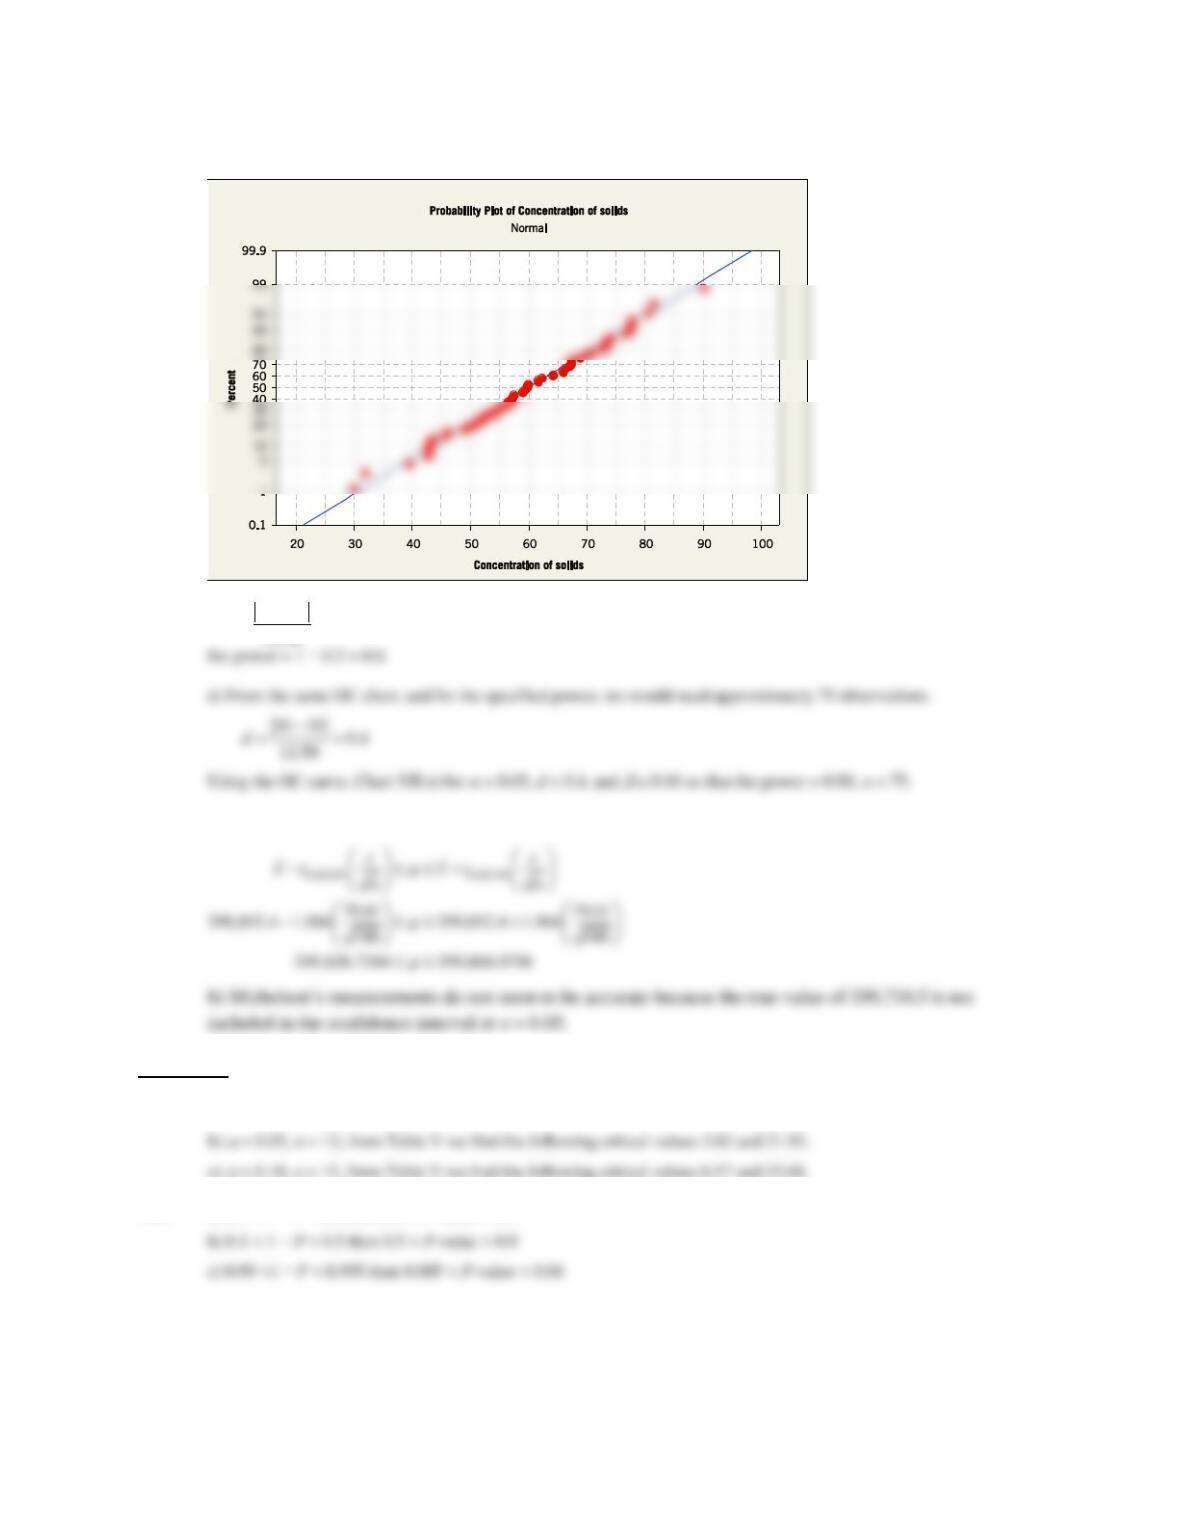
9.3.12 a) In order to use t statistics in hypothesis testing, we need to assume that the underlying distribution is normal.
1) The parameter of interest is the true mean concentration of suspended solids,
.
Applied Statistics and Probability for Engineers, 7th edition 2017
9-15
b) The data tend to fall along a line. The normality assumption seems reasonable.
c)
−
==
50 55 0.4
d
, n = 60 so, from the OC Chart VII e) for
= 0.05, d = 0.4 and n = 60 obtain
0.2. Therefore,
9.3.13 a) 95% two-sided confidence interval
Section 9-4
9.4.1 a)
= 0.01, n = 20, from Table V we find the following critical values 6.84 and 38.58.
9.4.2 a) 0.1 < 1 − P < 0.5 then 0.5 < P-value < 0.9
−
==
50 55 0.4
d
Applied Statistics and Probability for Engineers, 7th edition 2017
9-16
9.4.3 a) In order to use the
2 statistic in hypothesis testing and confidence interval construction, we need to assume that the
underlying distribution is normal.
9.4.4 a) In order to use the
2 statistic in hypothesis testing and confidence interval construction, we need to assume that the
underlying distribution is normal.
1) The parameter of interest is the true standard deviation of titanium percentage,
. However, the solution can be
found by performing a hypothesis test on
2.
Applied Statistics and Probability for Engineers, 7th edition 2017
9-17
9.4.5 a) In order to use the
2 statistic in hypothesis testing and confidence interval construction, we need to assume that the
underlying distribution is normal.
1) The parameter of interest is the standard deviation of tire life,
. However, the answer can be found by performing a
Section 9-5
9.5.1 a) A two-sided test because the alternative hypothesis is p not = 0.4.
9.5.2 a)
1) The parameter of interest is the true fraction of satisfied customers.
Applied Statistics and Probability for Engineers, 7th edition 2017
9-18
7) Because −5.27 < −1.96, reject the null hypothesis and conclude the true fraction of satisfied customers differs from
0.9 at
= 0.05.
9.5.3 a)
9.5.4 a)
1) The parameter of interest is the true proportion of engineering students planning graduate studies.
Applied Statistics and Probability for Engineers, 7th edition 2017
9-19
9.5.5 The problem statement implies that H0: p = 0.6, H1: p > 0.6 and defines an acceptance region as
=
315
ˆ0.63
500
p
and
9.5.6 1) The parameter of interest is the true percentage of customers received fully charged batteries, p.
Applied Statistics and Probability for Engineers, 7th edition 2017
Section 9-7
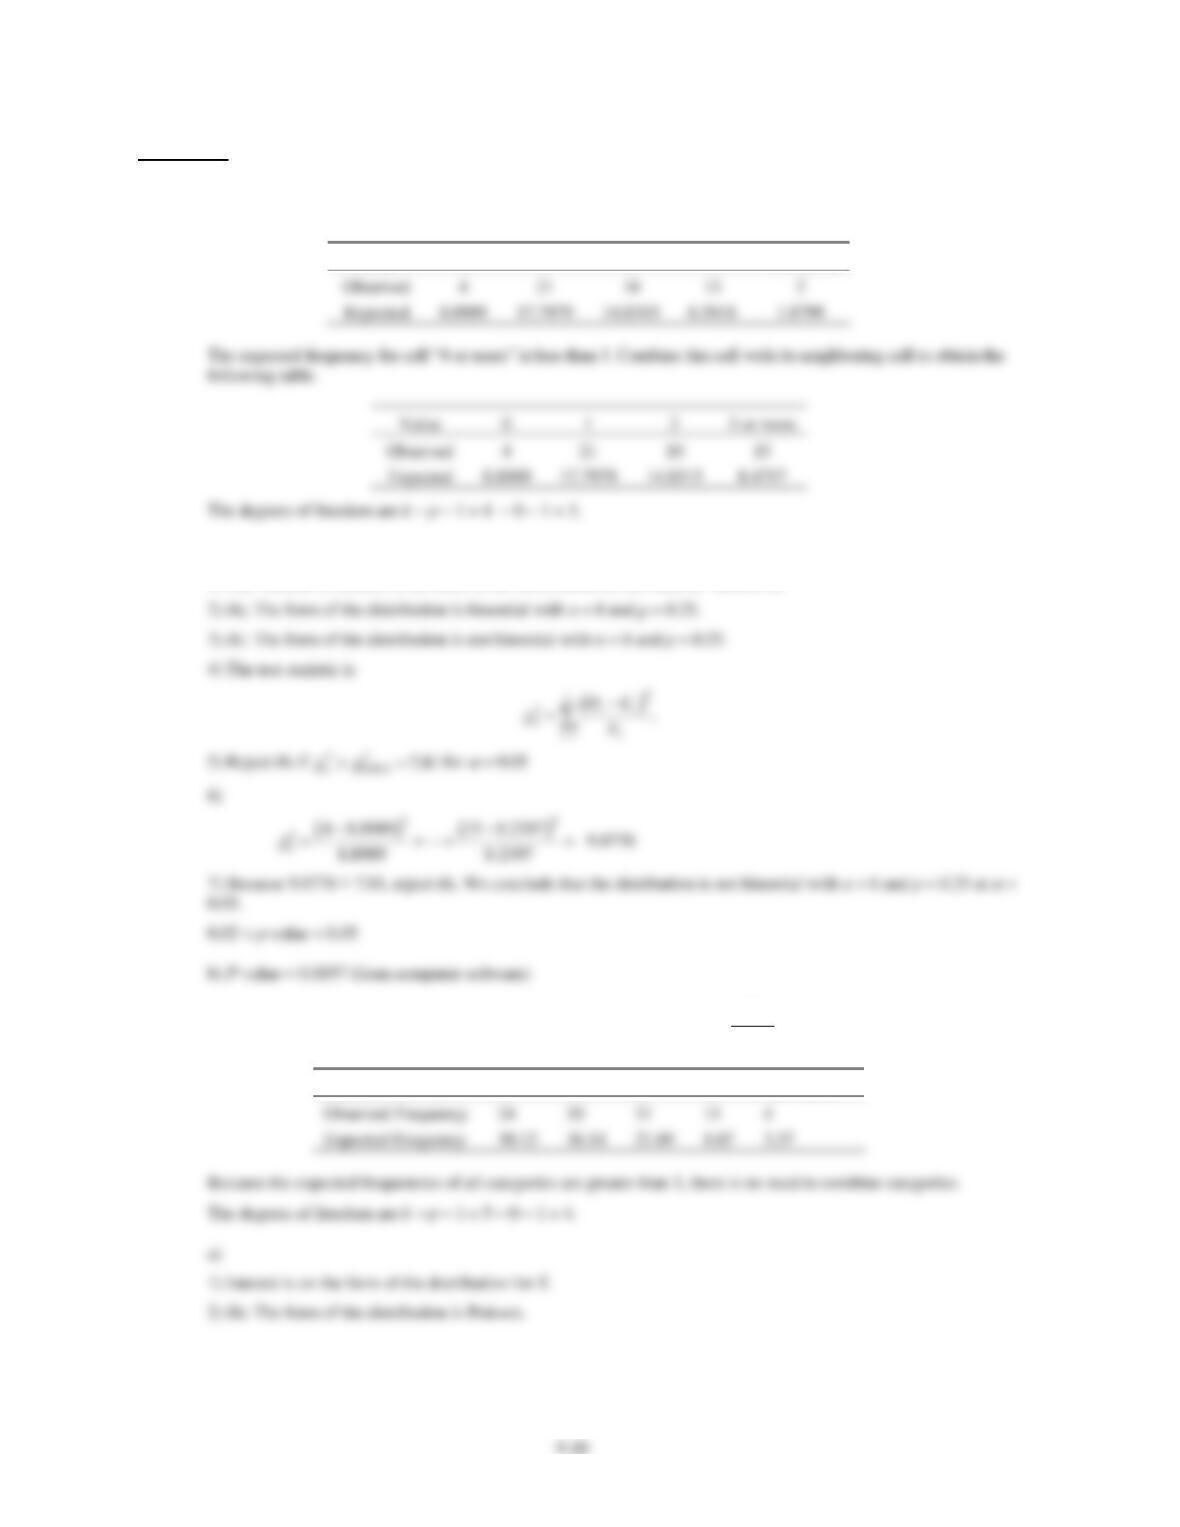
9.7.1 Under the null hypothesis, there are 50 observations from a binomial distribution with n = 6 and p = 0.25. Use the
binomial distribution to obtain the expected frequencies from the 50 observations.
Value
0
1
2
3
4 or more
3 or more
a)
1) The variable of interest is the form of the distribution for the random variable X.
9.7.2 The expected frequency is found from the Poisson distribution
−
==()!
x
e
P X x x
with
= 1.2.
Value
0
1
2
3
4 or more
Observed Frequency
24
30
31
11
4