CHAPTER 8
1. Compare the performance of the separate waiting-line systems for example 8.2,
comparing the average queue length, average number in system, average waiting time
waiting in queue, average time spent in system and probability that a customer has to wait.
What is your conclusion based your results?
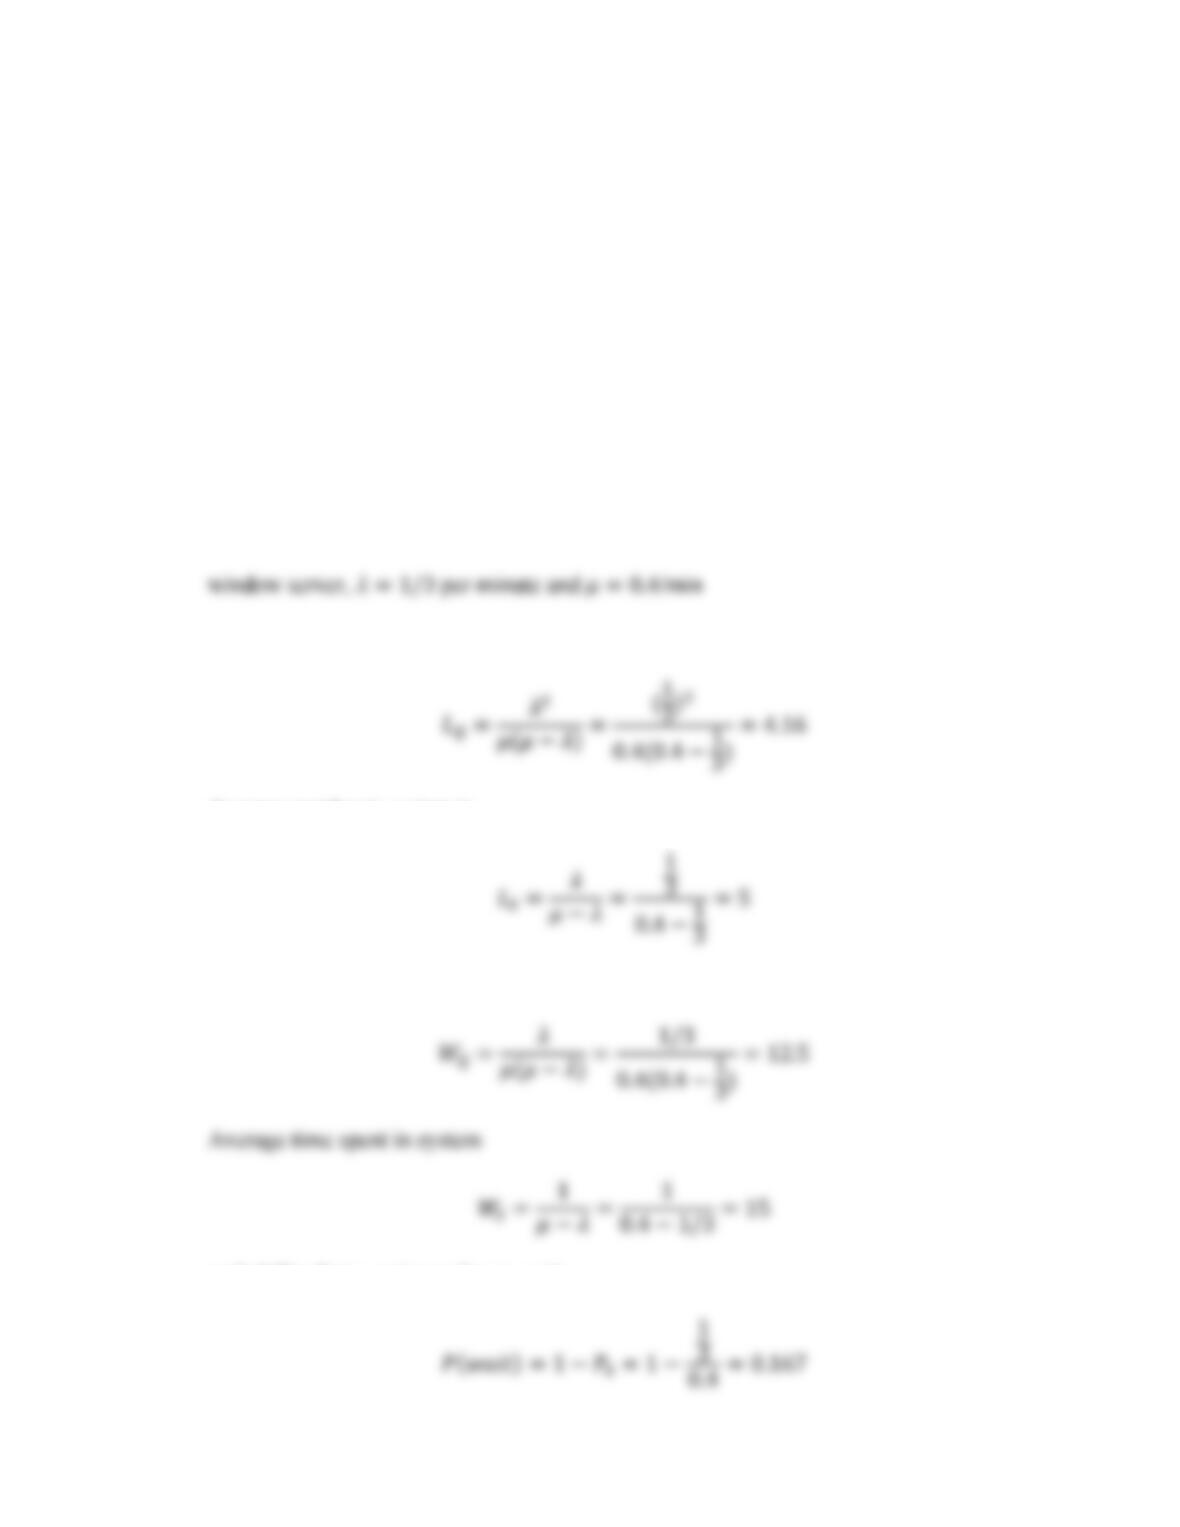
Assuming the customers are equally distributed among three windows, then for each
Average queue length for each queue is
Average number is system is
Average waiting time waiting in queue
probability that a customer has to wait
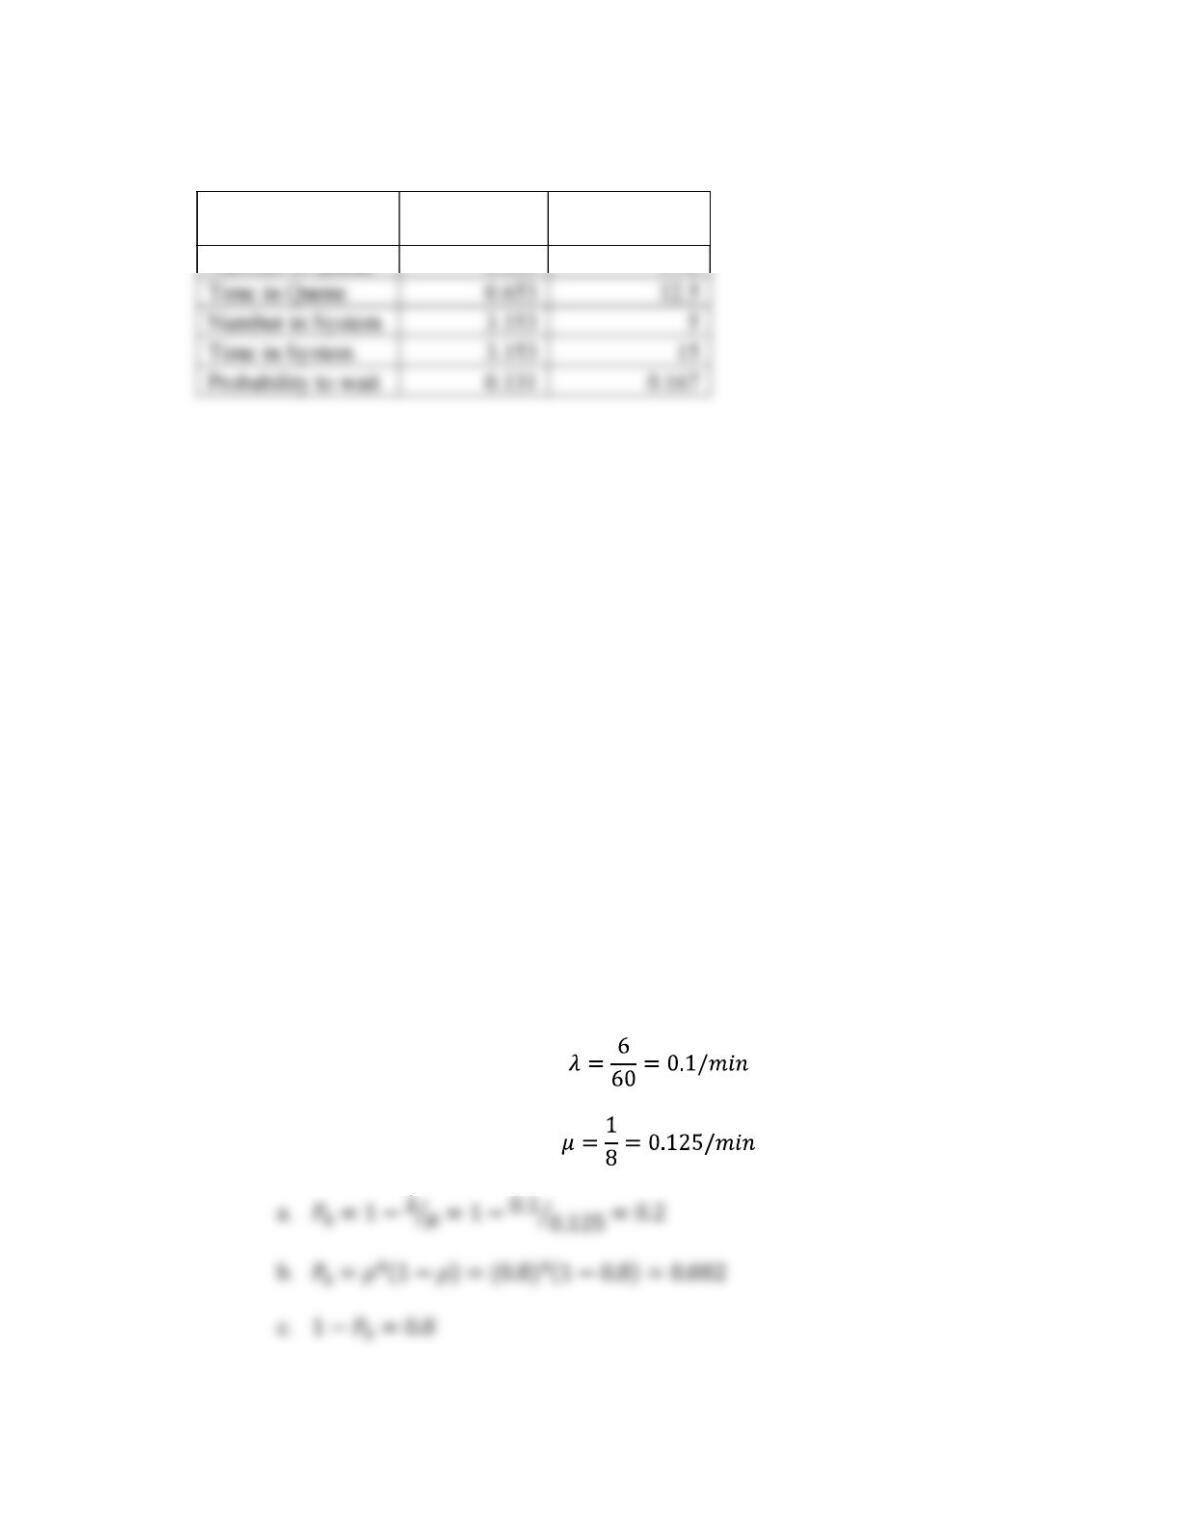
Here is the side by side comparison
Single Queue
Separate
Queue
Number in Queue 0.653 4.16
2. Customers arrive at the service shop with one server following a Poisson process, with
the mean arrival rate of 6/hour, the service time per each customer is exponential
distributed with the mean service time of 8 minutes. Assuming there are enough space
for customers to wait,
a. What the probability that the shop has no customer in it?
b. What the probability that there are 4 customers in the shop?
c. What the probability that there are at least one customer in the shop?
d. What is the mean number of customers in the shop?
e. What the mean number of customer waiting in the queue?
f. What the mean waiting time in queue?
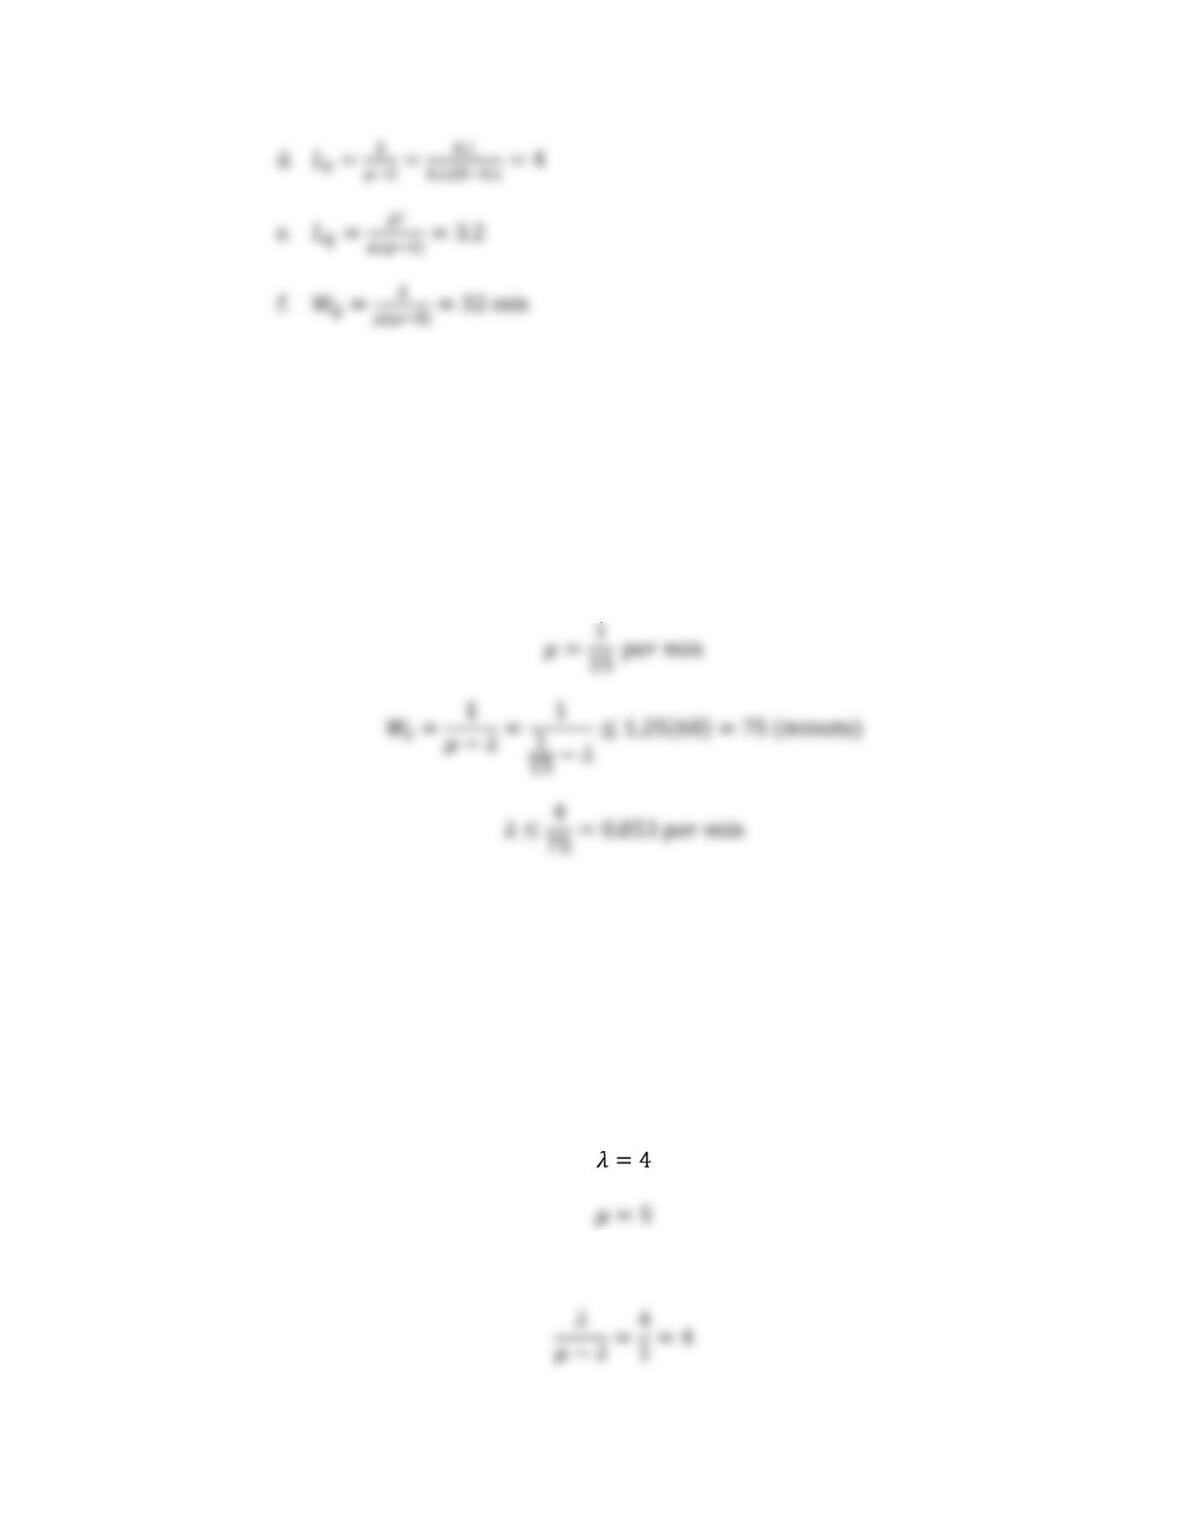
3. A service center with customers’ arrive at a Poisson process, and the service time is
exponential distributed with mean of 15 minutes. If the customer spend more than 1.25
hours averagely in the center, the manager is considering hiring additional service
resources, what is the maximum arrival rate of customers to make the hiring decision?
4. In a manufacturing facility, machines break down at an exponential rate of 4 per hour.
There is one service person that repair these machines at an exponential rate of 5 per hour.
The cost of losing production for these failed machines are $30 per hour per machine.
What is the average cost rate ($/hour) for the factory due to these machine failures?
Average number of failed machine per hour is
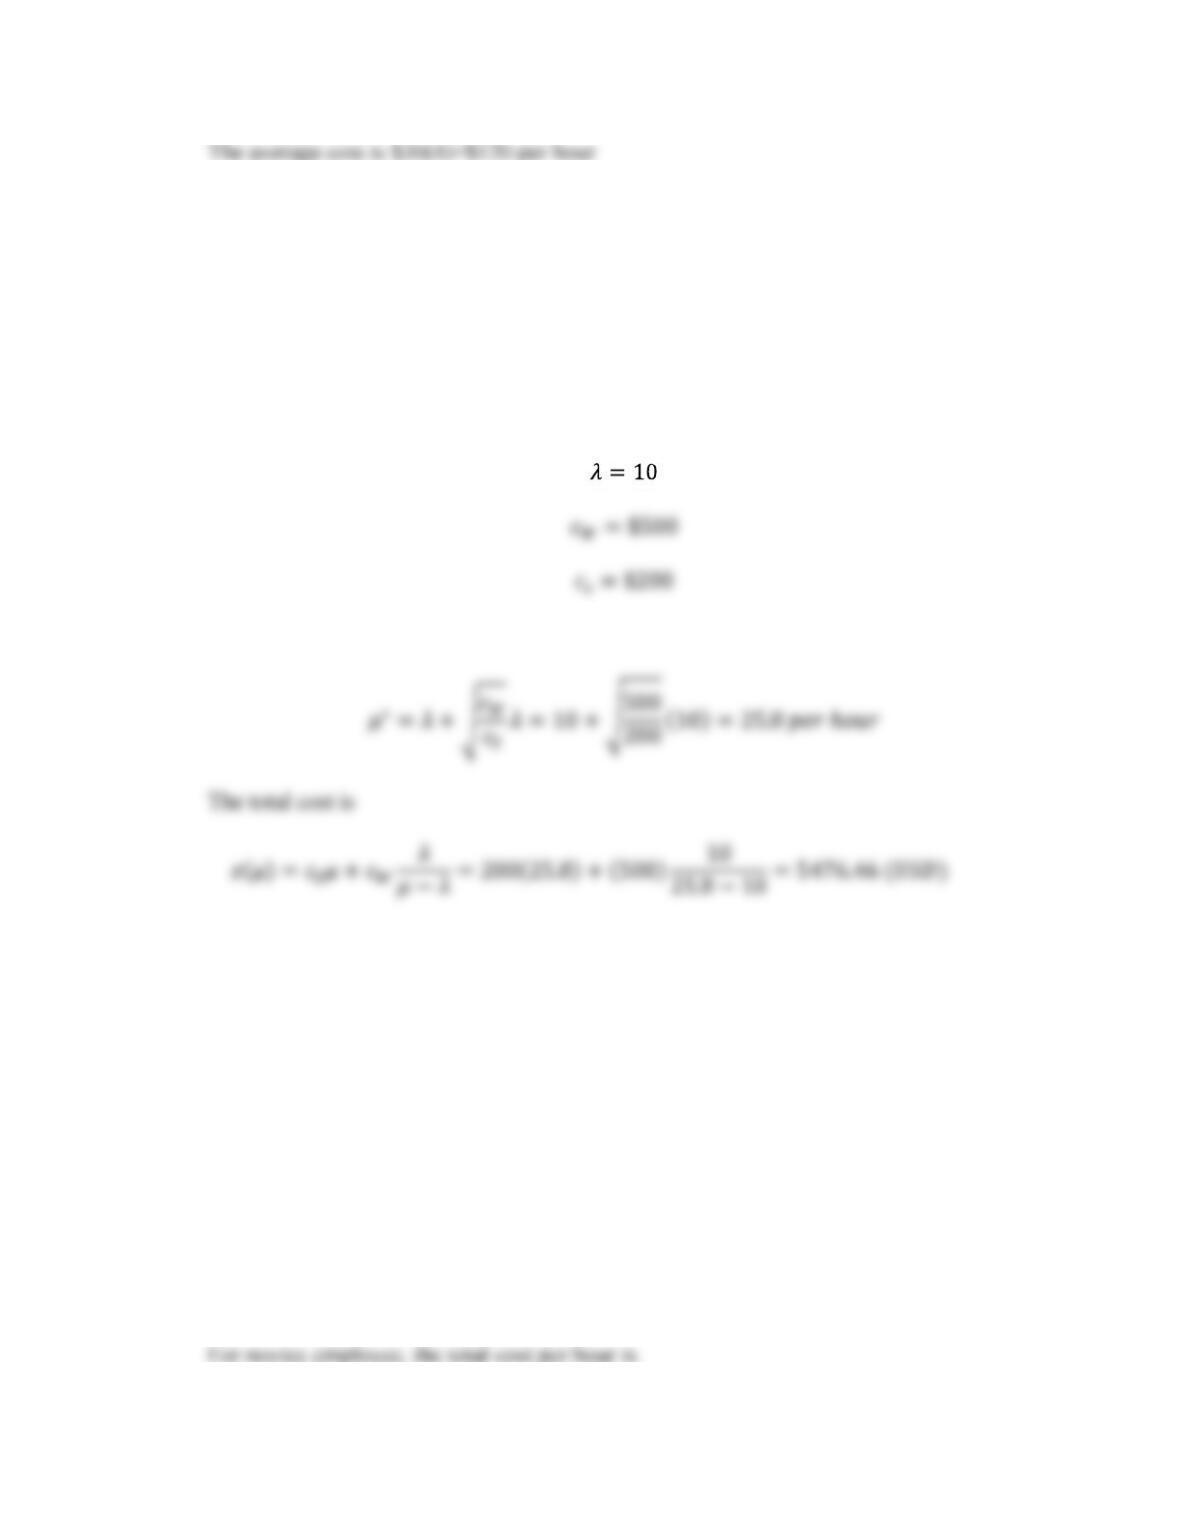
5. Machines come to a service center for a regular repair service, the arrival process is
Poisson with arrival rate of 10 per hour, each machine can make $500 profit per hour, the
service charge is $200 per hour per machine, what should the service rate should be in
order to minimize the total cost? What is the minimum cost?
According to (8.40), the optimal service rate is
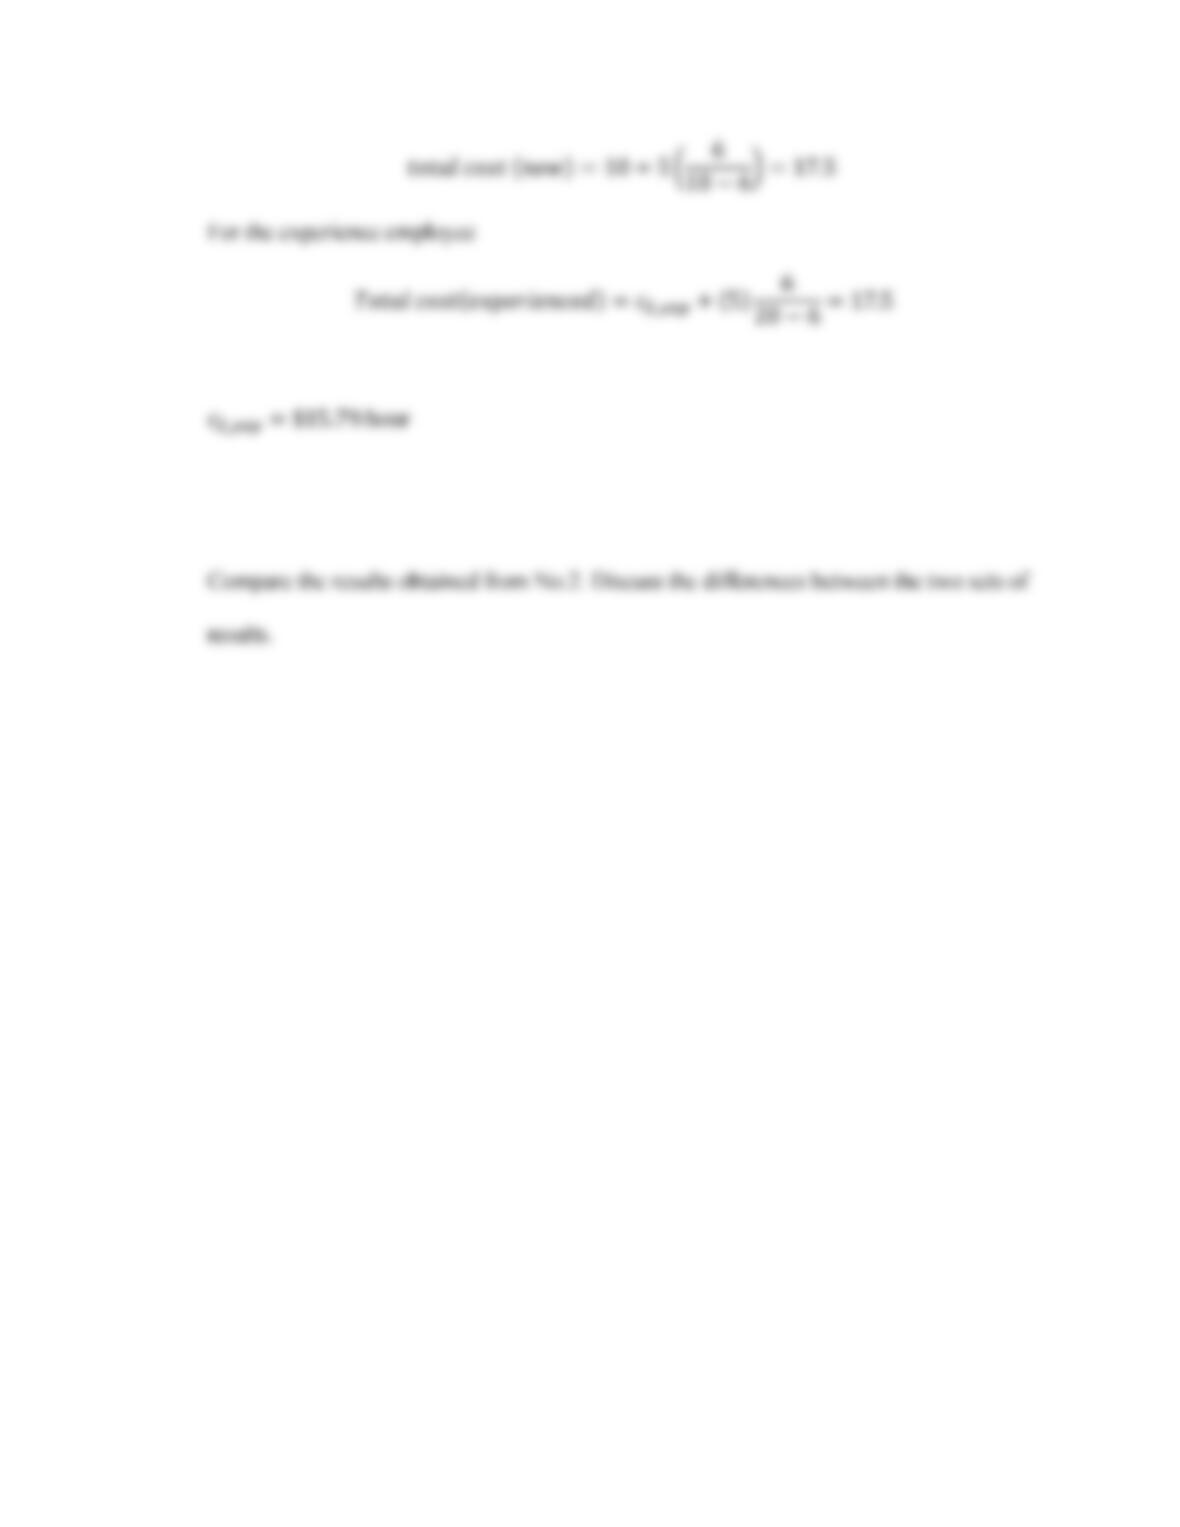
6. At a post office, a new-hired novice person works at a rate of 10 customers per hour
exponentially; an experienced employee works at a rate of 20 customers per hour. It has
been estimated that customer’s waiting time is worth $5 per hour, and customer arrives at
a Poisson process at a rate of 6 customers per hour. If the new employee is paid at
$10/hour, what is the pay rate for the experienced employee so that the average cost
would breakeven between novice and experience employee?
7. Simulate using ARENA Exercise question No. 2 and obtain the results for d) e) and f).
8. Students at a university come to bursar’s office entrance follows a Poisson process, with
the mean inter-arrival time of 5 minutes (first student arrive at time 0); After enter the
door, there is a hall way that takes a student uniformly between 1.5 minutes and 2
minutes to walk to the service window. Upon arrive at the service window, students wait
in a single queue to be served by one of the three clerks; the service time per each student
is distributed in a Triangular distribution with minimum of 3 minutes, maximum of 5
minutes and most likely 5 minutes. Upon completion of the service, student leaves the
window, and walk back to the door and exit. Using ARENA to simulate for 16 hours, and
obtain the average students completing the service, and average time students spend in
the office and average number of students waiting in the waiting line.
Answer:
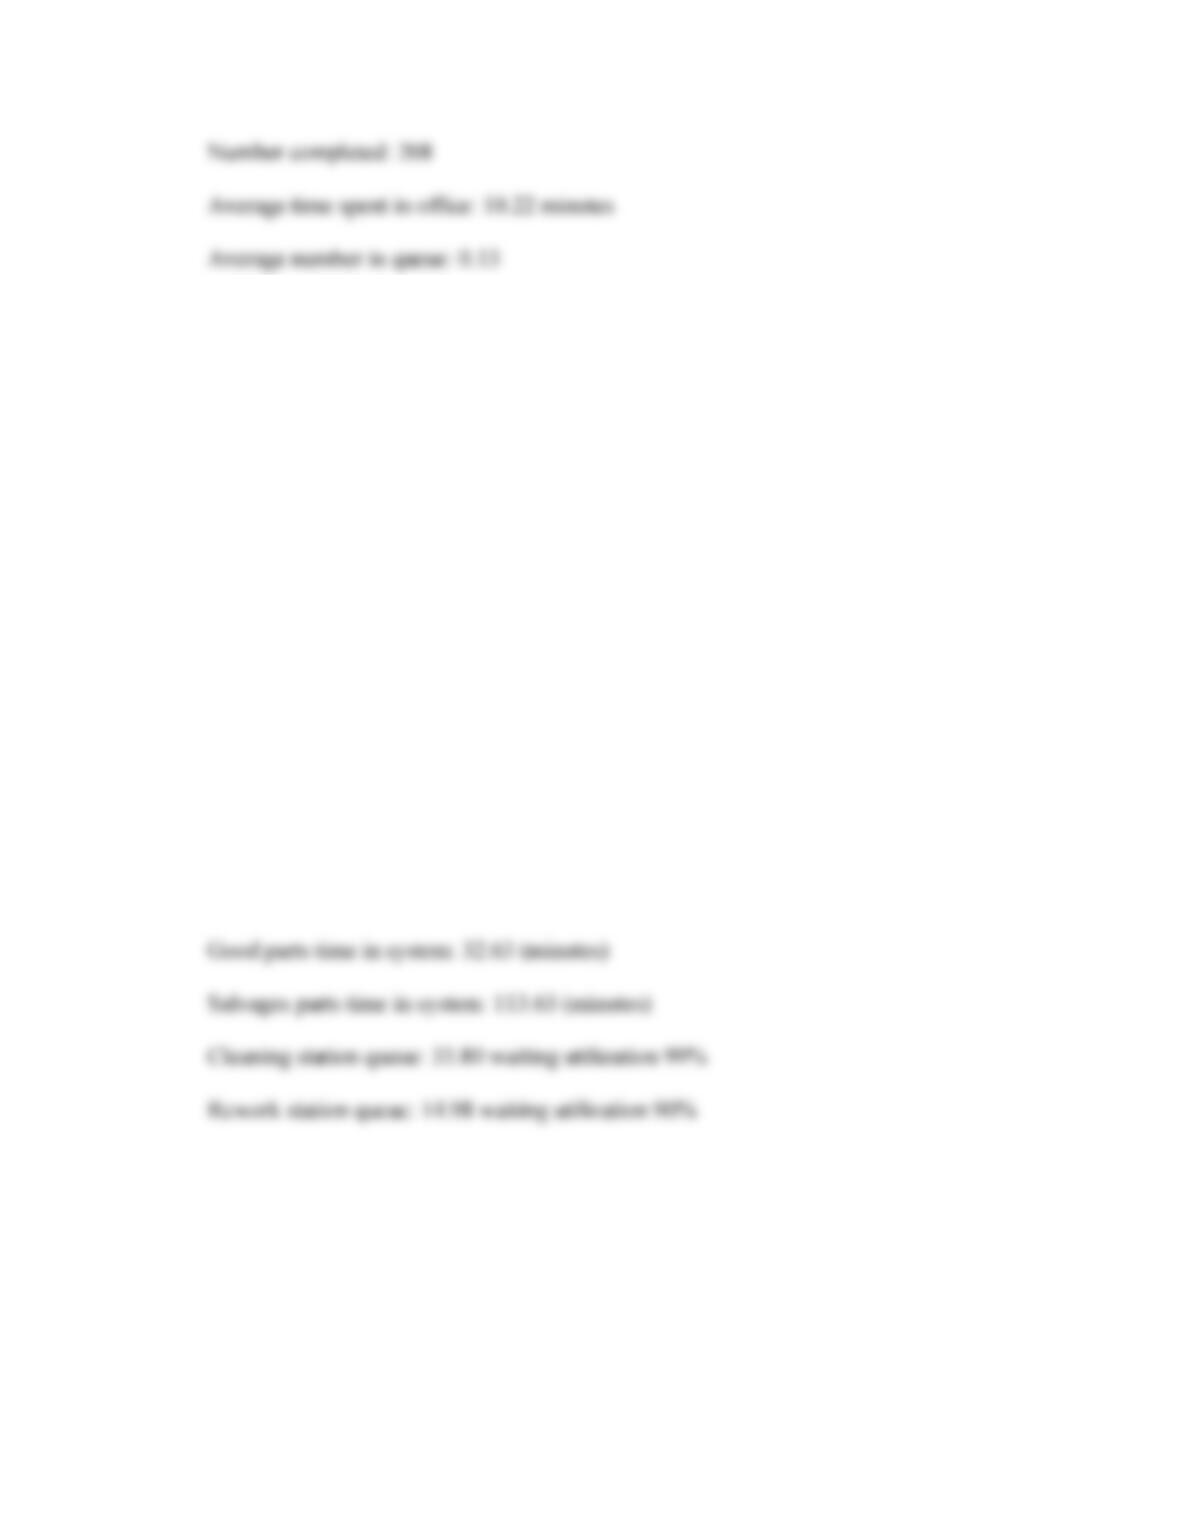
9. Parts arrive at the cleaning facility for processing. The arrival of parts follows Poisson
distribution, with a mean of 1 minutes (first arrival occurs at time 0); upon arrival, parts
get processed in the cleaning station with one machine, the cleaning time is Triangularly
distributed (minimum 30 seconds, maximum, 90 seconds and most likely 1 minute); after
the cleaning, 80% pass the inspection, and shipped out directly, 20% are considered
defect and sent to a rework station (with one machine) to fixed it. Assuming 100% of the
rework are successful and the rework time is exponential distribute with mean of 5
minutes. Use ARENA to simulate the process for 1,000 minutes and collect average time
for good parts and salvaged parts spent in the system, and queue length for the two
workstations and utilizations.
Answer: