Unlock document.
This document is partially blurred.
Unlock all pages and 1 million more documents.
Get Access
A healthcare provider monitors the number of CAT scans performed each month in each of its
clinics. The most recent year of data for a particular clinics follows (the reported variable is the
number of CAT scans each month expressed as the number of CAT scans per thousand members
of the health plan):
2.31, 2.09, 2.36, 1.95, 1.98, 2.25, 2.16, 2.07, 1.88, 1.94, 1.97, 2.02.
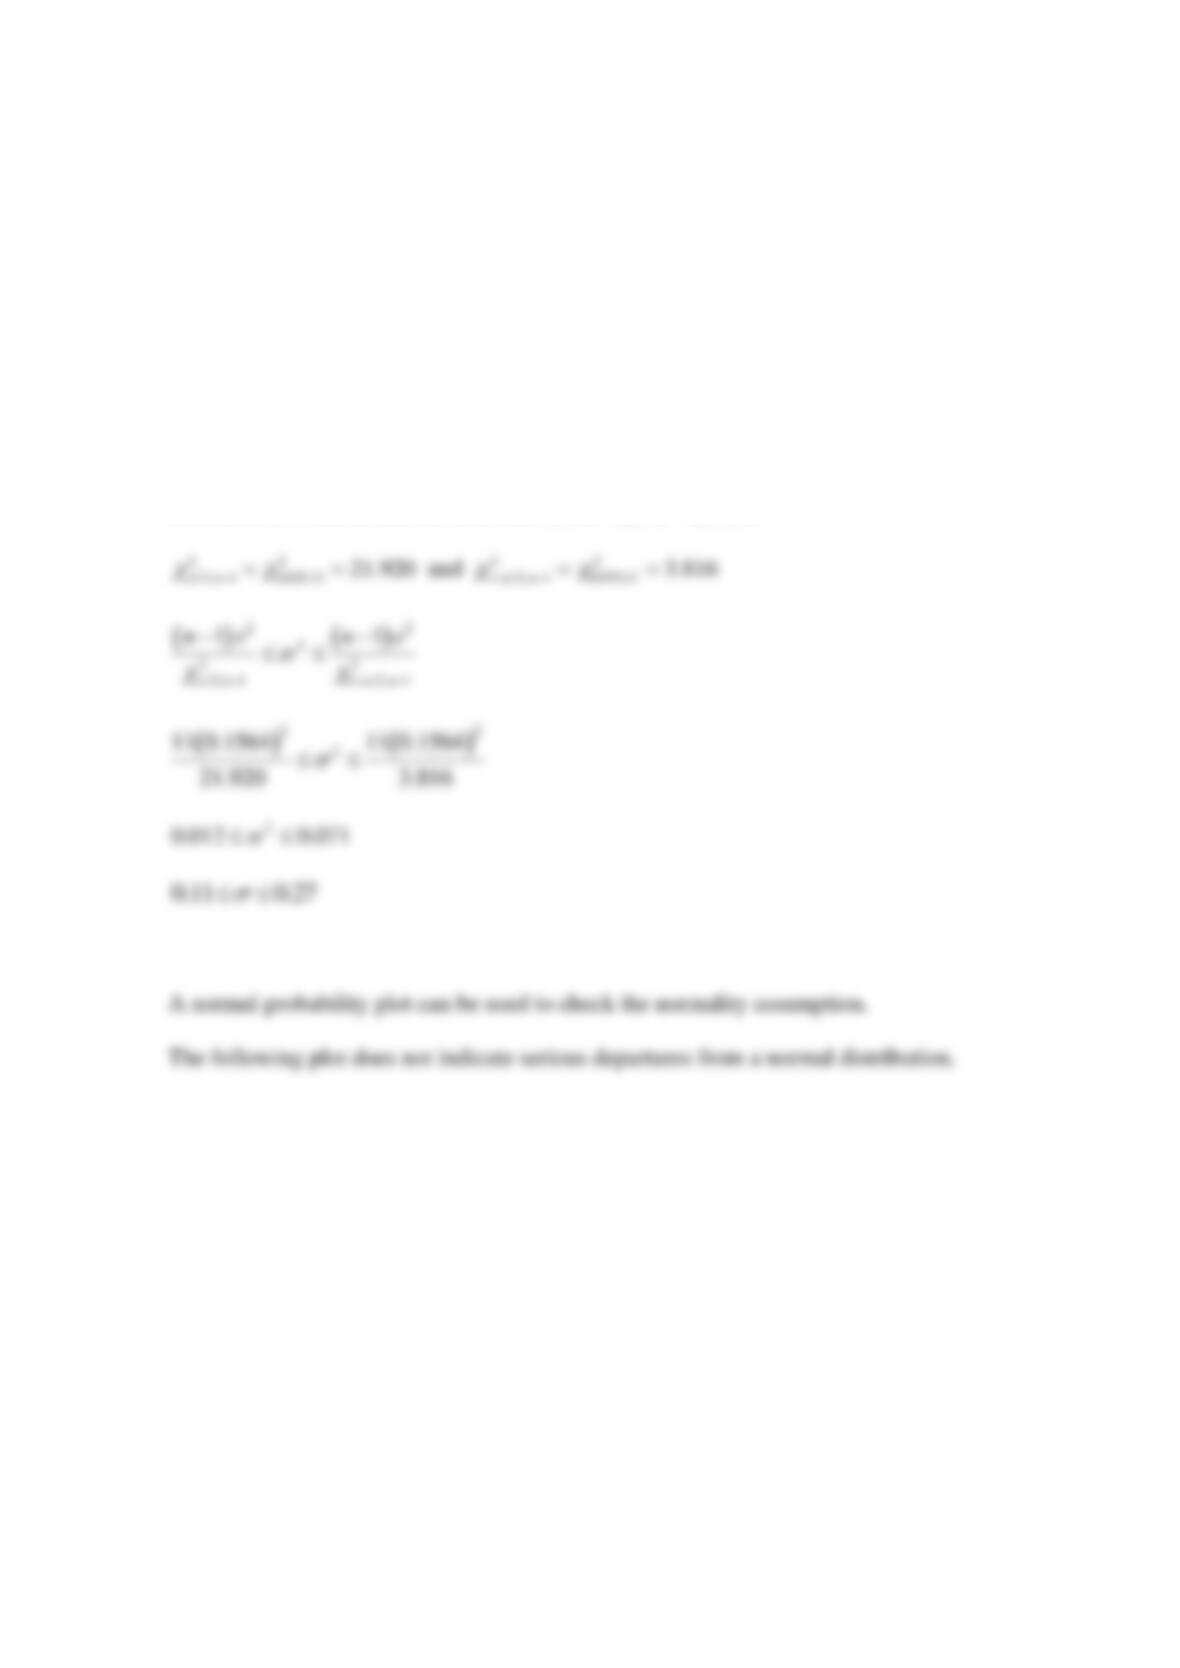
Find a two-sided 95% confidence interval for the standard deviation. What should you do to
address any reservations about the confidence interval you found?
SOLUTION
95% two-sided confidence interval for
,
12n=
,
0.1564s=
Reserve Problems Chapter 8 Section 4 Problem 1
During an independent research, 2500 randomly selected people were interviewed whether they
visit their dentist for a regular dental checkup or not. Only 2000 gave a positive answer.
Calculate a 95% two-sided confidence interval on the proportion of people who regularly have a
dental checkup.
SOLUTION
/2
2000 0.80, 2500, 1.96
ˆ2500
p n z
= = = =
Reserve Problems Chapter 8 Section 4 Problem 2
According to an independent research, a point estimate of the proportion of U.S. consumers of
black tea is
ˆ0.72p=
. Calculate the sample size needed to be 95% confident that the error in
estimating the true value of Pp is less than 0.015?
SOLUTION
/2 0.025
0.015, 0.05, 1.96E z z
= = = =
,
Reserve Problems Chapter 8 Section 4 Problem 3
According to fast food restaurant statistics, 1020 of 1500 randomly selected people report eating
out at least once a week. Calculate a 90% two-sided Agresti-Coull CI on the proportion of
regular visitors of fast food restaurants.
SOLUTION
Reserve Problems Chapter 8 Section 4 Problem 4
A study is to be conducted of the percentage of popcorn seeds that collapse during cooking. How
large a sample is required if we wish to be at least 95% confident that the error in estimating this
quantity is less than 0.025, regardless of its true value?
SOLUTION
Reserve Problems Chapter 8 Section 4 Problem 5
The fraction of defective integrated circuits produced in a photolithography process is being
studied. A random sample of 260 circuits is tested, revealing 10 defectives.
Compute a 95% two-sided Agresti-Coull CI on the propotion of defective circuits.
SOLUTION
Reserve Problems Chapter 8 Section 4 Problem 6
An article in Knee Surgery, Sports Traumatology, Arthroscopy [“Arthroscopic Meniscal Repair
with an Absorbable Screw: Results and Surgical Technique” (2005, Vol. 13, pp. 273–279)]
showed that only 25 out of 37 tears (67.6%) located between 3 and 6 mm from the meniscus rim
were healed. Compute a 95% two-sided Agresti-Coull CI on the proportion of tears that will
heal.
SOLUTION
/2 0.025
25 0.6757, 37, 1.96
37
ˆ
p n z z
= = = = =
Reserve Problems Chapter 8 Section 4 Problem 7
The U.S. Postal Service (USPS) has used optical character recognition (OCR) since the mid-
1960s. In 1983, USPS began deploying the technology to major post offices throughout the
country (www.britannica.com). Suppose that in a random sample of 580 handwritten zip code
digits, 541 were read correctly. Compute a 95% two-sided Agresti-Coull CI on the proportion of
correct digits that can be automatically read.
SOLUTION
/2 0.025
541 0.933, 580, 1.96
ˆ580
p n z z
= = = = =
Reserve Problems Chapter 8 Section 4 Problem 8
Information on a packet of seeds claims that 93% of them will germinate. Of the 220 seeds that I
planted, only 189 germinated. Compute a 95% two-sided Agresti-Coull CI on the proportion of
seeds that germinate. Use as a point estimator
ˆ
p
the proportion of seeds that germinated during
the experiment.
SOLUTION
189 0.86, 220, 1.96
ˆ220
p n z z
= = = = =
Reserve Problems Chapter 8 Section 5 Problem 1
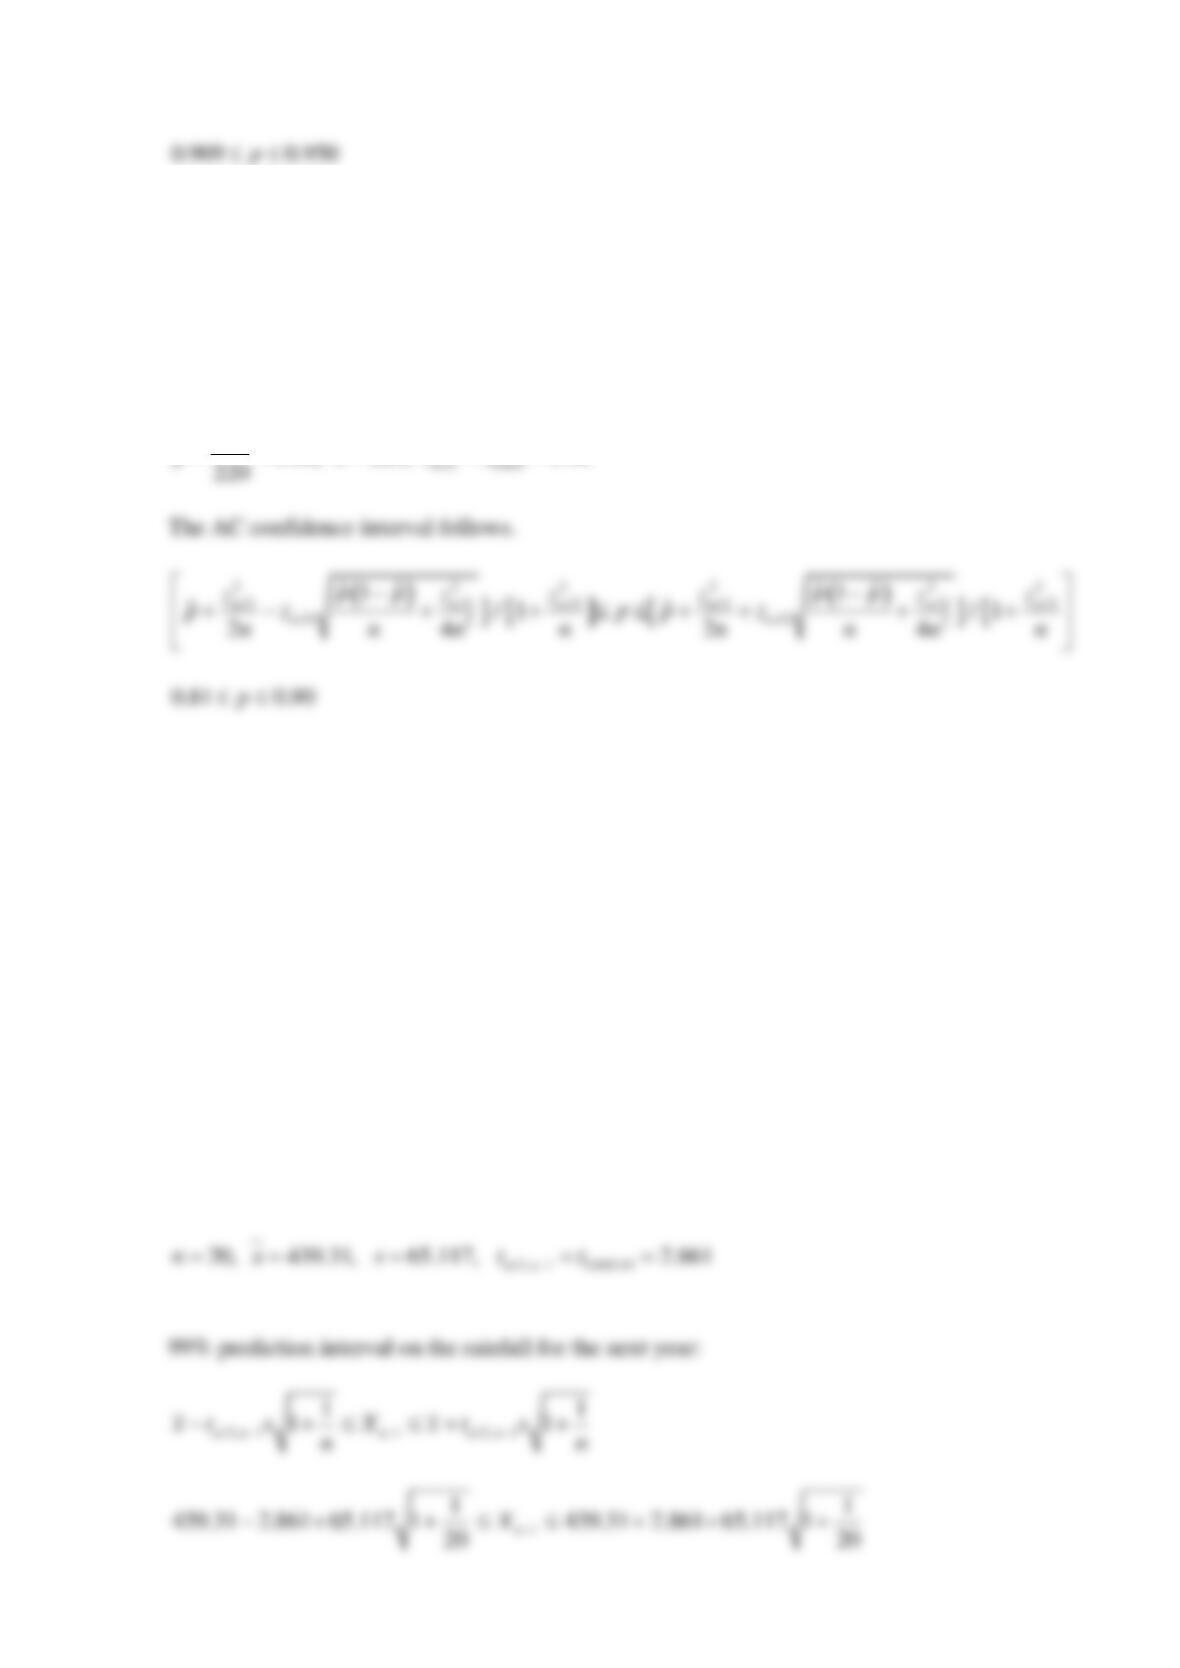
The Bureau of Meteorology of the Australian Government provided the mean annual rainfall (in
millimeters) in Australia in 1900 - 1919 as follows:
523.3, 427.3, 377.9, 442.1, 425.2, 386.5,
533.8, 579.5, 433.1, 361.1, 513.6, 548.0, 420.9, 411.6, 402.4,
425.3, 422.9, 422.8, 356.9, 372.0..
Compute a 99% prediction interval on the rainfall for the next year.
Compute a 99% confidence interval on the population mean.
Compare the length of the prediction interval with the length of the 99% CI on the population
mean.
SOLUTION
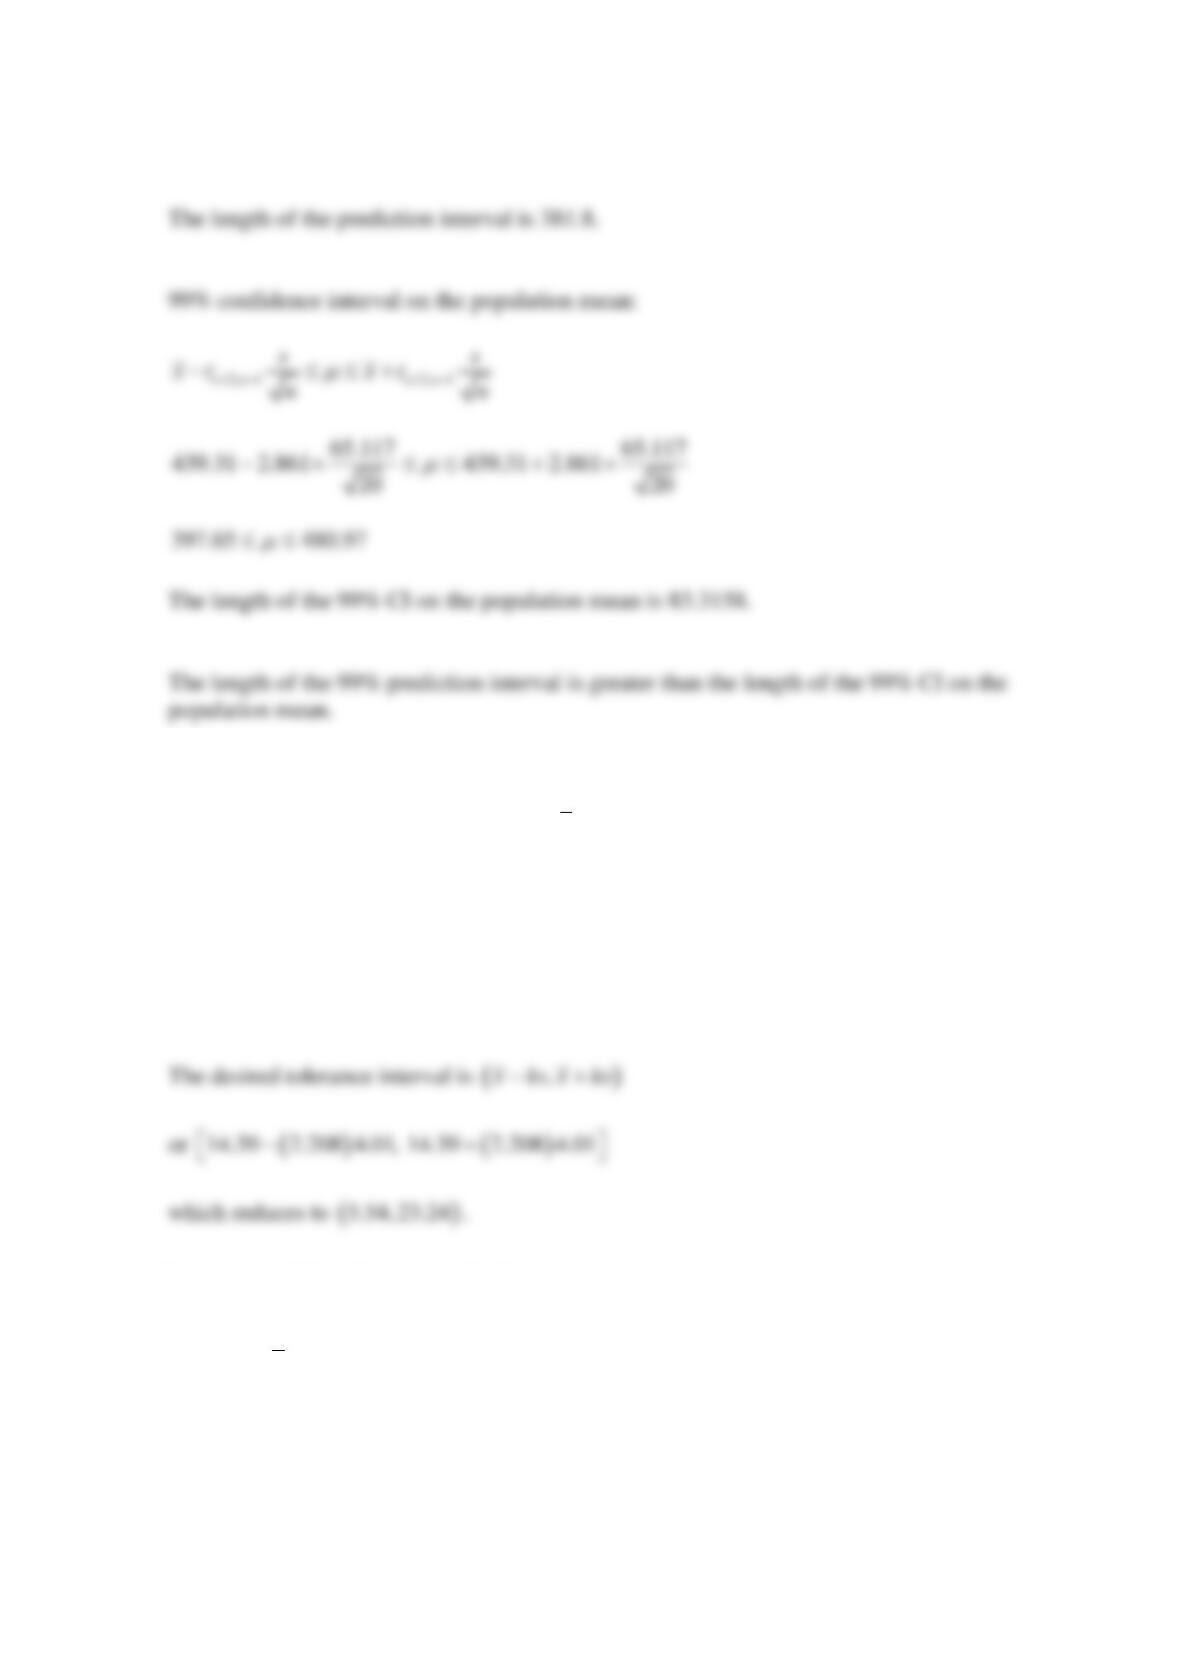
1
248.4095 630.2105
n
X+
Reserve Problems Chapter 8 Section 5 Problem 2
Consider a random sample with
25n=
,
14.39x=
, and
4.01s=
.
Compute the tolerance interval for capturing at least 90% of the values in a normal distribution
with the confidence level of 95%.
SOLUTION
The tolerance factor k for
25n=
,
0.90
=
, and 95% confidence is
2.208k=
.
Reserve Problems Chapter 8 Section 6 Problem 1
The wall thickness of 25 aquariums was measured by a quality-control engineer. The sample
mean was
2.74x=
millimeters, and the sample standard deviation was
0.09s=
millimeters.
Compute a 95% tolerance interval on the glass-wall thickness that has the confidence level of
95%.
SOLUTION
The tolerance factor k for
25n=
,
0.95
=
, and 95% confidence is
2.631k=
.
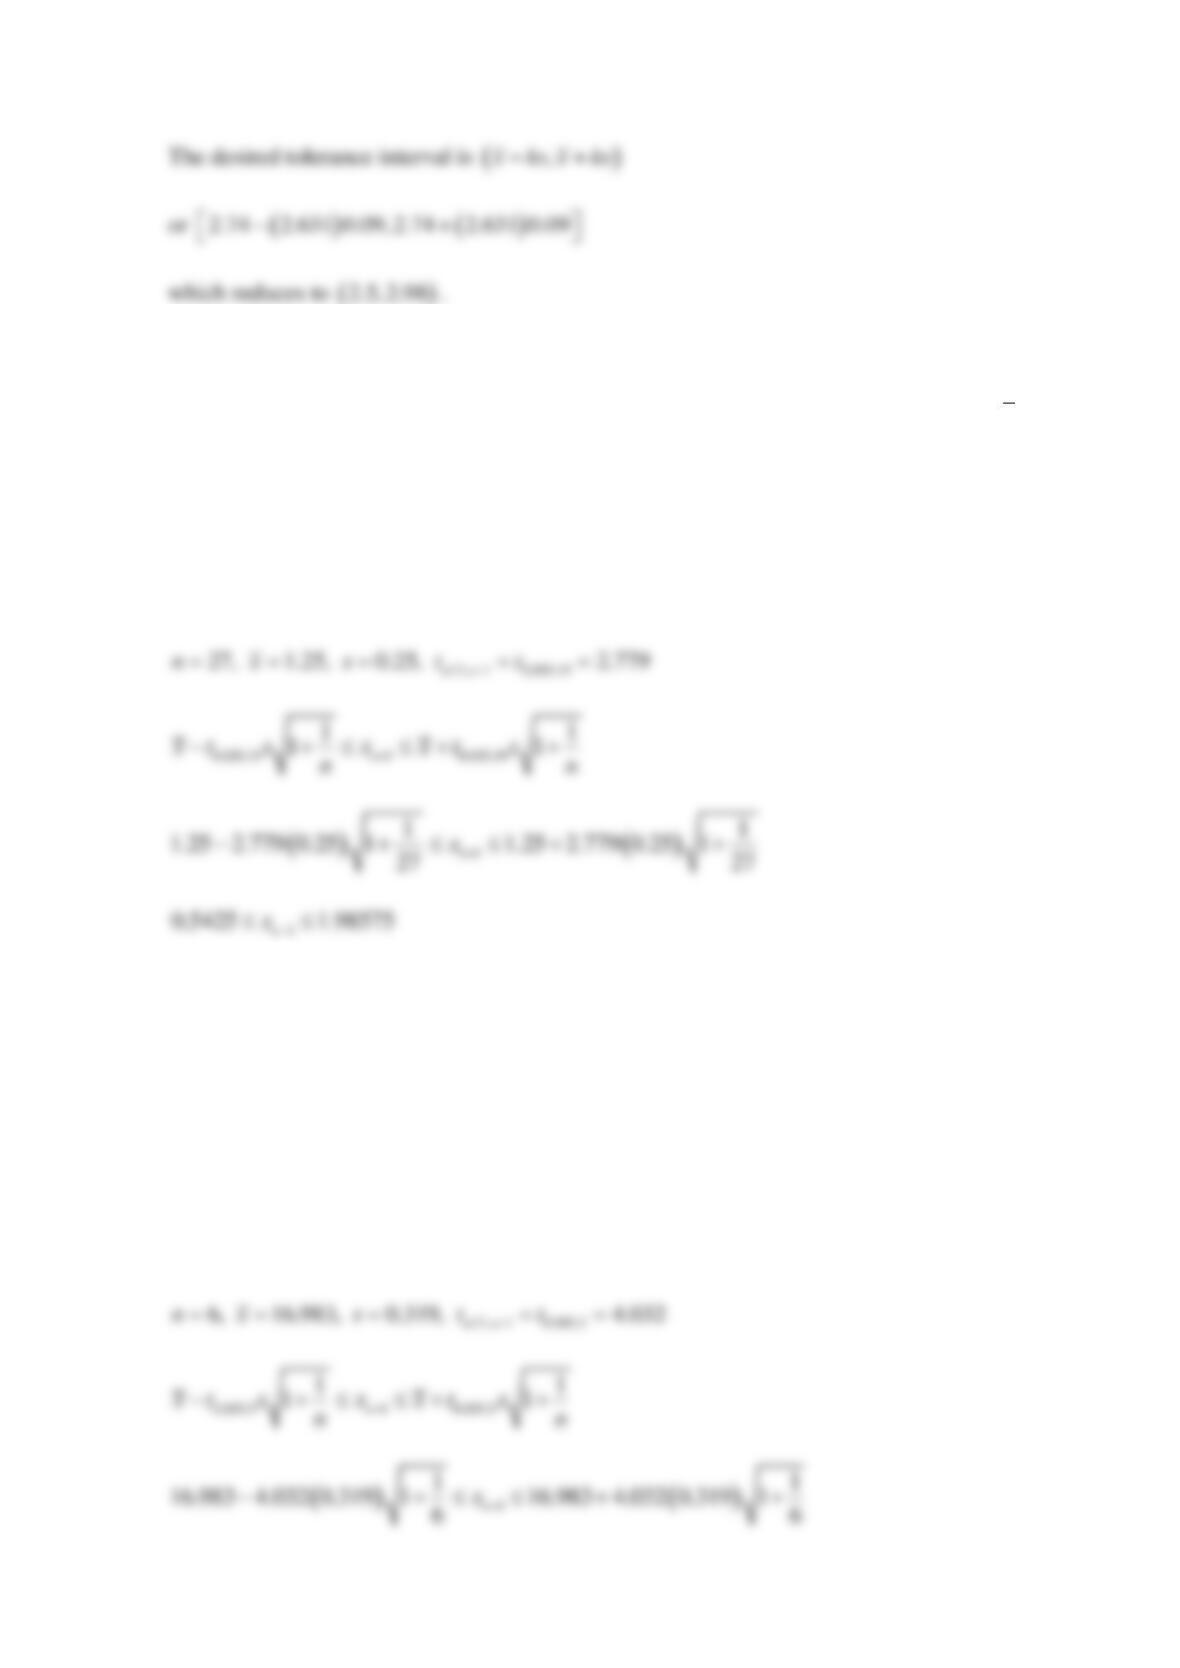
Reserve Problems Chapter 8 Section 6 Problem 2
An Izod impact test was performed on 27 specimens of PVC pipe. The sample mean is
1.25x=
and the sample standard deviation is
0.25s=
.
Compute a 99% prediction interval on the impact strength of the next specimen of PVC pipe
tested.
SOLUTION
99% prediction interval on the Izod data
Reserve Problems Chapter 8 Section 6 Problem 3
A particular brand of diet margarine was analysed to determine the level of polyunsaturated fatty
acid (in percentages). A sample of six packages resulted in the following data: 16.8, 17.2, 17.4,
16.9, 16.5, 17.1. Compute a 99% prediction interval on the polyunsaturated fatty acid in the next
package of margarine that is tested.
SOLUTION
99% prediction interval on the polyunsaturated fat
Reserve Problems Chapter 8 Section 6 Problem 4
The Bureau of Meteorology of the Australian Government provided the mean annual rainfall (in
millimeters) in Australia 1983–2002 as follows
(http://www.bom.gov.au/climate/change/rain03.txt):
499.2, 555.2, 398.8, 391.9, 453.4, 459.8, 483.7, 417.6, 469.2, 452.4, 499.3, 340.6, 522.8, 469.9,
527.2, 565.5, 584.1, 727.3, 558.6, 338.6. Compute a 95% tolerance interval that has confidence
level 95%.
SOLUTION
95% tolerance interval on the rainfall that has a confidence level of 95%
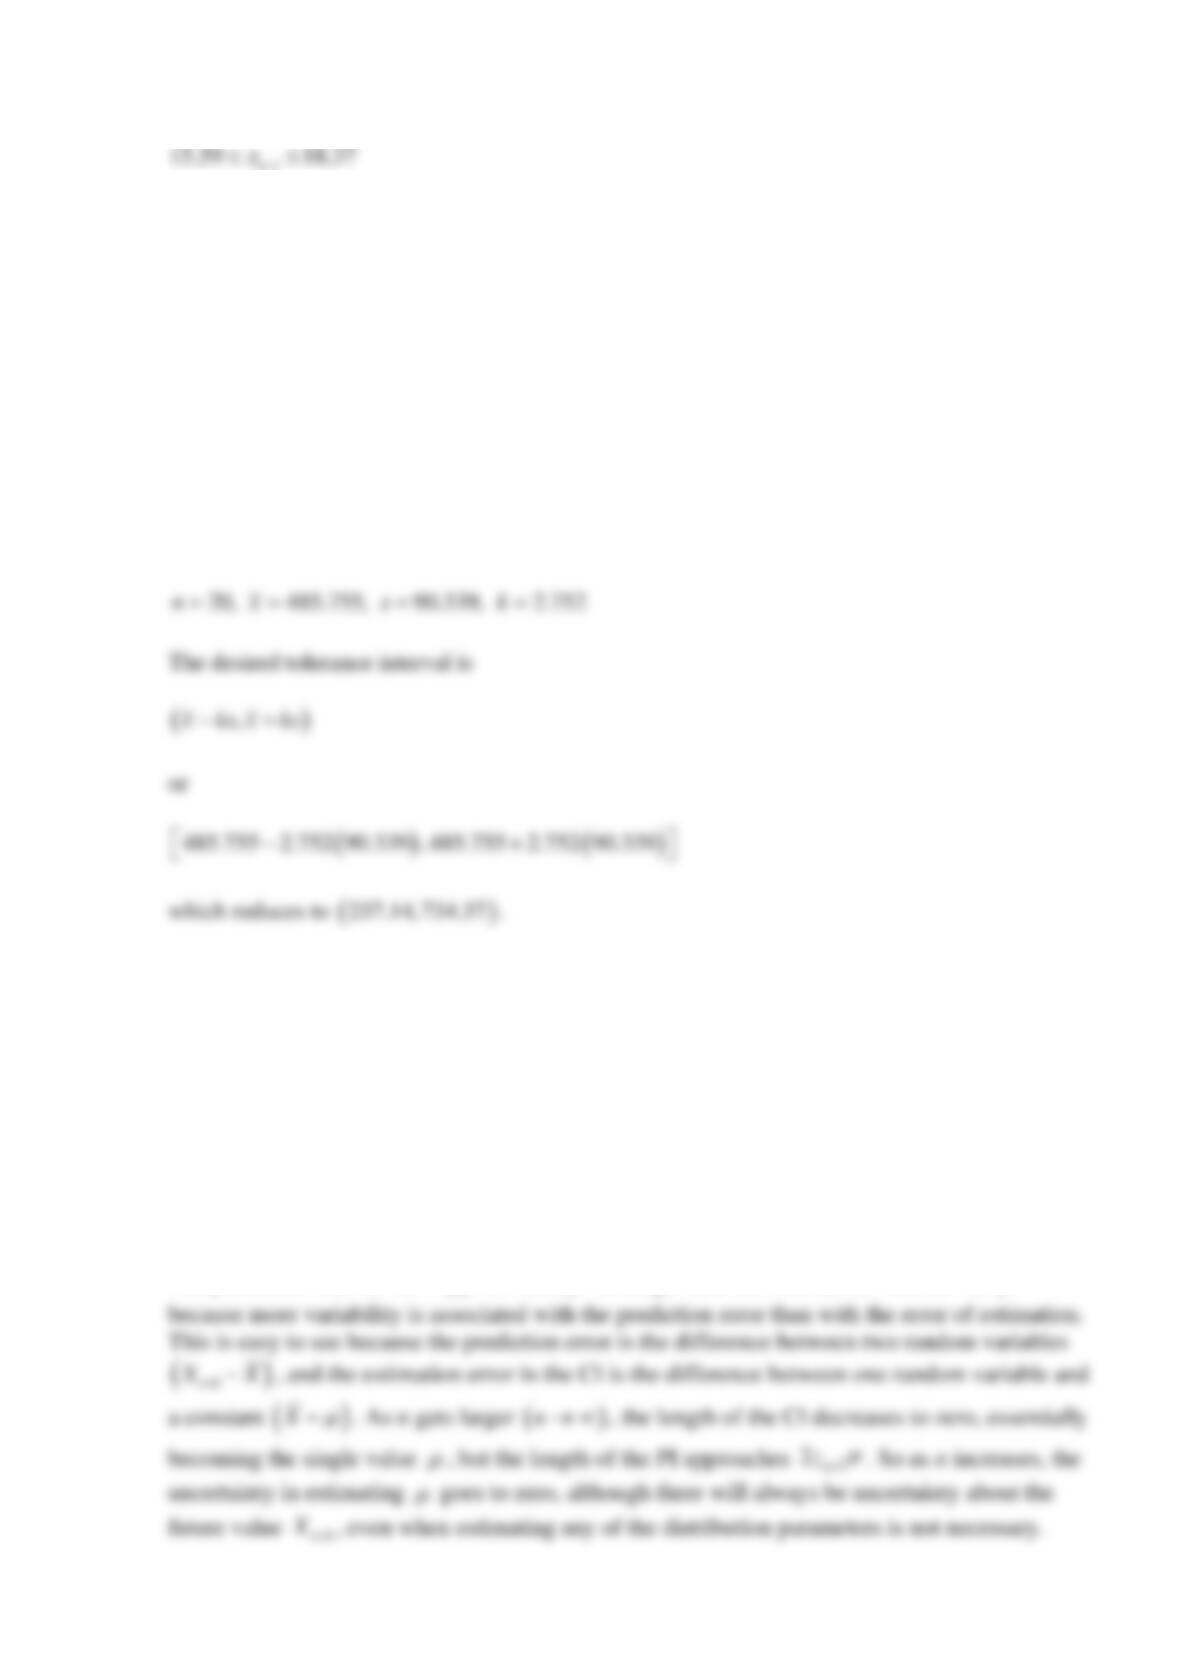
Reserve Problems Chapter 8 Section 7 Problem 1
How might you explain that the prediction interval is considerably longer than the confidence
interval?
SOLUTION
The prediction interval for
1n
X+
will always be longer than the confidence interval for
Reserve Supplemental Exercises Chapter 8 Problem 1
A normal population has a known mean of 50 and unknown variance.
(a) A random sample of
16n=
is selected from this population, and the sample results are
52x=
and
8s=
. What is the probability of observing a sample average as large as 52 (or
larger) if the known, underlying mean is actually 50?
(b) A random sample of
30n=
is selected from this population, and the sample results are
52x=
and
8s=
. What is the probability of observing a sample average as large as 52 (or
larger) if the known, underlying mean is actually 50?
(c) A random sample of
100n=
is selected from this population, and the sample results are
52x=
and
8s=
. What is the probability of observing a sample average as large as 52 (or
larger) if the known, underlying mean is actually 50?
SOLUTION
(a)
16, 52, 8n x s= = =
(b)
30, 52, 8n x s= = =
Reserve Supplemental Exercises Chapter 8 Problem 2
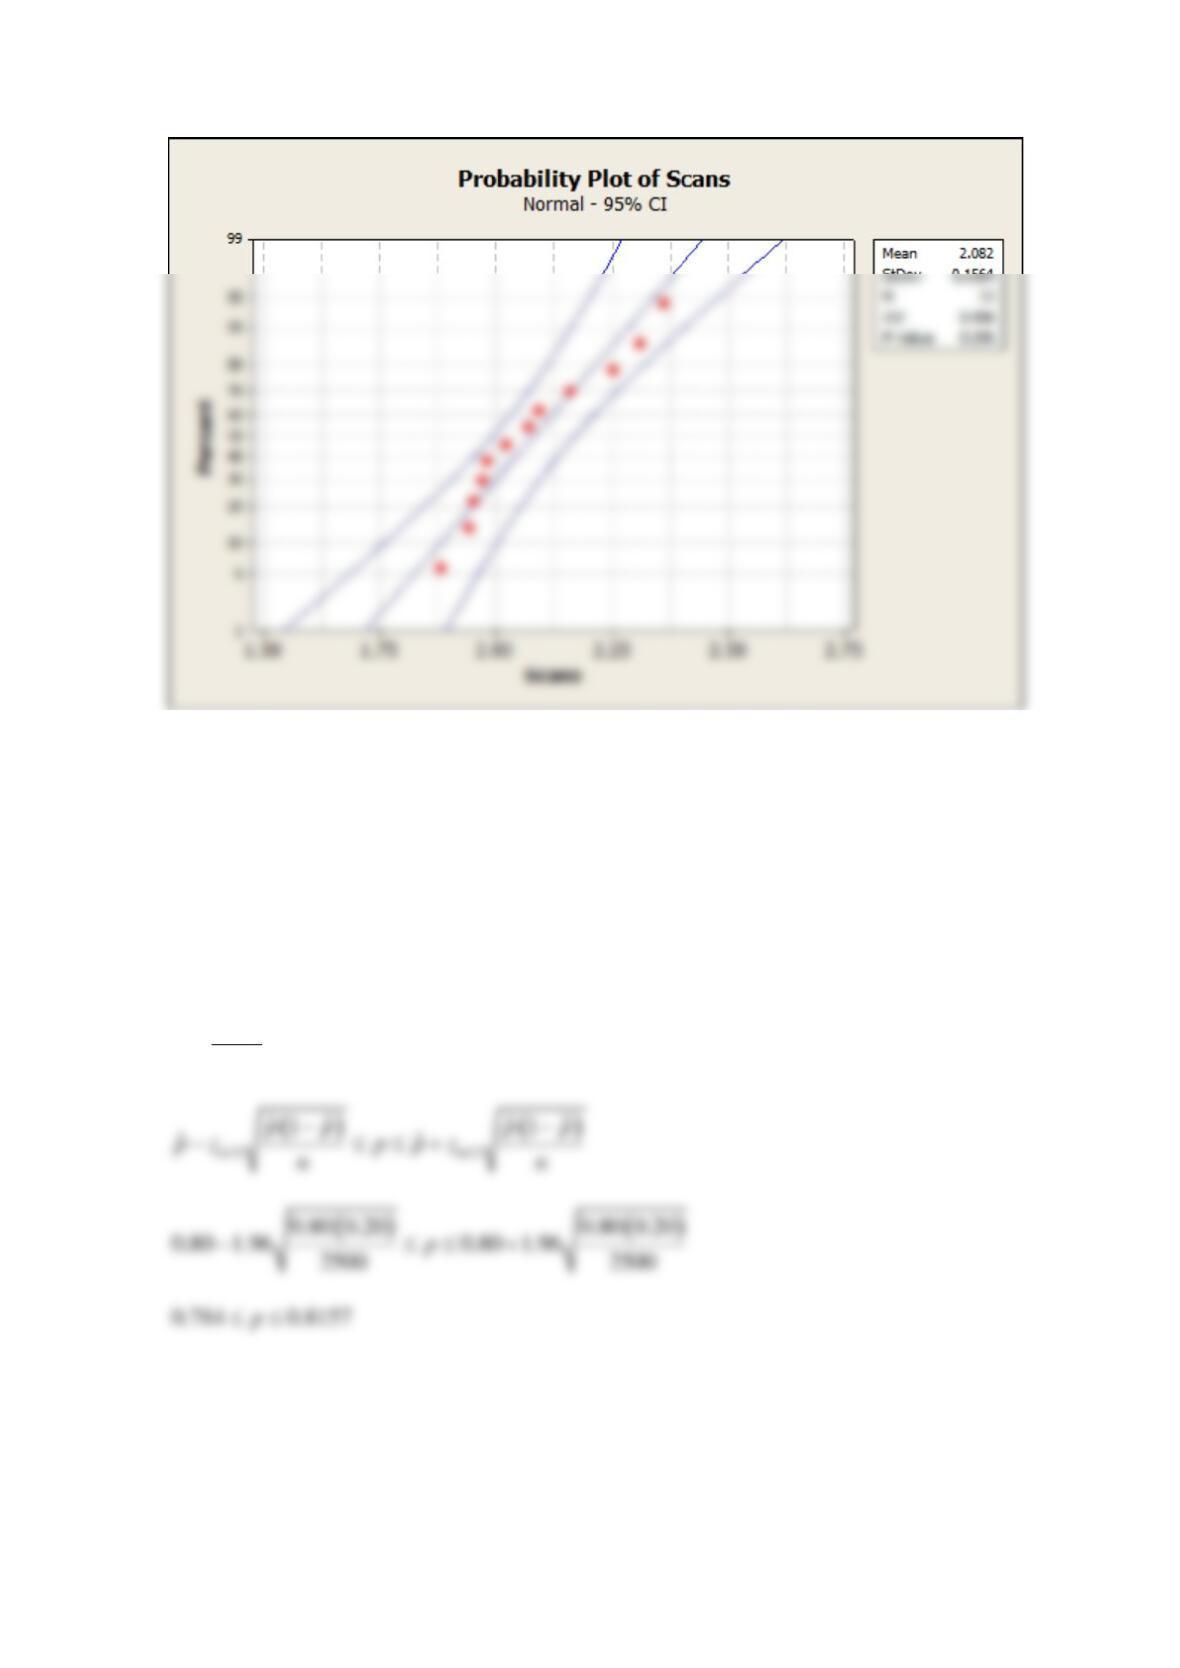
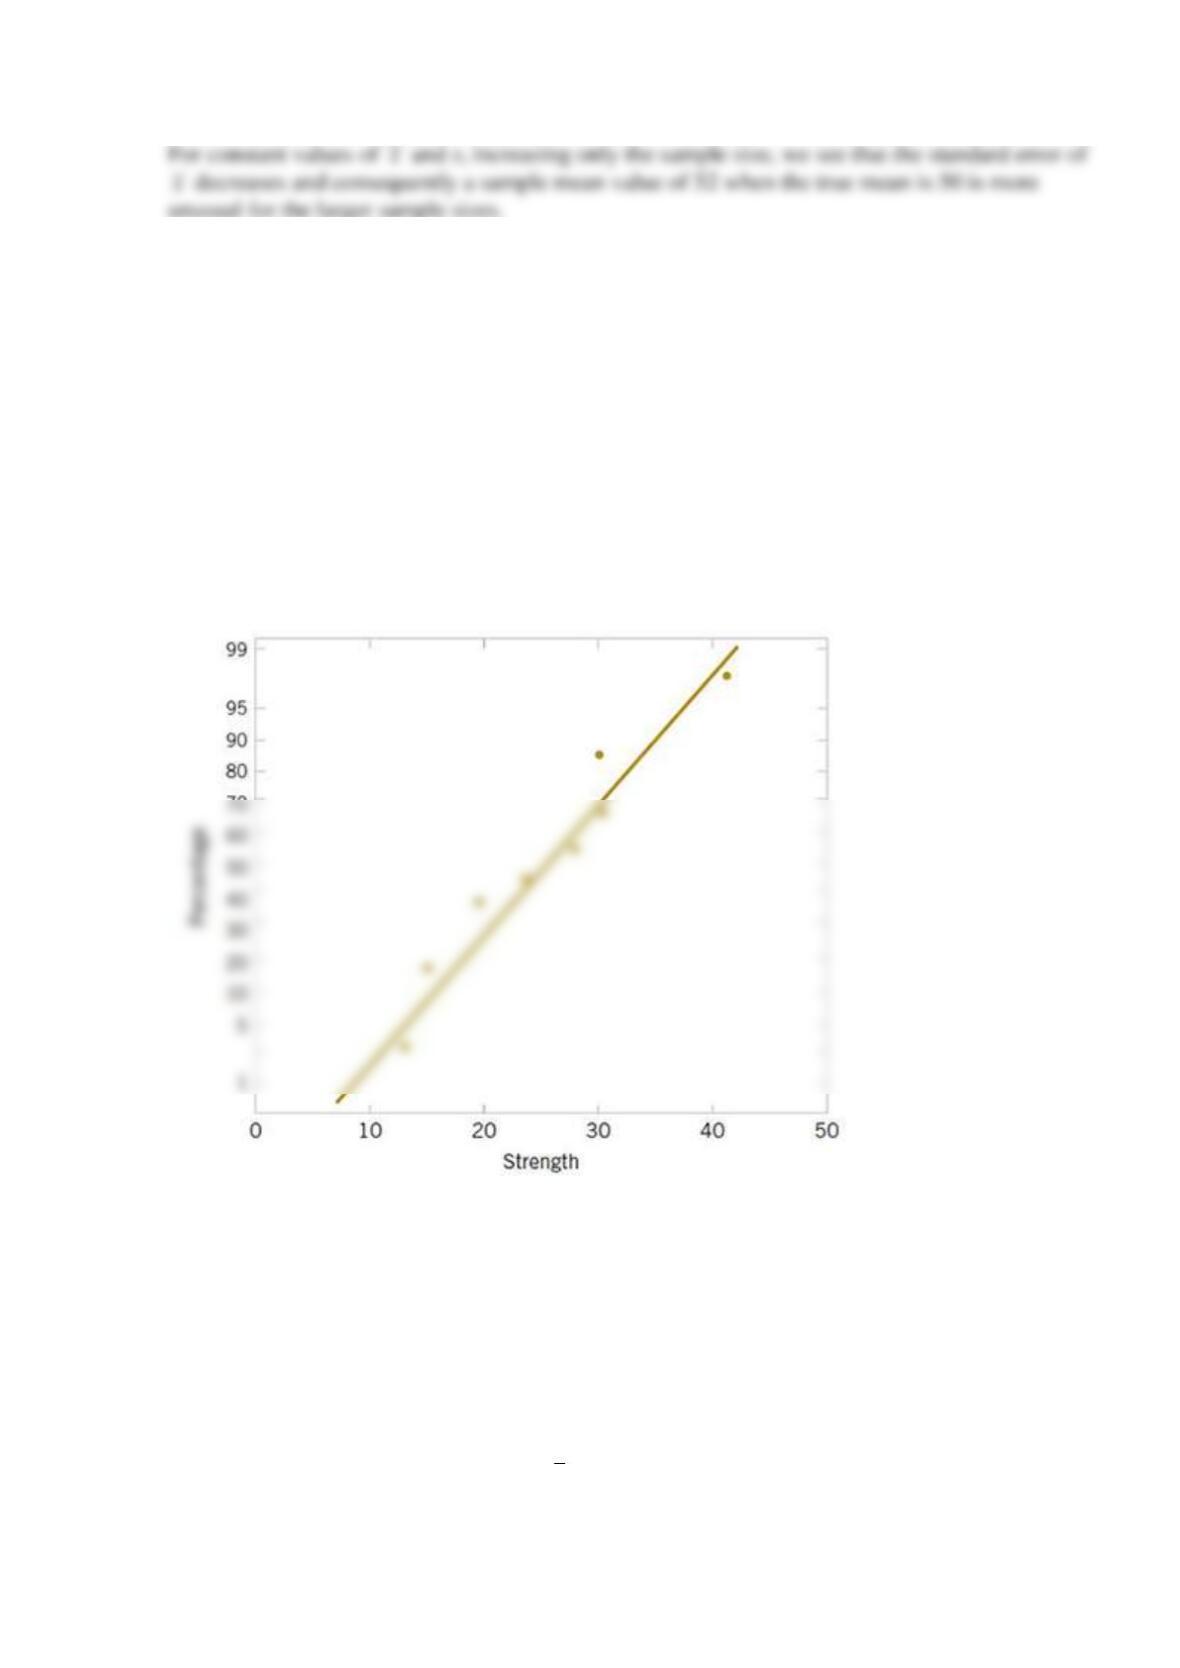
The article “Mix Design for Optimal Strength Development of Fly Ash Concrete” (Cement and
Concrete Research, 1989, Vol. 19(4), pp. 634–640) investigates the compressive strength of
concrete when mixed with fly ash (a mixture of silica, alumina, iron, magnesium oxide, and
other ingredients). The compressive strength for nine samples in dry conditions on the 28th day
are as follows (in megapascals):
40.2, 30.4, 28.9, 30.5, 22.4, 25.8, 18.4, 14.2, 15.3
(a) Given the following probability plot of the data, what is a logical assumption about the
underlying distribution of the data?
(b) Find a 99% lower one-sided confidence interval on mean compressive strength.
(c) Find a 98% two-sided confidence interval on mean compressive strength.
(d) Find a 99% upper one-sided confidence interval on the variance of compressive strength.
(e) Find a 98% two-sided confidence interval on the variance of compression strength.
(f) Suppose that it was discovered that the largest observation 40.2 was misrecorded and should
actually be 20.8. Now the sample mean
22.967x=
and the sample variance
239.593s=
. Use
these new values and repeat parts (c) and (e).
Find a 98% two-sided confidence interval on mean compressive strength.
Find a 98% two-sided confidence interval on the variance of compression strength.
(g) Suppose, instead, that it was discovered that the largest observation 40.2 is correct but that
the observation 25.8 is incorrect and should actually be 24.8. Now the sample mean
25.011x=
and the standard deviation
8.417s=
. Use these new values and repeat parts (c) and (e).
Find a 98% two-sided confidence interval on mean compressive strength.
Find a 98% two-sided confidence interval on
mean compressive strength.
SOLUTION
(a) The probability plot shows that the data appear to be normally distributed.
(c) 98% two-sided confidence interval on the mean
(d) 99% one-sided upper bound on the confidence interval on
2
of comprehensive strength
(e) 98% two-sided confidence interval on
2
of comprehensive strength
(f) 98% two-sided confidence interval on the mean
(g) 98% two-sided confidence interval on the mean
Reserve Supplemental Exercises Chapter 8 Problem 3
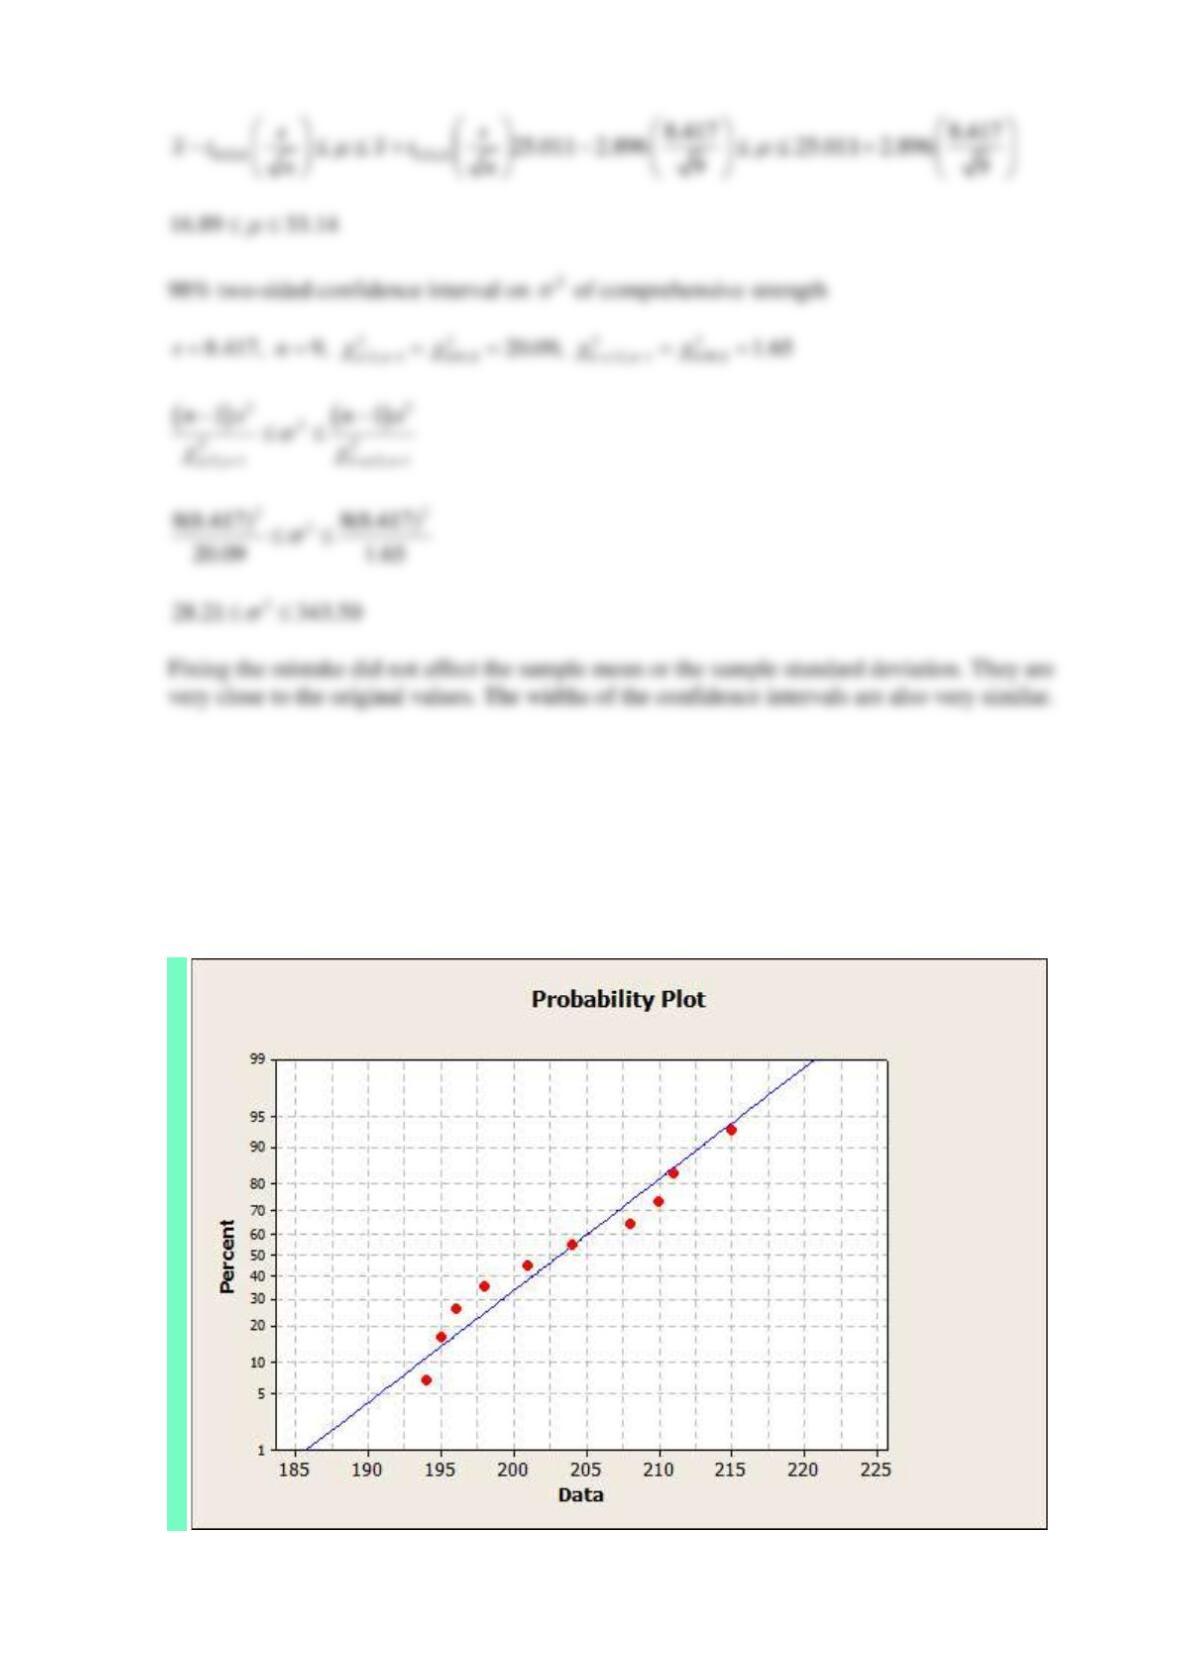
The maker of a shampoo knows that customers like this product to have a lot of foam. Ten
sample bottles of the product are selected at random and the foam heights observed are as
follows (in millimeters): 210, 215, 194, 195, 211, 201, 198, 204, 208, and 196.
(a) Choose the correct probability plot for these data.
A
B
C
D
Is there evidence to support the assumption that foam height is normally distributed?
(b) Find a 95% CI on the mean foam height.
(c) Find a 95% prediction interval on the next bottle of shampoo that will be tested.
(d) Find an interval that contains 95% of the shampoo foam heights with 99% confidence.
SOLUTION
(a) The data appear to be normally distributed.
(b) 95% confidence interval on the mean
(c) 95% prediction interval on a future sample
(d) 95% tolerance interval on foam height with 99% confidence,
4.265k=
Reserve Supplemental Exercises Chapter 8 Problem 4
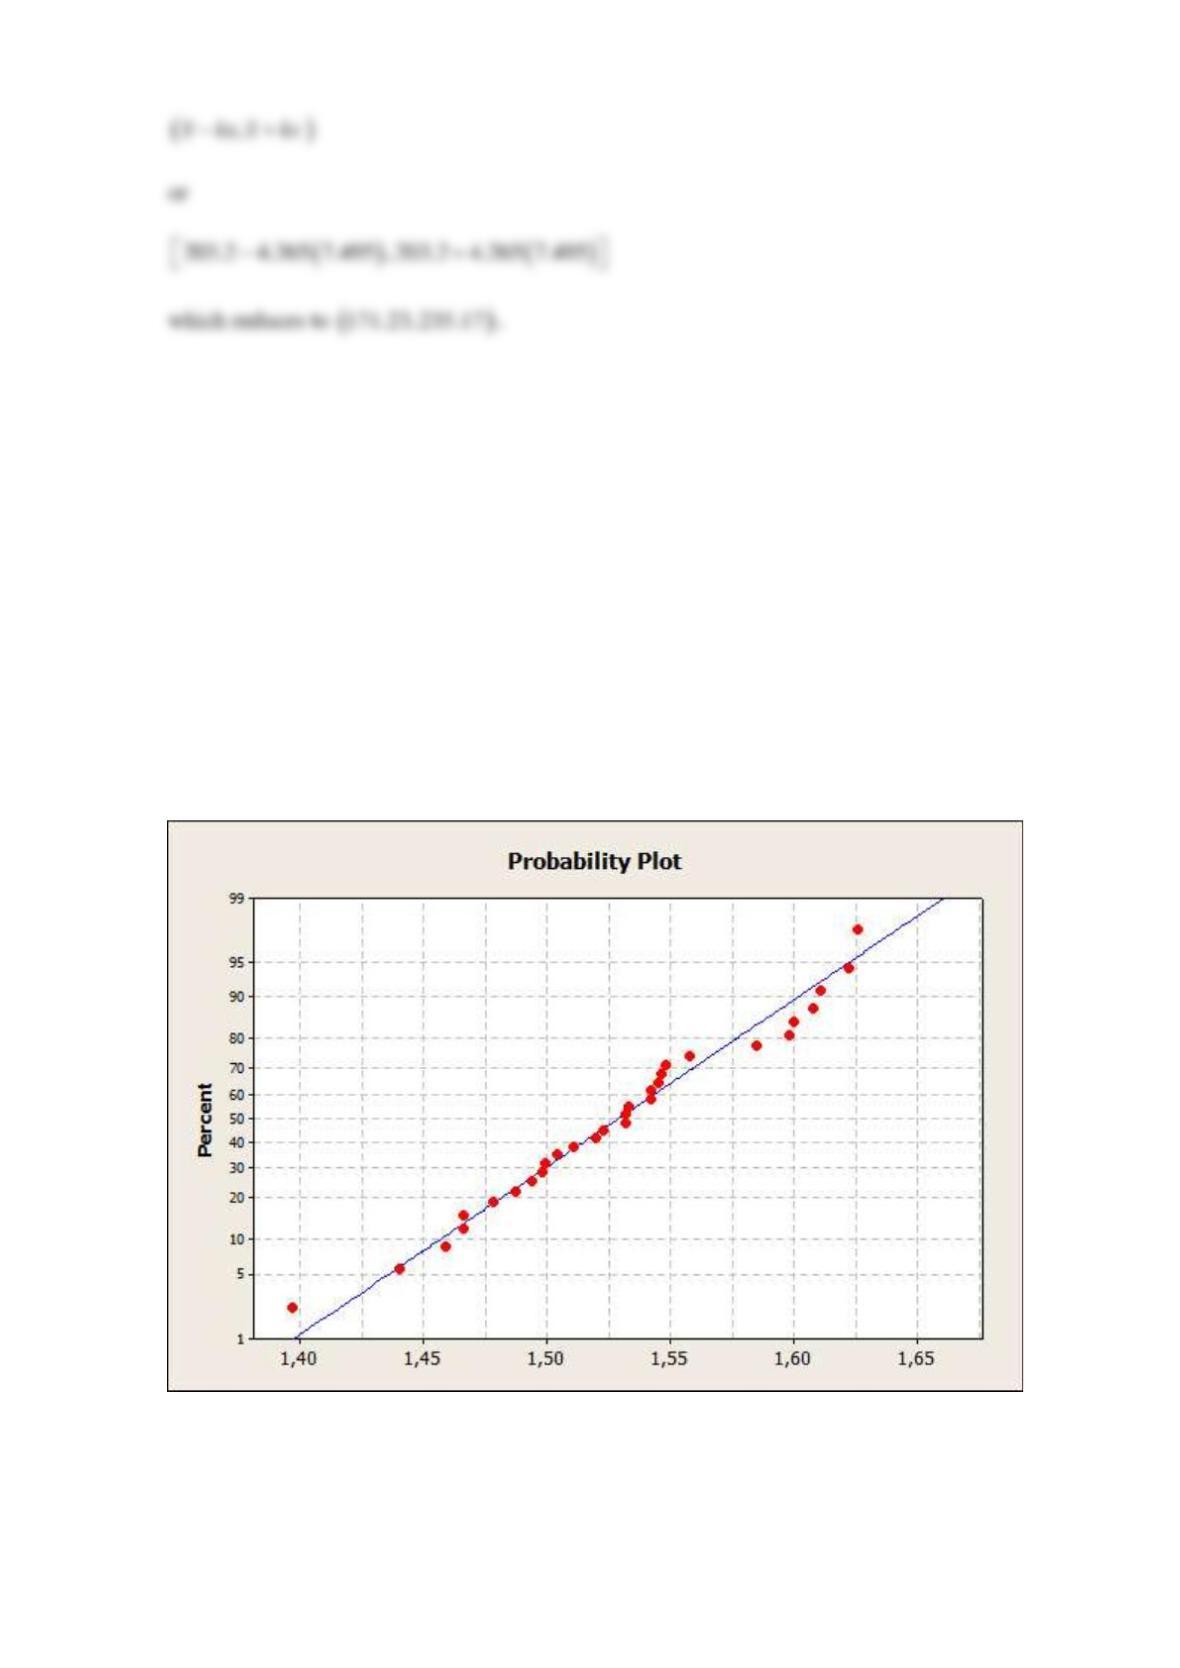
The tar content in 30 samples of cigar tobacco follows:
1.542
1.585
1.532
1.466
1.499
1.611
1.622
1.466
1.546
1.494
1.548
1.626
1.440
1.608
1.520
1.478
1.542
1.511
1.459
1.533
1.532
1.523
1.397
1.487
1.598
1.498
1.600
1.504
1.545
1.558
(a) Given the following probability plot of the data, what is a logical assumption about the
underlying distribution of the data?
(b) Find a 99% CI on the mean tar content.
(c) Find a 99% prediction interval on the tar content for the next observation that will be taken
on this particular type of tobacco.
(d) Find an interval that will contain 99% of the values of the tar content with 95% confidence.
SOLUTION
(c) 99% prediction interval on the tar content for the next observation
Reserve Supplemental Exercises Chapter 8 Problem 5
An article in the Journal of Applied Physiology [“Humidity Does Not Affect Central Nervous
System Oxygen Toxicity” (2001, Vol. 91, pp. 1327–1333)] reported that central nervous system
(CNS) oxygen toxicity can appear in humans on exposure to oxygen pressures >180 kPa. CNS
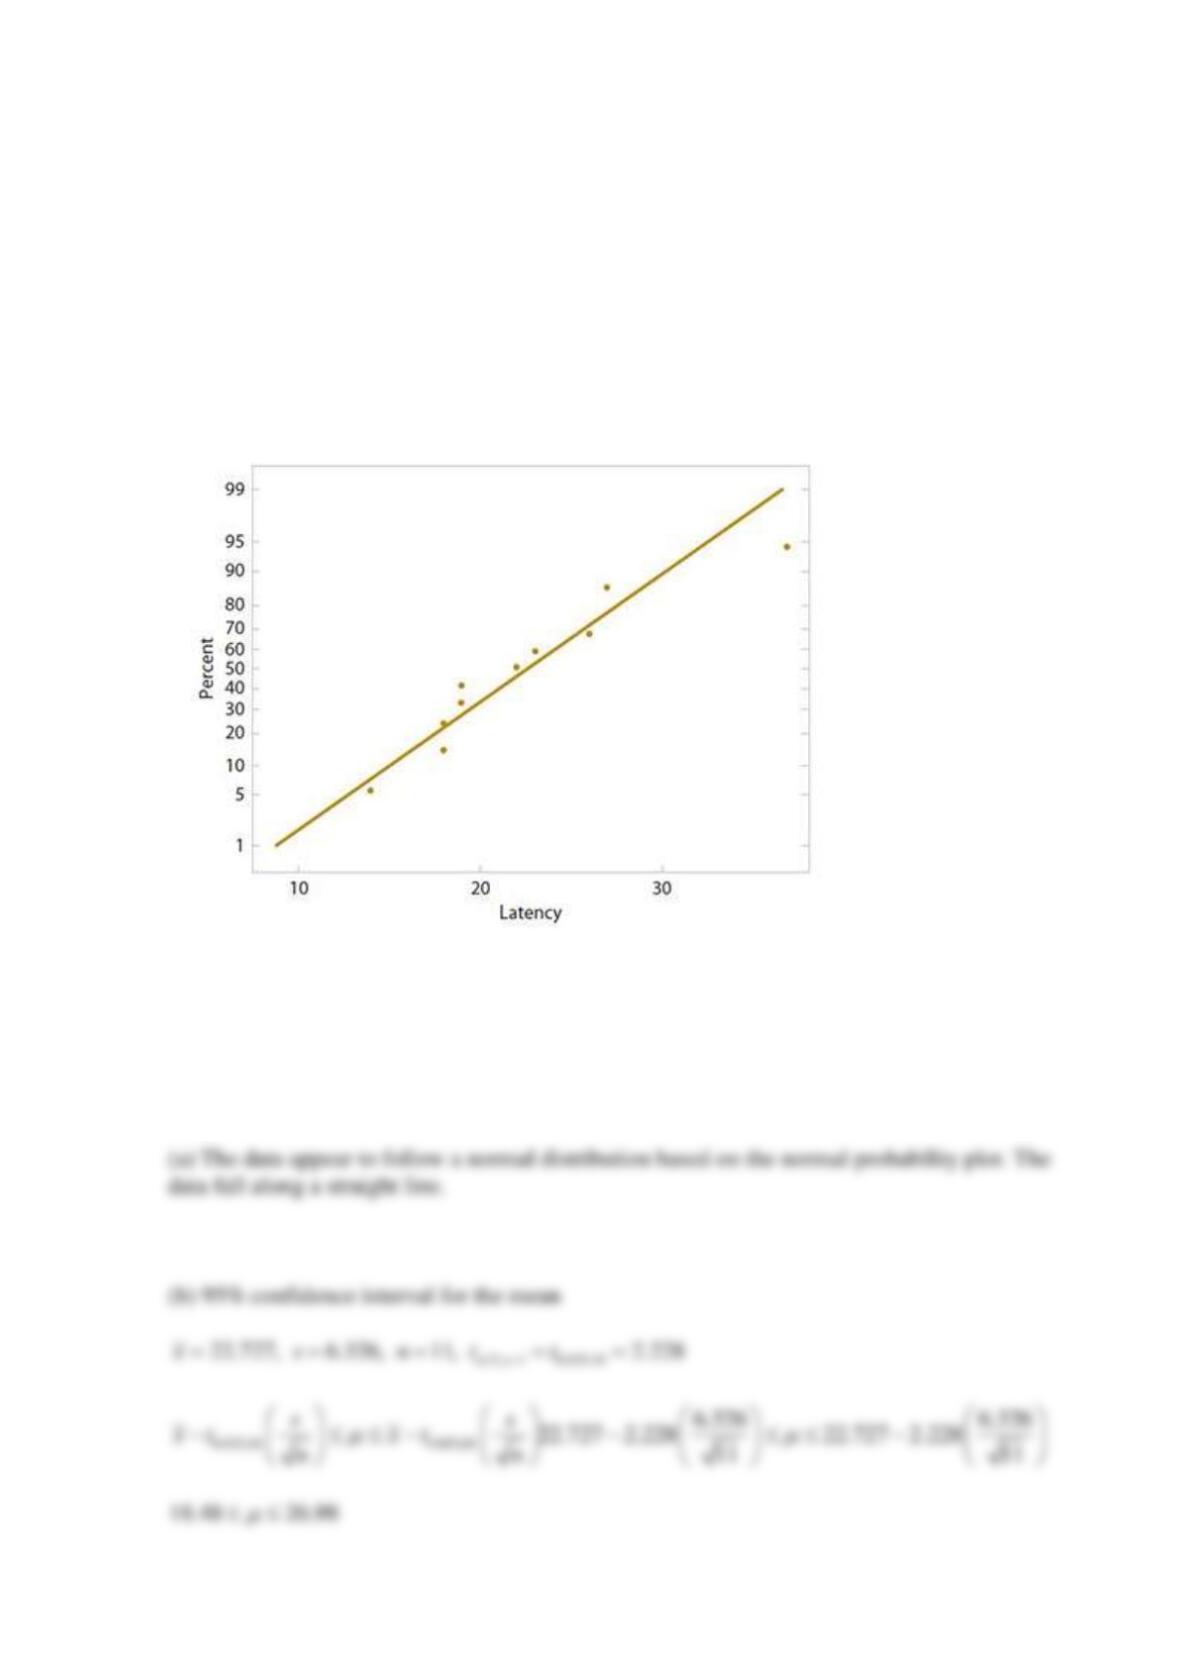
oxygen toxicity can occur as convulsions (similar to epileptic seizures, grand mal) and loss of
consciousness without any warning symptoms. CNS oxygen toxicity is a risk encountered in
several fields of human activity, such as combat diving with closed-circuit breathing apparatus
and diving with mixtures of nitrogen and oxygen (nitrox) or nitrogen, oxygen, and helium
(trimix) in sport and professional diving to depths >30m. The risk of oxygen toxicity is always
considered when deep diving is planned. The following data demonstrate shortened latencies in a
dry atmosphere (<10% humidity) in 11 rats at O2 of 507 kPa. The data collected are as follows:
22, 26, 19, 27, 37, 27, 14, 19, 23, 18, 18.
(a) Given the following probability plot of the data, what is a logical assumption about the
underlying distribution of the data?
(b) Find the 95% confidence interval for the mean.
(с) Find the 95% confidence interval for the variance.
SOLUTION