CHAPTER 7 RESERVE PROBLEMS
The following problems have been reserved for your use in assignments and testing and do not
appear in student versions of the text.
Reserve Problems Chapter 7 Section 1 Problem 1
A random sample of 140 in size is taken from a population with a mean of 1540 and unknown
variance. The sample variance was found out to be 130.
(a) Find the point estimate of the population variance.
(b) Find the mean of the sampling distribution of the sample mean.
SOLUTION
Reserve Problems Chapter 7 Section 1 Problem 2
Service time for a customer coming through a checkout counter in a retail store is a random
variable with the mean of 4.0 minutes and standard deviation of 1.5 minutes. Suppose that the
distribution of service time is fairly close to a normal distribution. Suppose there are two
counters in a store,
141n=
customers in the first line and
251n=
customers in the second line.
Find the probability that the difference between the mean service time for the shorter line
1
X
and
the mean service time for the longer one
2
X
is more than 0.4 minutes. Assume that the service
times for each customer can be regarded as independent random variables.
SOLUTION
Reserve Problems Chapter 7 Section 1 Problem 3
Suppose that the random variable X has the discrete uniform distribution
( )
1/ 4, 3, 4,5, 6.
0, .
x
fx otherwise
=
=
A random sample of
20n=
is selected from this distribution. Find the probability that the
sample mean is greater than 4.8.
SOLUTION
Reserve Problems Chapter 7 Section 1 Problem 4
In order to find out the defect rate of the manufactured components a random sample of
160n=
was selected. Four specimens were found to be defective. Estimate the proportion of defective
components in the population.
SOLUTION
Reserve Problems Chapter 7 Section 2 Problem 1
Consider a normal population with the mean of 40 and standard deviation of 10. A random
sample of
10n=
was selected:
39.2, 45.7, 27.4, 25.9, 25.1, 46.3, 42.9, 49.0, 40.6, 47.0.
Find the probability that the point estimate of the population mean based on the second sample
of
20n=
would be more accurate.
SOLUTION
138.91X=
,
Reserve Problems Chapter 7 Section 2 Problem 2
A normal population has the mean of 20 and the variance of 100. A random sample of size
69n=
is selected.
(a) Find the standard deviation of the sample mean.
(b) How large must the sample be if you want to halve the standard deviation of the sample
mean?
SOLUTION
(a)
Reserve Problems Chapter 7 Section 2 Problem 3
The lamps of type A have the average lifetime of 2000 hours with the variance of 3500. The
lamps of type B have the average lifetime of 2100 hours with the same variance. A random
sample of
100n=
lamps of each type is selected. Let
A
X
and
B
X
be the two sample means.
Find the probability that
90
BA
XX−
.
SOLUTION
Reserve Problems Chapter 7 Section 2 Problem 4
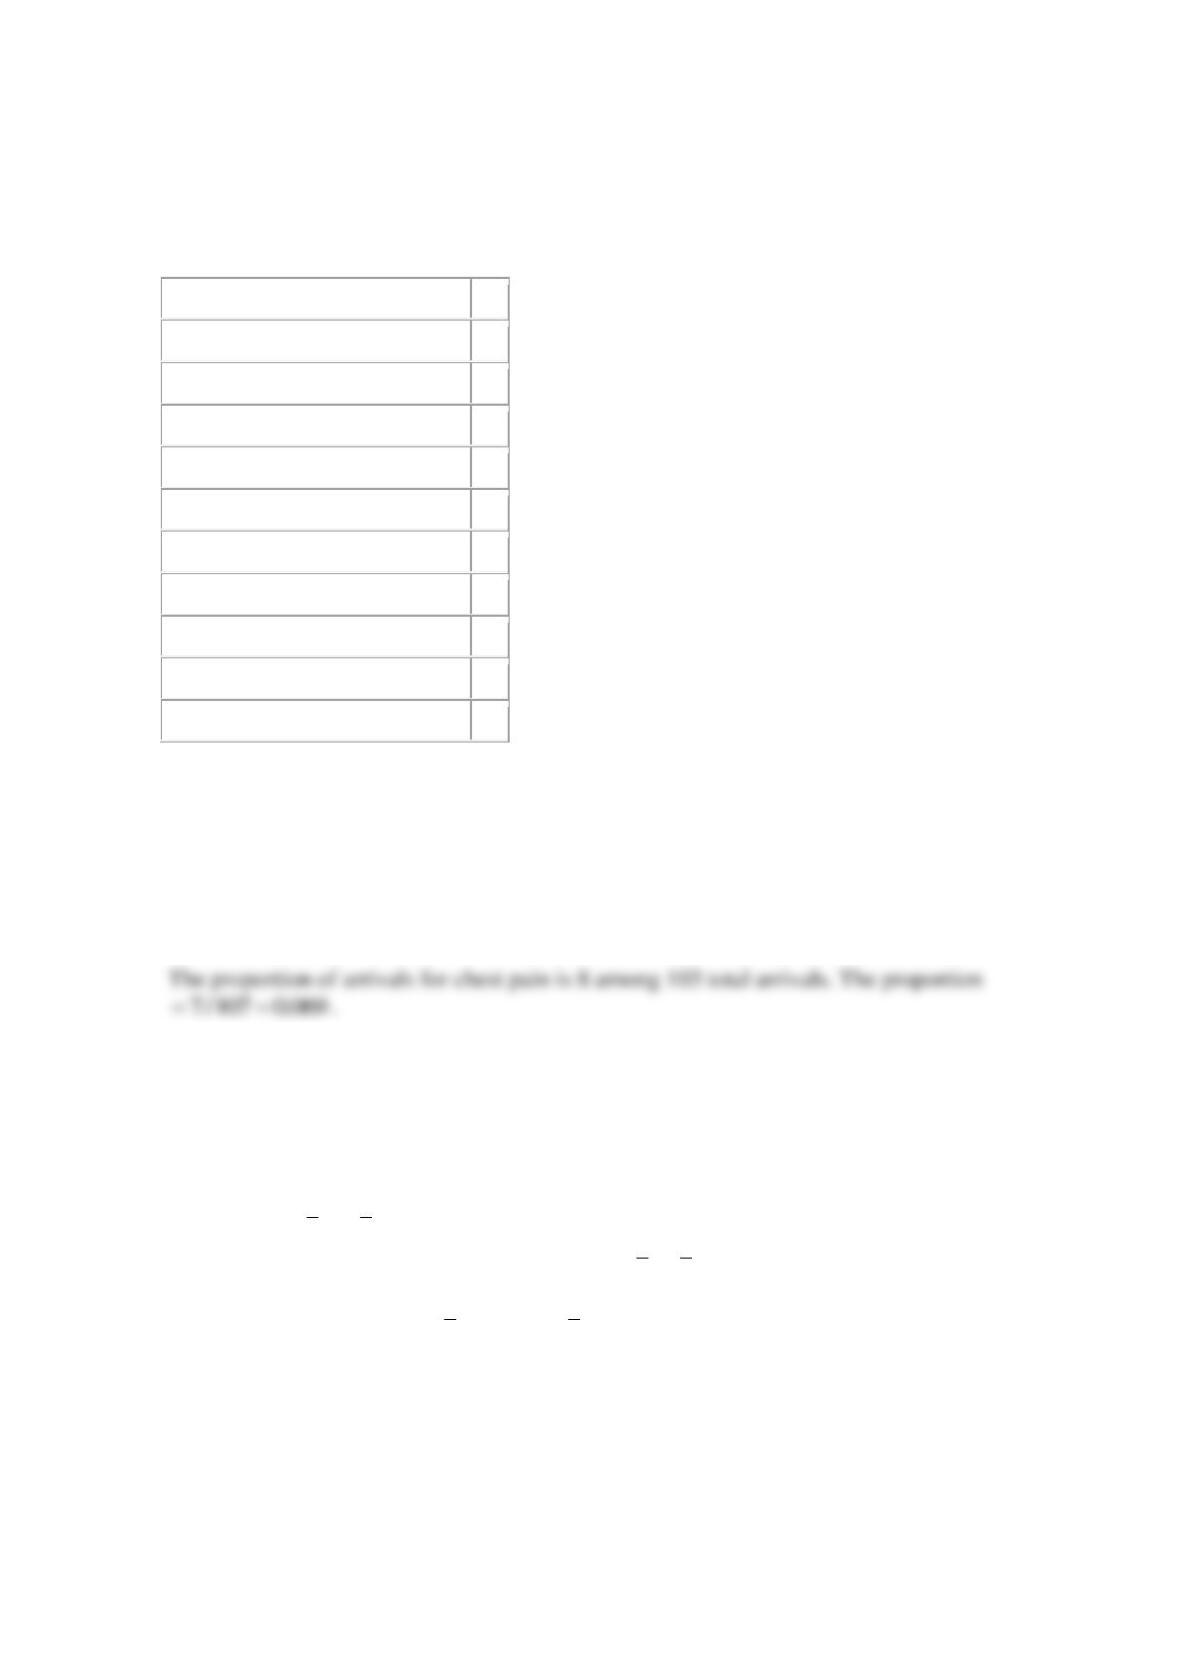
Patients arriving at a hospital emergency department present a variety of symptoms and
complaints. The following data were collected during one weekend night shift (11:00 P.M. to
7:00 A.M.):
Chest pain
7
Difficulty breathing
7
Numbness in extremities
3
Broken bones
11
Abrasions
16
Cuts
21
Stab wounds
9
Gunshot wounds
4
Blunt force trauma
10
Fainting, loss of consciousness
5
Other
9
Estimate the proportion of patients who arrive at this emergency department experiencing chest
pain.
SOLUTION
Reserve Problems Chapter 7 Section 2 Problem 5
A consumer electronics company is comparing the brightness of two different types of picture
tubes for use in its television sets. Tube type A has mean brightness of 100 and standard
deviation of 16, and tube type B has unknown mean brightness, but the standard deviation is
assumed to be identical to that for type A. A random sample of
25n=
tubes of each type is
selected, and
BA
XX
−
is computed. If
B
equals or exceeds
A
, the manufacturer would like to
adopt type B for use. The observed difference is
3.0
BA
xx−=
.
What is the probability that
B
X
exceeds
A
X
by 3.0 or more if
B
and
A
are equal?
Is there strong evidence that
B
is greater than
A
?
SOLUTION
Reserve Problems Chapter 7 Section 2 Problem 6
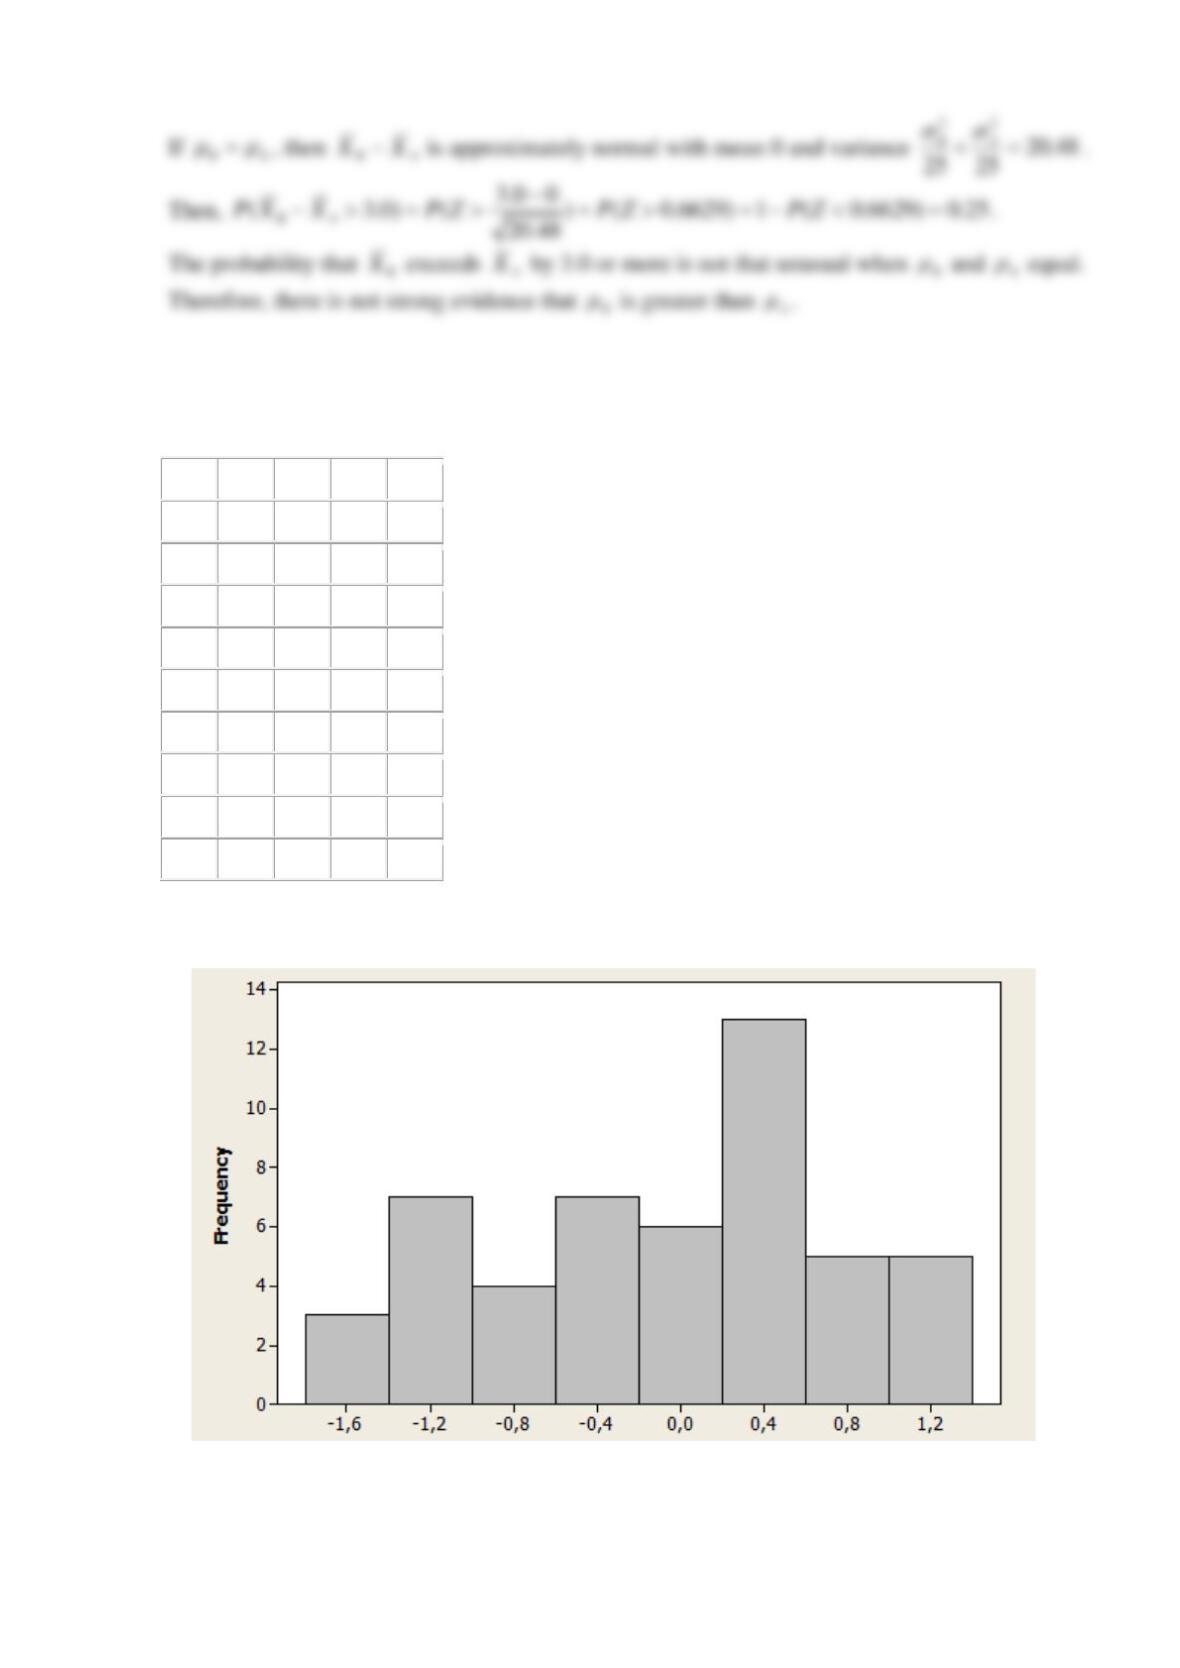
Consider a Weibull distribution with shape parameter 1.5 and scale parameter 2.0.
2.39
1.14
0.56
3.48
1.57
1.53
2.78
3.01
0.55
1.29
2.22
0.64
0.49
0.56
0.11
2.59
1.01
0.43
1.62
3.43
5.50
1.55
0.59
0.61
0.68
0.54
0.99
1.48
2.23
6.25
1.23
2.52
1.27
1.01
6.26
2.43
0.27
1.33
1.27
2.72
0.26
3.59
1.91
0.02
2.94
2.47
0.85
1.58
2.40
2.06
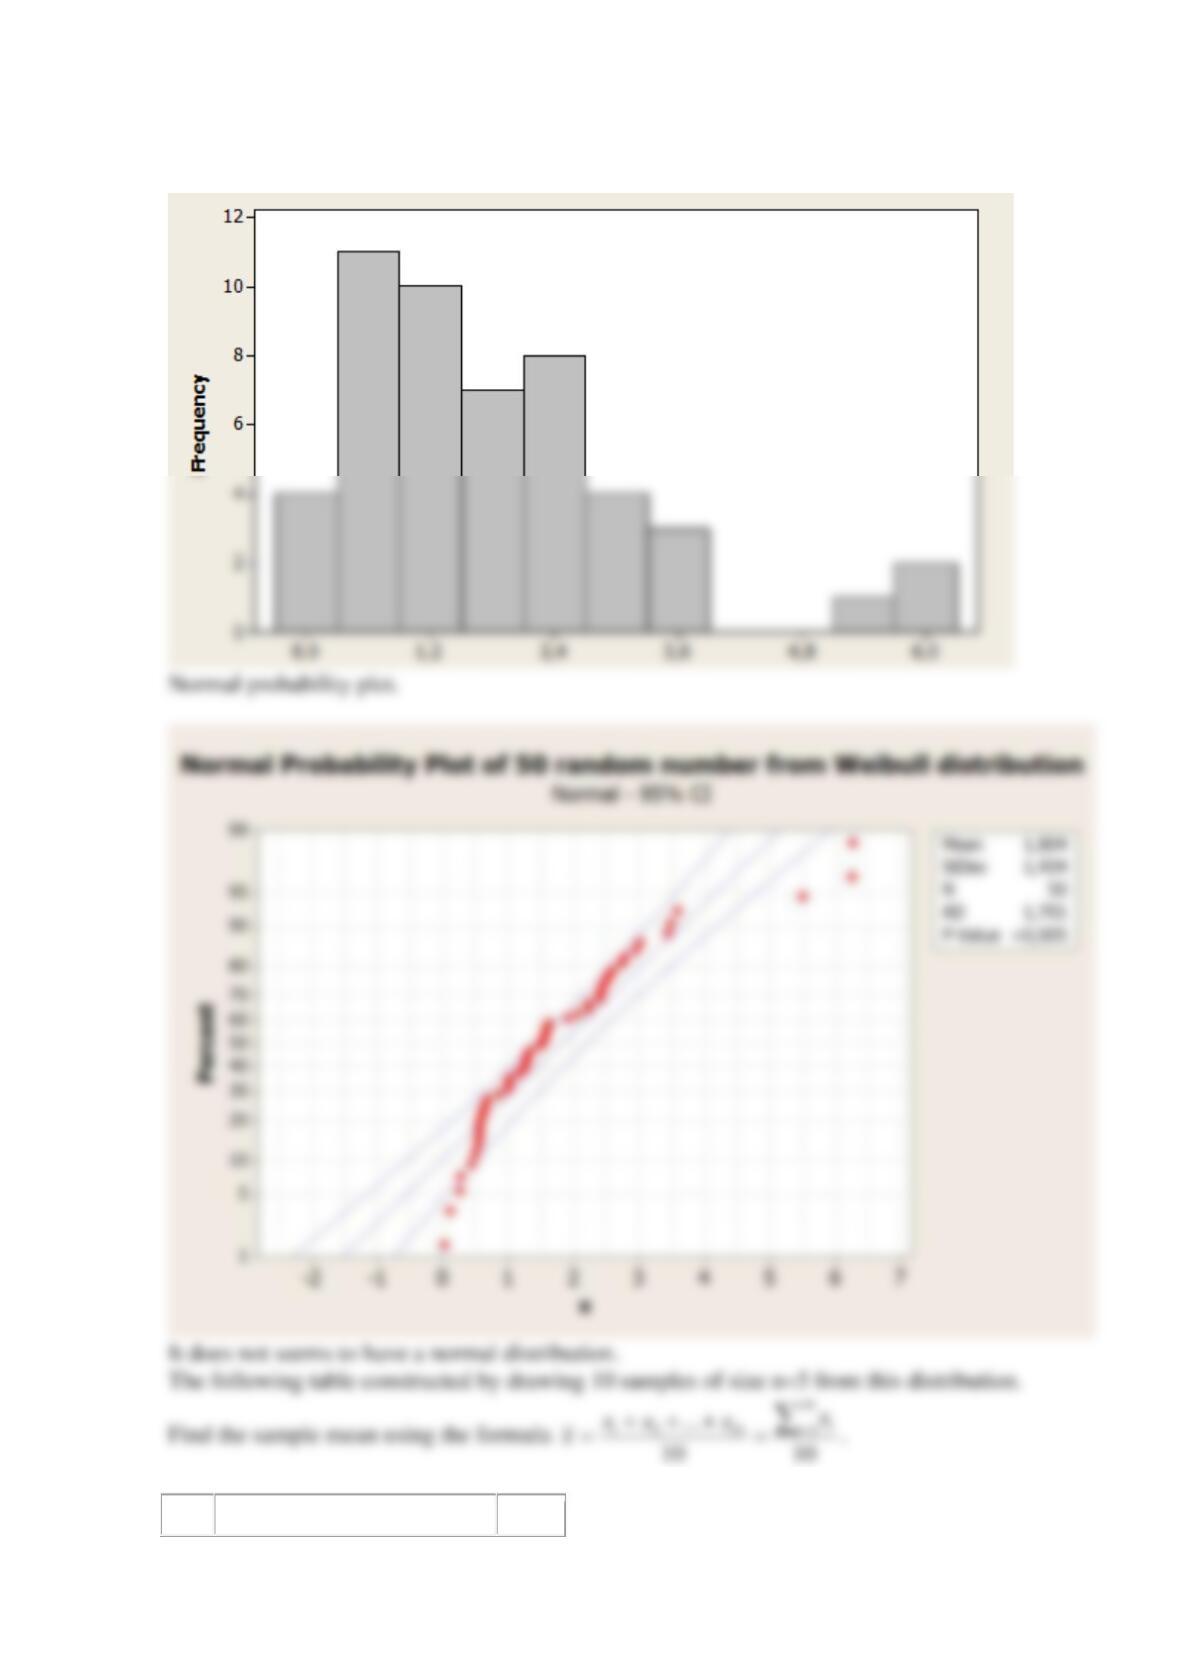
Select the correct histogram.
A
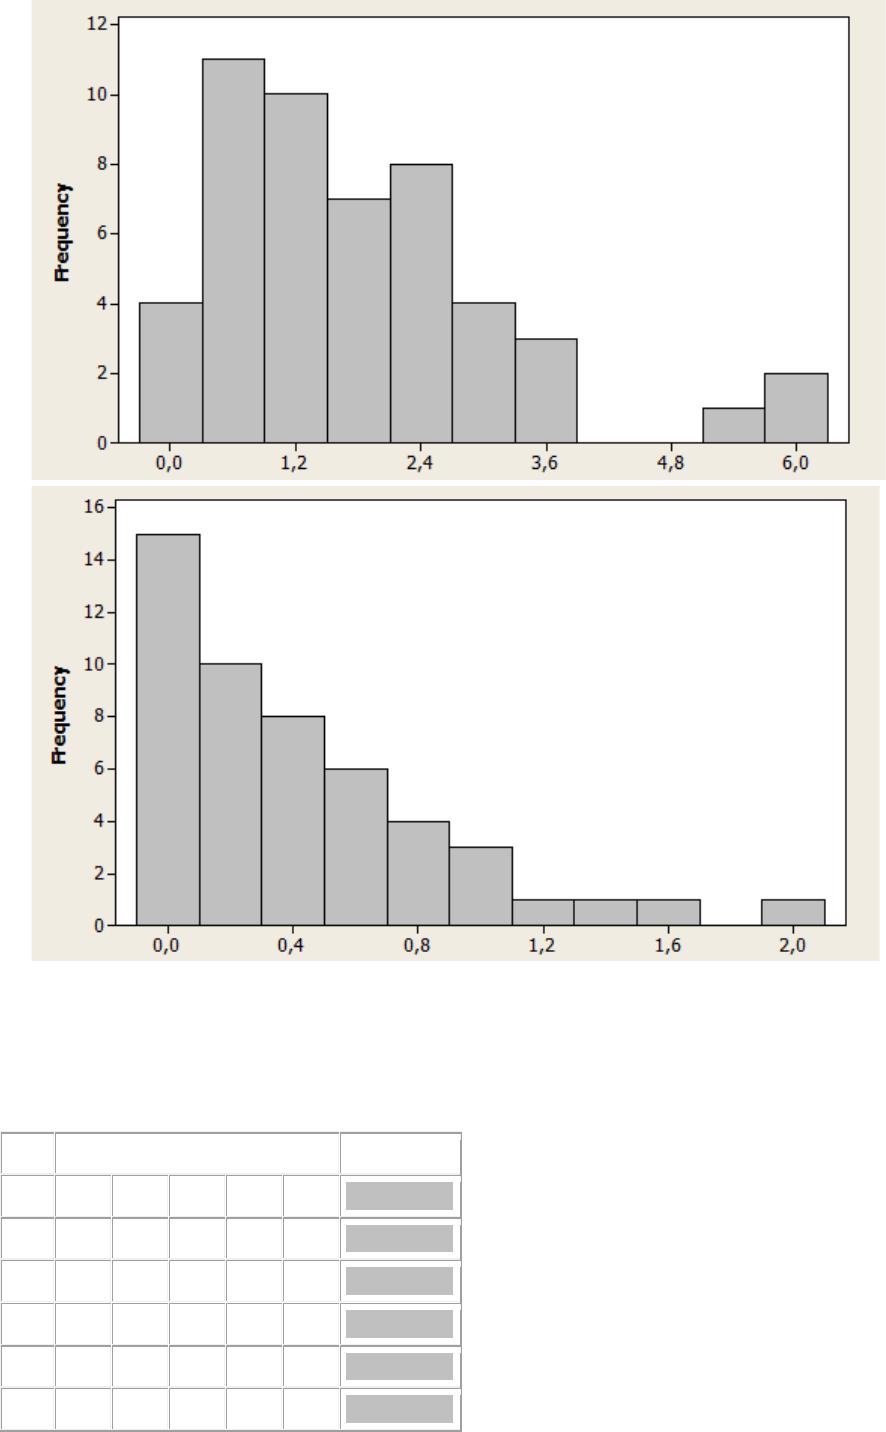
B
C
Normal probability plot: Does it look very much like a normal distribution?
The table constructed by drawing 10 samples of size n=5 from this distribution.
Compute the sample average from each sample.
Obs
Mean
1
2.72
1.27
1.01
6.26
0.55
2.36 ? 0.01
2
0.99
2.59
5.50
1.27
0.64
2.20 ? 0.01
3
6.25
0.61
2.43
6.26
0.68
3.25 ? 0.01
4
0.26
1.29
1.23
1.14
1.57
1.10 ? 0.01
5
1.57
1.01
2.43
0.26
1.58
1.37 ? 0.01
6
1.62
2.72
2.78
2.39
2.94
2.49 ? 0.01
7
0.56
2.47
1.91
0.99
0.27
1.24 ? 0.01
8
2.06
0.59
2.59
1.14
0.54
1.38 ? 0.01
9
3.48
1.55
1.14
3.43
0.68
2.06 ? 0.01
10
1.23
1.01
2.47
0.56
3.59
1.77 ? 0.01
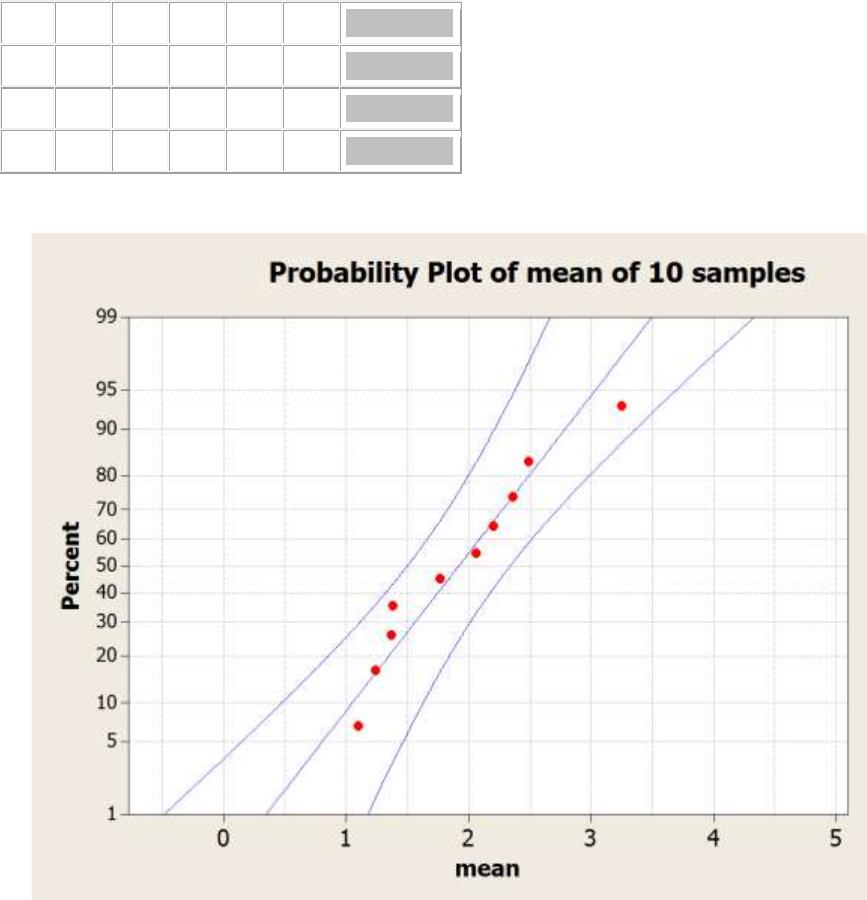
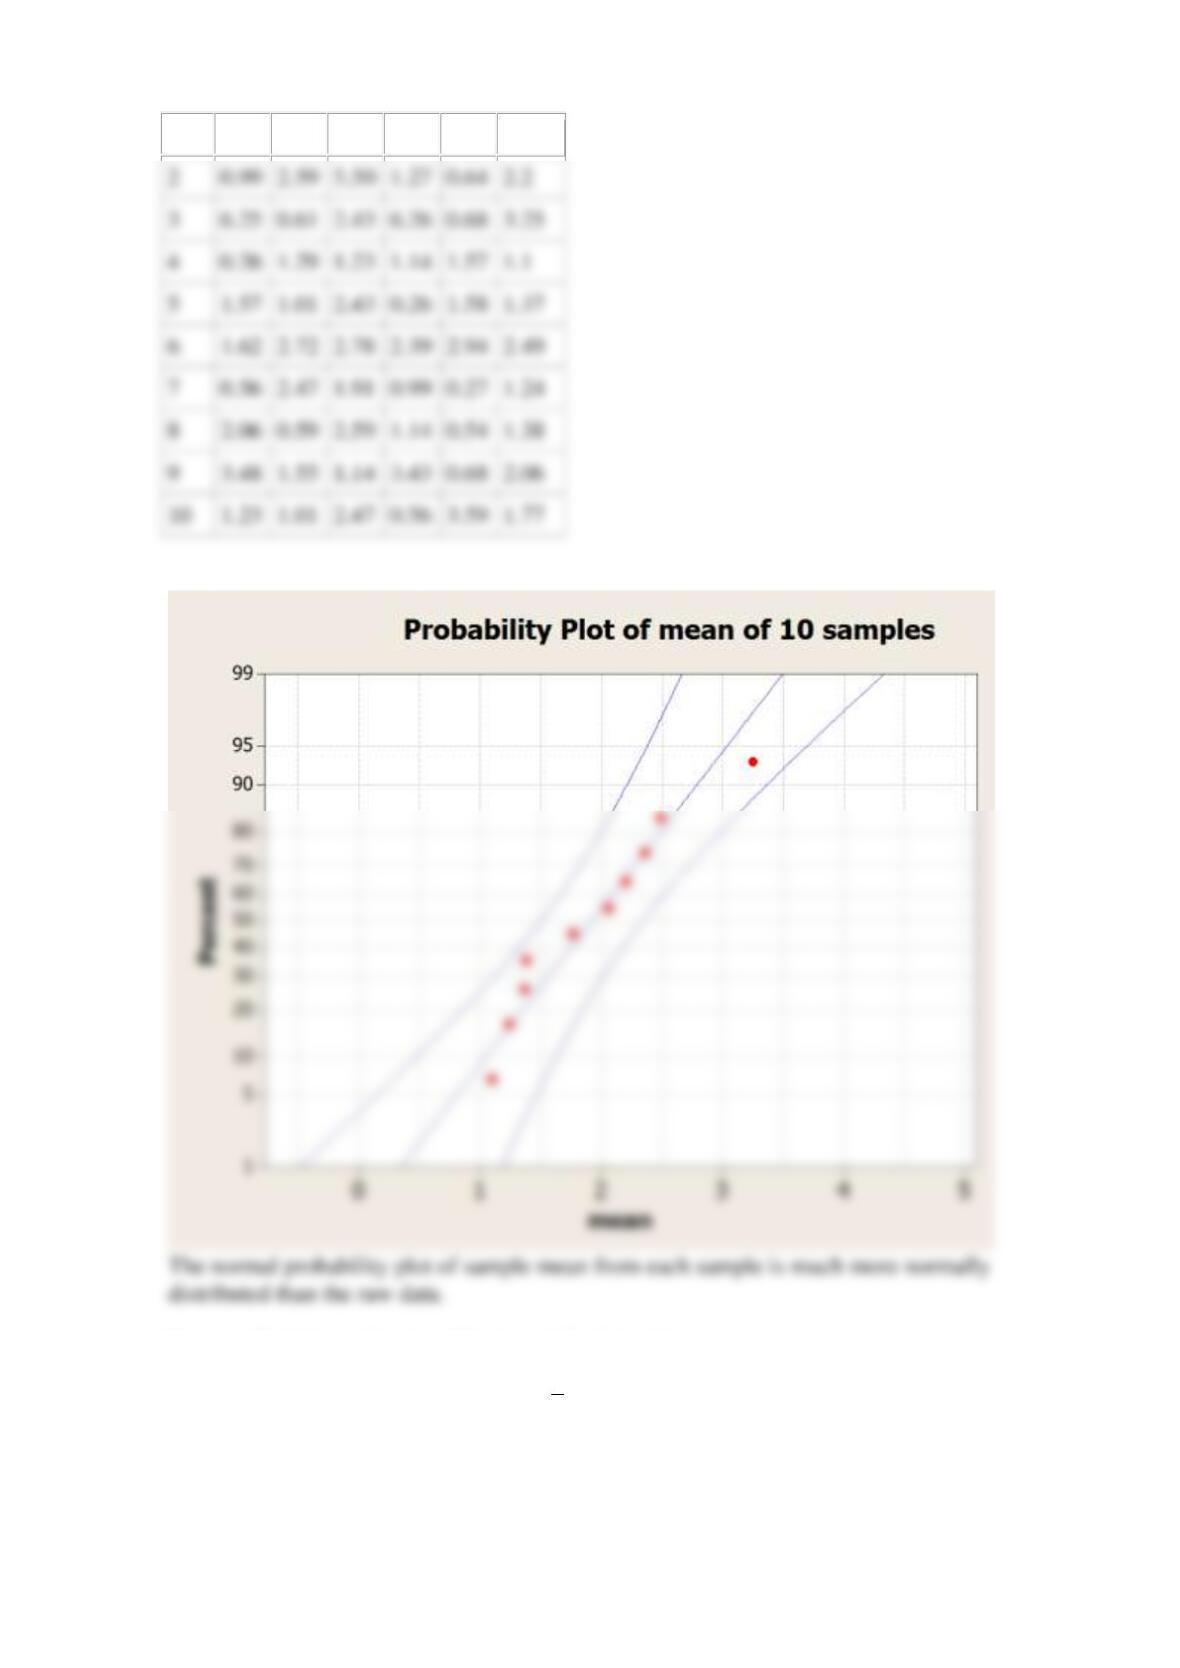
Select the correct normal probability plot of the sample averages.
A
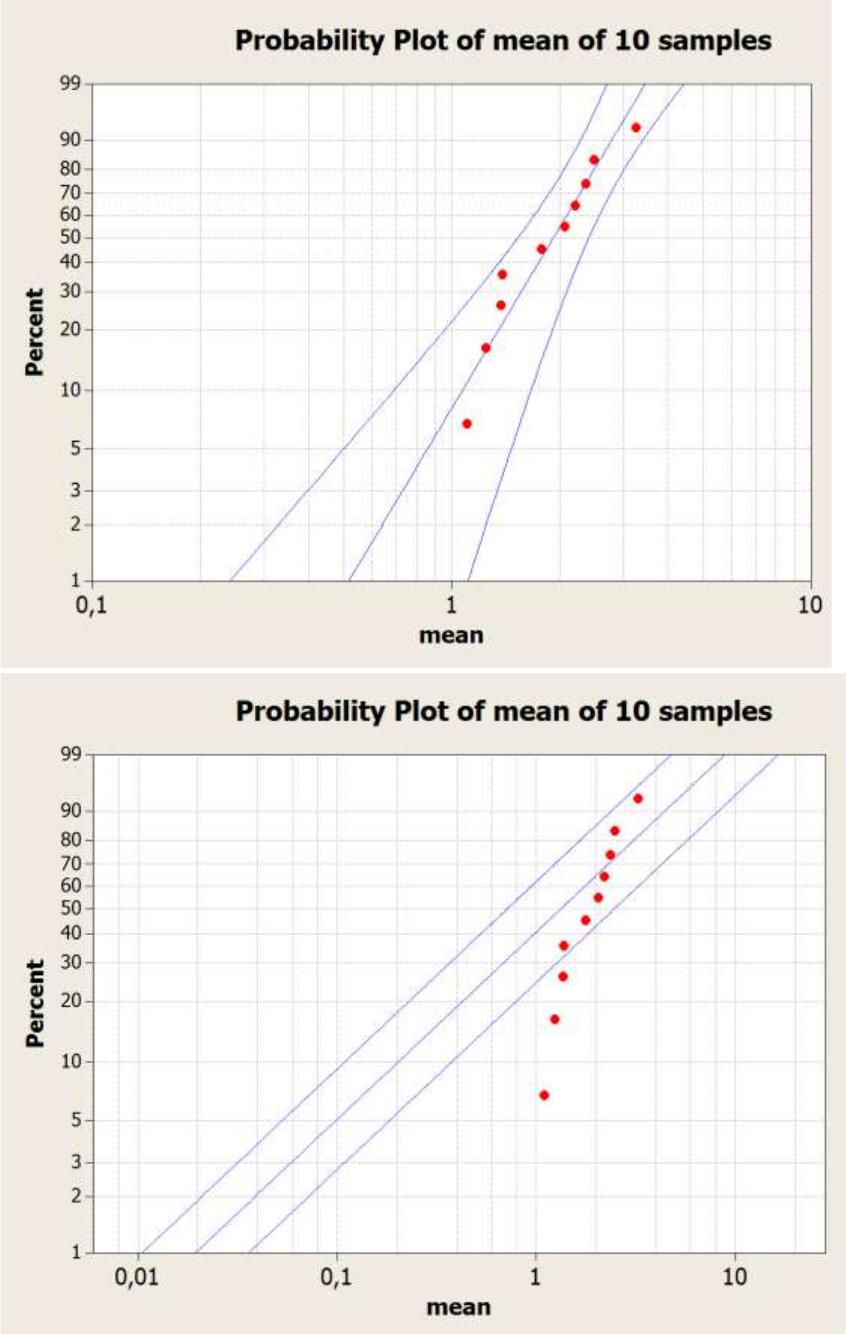
B
C
Do the sample averages seem to be normally distributed?
SOLUTION
The histogram of the data:
Obs
Mean
1
2.72
1.27
1.01
6.26
0.55
2.36
Normal probability plot of the sample averages.
Reserve Problems Chapter 7 Section 3 Problem 1
We have two unbiased estimators:
ˆX
=
, and
22
ˆS
=
. Suppose that X is a random variable
with mean
and variance
2
. There is a random sample of size
5n=
from a population
represented by
1 2 3 4 5
: 28, 27, 34, 21, 38X x x x x x= = = = =
. Find a point estimate of
and
2
.
Use unbiased estimators.
2
0.99
2.59
5.50
1.27
0.64
2.2
3
6.25
0.61
2.43
6.26
0.68
3.25
4
0.26
1.29
1.23
1.14
1.57
1.1
5
1.57
1.01
2.43
0.26
1.58
1.37
6
1.62
2.72
2.78
2.39
2.94
2.49
7
0.56
2.47
1.91
0.99
0.27
1.24
8
2.06
0.59
2.59
1.14
0.54
1.38
9
3.48
1.55
1.14
3.43
0.68
2.06
10
1.23
1.01
2.47
0.56
3.59
1.77
SOLUTION
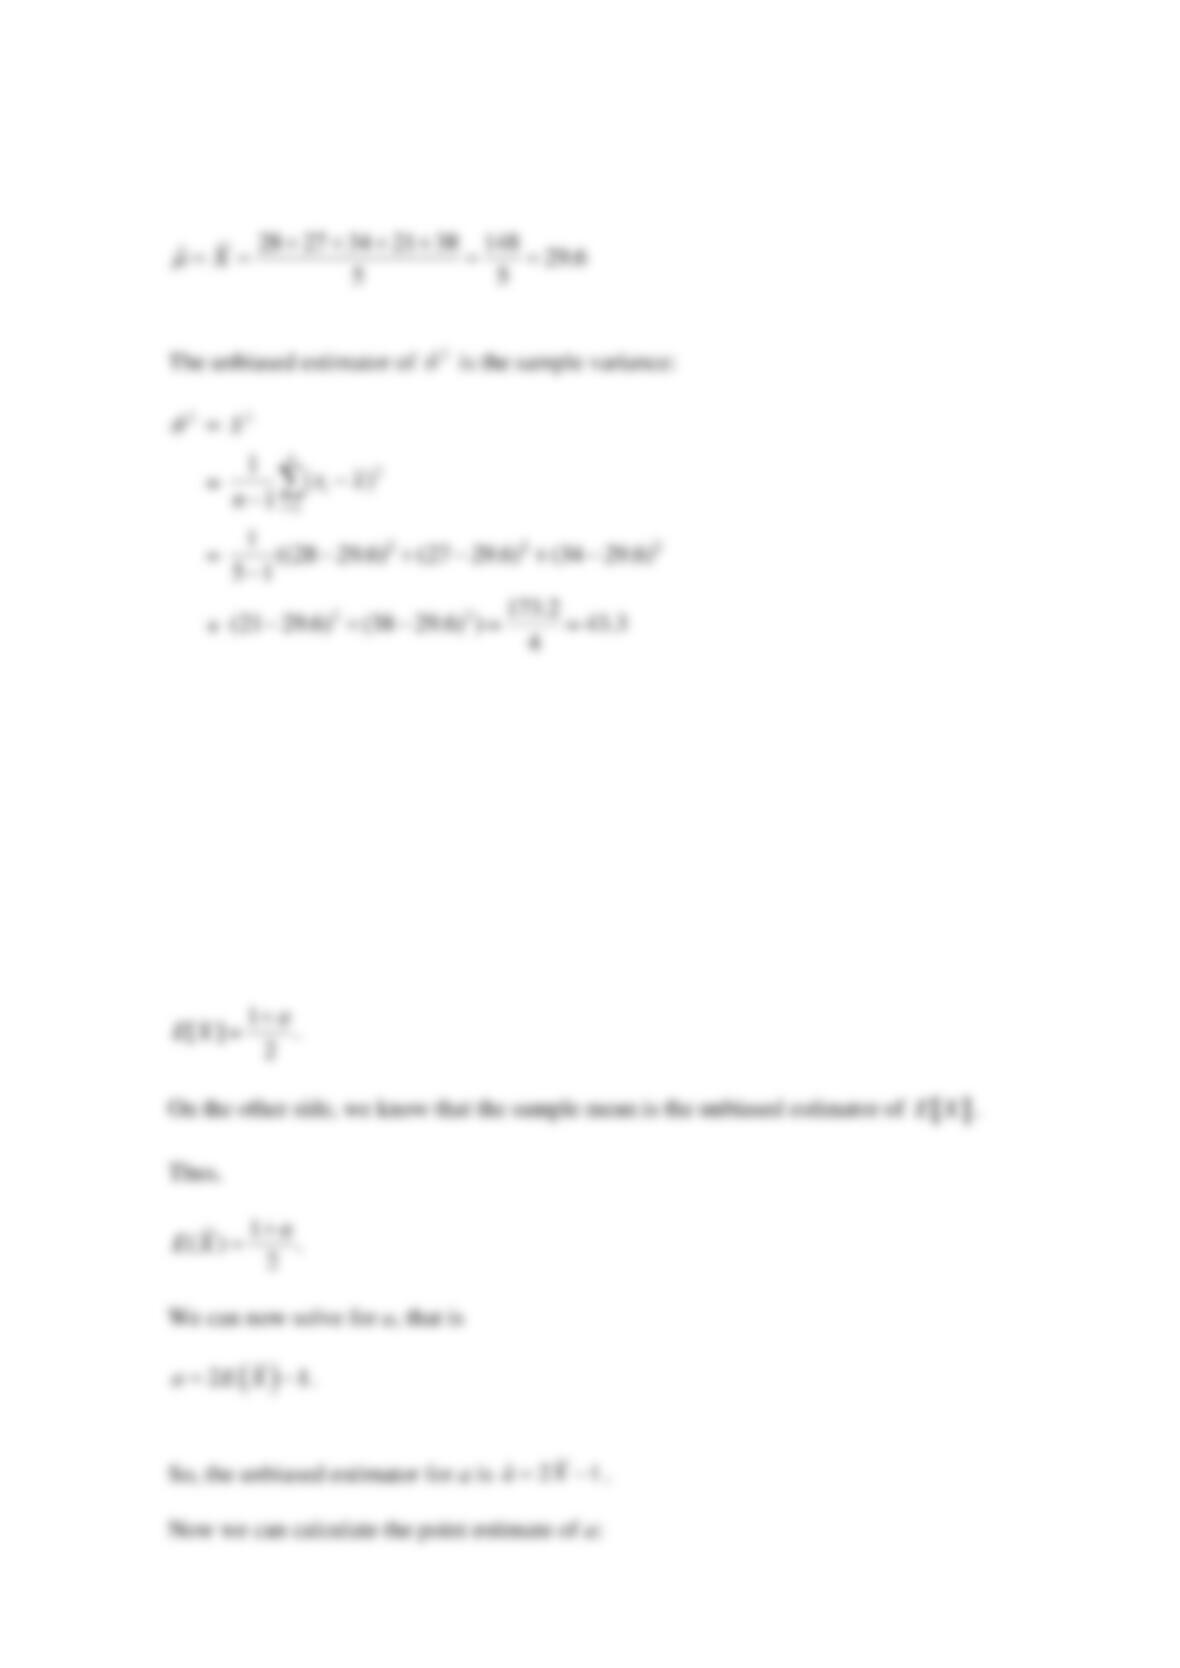
The unbiased estimator of
is the sample mean:
Reserve Problems Chapter 7 Section 3 Problem 2
Suppose that a random variable X has continuous uniform distribution on
1, a
, where a is an
unknown parameter. We have a random sample of 15 in size from a population represented by X:
4.5, 1.3, 8.6, 6.4, 7.4, 4.3, 7.2, 1.6, 4.4, 2.0, 8.4, 6.5, 7.3, 3.4, 7.4..
Find a point estimate of a. Use an unbiased estimator.
SOLUTION
The expected value of X for continuous uniform distribution:
Reserve Problems Chapter 7 Section 3 Problem 3
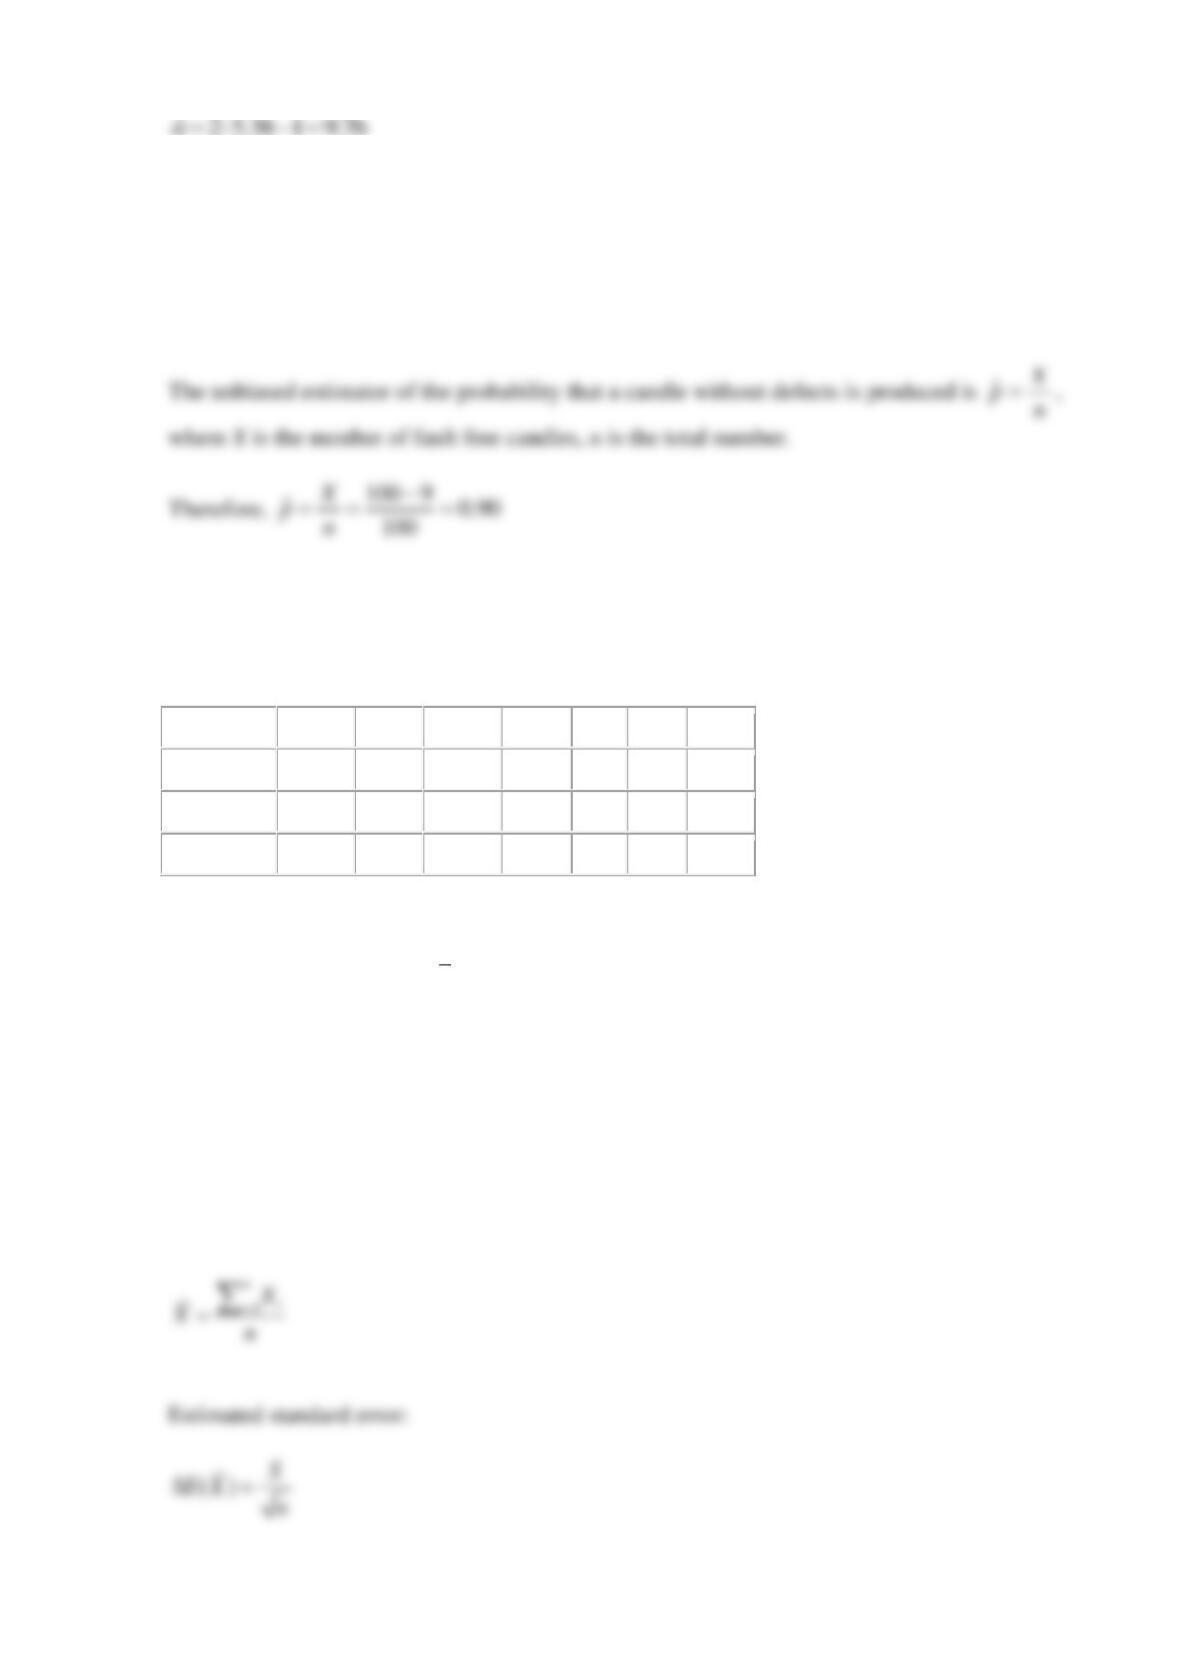
At the candle factory, 10 out of 100 produced candles in the sample are defective. Find a point
estimate of the probability that a fault free candle is produced.
SOLUTION
Reserve Problems Chapter 7 Section 3 Problem 4
The number of passengers for a particular bus route was counted, and data for 3 weeks are
shown in the table:
Mon
Tue
Wed
Thu
Fri
Sat
Sun
Week 1
29
33
26
28
30
39
31
Week 2
28
31
29
37
28
37
25
Week 3
33
37
30
28
25
39
28
(a) Calculate a point estimate of the mean number of passengers and its standard error. Consider
the unbiased estimator
ˆX
=
.
(b) Calculate a point estimate of the mean number of passengers and its standard error on
weekdays and weekends separately.
SOLUTION
(a)
A point estimate of the mean number:
Reserve Problems Chapter 7 Section 3 Problem 5
The diameter of the cylinder is 52 cm, its height was measured 7 times. Measurements are as
follows:
58.3, 58.1, 57.9, 57.7, 58.2, 57.8, 58.1cm. Calculate a point estimate of the cylinder volume.
Consider the unbiased estimator
X
. Use
3.14
=
.
SOLUTION
Reserve Problems Chapter 7 Section 3 Problem 6
A boy threw a ball 25 times. Kinetic energy of the ball is as follows:
25.66, 30.71, 18.32, 16.77, 24.05, 19.49, 14.22, 20.03, 14.21, 28.43, 28.03, 22.07, 29.48, 14.91,
17.12, 15.12, 27.97, 23.02, 23.37, 27.55, 23.48, 19.90, 15.78, 28.88, 29.71 J. Calculate a point
estimate of the proportion of all ball throws whose energy deviation from the mean is larger than
the standard deviation.
SOLUTION
Reserve Problems Chapter 7 Section 3 Problem 7
Suppose that
1
ˆ
and
2
ˆ
are estimators of the parameter
. We know that
( )
1
ˆ
E
=
,
( )
22
ˆ/E
=
,
( )
10
ˆ1V=
,
( )
2
ˆ4V=
.
Which estimator is better for unbiasedness?
Under which conditions
2
ˆ
is more efficient than
1
ˆ
?
SOLUTION
Reserve Problems Chapter 7 Section 3 Problem 8
Let three random samples of sizes
118n=
,
210n=
, and
38n=
be taken from a population with
mean
and variance
2
. Let
2
1
S
,
2
2
S
, and
2
3
S
be the sample variances.
Is
( )
2 2 2 2
1 2 3
18 10 8 / 36S S S S= + +
biased or unbiased estimator of
2
?
SOLUTION
2
Reserve Problems Chapter 7 Section 3 Problem 9
Suppose that the random variable X has a lognormal distribution with parameters
1.5
=
and
0.8
=
. A sample of size
10n=
is drawn from this distribution. In order to find the standard
error of the sample median of this distribution with the bootstrap method
5
B
n=
bootstrap
samples are generated.
Sample
1
7.01
3.58
7.04
3.58
7.86
14.68
3.01
8.56
7.66
10.84
2
4.75
14.66
4.76
7.66
5.29
4.48
4.98
6.07
6.37
1.50
3
23.72
2.80
6.03
5.89
3.58
2.22
6.50
1.52
3.19
9.59
4
1.50
4.75
5.63
1.87
5.27
1.83
7.66
5.63
4.55
4.20
5
6.98
10.21
1.50
6.03
4.97
3.19
10.86
6.37
6.33
4.98
Find the standard error of the sample median of this distribution with the bootstrap method.
SOLUTION