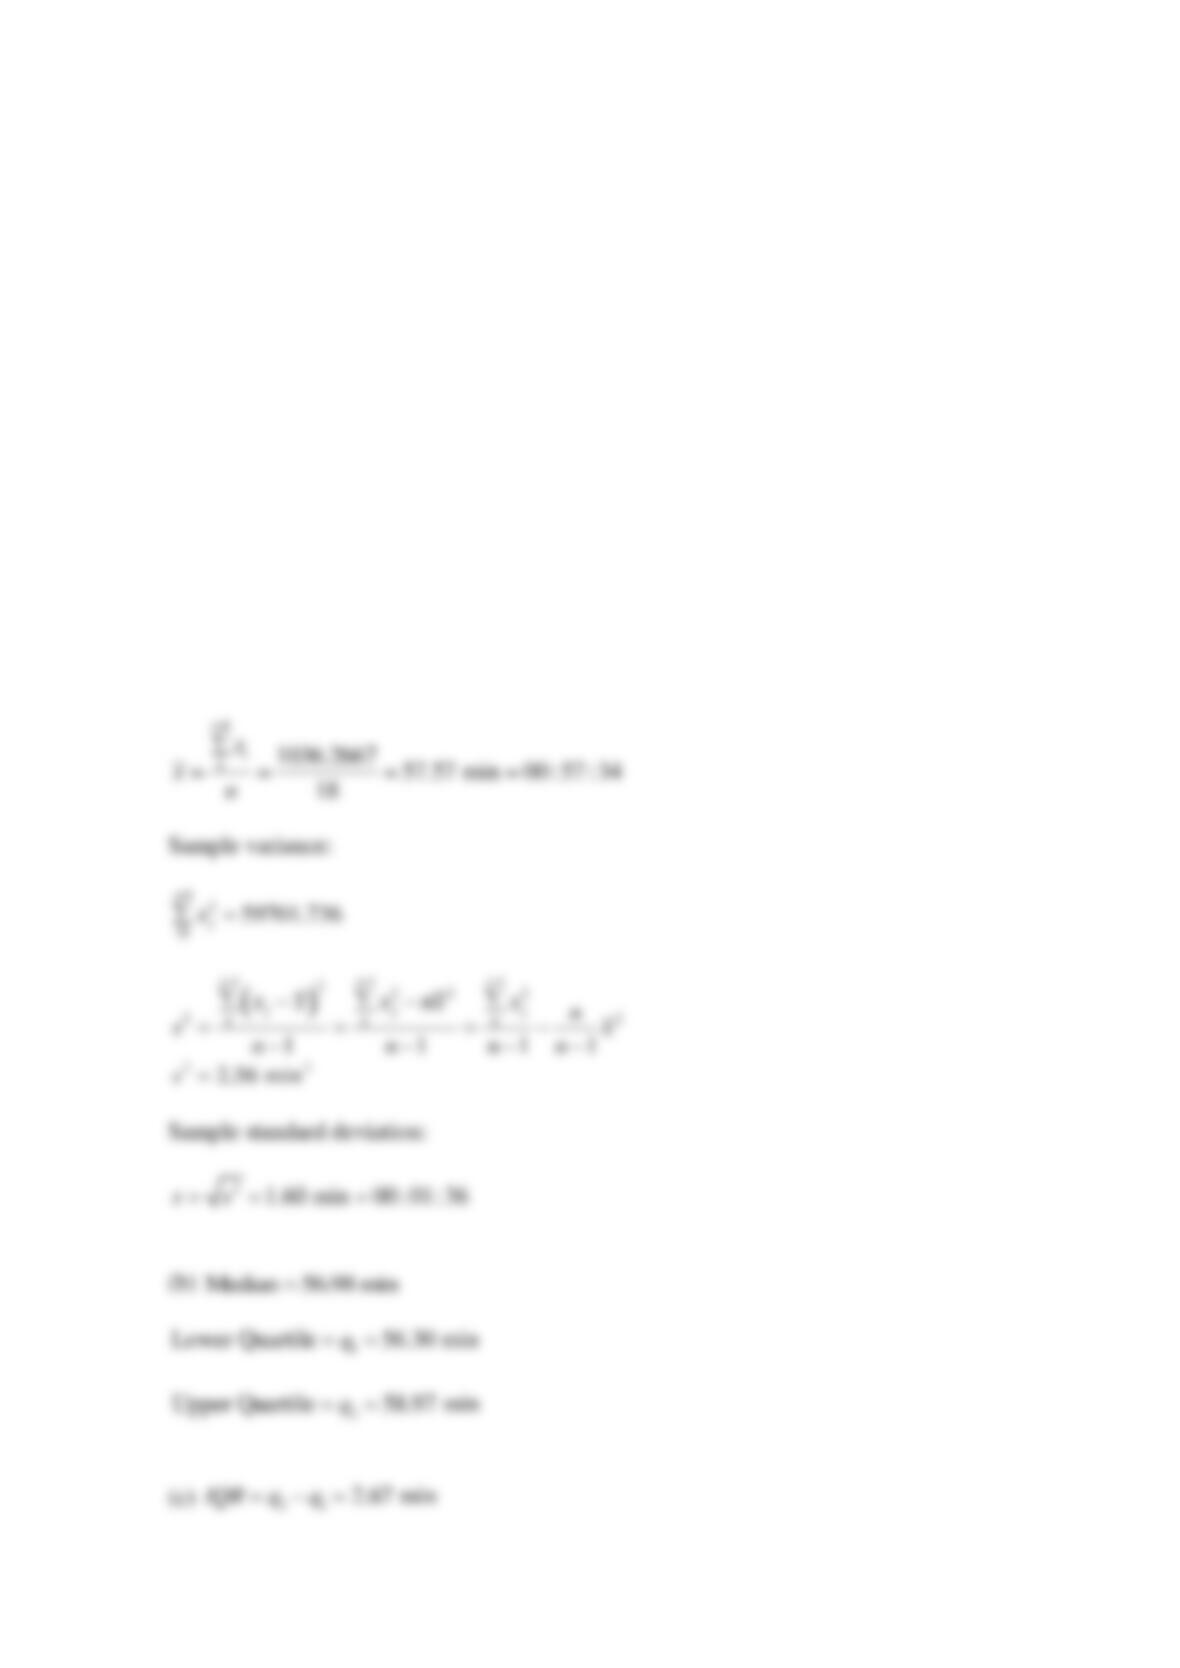
The triathlon is a multiple-stage competition involving the completion of three disciplines, in its
most popular form, swimming, cycling and running. The following data represents the results of
2017 Hamilton CAMTRI Sprint Triathlon American Cup for men: 00:55:14, 00:55:21, 00:56:00,
00:56:12, 00:56:20, 00:56:23, 00:56:36, 00:56:37, 00:56:50, 00:57:08, 00:58:41, 00:58:44,
00:58:48, 00:58:53, 00:59:14, 00:59:30, 00:59:30, 01:00:15.
(a) Calculate the sample mean, sample variance, and standard deviation.
(b) Find the median and quartiles for the data.
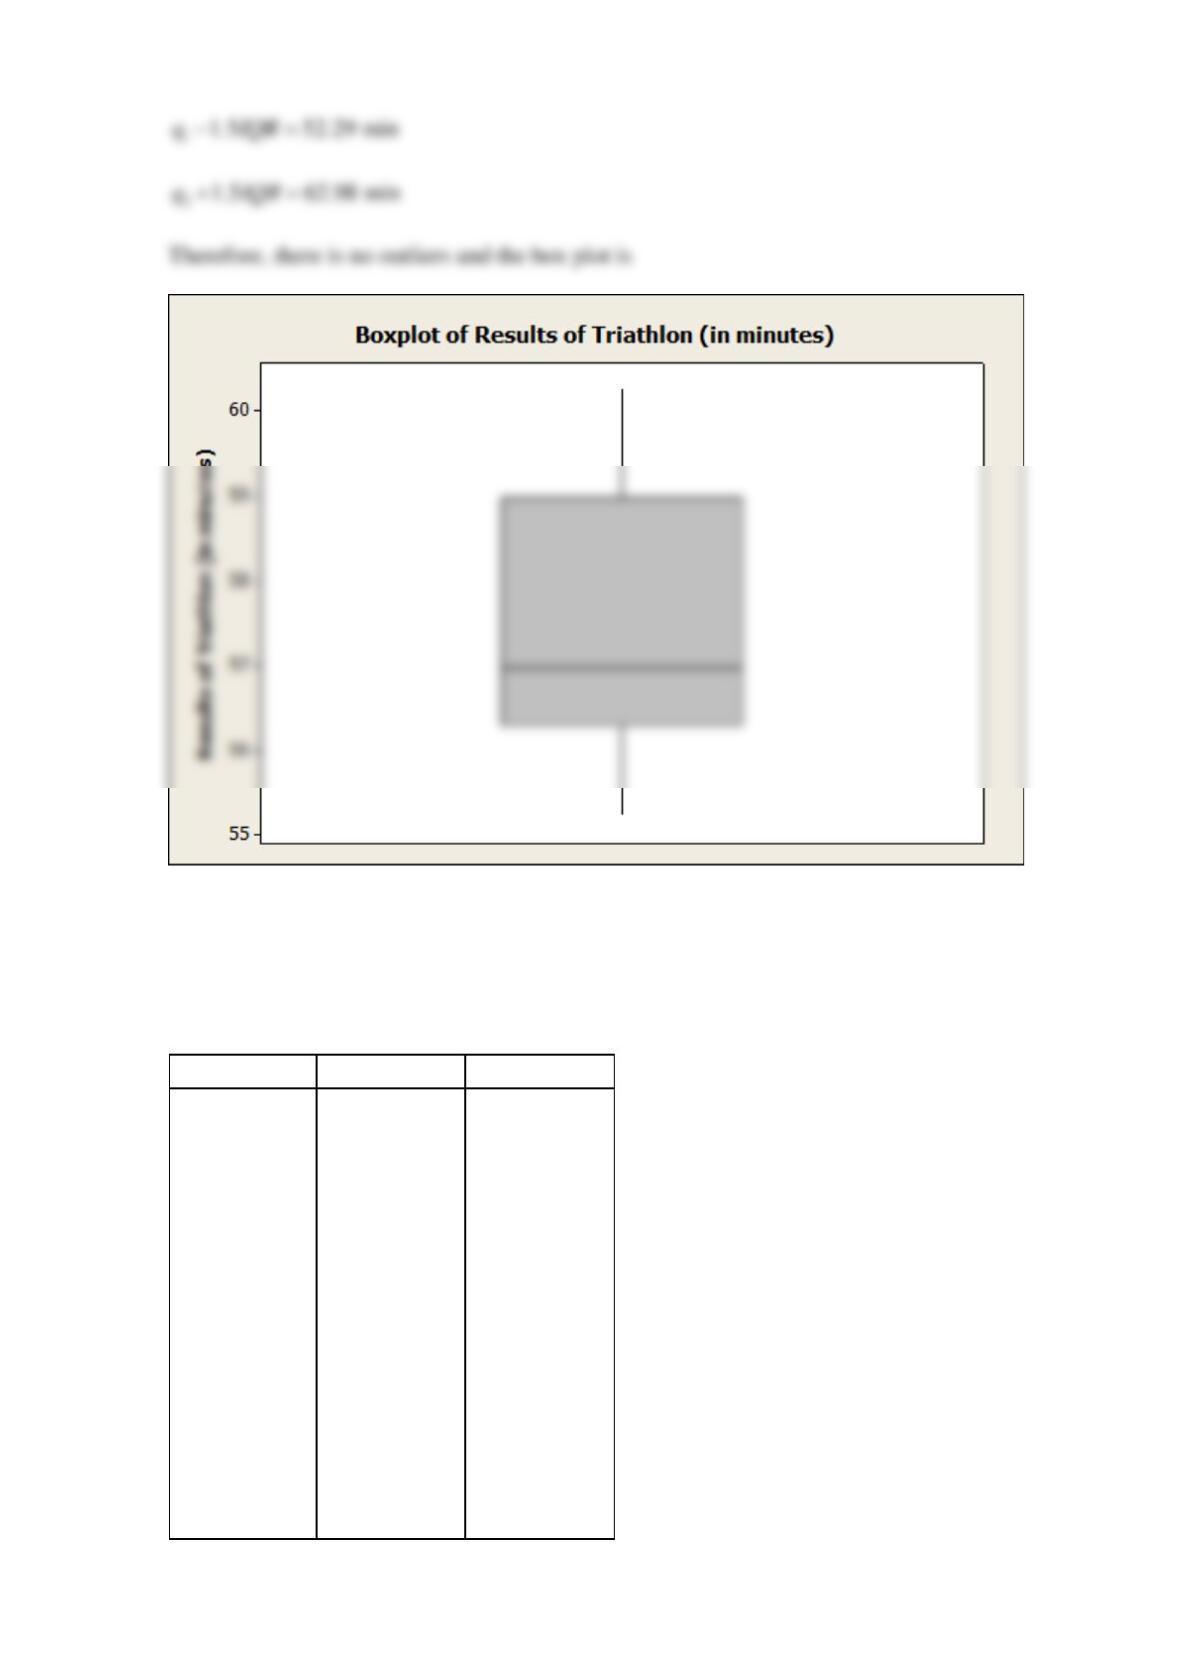
(c) Construct a box plot of the data. Find the interquartile range.
SOLUTION
Before analyzing the results, they should be converted to minutes. Therefore, the set of results in
minutes is: 55.23, 55.35, 56.00, 56.20, 56.33, 56.38, 56.60, 56.62, 56.83, 57.13, 58.68, 58.73,
58.80, 58.88, 59.23, 59.50, 59.50, 60.25.
(a) Sample mean:
Reserve Problems Chapter 6 Section 4 Problem 4
The data below represents the 14 greatest net capacities in GW of currently operated nuclear
power plants with the current net capacities over 1000 MW for three different countries.
USA
France
Japan
4.214
5.460
7.965
3.300
5.320
4.494
2.560
5.200
4.400
2.538
3.660
3.473
2.429
3.660
3.220
2.367
3.640
2.783
2.332
3.620
2.089
2.330
3.580
1.966
2.302
3.560
1.922
2.300
3.000
1.692
2.288
2.990
1.613
2.278
2.670
1.108
2.264
2.660
1.067
2.258
2.660
1.060
For each country, perform the following steps.
(a) Calculate the sample mean, sample variance, and standard deviation.
(b) Find the median and quartiles for the data.
(c) Construct a box plot of the data. Find the interquartile range and determine the number of
outliers.
SOLUTION
(a) Sample mean:
Sample variance:
2
1
12
2
i
i
in
i
n
x
xn
sn
=
=
−
=−
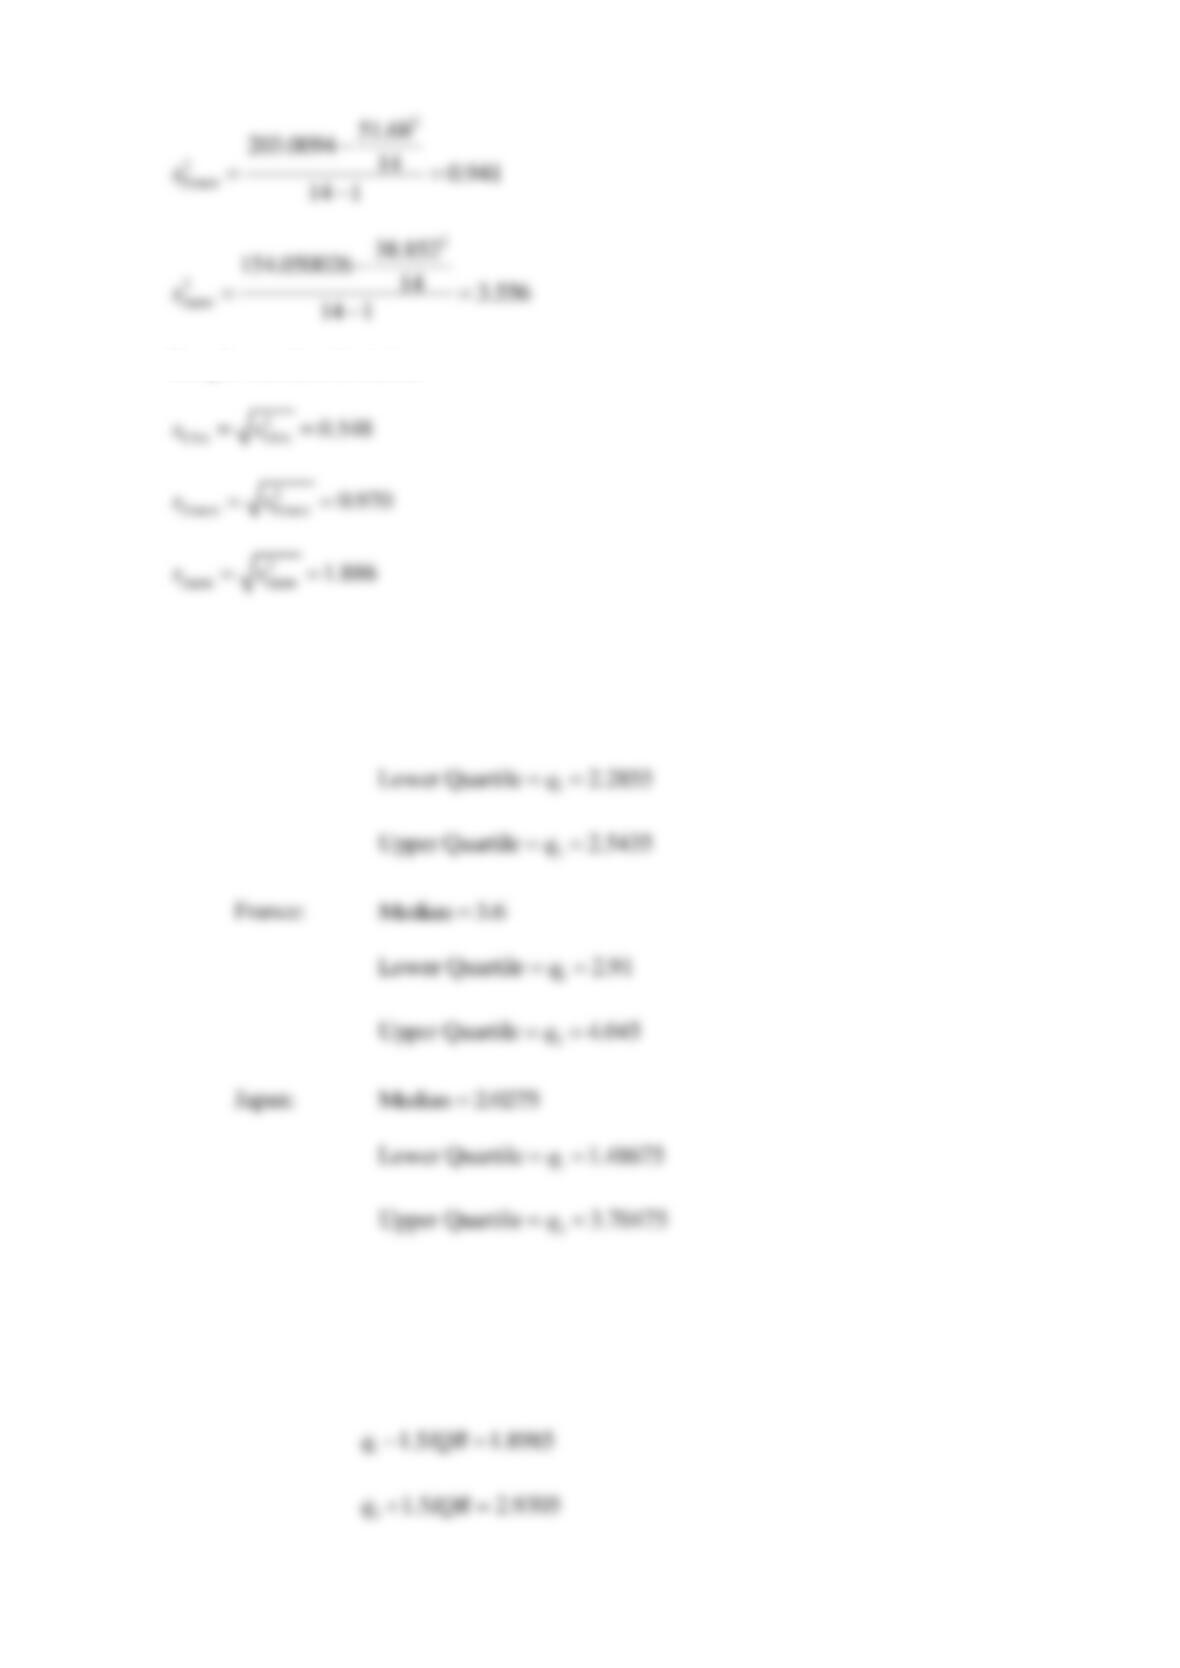
Sample standard deviation:
(b)
USA:
Median 2.331=
(c)
USA:
31
0.258IQR q q= − =
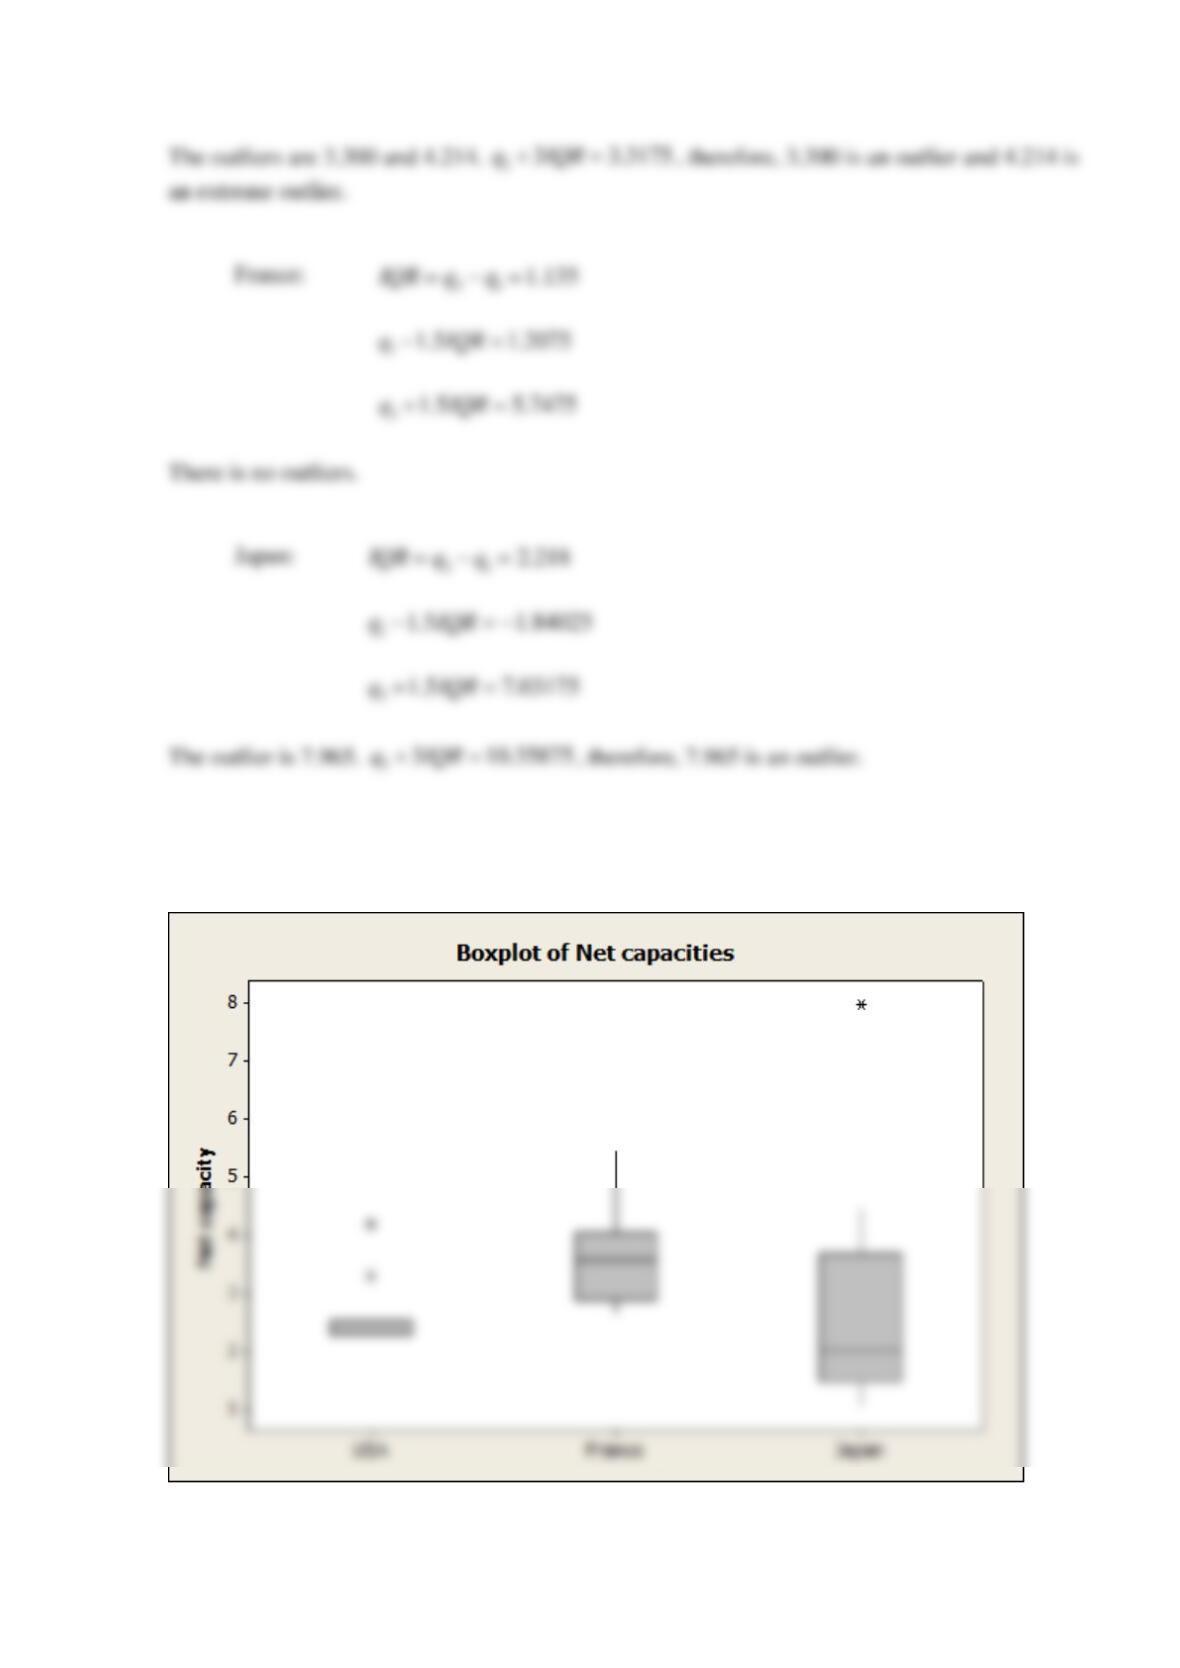
The box plot is
Reserve Problems Chapter 6 Section 4 Problem 5
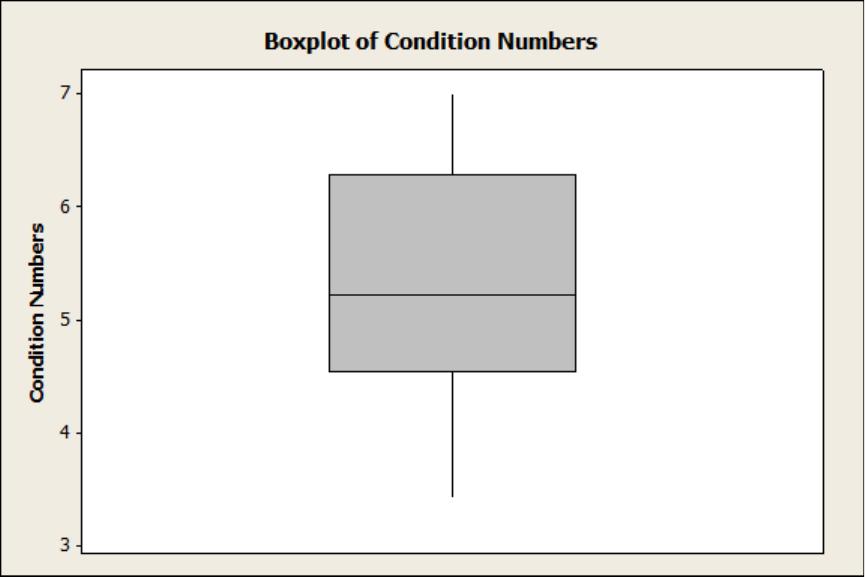
The United States has an aging infrastructure as witnessed by several resent disasters, including
the I-35 bridge failure in Minnesota. Most states inspect their bridges regularly and report their
condition (on a scale from 1-7) to the public. Here are condition numbers from a sample of 30
bridges in New York State:
5.08
5.44
6.66
5.07
6.80
5.43
4.83
4.00
4.41
4.38
7.00
5.72
4.53
6.43
3.97
4.19
6.26
6.72
5.26
5.48
4.95
6.33
4.93
5.61
4.66
7.00
5.57
3.42
5.18
4.54
Using the data on bridge conditions,
(a) Find the quartiles and median of the data.
(b) Select the correct boxplot.
A
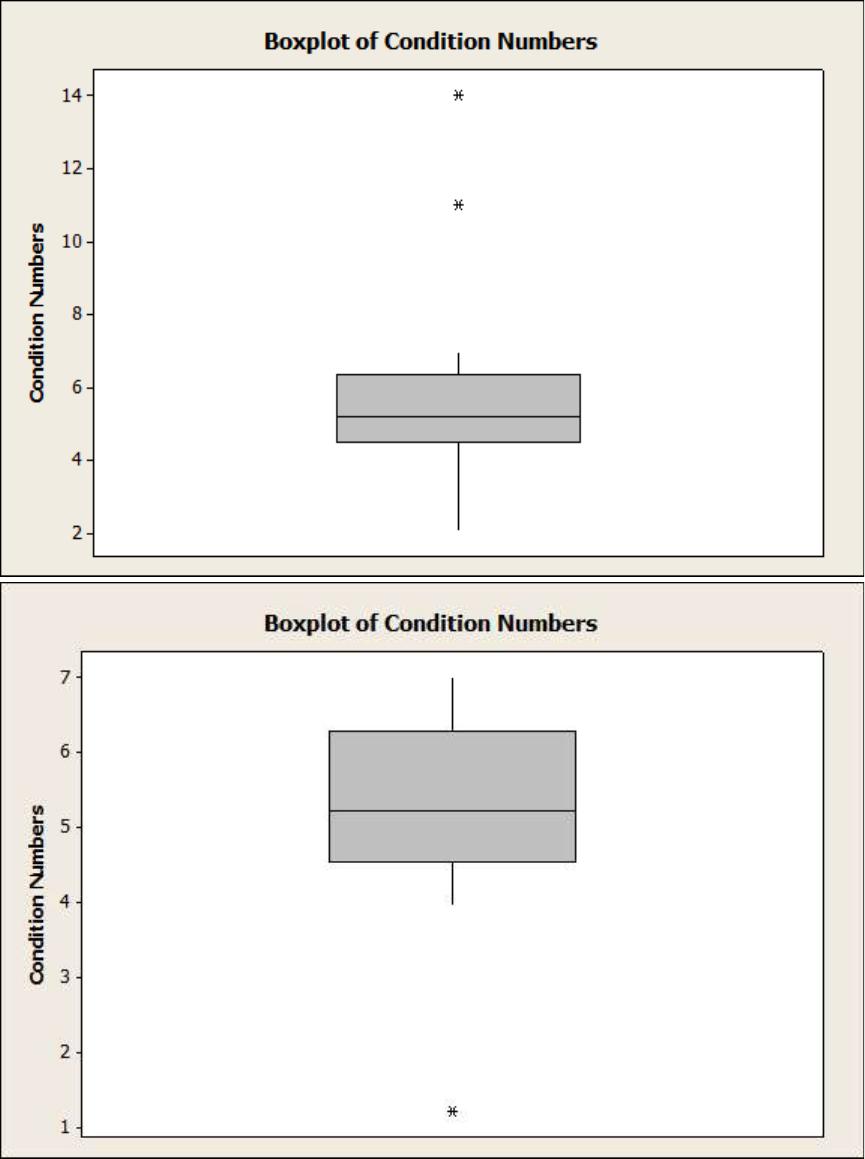
B
C
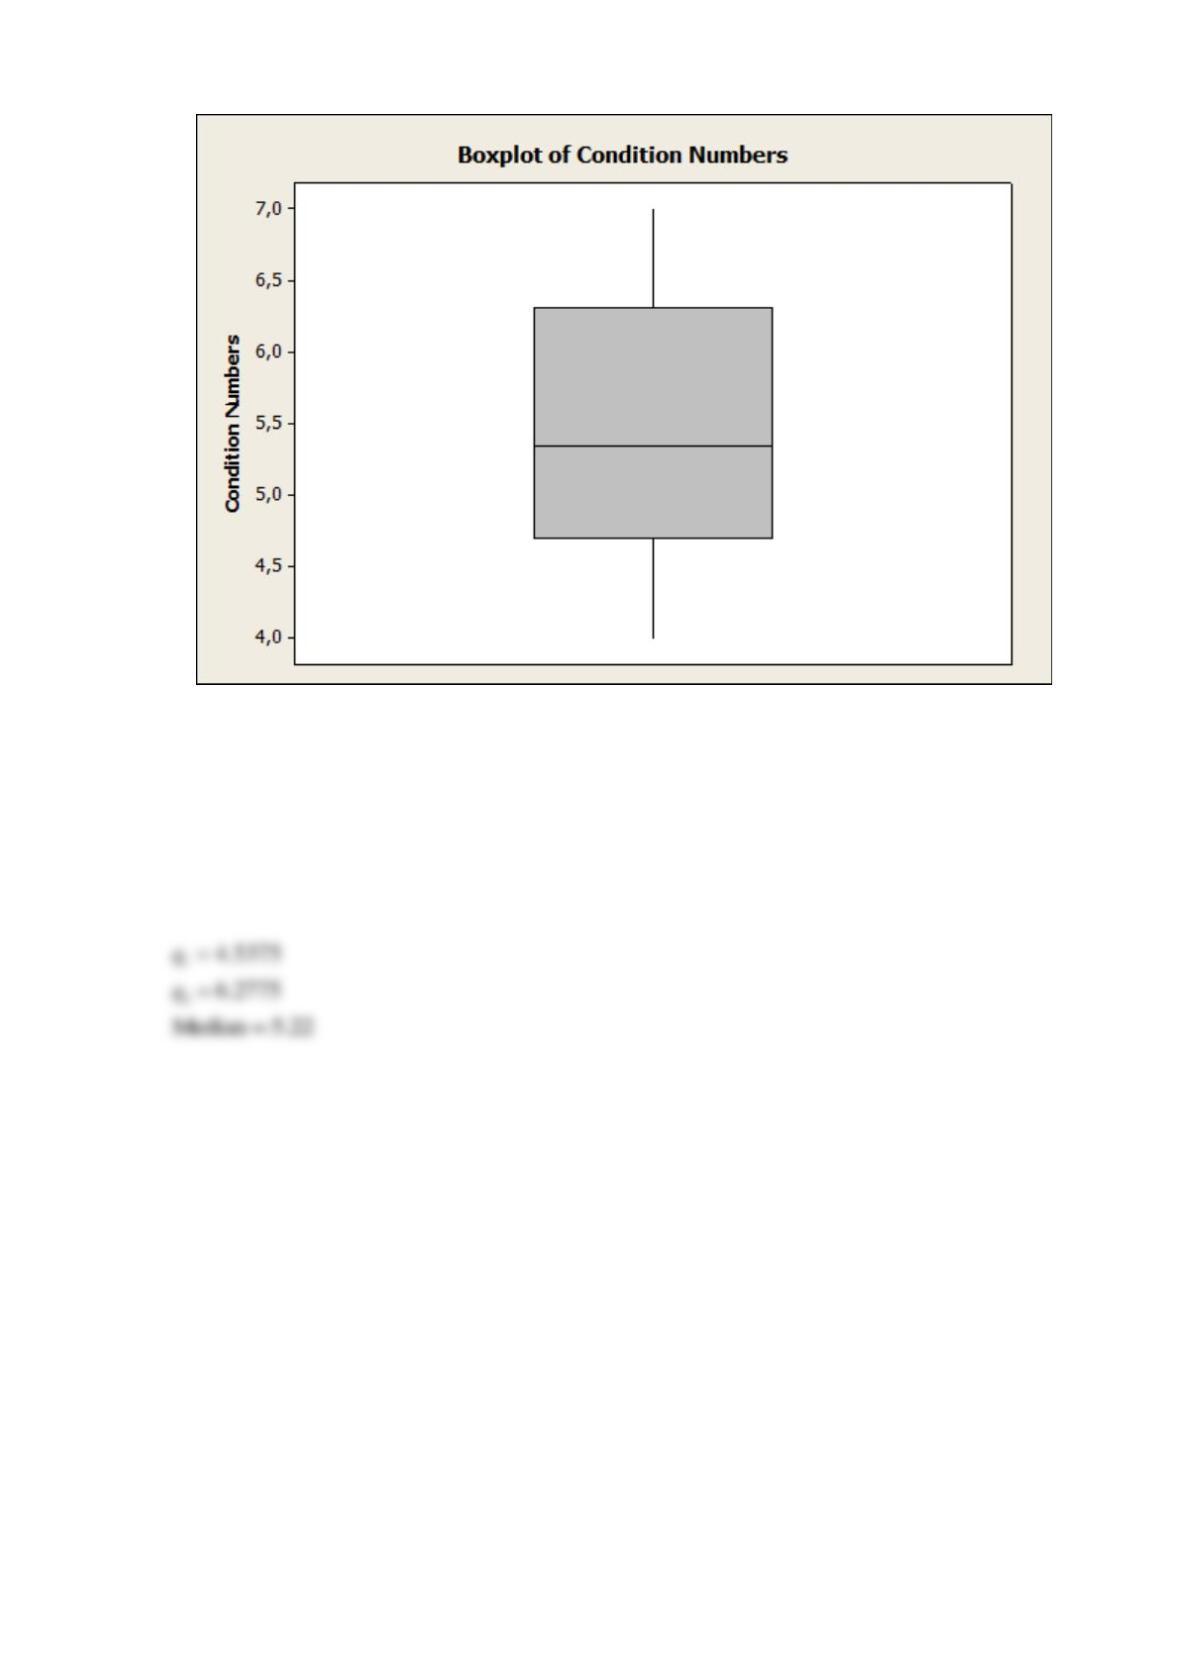
D
(c) The amount of potential outliers.
SOLUTION
(a)
(b)
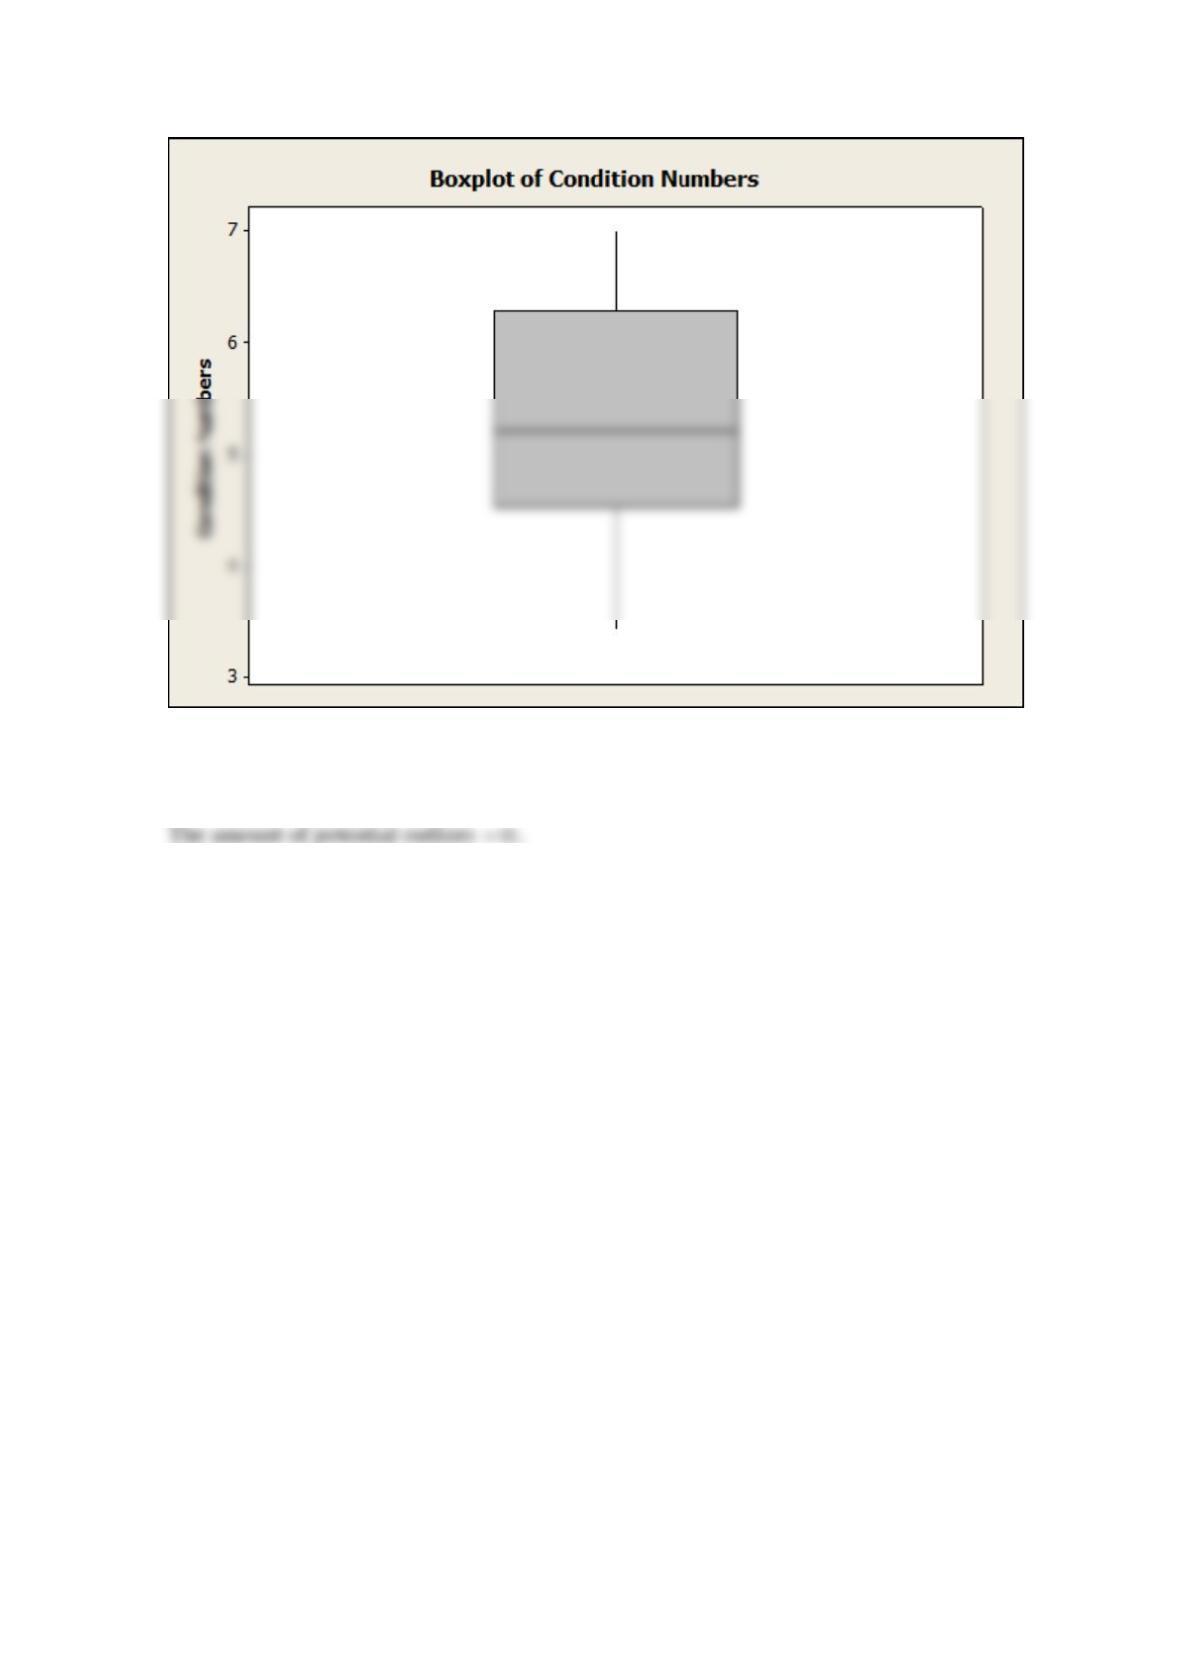
(c)
Reserve Problems Chapter 6 Section 4 Problem 6
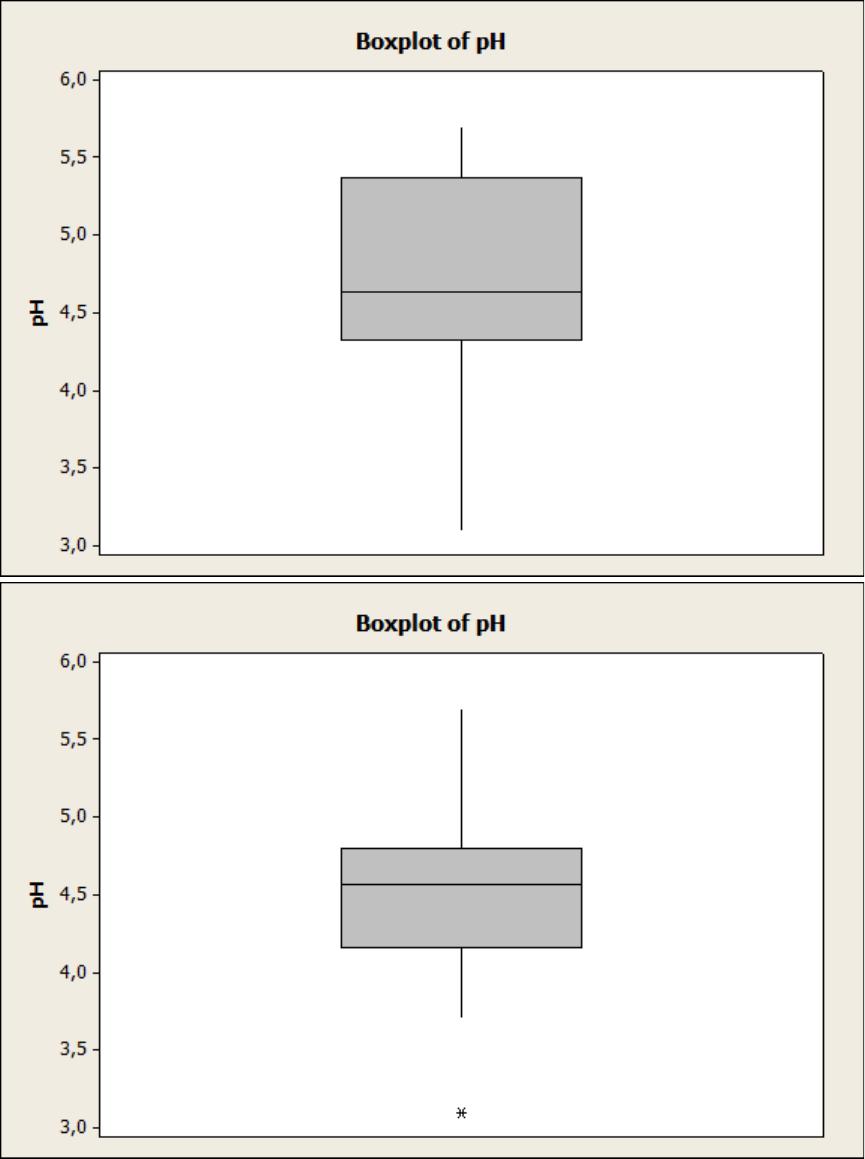
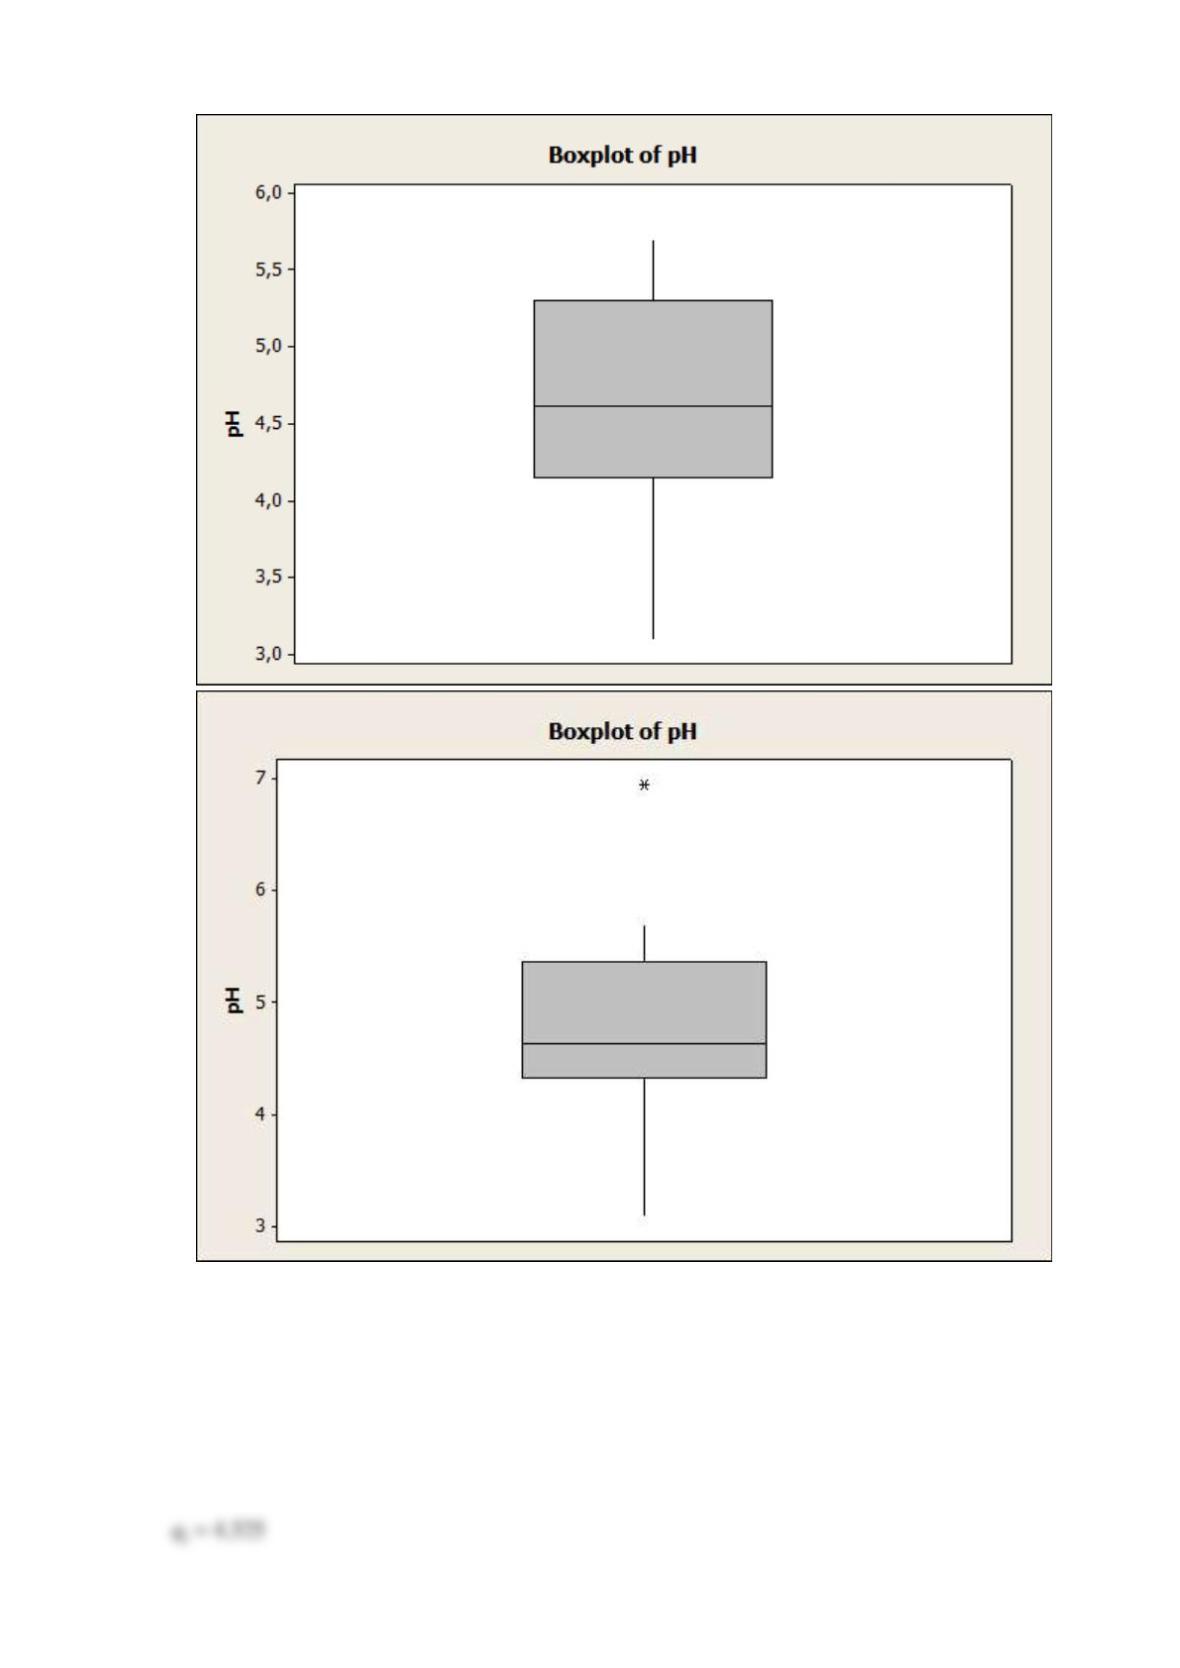
In an attempt to measure the effects of acid rain, researchers measured the pH (7 is neutral and
values below 7 are acidic) of water collected from rain in Ingham County, Michigan.
5.47
5.37
5.38
4.63
5.37
3.74
3.71
4.96
4.64
5.11
5.65
5.39
4.16
5.62
4.57
4.64
5.48
4.57
4.57
4.51
4.86
4.56
4.61
4.32
3.98
5.70
4.15
3.98
5.65
3.10
5.04
4.62
4.51
4.34
4.16
4.64
5.12
3.71
4.64
5.59
Using the data on acid rain,
(a) Find the quartiles and median of the data.
(b) Select the correct boxplot.
A
B
C
D
(c) The amount of potential outliers
SOLUTION
(a)
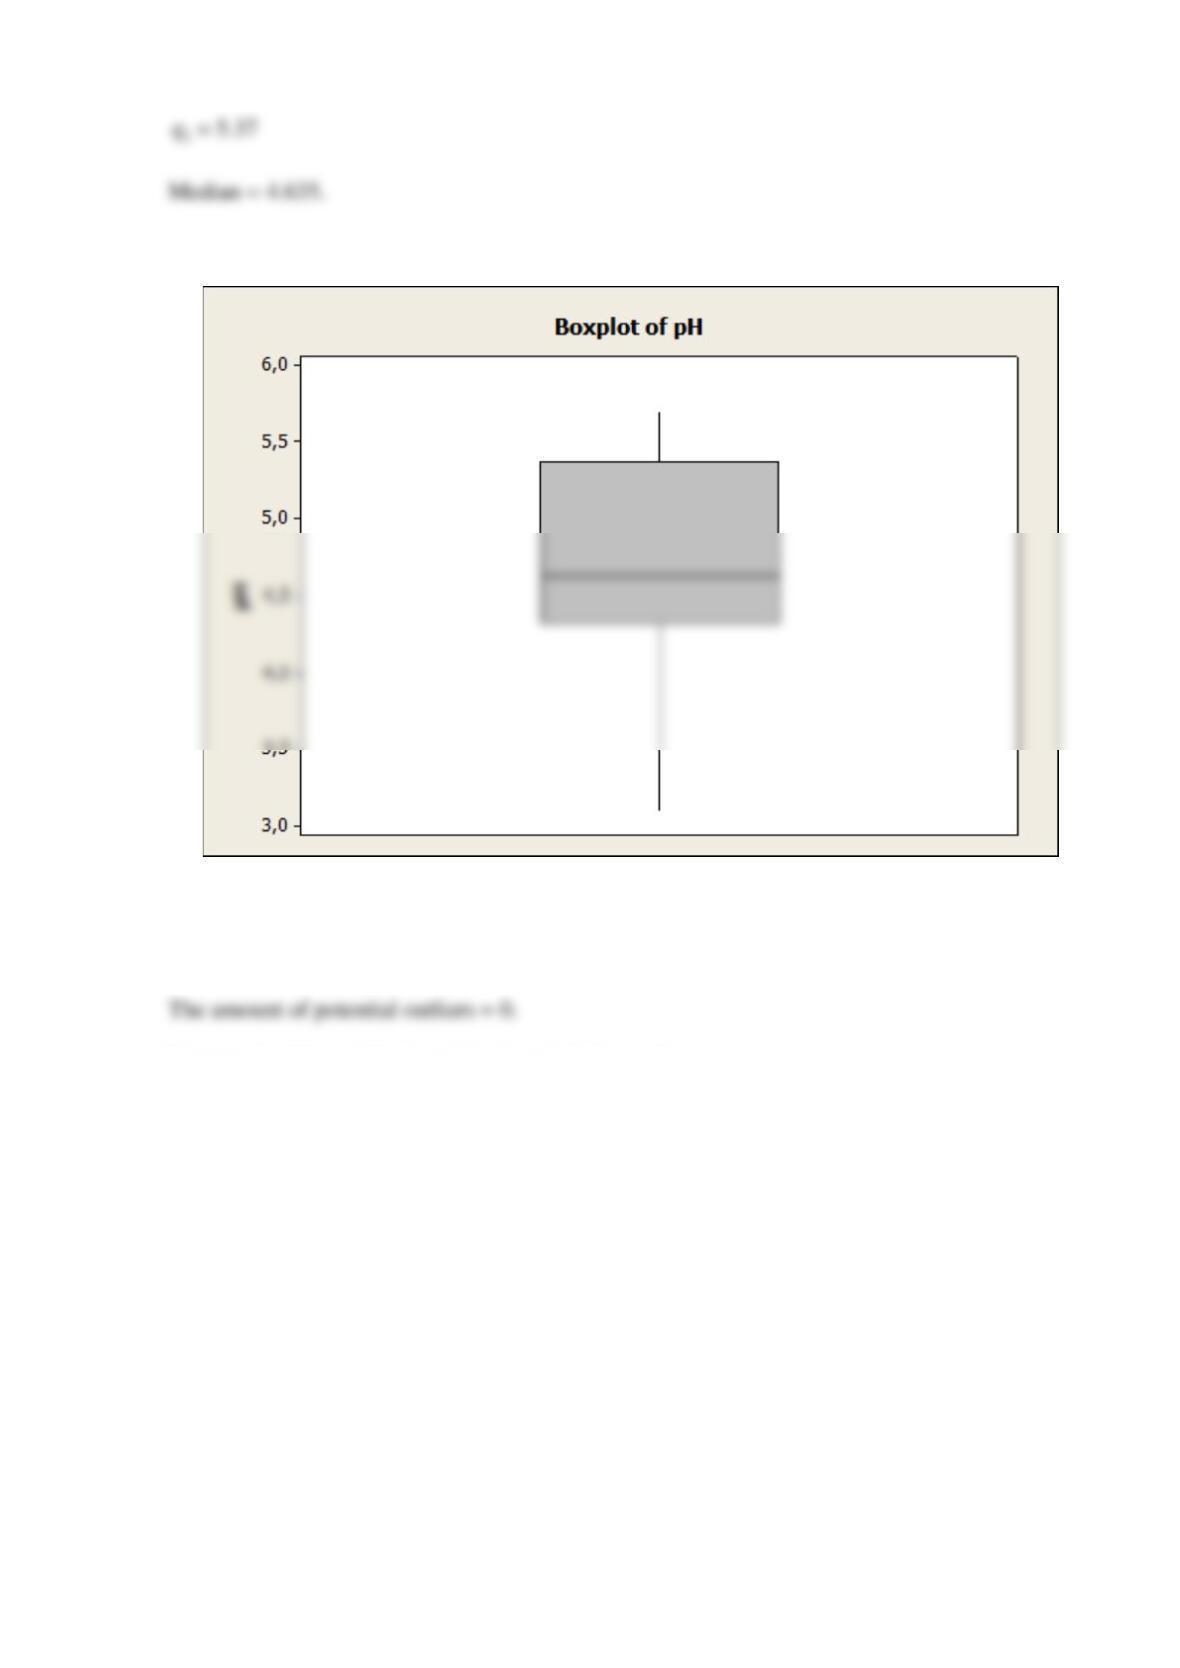
(b)
(c)
Reserve Problems Chapter 6 Section 4 Problem 7
An article in the Journal of Aircraft (1988) described the computation of drag coefficients for the
NASA 0012 airfoil. Different computational algorithms were used at
0.7M=
with the
following results (drag coefficients are in units of drag counts; that is, one count is equivalent to
a drag coefficient of 0.0001): 79, 100, 74, 83, 81, 85, 82, 80, and 84.
(a) Find the median and the upper and lower quartiles of the
(b) Select the correct boxplot.
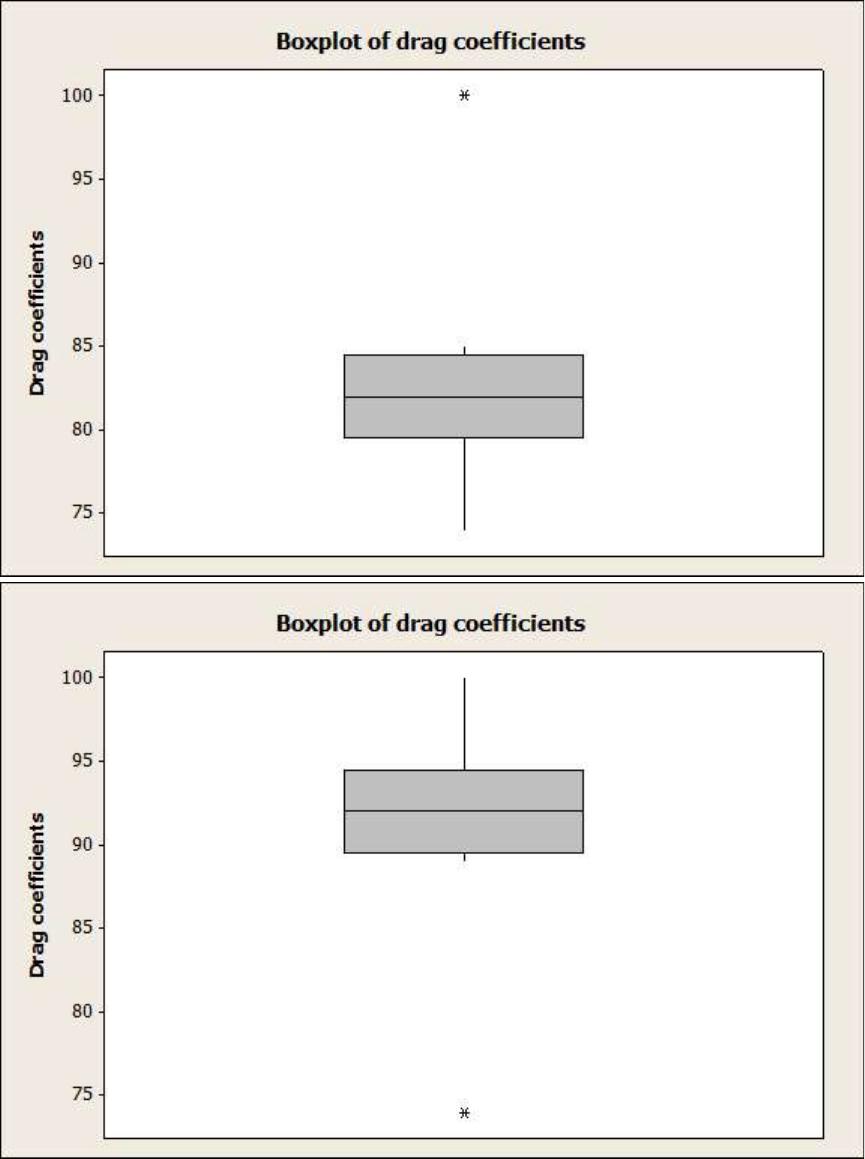
A
B
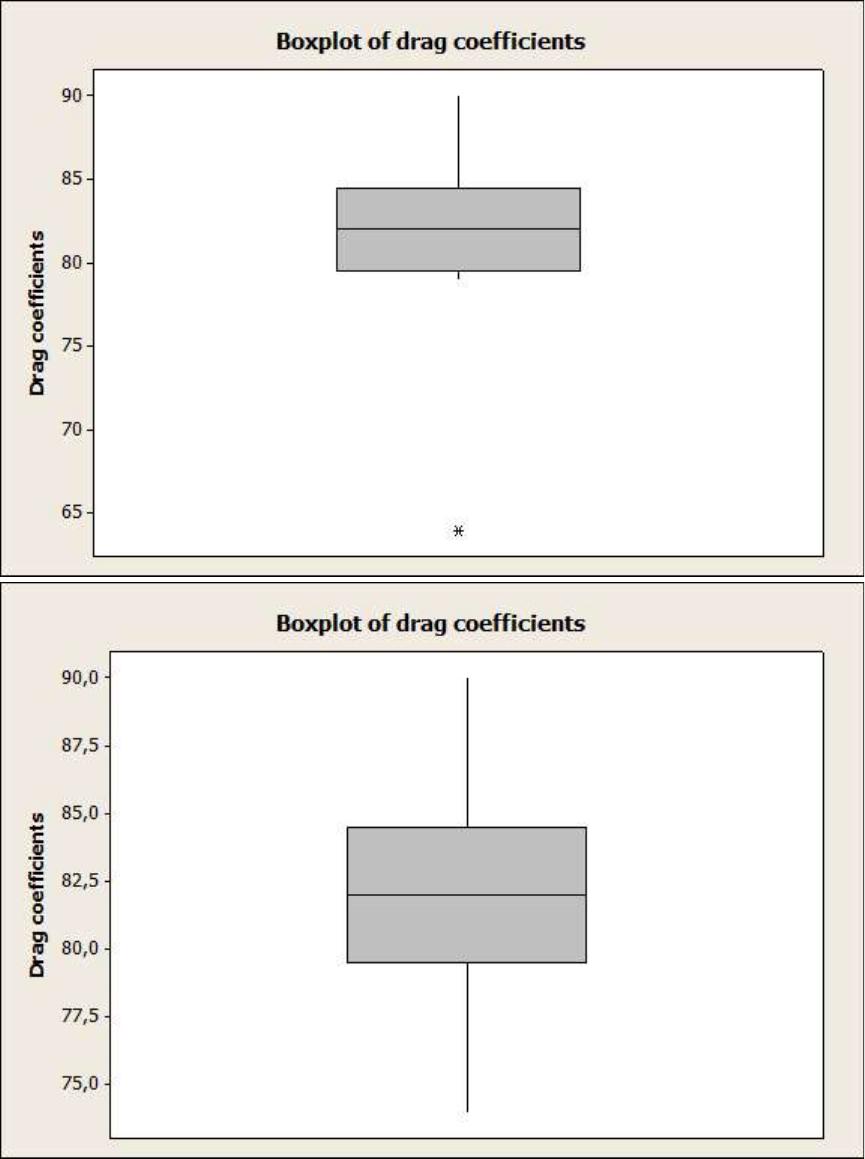
C
D
A
B
C
D
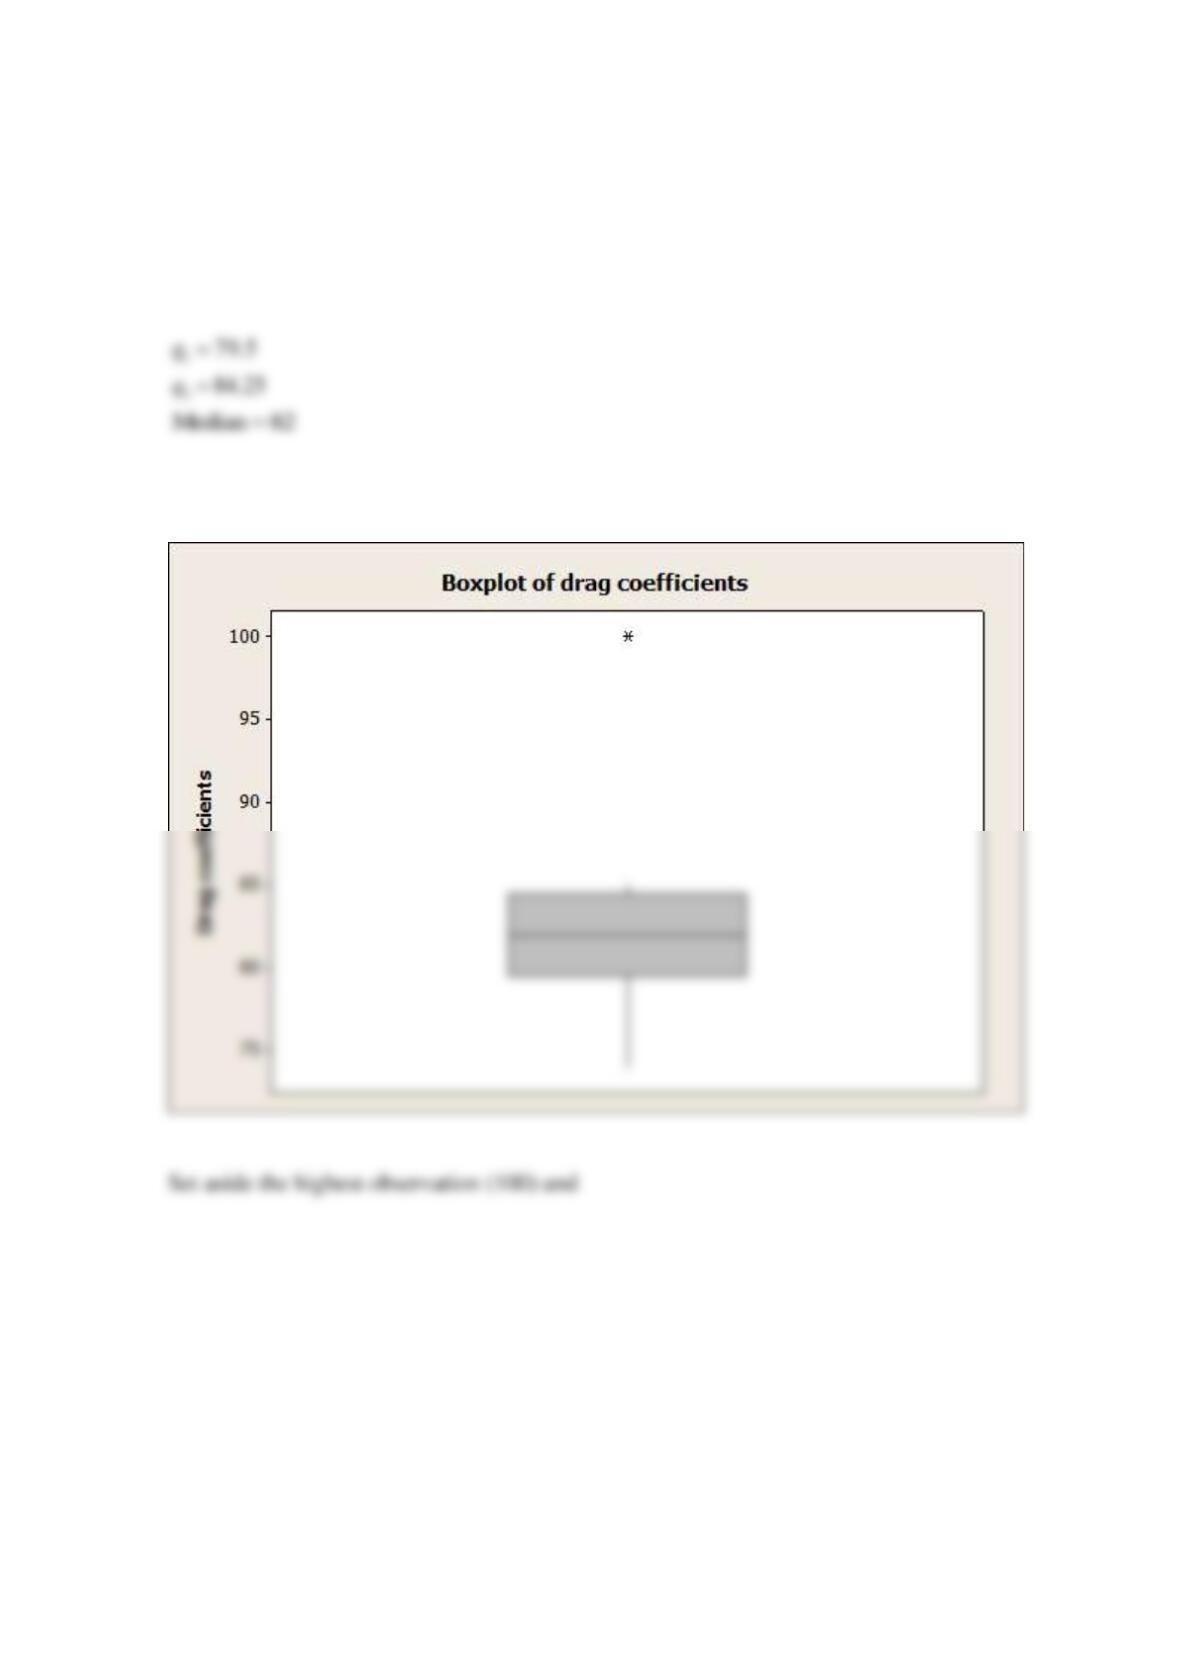
(c) Find the median and the upper and lower quartiles.
(d) Select the correct boxplot.
SOLUTION
(a)
(b)
Reserve Problems Chapter 6 Section 4 Problem 8
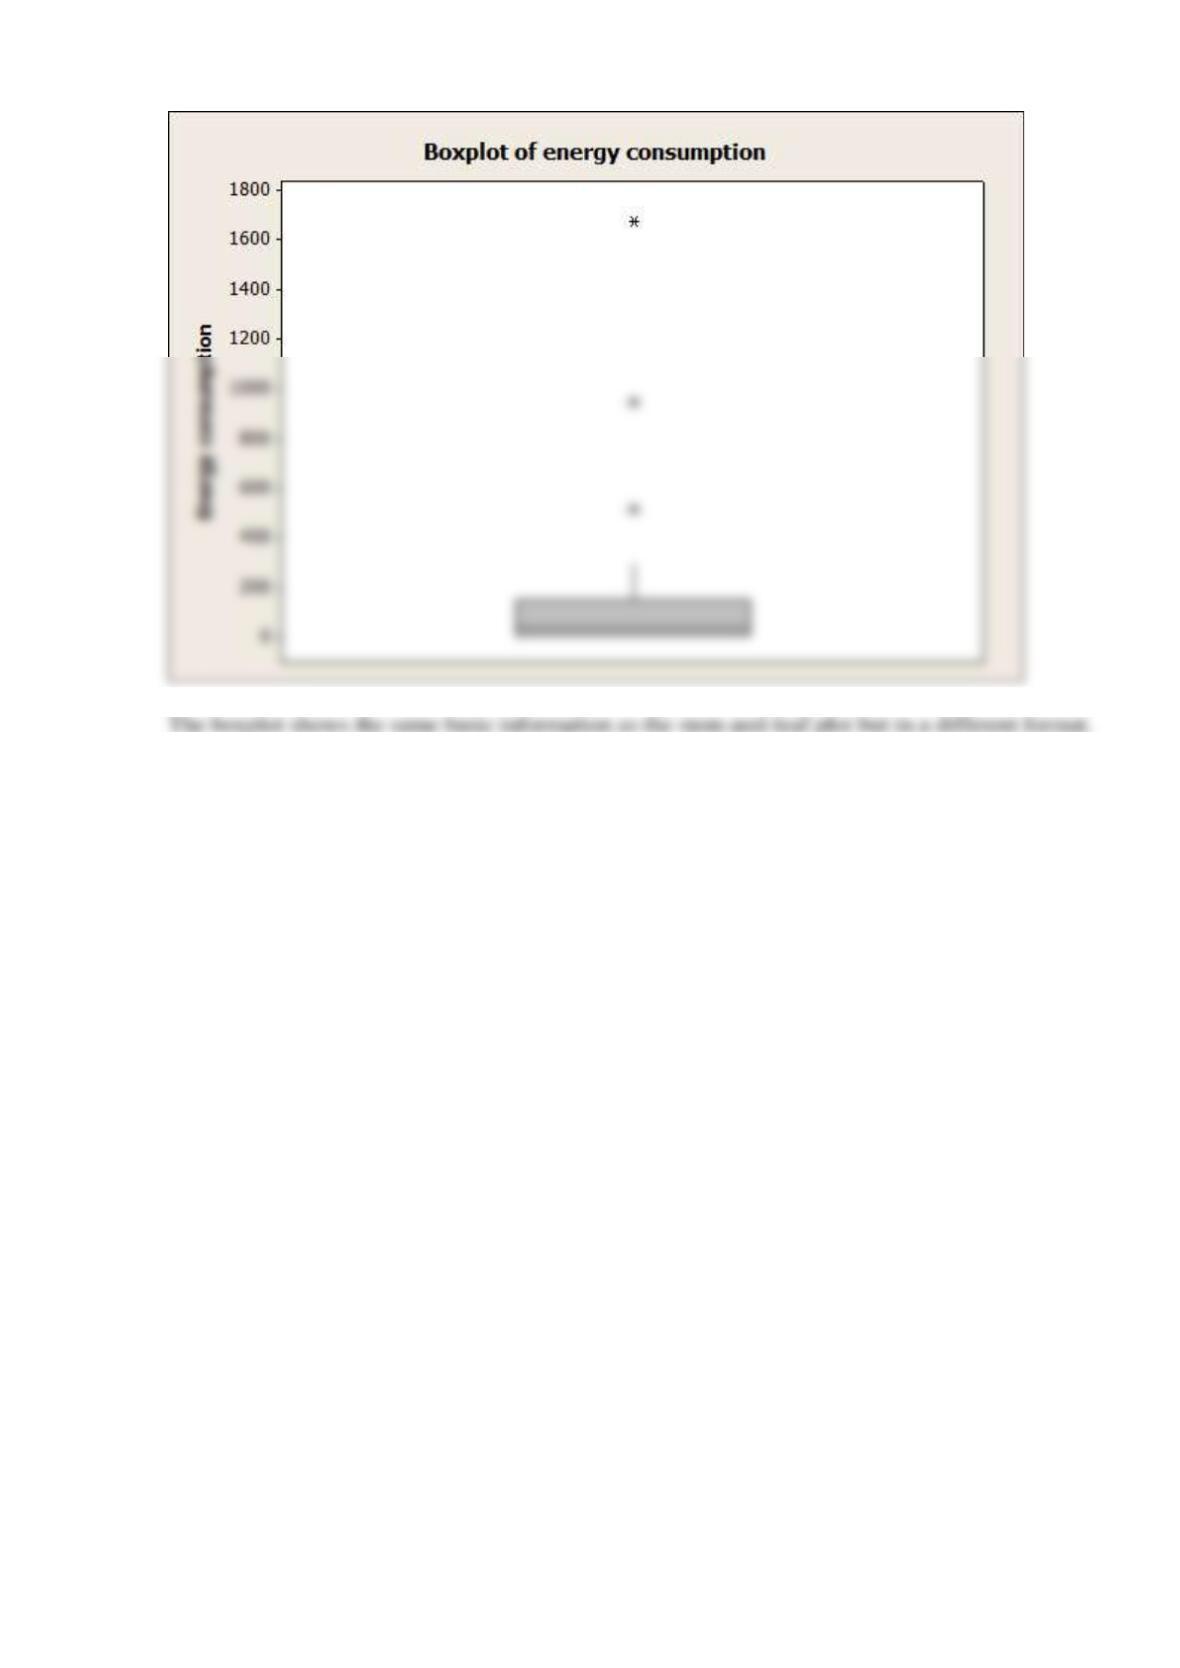
The net energy consumption (in billions of kilowatt-hours) for countries in Asia in 2003 was as
follows.
Billions of Kilowatt-Hours
Afghanistan
1.04
Australia
200.66
Bangladesh
16.20
Burma
6.88
China
1671.23
Hong Kong
38.43
India
519.04
Indonesia
101.80
Japan
946.27
Korea, North
17.43
Korea, South
303.33
Laos
3.30
Malaysia
73.63
Mongolia
2.91
Nepal
2.30
New Zealand
37.03
Pakistan
71.54
Philippines
44.48
Singapore
30.89
Sri Lanka
6.80
Taiwan
154.34
Thailand
107.34
Vietnam
36.92
Total
4393.8
Select the correct boxplot.
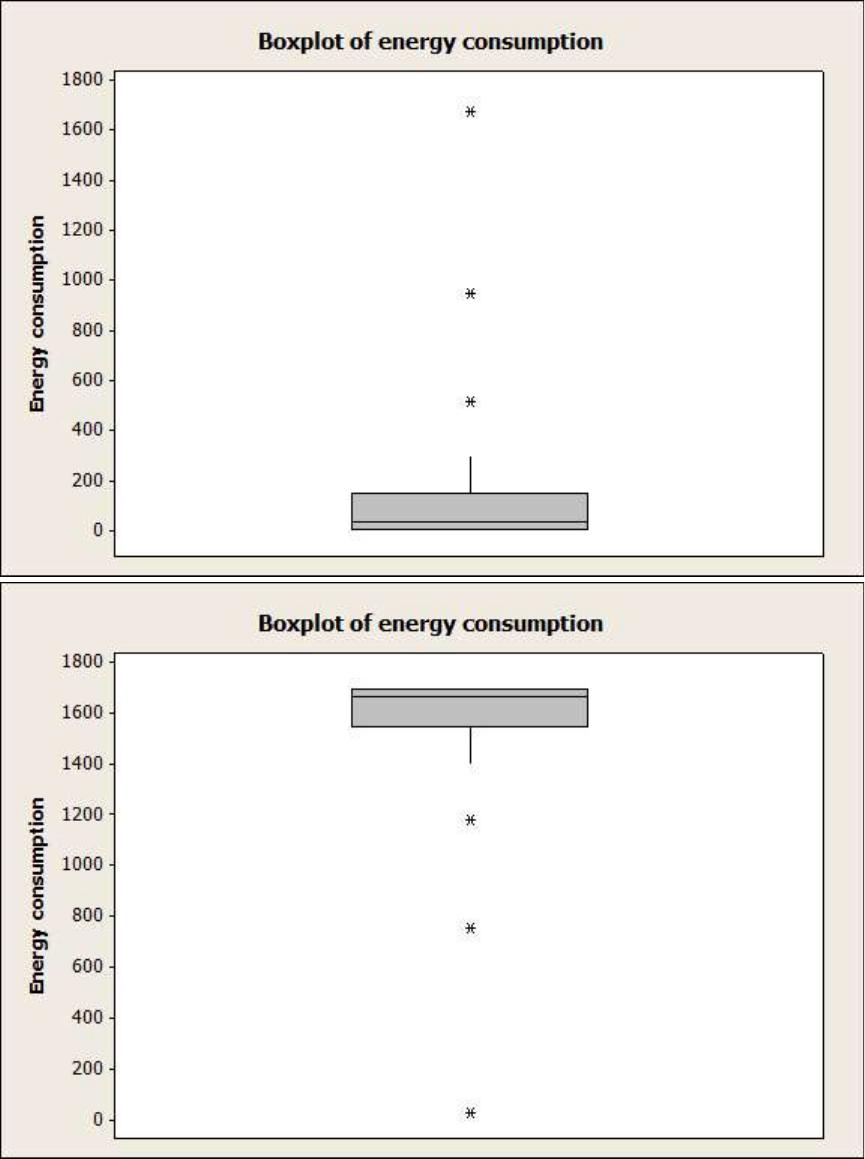
A
B
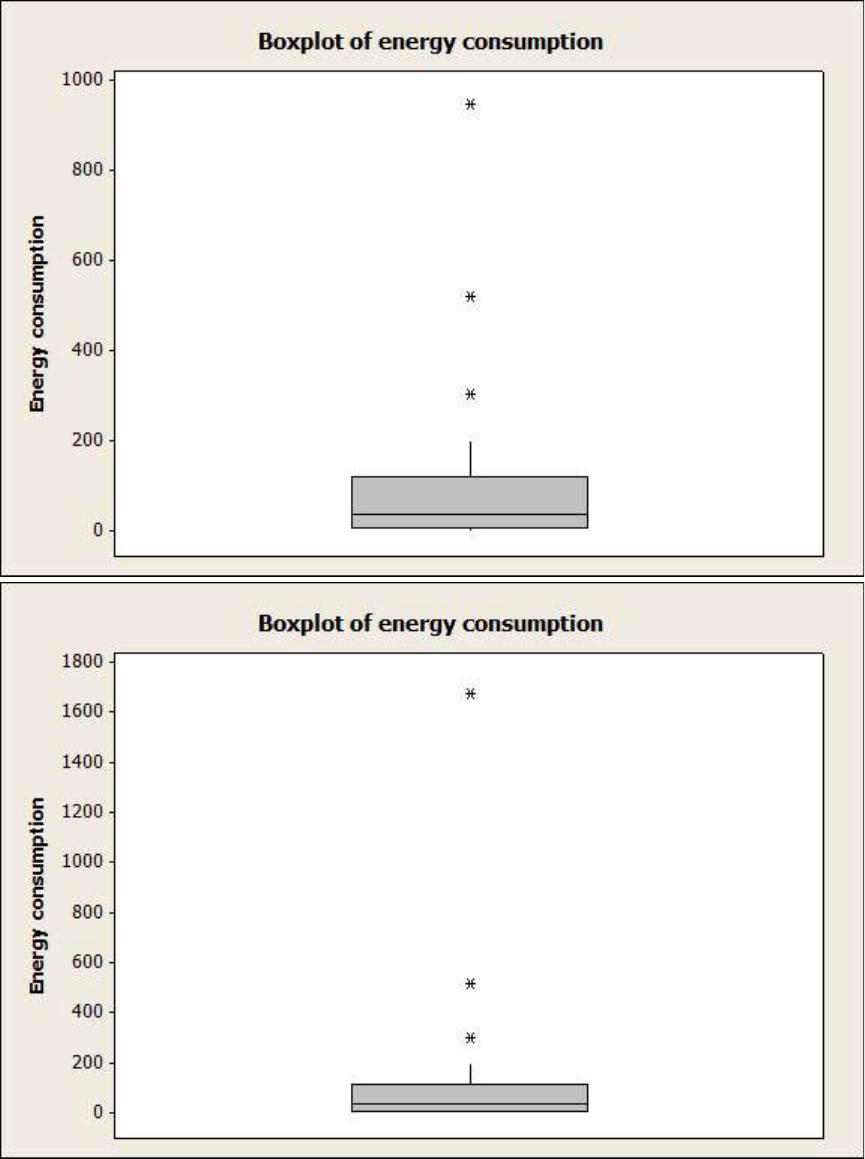
C
D
How does the boxplot compare in interpretive value to the original stem-and-leaf diagram?
SOLUTION
Construct a boxplot of the data.
Reserve Problems Chapter 6 Section 4 Problem 9
A semiconductor manufacturer produces devices used as central processing units in personal
computers. The speed of the devices (in megahertz) is important because it determines the price
that the manufacturer can charge for the devices. The following table contains measurements on
120 devices.
680
669
719
699
670
710
722
663
658
634
720
690
677
669
700
718
690
681
702
696
692
690
694
660
679
675
701
721
683
735
688
763
672
698
659
704
681
679
691
683
705
746
706
649
668
672
690
724
652
720
660
695
701
724
668
698
668
660
680
739
717
727
653
637
660
693
679
682
724
642
704
695
704
652
664
702
661
720
695
670
656
718
660
648
683
723
710
680
684
705
681
748
697
703
660
722
662
644
683
695
678
674
656
667
683
691
680
685
681
715
665
676
665
675
655
659
720
675
697
663
Select the correct boxplot.
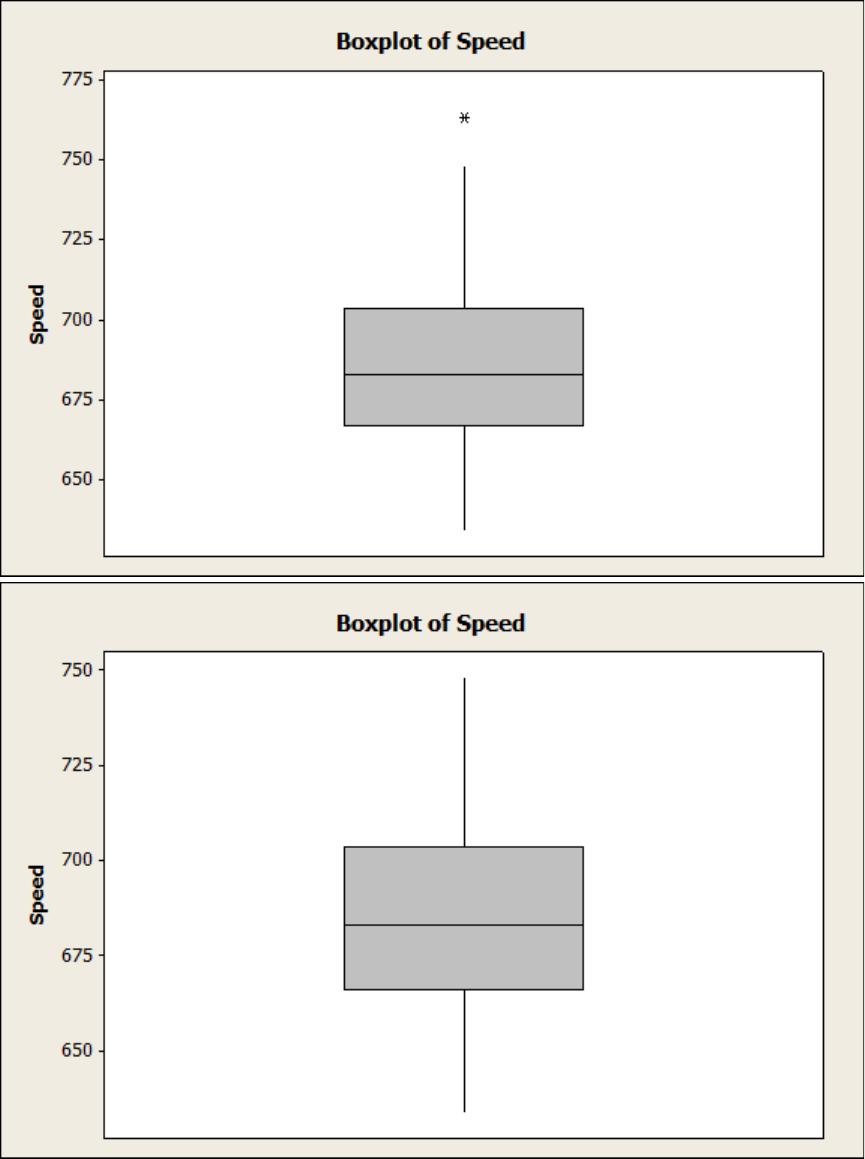
A
B