Applied Statistics and Probability for Engineers, 7th edition
6-20
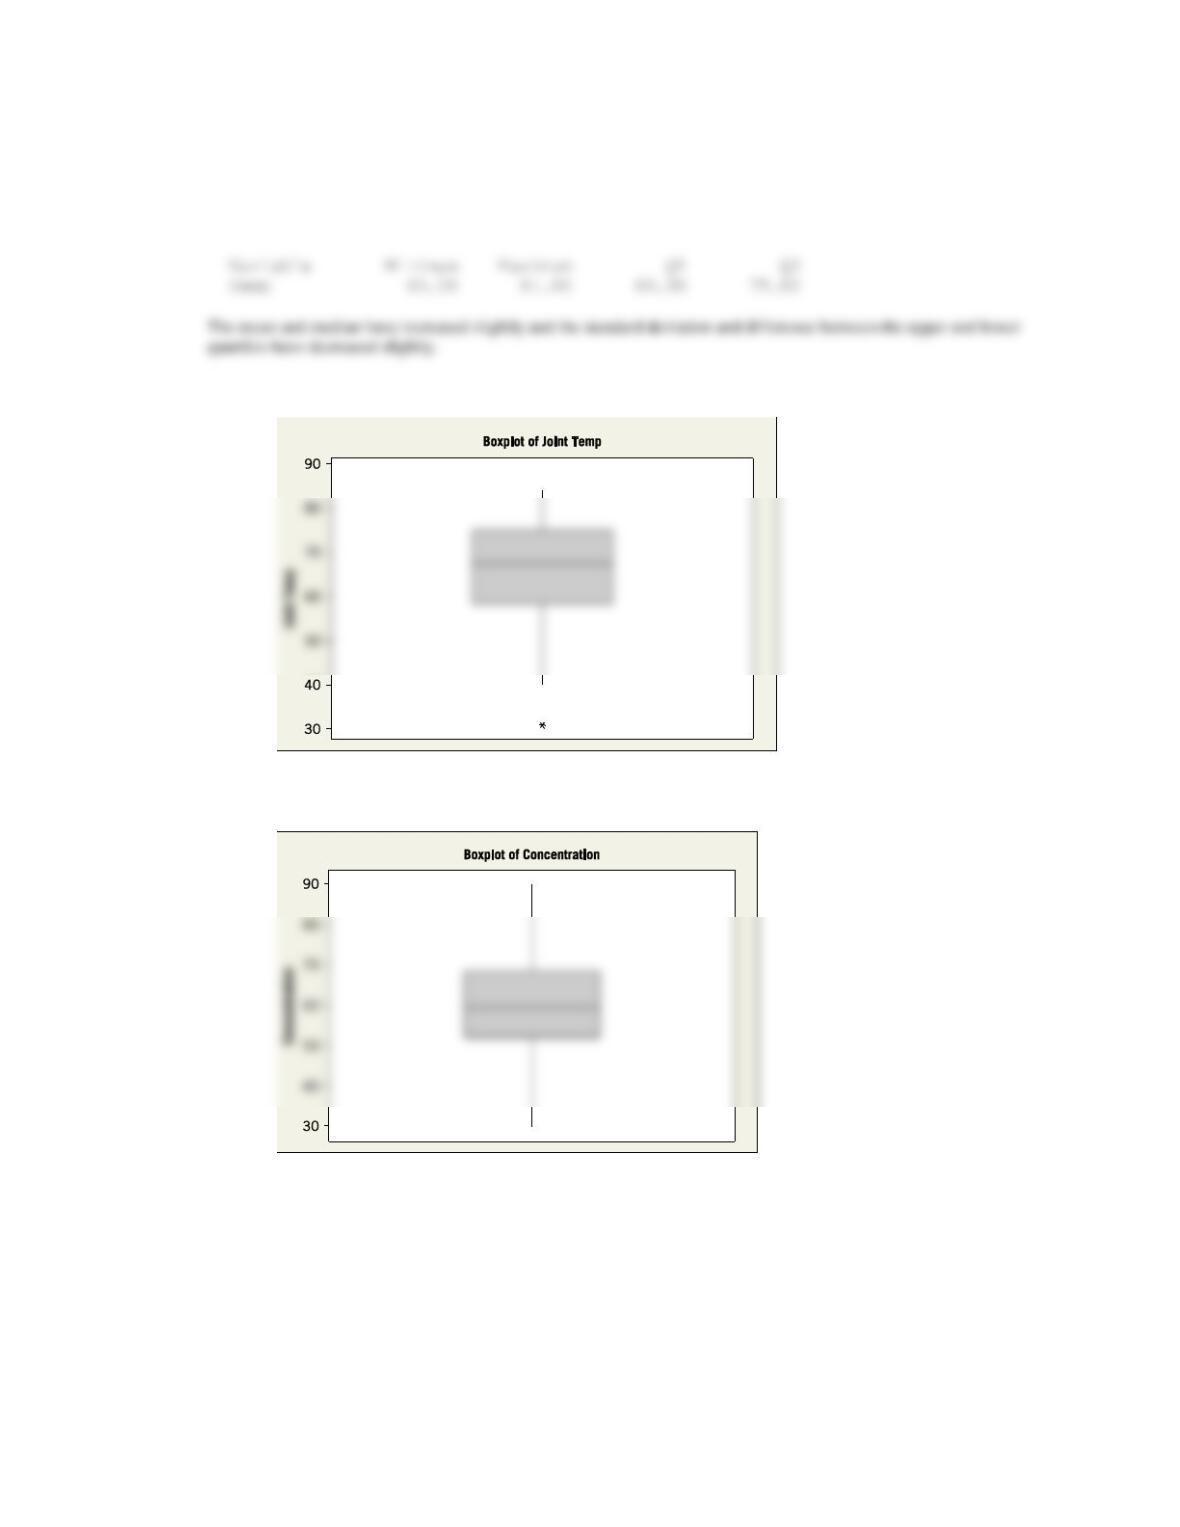
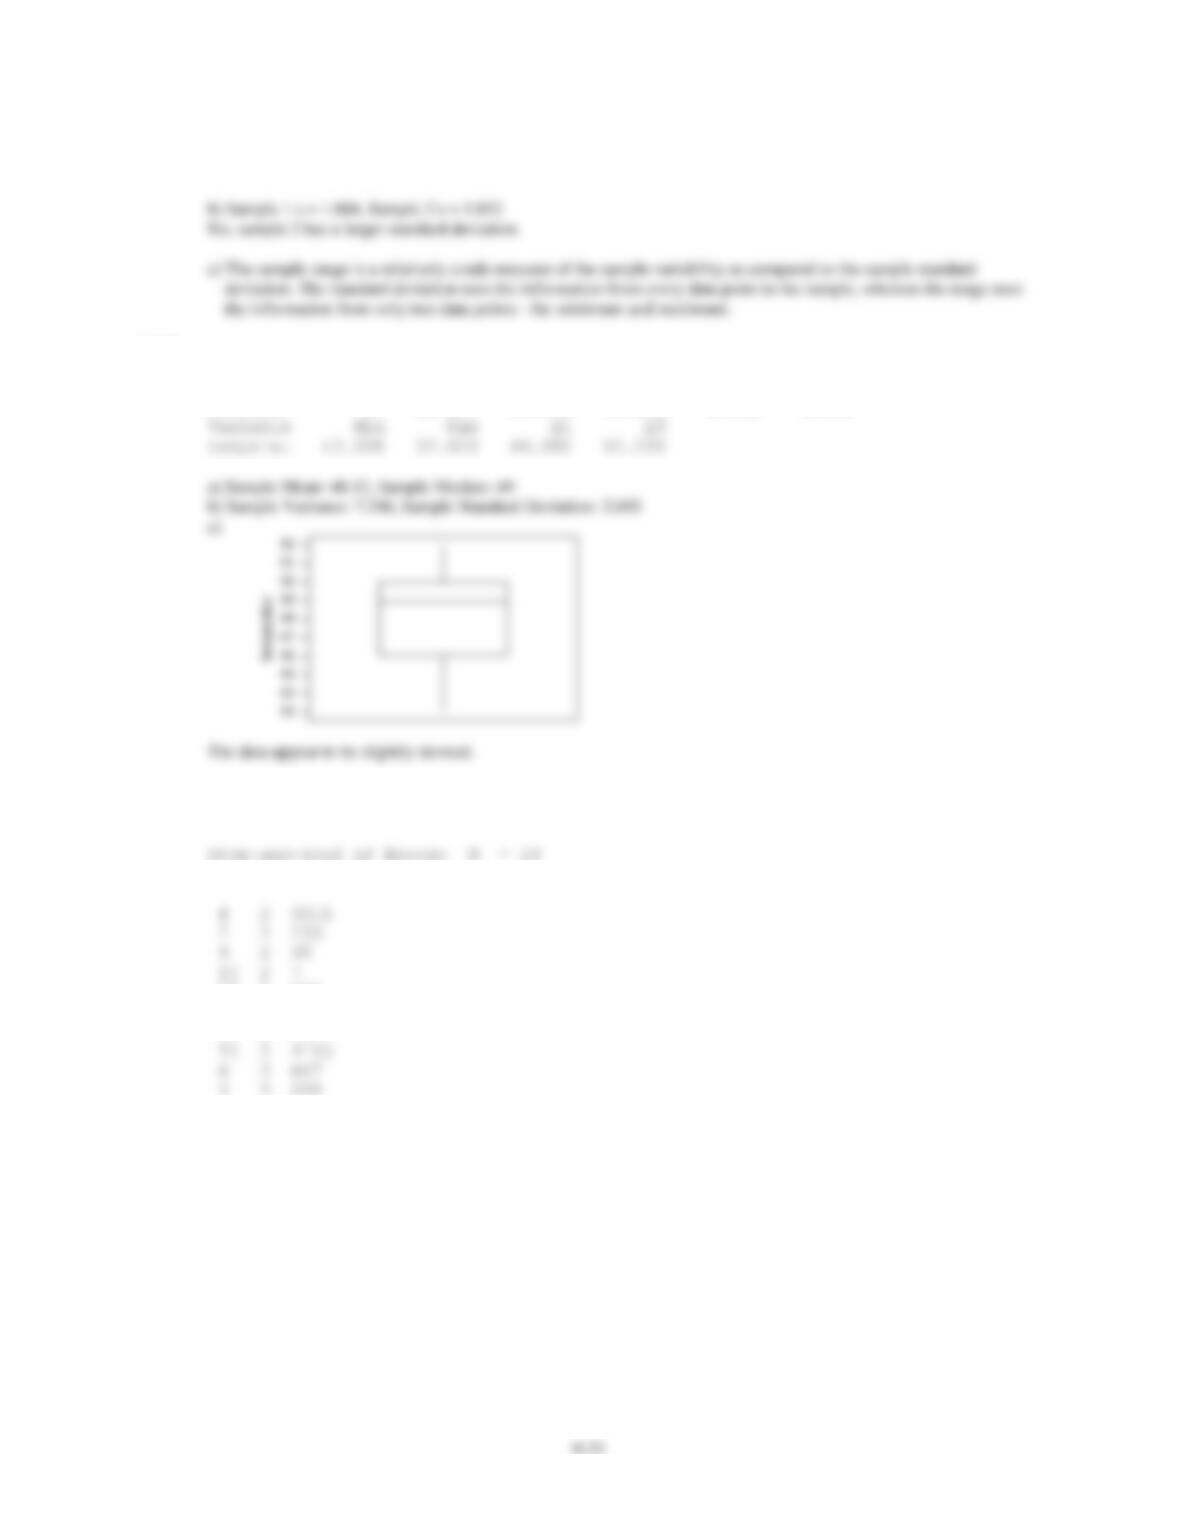
a) Median = 67.50, Lower Quartile: Q1=58.50, Upper Quartile: Q3=75.00
b) Data with lowest point removed
Variable N Mean Median TrMean StDev SE Mean
Temp 35 66.86 68.00 67.35 10.74 1.82
c)Box Plot: The box plot indicates that there is an outlier in the data.
6.4.6 The box plot and the stem-leaf-diagram show that the data are very symmetrical about the mean. It also shows that there are no
outliers in the data.
Applied Statistics and Probability for Engineers, 7th edition
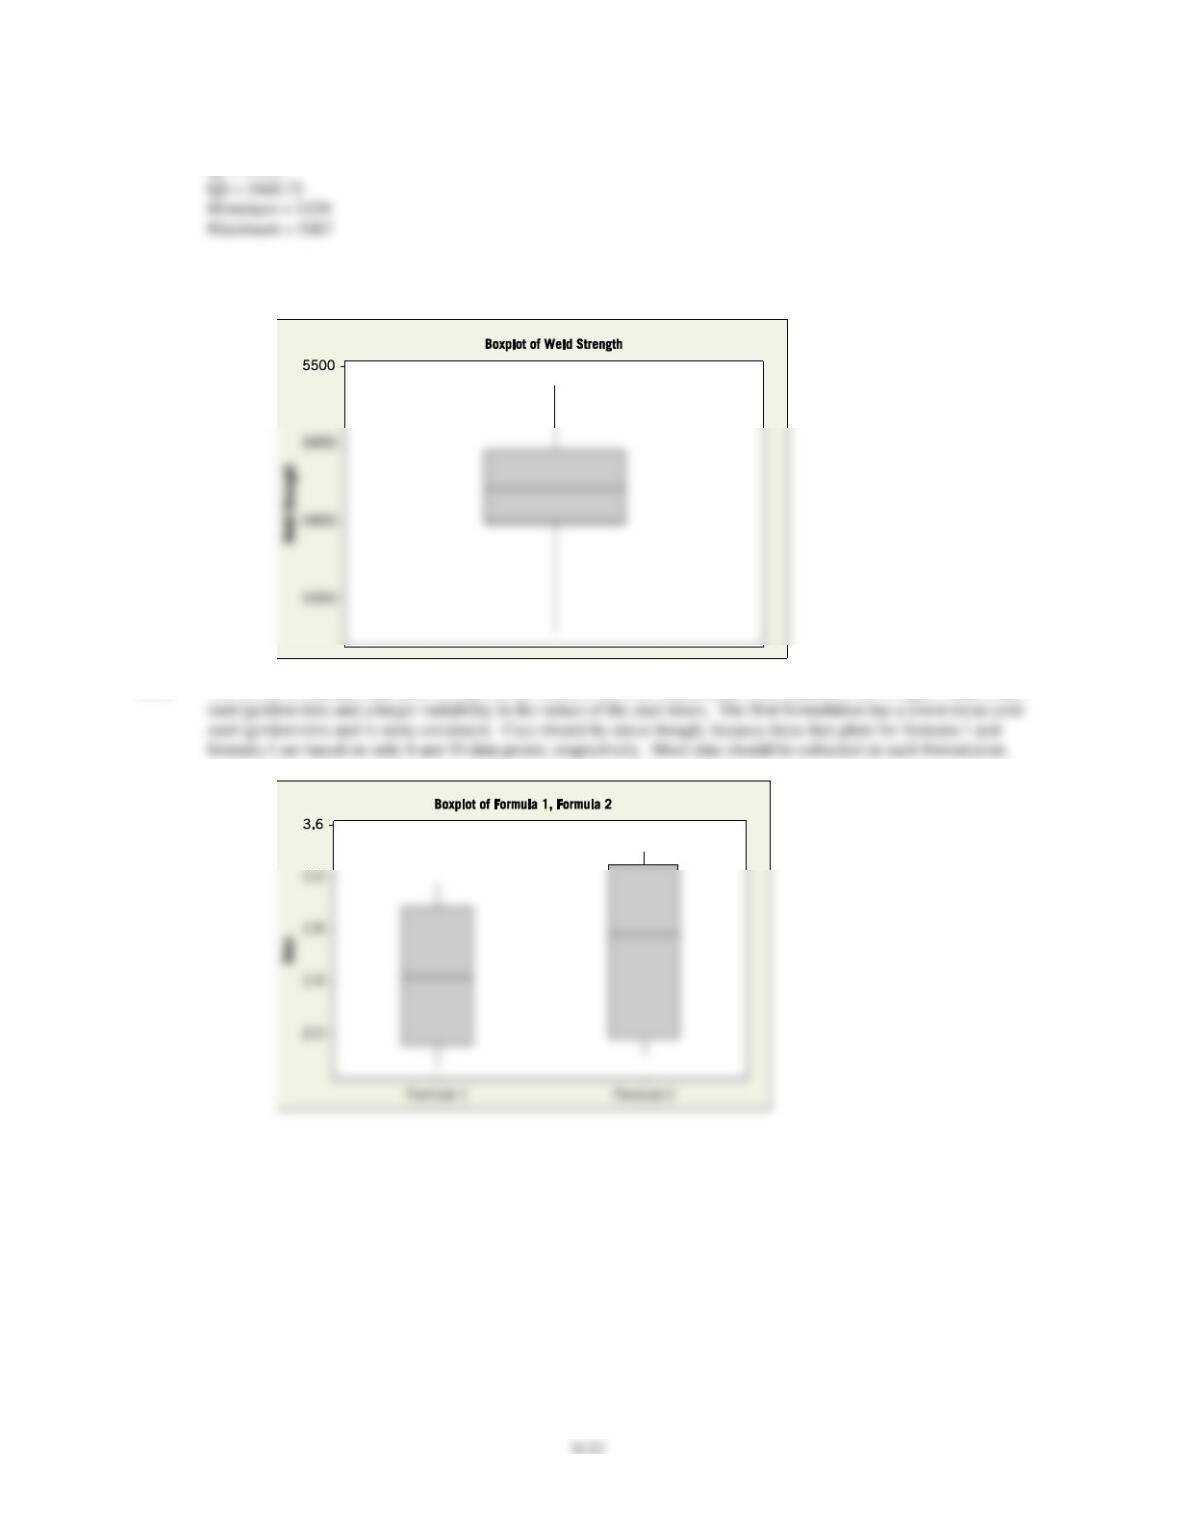
6.4.7 Median = 5421.5
Q1 = 5399
This plot, as the stem and leaf one, indicates that the data fall mostly in one region and that the measurements
toward the ends of the range are more rare.
6.4.8 The box plot indicates that there is a difference between the two formulations. Formulation 2 has a higher mean cold
6-22
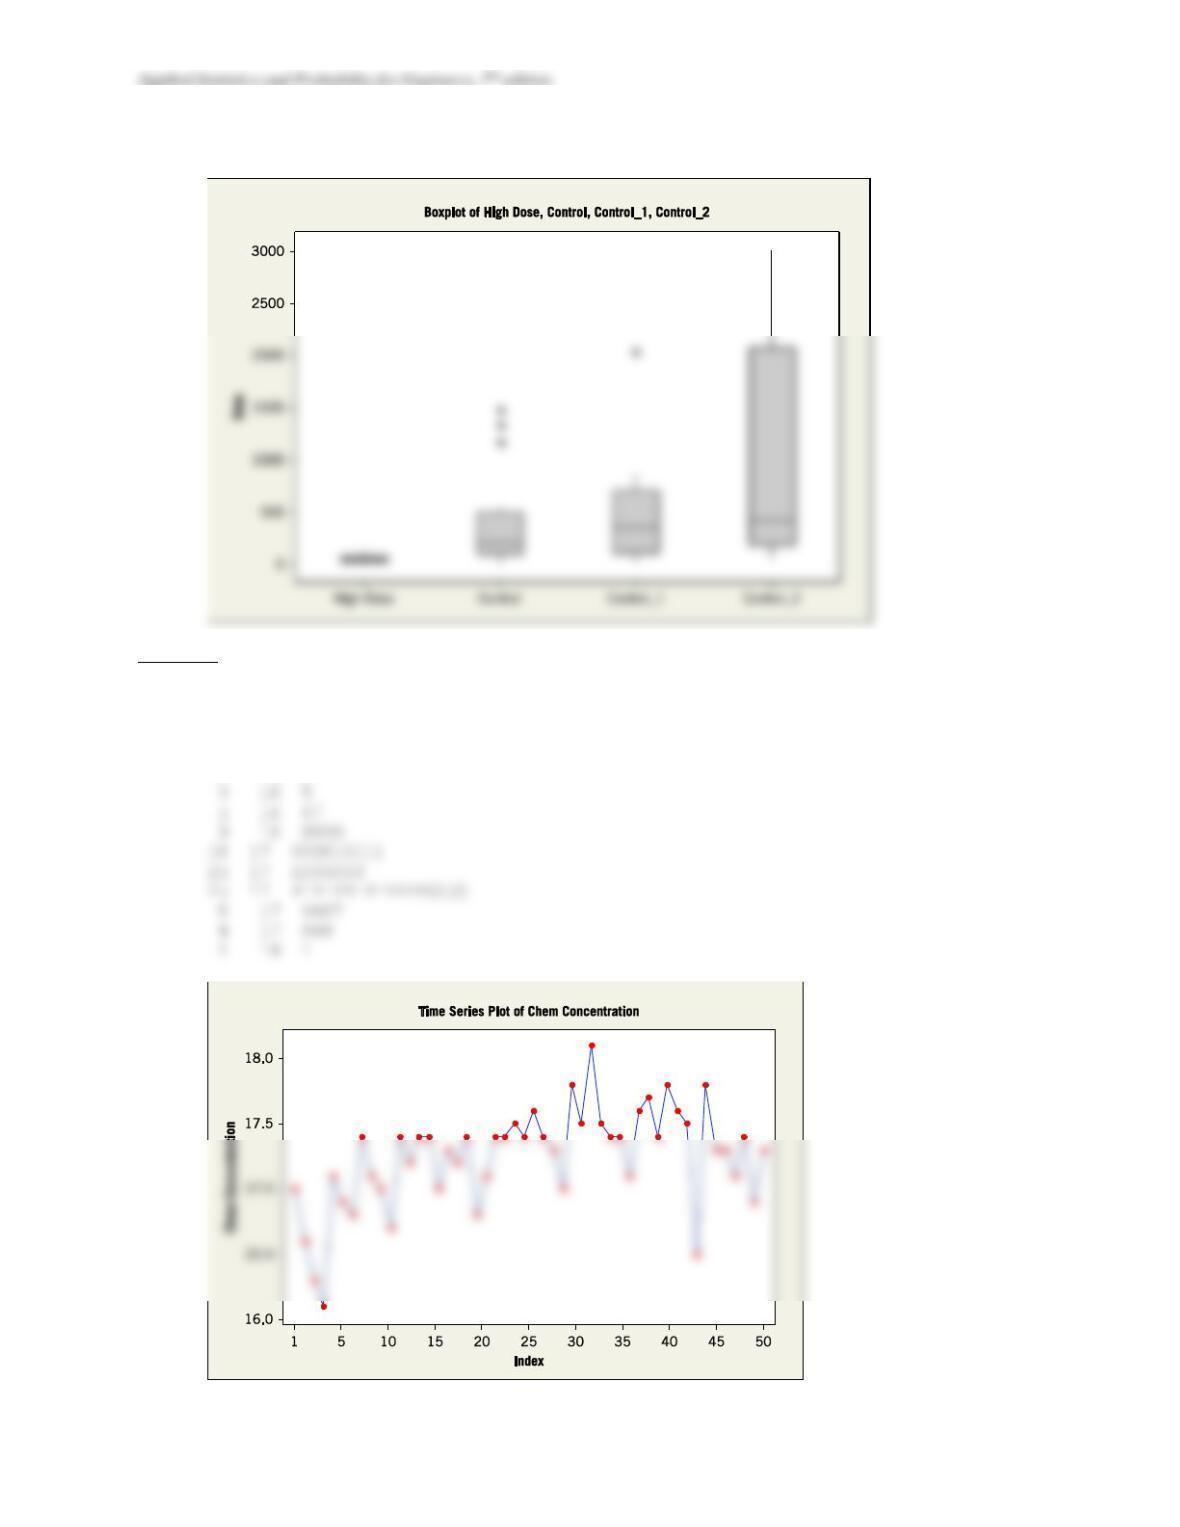
6.4.9 All distributions are centered at about the same value, but have different variances.
Section 6.5
6.5.1 Stem-and-leaf of ChemConcentration N = 50
Leaf Unit = 0.10
1 16 1
2 16 3
6-23
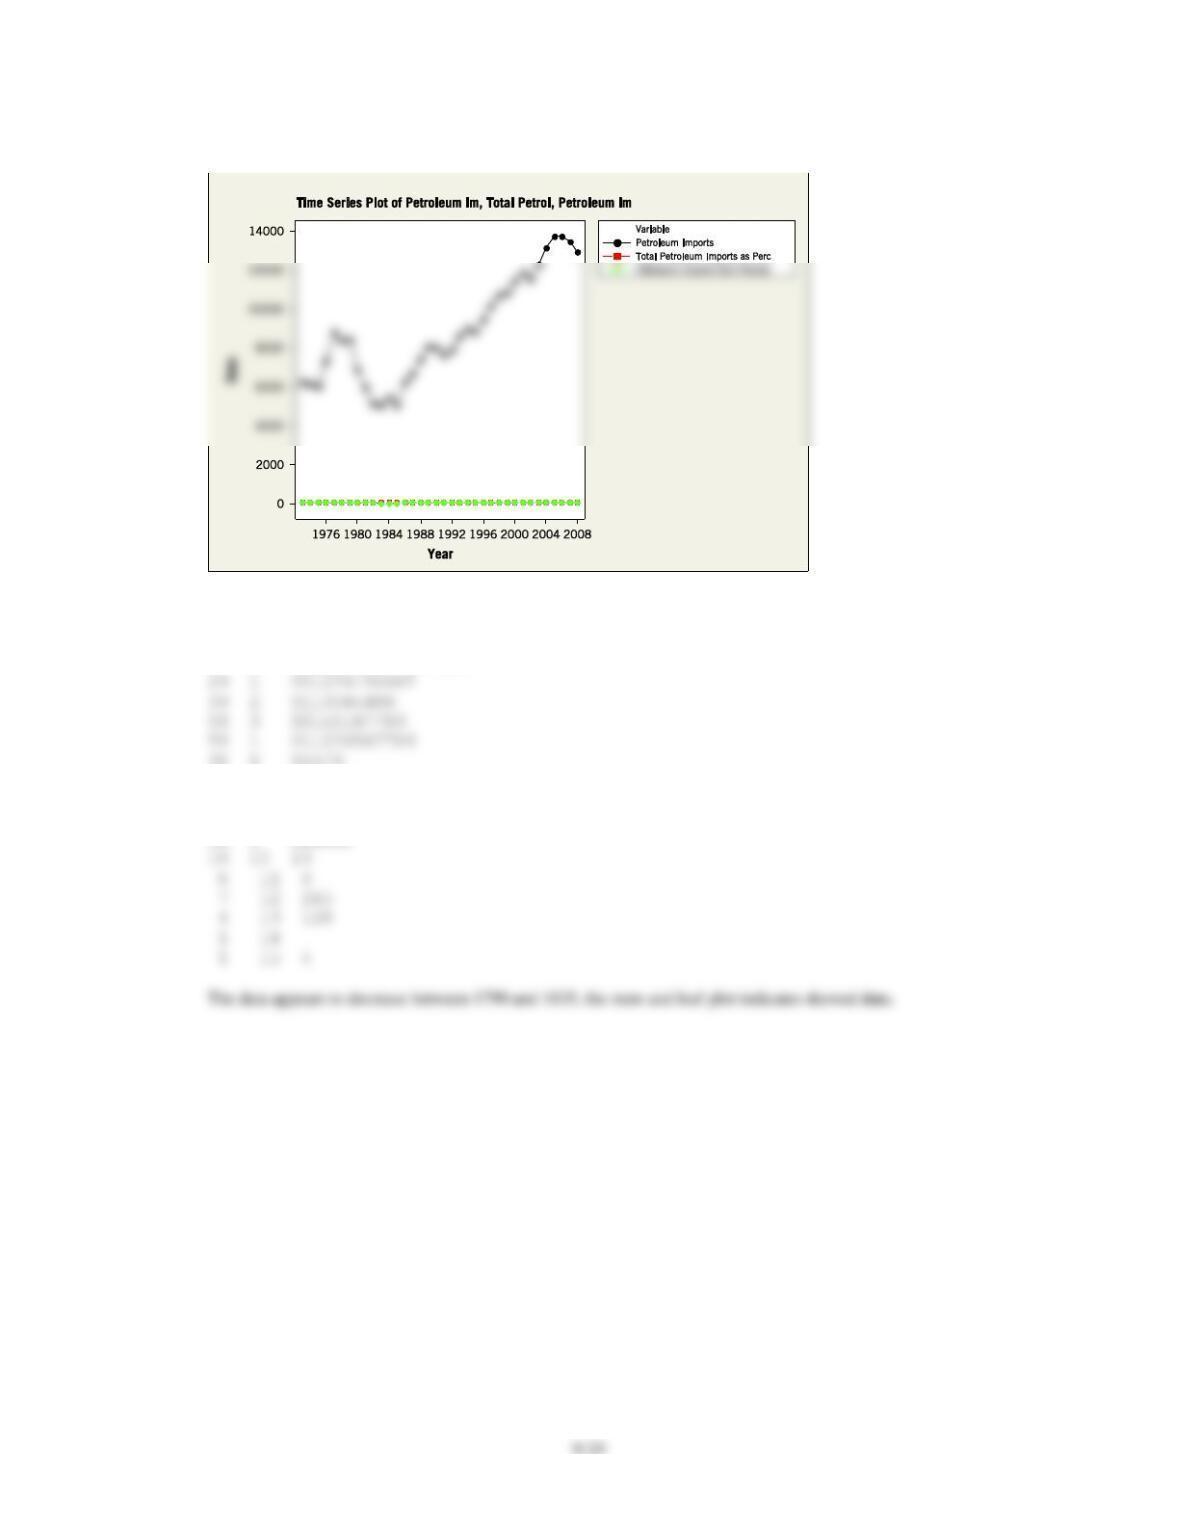
6.5.2 Stem-and-leaf of Petroleum Imports N = 36
Leaf Unit = 100
(8) 8 00346889
13 9 4
12 10 178
Stem-and-leaf of Total Petroleum Imports as Perc N = 36
Leaf Unit = 1.0
4 3 2334
9 3 66778
14 4 00124
Stem-and-leaf of Petroleum Imports from Persian N = 36
Leaf Unit = 1.0
1 0 6
6 1 4
14 1 66667777
(6) 1 889999
Applied Statistics and Probability for Engineers, 7th edition
Time Series plot:
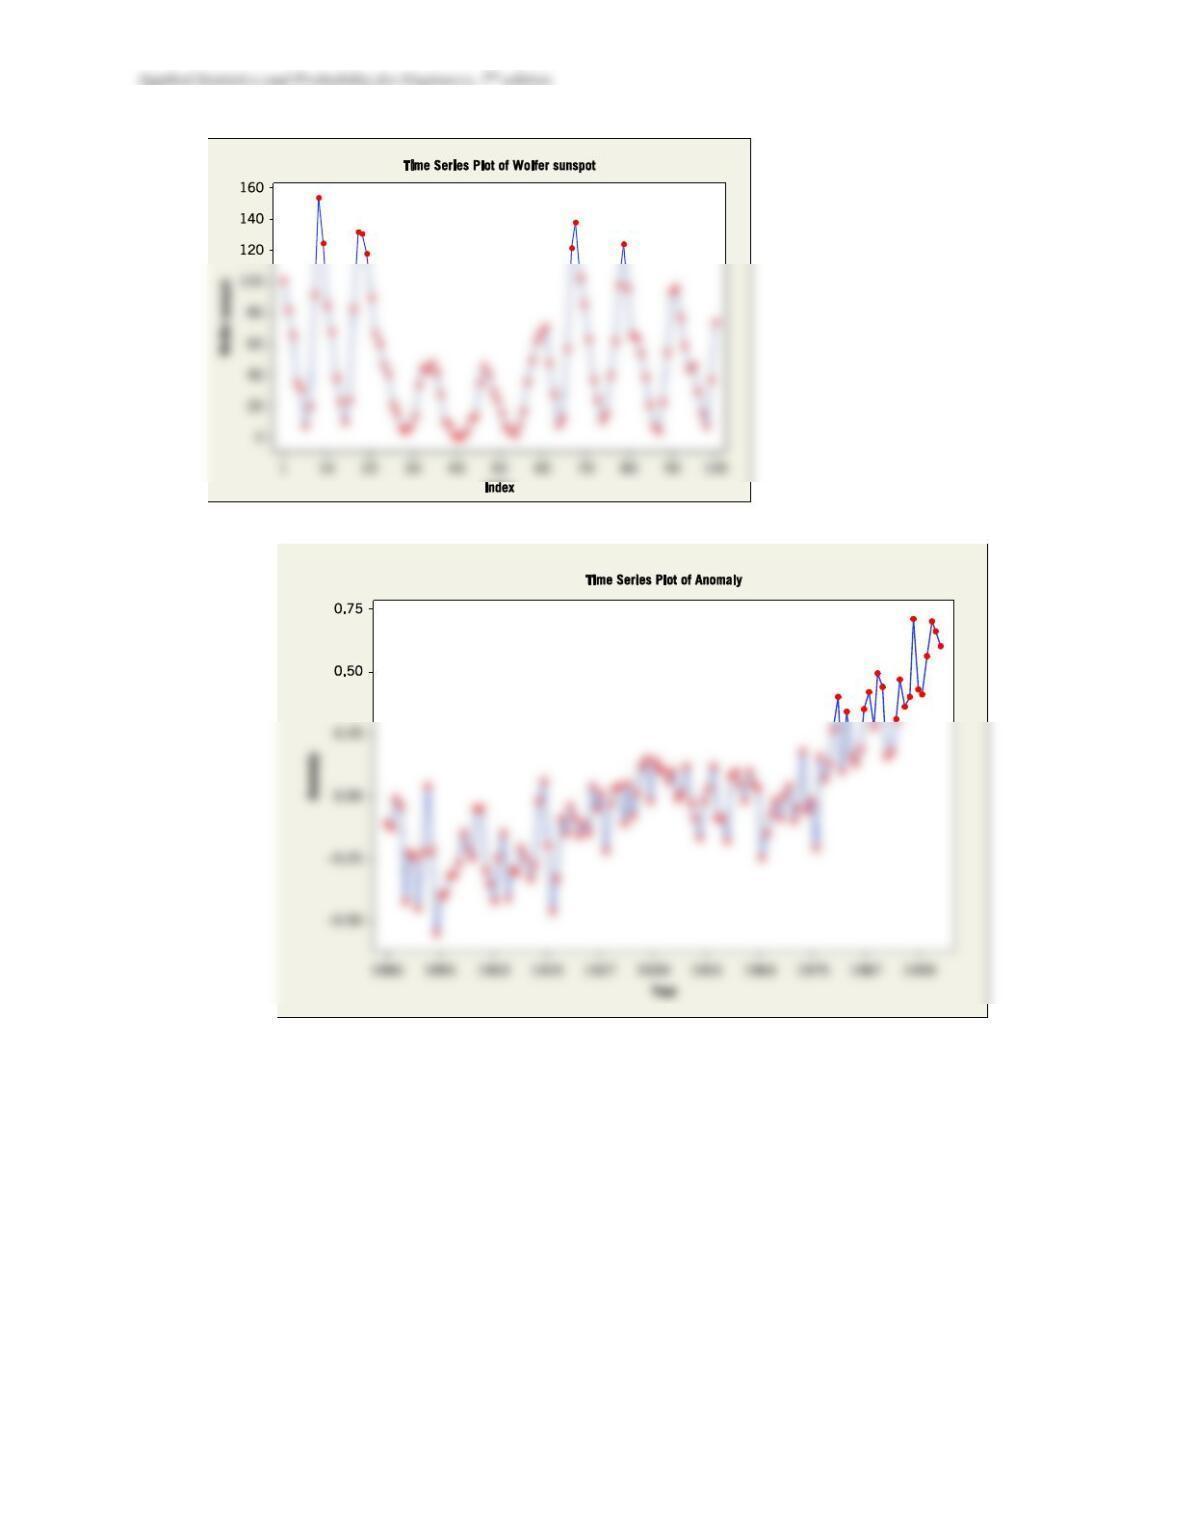
6.5.3 Stem-and-leaf of Wolfersunspot N = 100
Leaf Unit = 1.0
17 0 01224445677777888
38 5 04579
33 6 0223466778
23 7 147
20 8 2356
16 9 024668
6-25
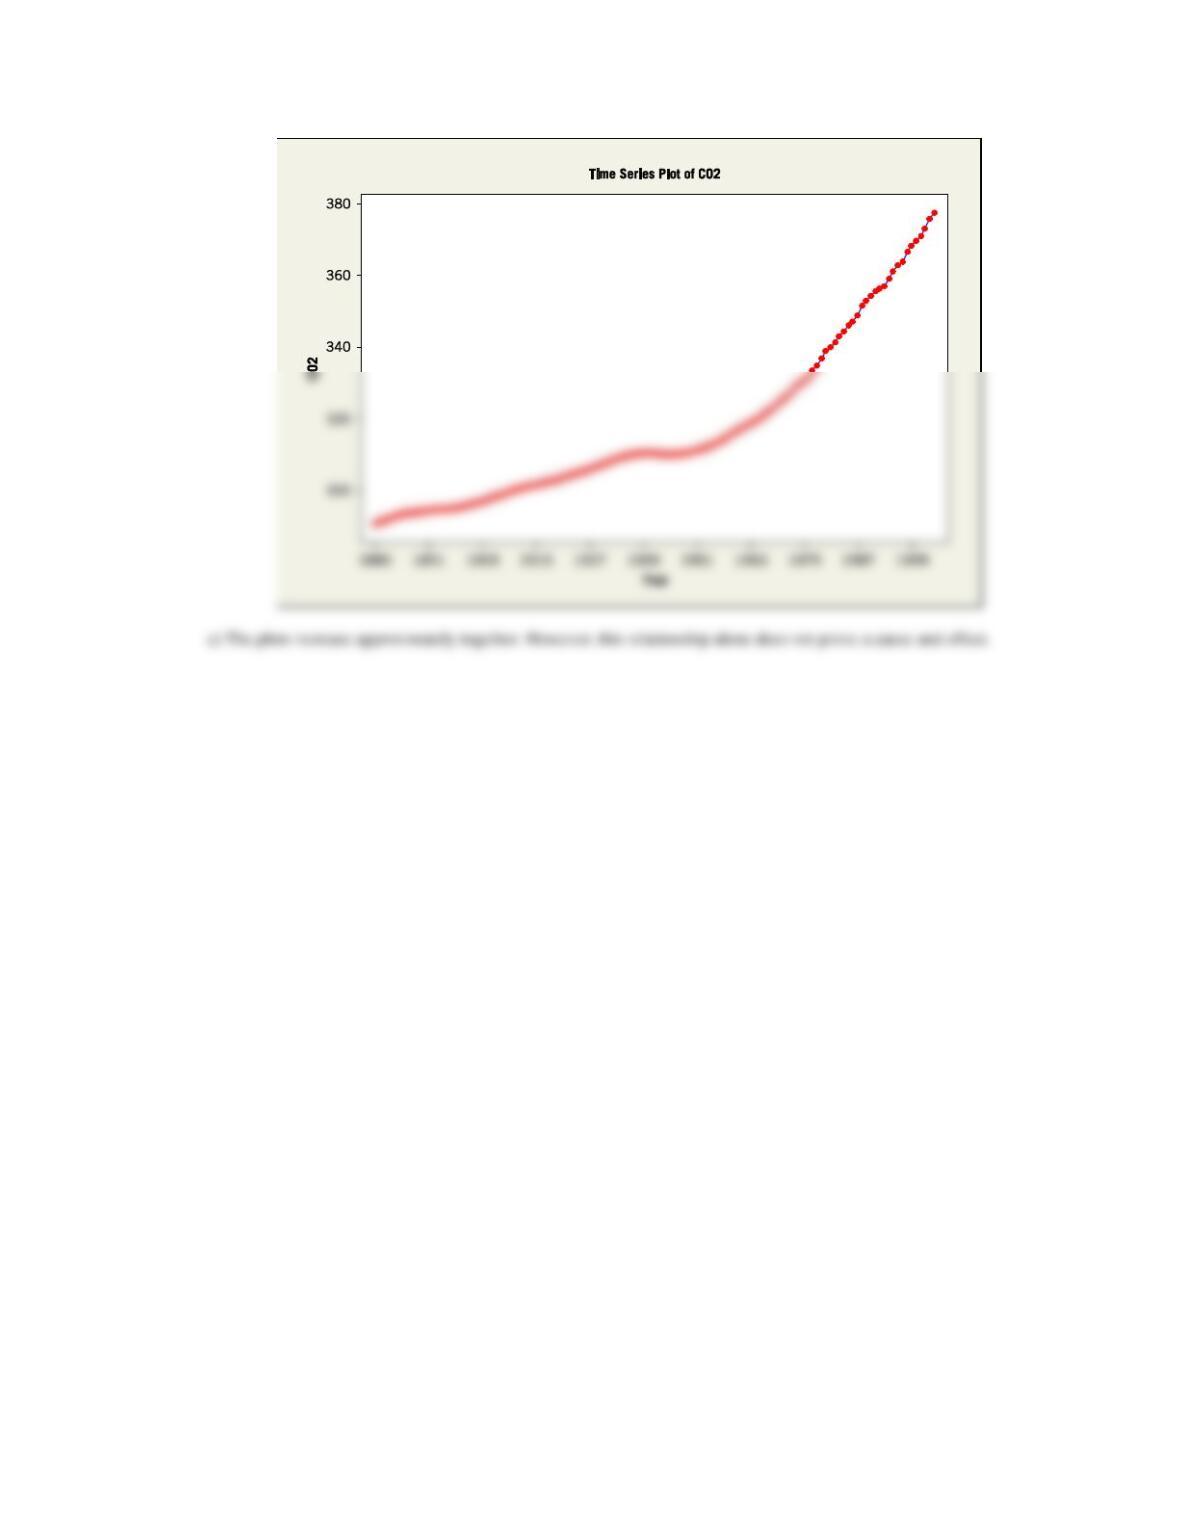
6.5.4
a)
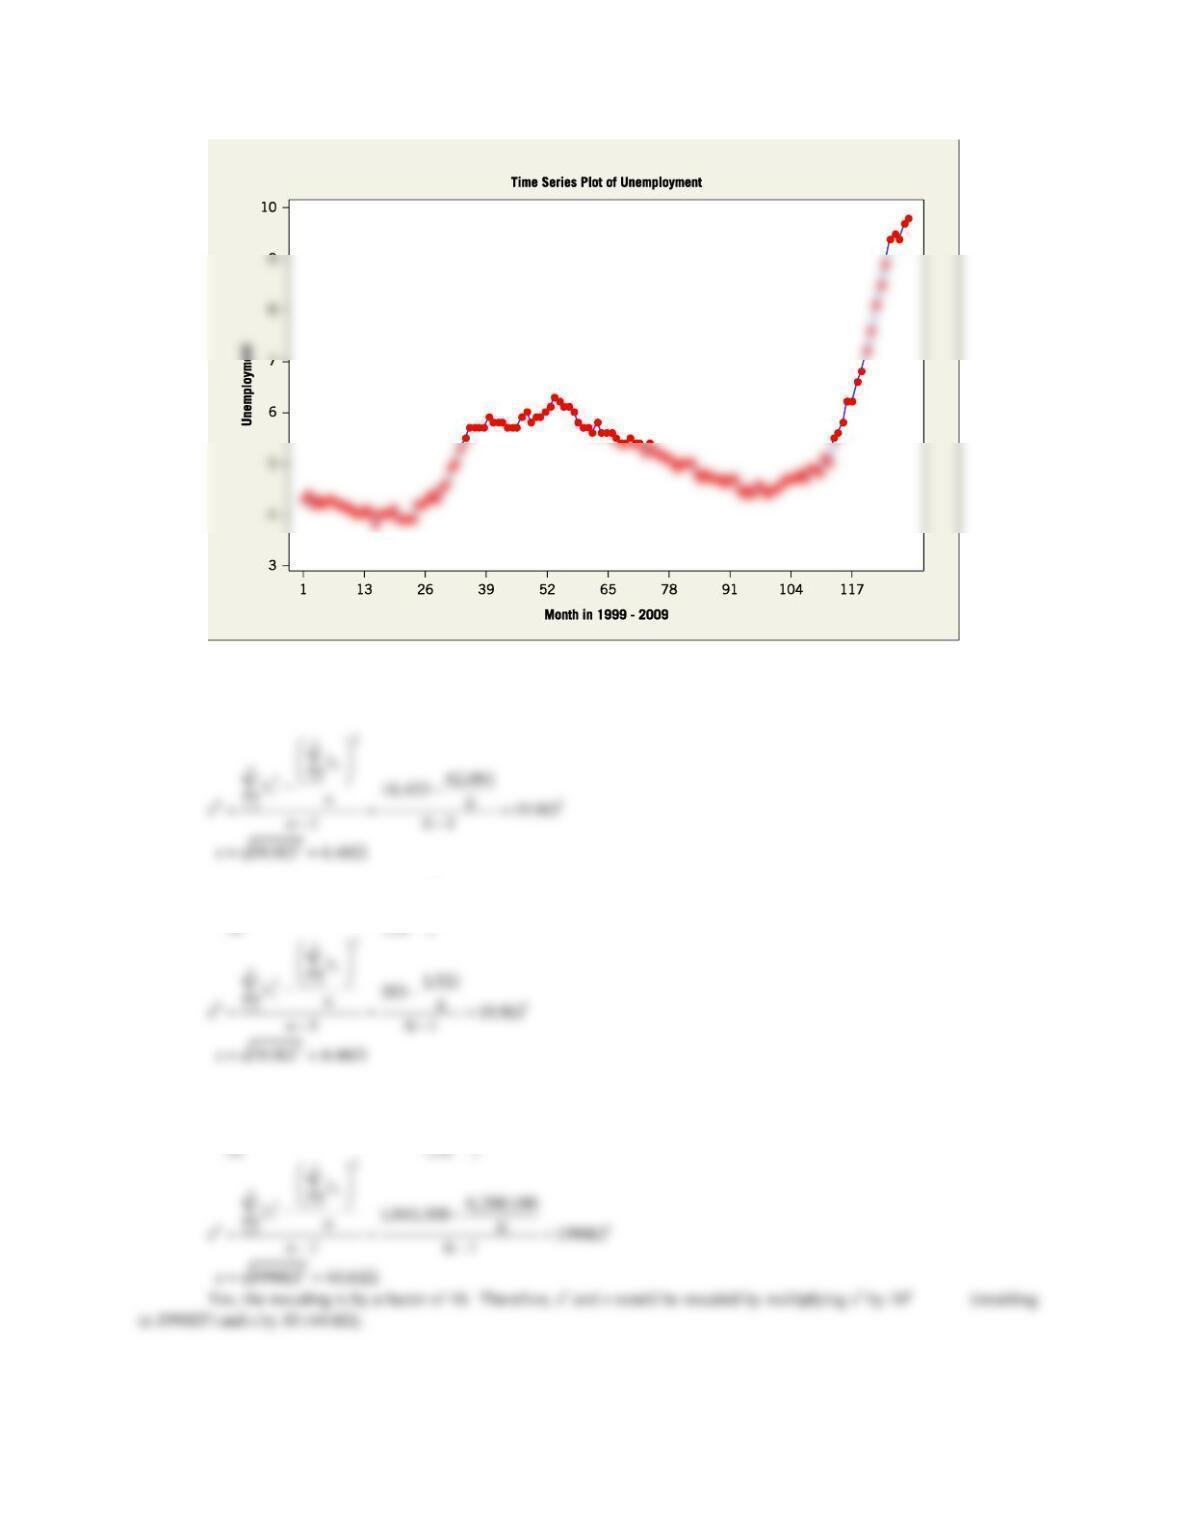
There is an increasing trend in the most recent data.
b)
Applied Statistics and Probability for Engineers, 7th edition
6-26
Applied Statistics and Probability for Engineers, 7th edition
Section 6.6
6.6.1
a)
Section 6.7
6.7.1
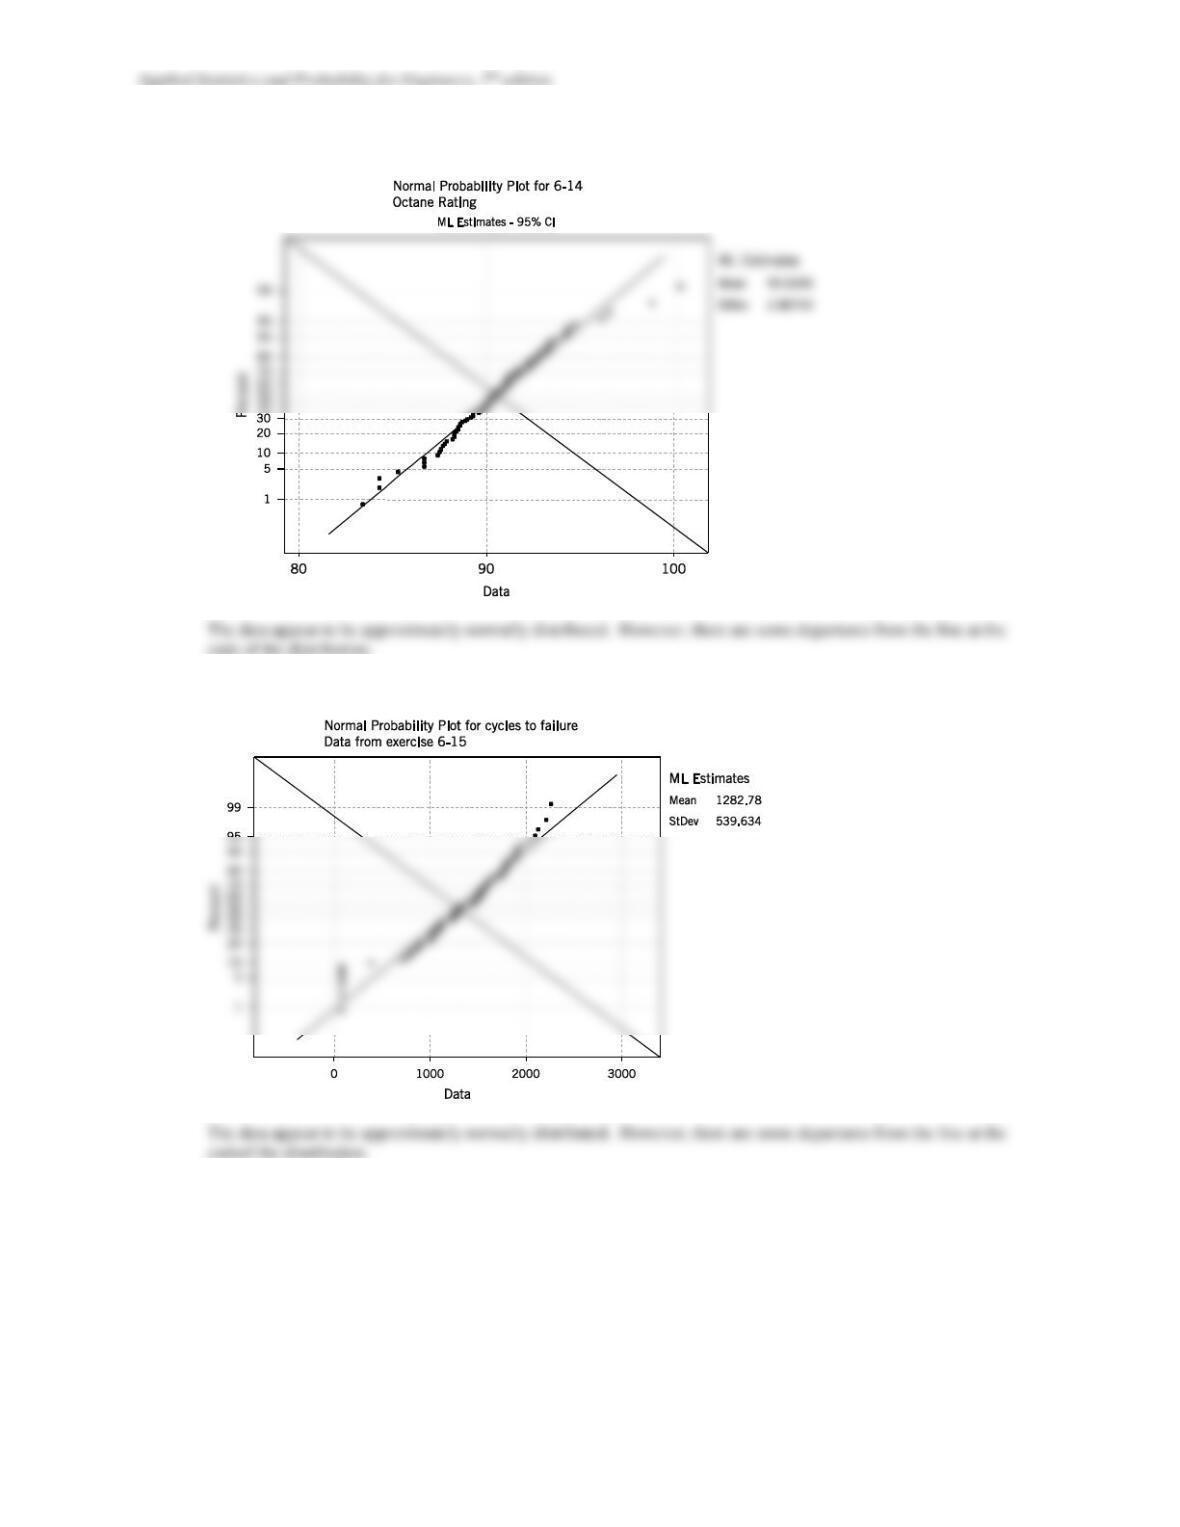
A normal distribution is reasonable for these data.
6-28
6.7.2
6.7.3
Applied Statistics and Probability for Engineers, 7th edition
6-29
6.7.4
6.7.5
6.7.6 Yes, it is possible to obtain an estimate of the mean from the 50th percentile value of the normal probability plot. The
Supplemental Exercises
6.S7
Applied Statistics and Probability for Engineers, 7th edition
6-30
6.S8 a)
==
= = =
2
66
2
11
10,433 62,001 6
ii
ii
x x n
b)
= = =
2
66
2
353 1521 6
ii
x x n
Shifting the data from the sample by a constant amount has no effect on the sample variance or standard deviation.
c)
= = =
2
66
2
1,043,300 6,200,100 6
ii
x x n
Applied Statistics and Probability for Engineers, 7th edition
6.S9 a) Sample 1 Range = 4;Sample 2 Range = 4
Yes, the two samples appear to exhibit similar variability.
6.S10
Descriptive Statistics
Variable N Mean Median Tr Mean StDev SE Mean
temperat 24 48.125 49.000 48.182 2.692 0.549
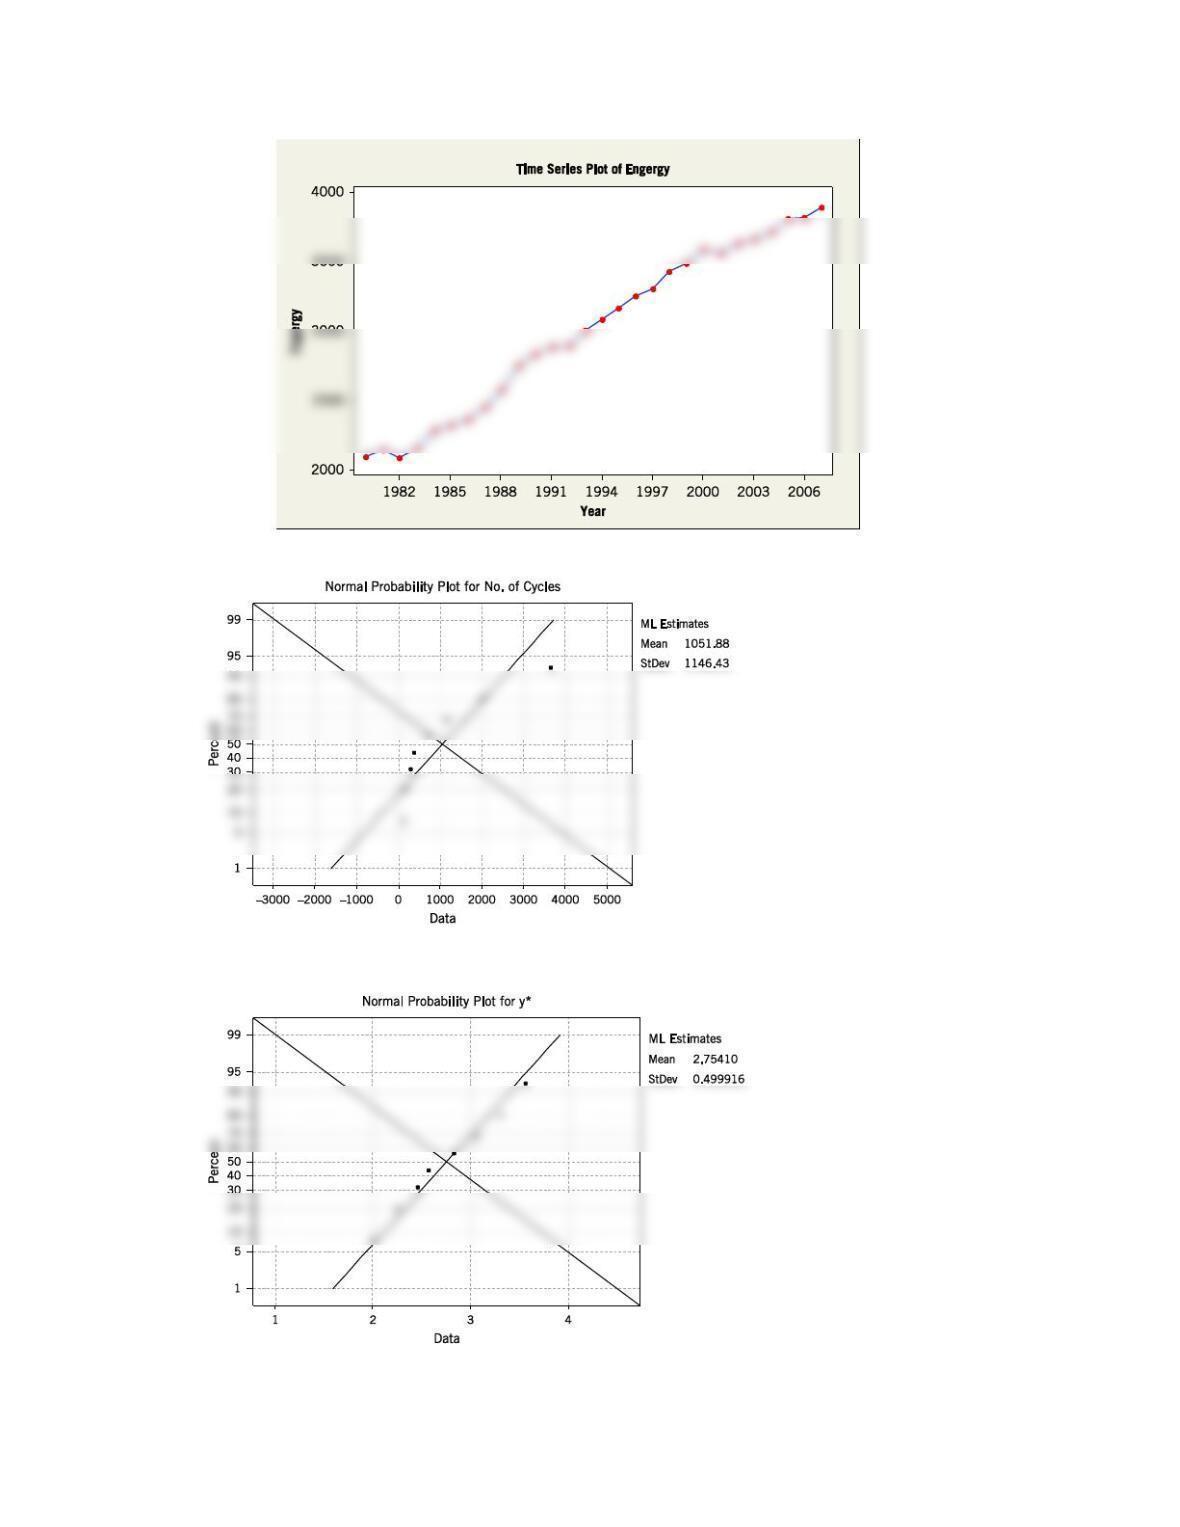
6.S11 From the stem-and-leaf diagram, the distribution looks like the uniform distribution. From the time series plot, there is
an increasing trend in energy consumption.
Leaf Unit = 100
13 2 888
(3) 3 001
12 3 23
Applied Statistics and Probability for Engineers, 7th edition
6-32
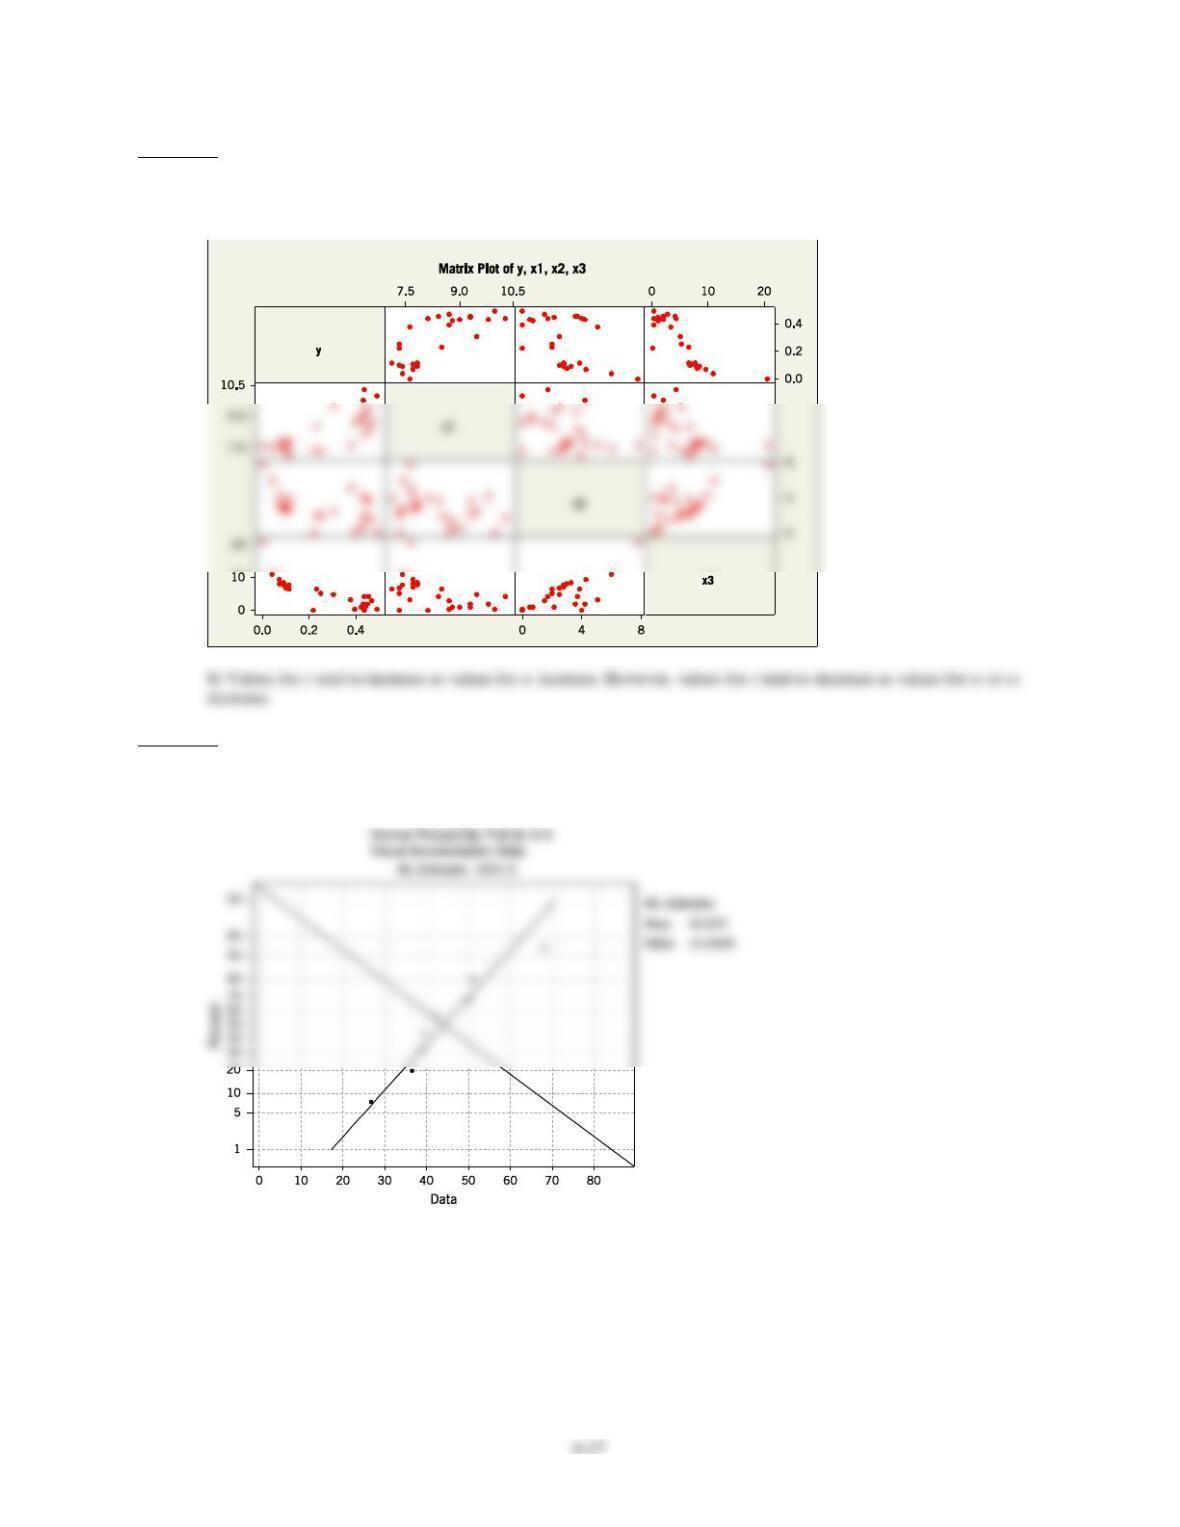
6.S12 a)
The data do not appear to be normally distributed. The points deviate from the line.
b)
After the transformation y* = log(y), the normal probability indicates that a normal distribution is reasonable.
Applied Statistics and Probability for Engineers, 7th edition
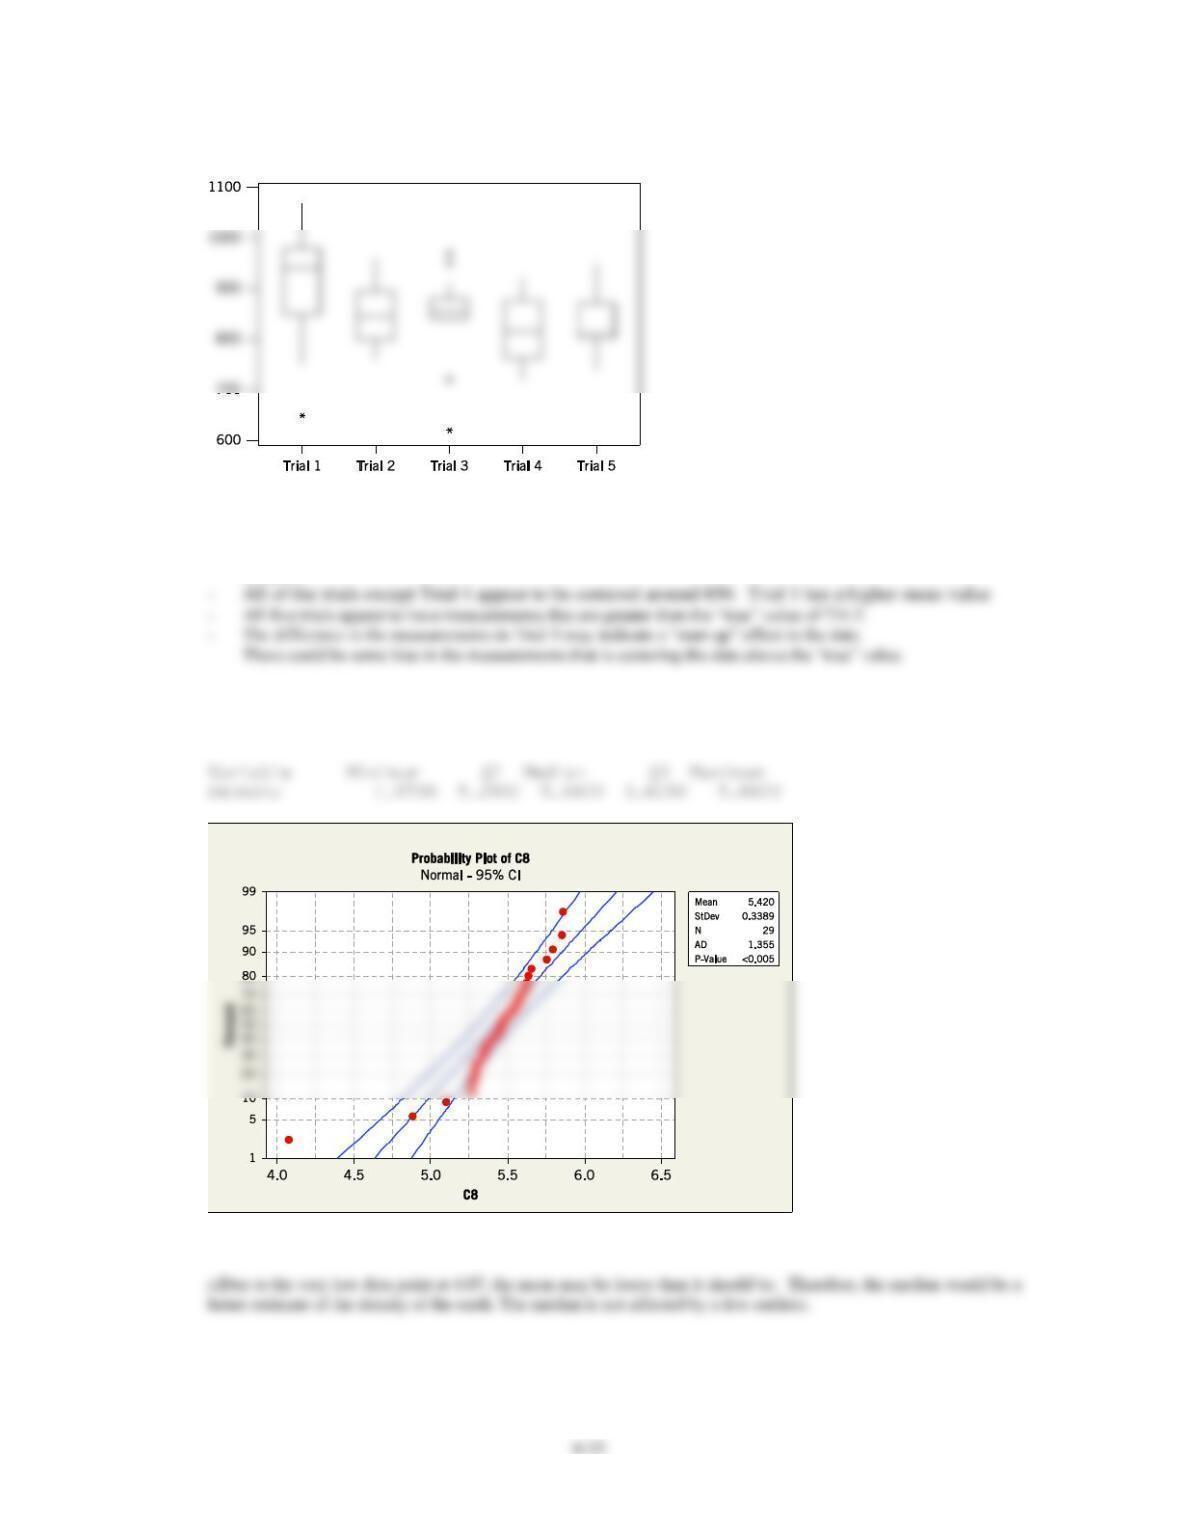
6.S13
– There is a difference in the variability of the measurements in the trials. Trial 1 has the most
variability in the measurements. Trial 3 has a small amount of variability in the main group of
measurements, but there are four outliers. Trial 5 appears to have the least variability without any
outliers.
6.S14 a)Descriptive Statistics
Variable N N* Mean SE Mean StDev Variance
Density 29 0 5.4197 0.0629 0.3389 0.1148
b) There appears to be a low outlier in the data.
6-34
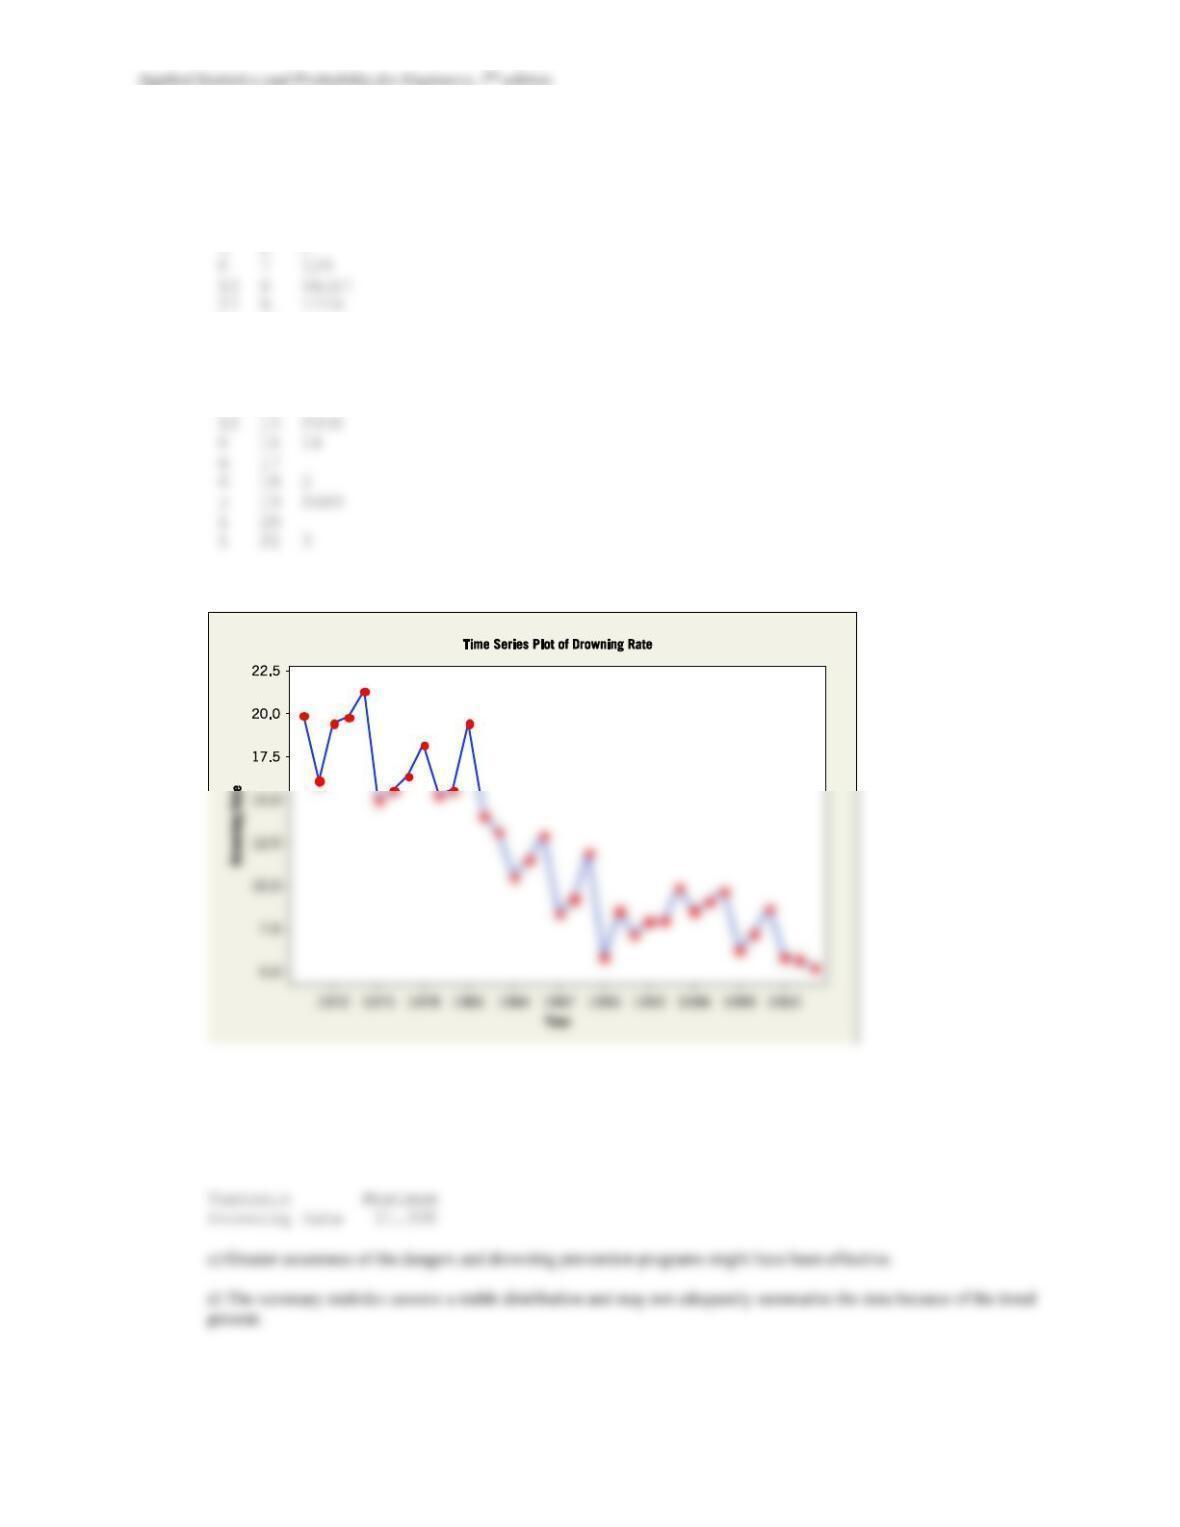
6.S15
a) Stem-and-leaf of Drowning Rate N = 35
Leaf Unit = 0.10
4 5 2788
(1) 10 5
17 11 59
15 12 9
14 13 1
13 14 0
Time Series Plots
b)
Descriptive Statistics: Drowning Rate
Variable N N* Mean SE Mean StDev Minimum Q1 Median Q3
Drowning Rate 35 0 11.911 0.820 4.853 5.200 8.000 10.500 15.600
Applied Statistics and Probability for Engineers, 7th edition
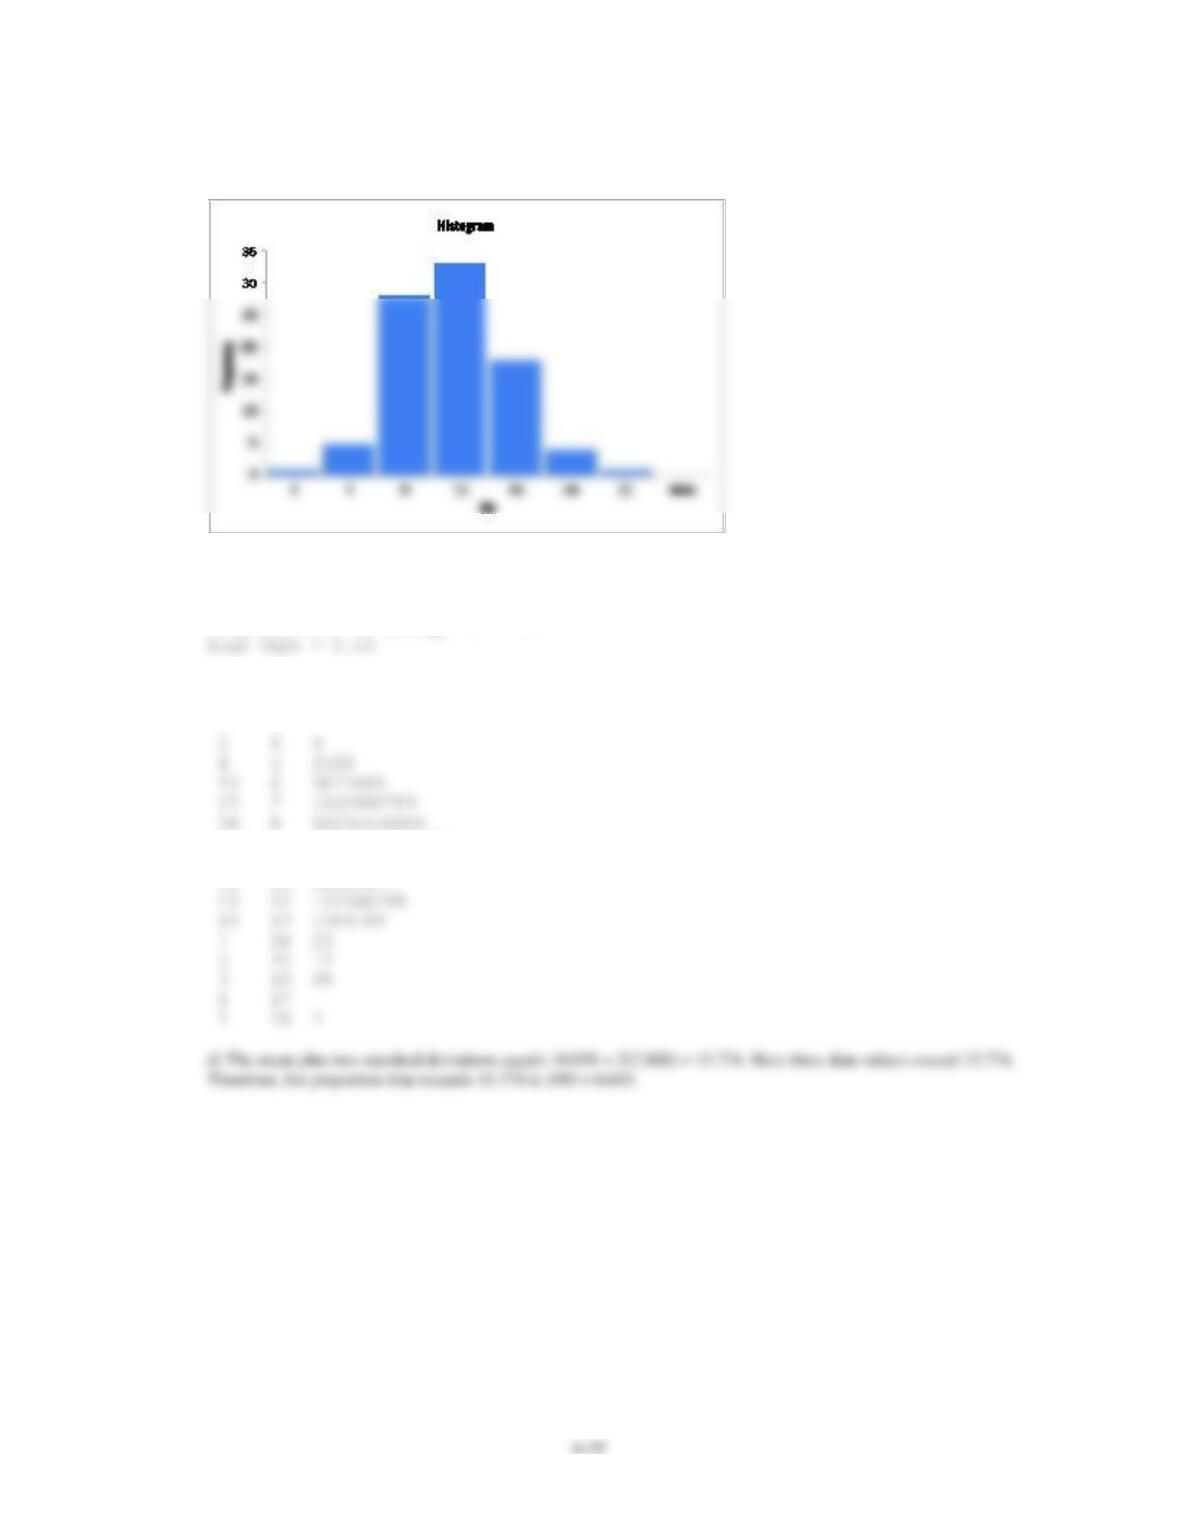
6.S16
a) The sample mean is 10.038 and the sample standard deviation is 2.868.
b)
The histogram is approximately symmetric around the mean value.
c)
Stem-and-leaf of Energy N = 90
1 2 9
1 3
(13) 9 0234556788889
43 10 022233344569
31 11 01224677
6-36
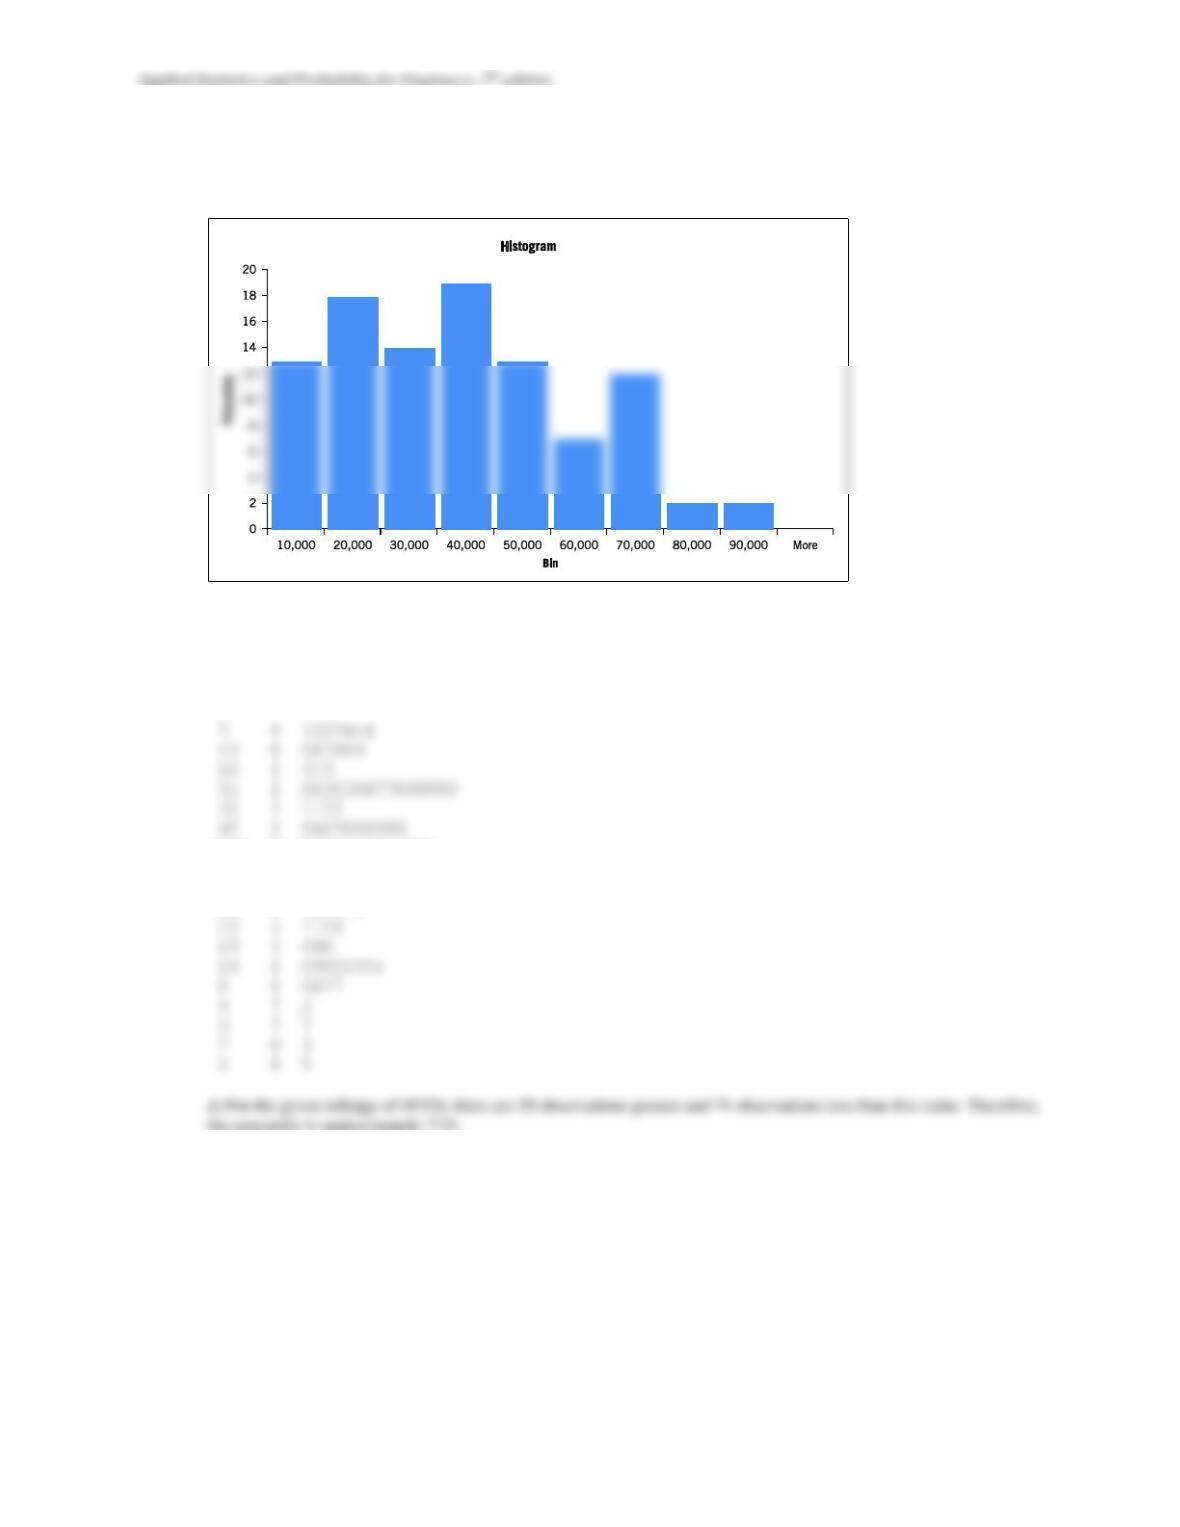
6.S17 a) Sample mean = 34,232.05
Standard deviation = 20,414.52
b)
There is substantial variability in mileage. The data is right skewed.
c)
Stem-and-leaf of Mileage N = 100
Leaf Unit = 1000
(13) 3 0001112223334
42 3 667788
36 4 0012334
29 4 567899
Applied Statistics and Probability for Engineers, 7th edition
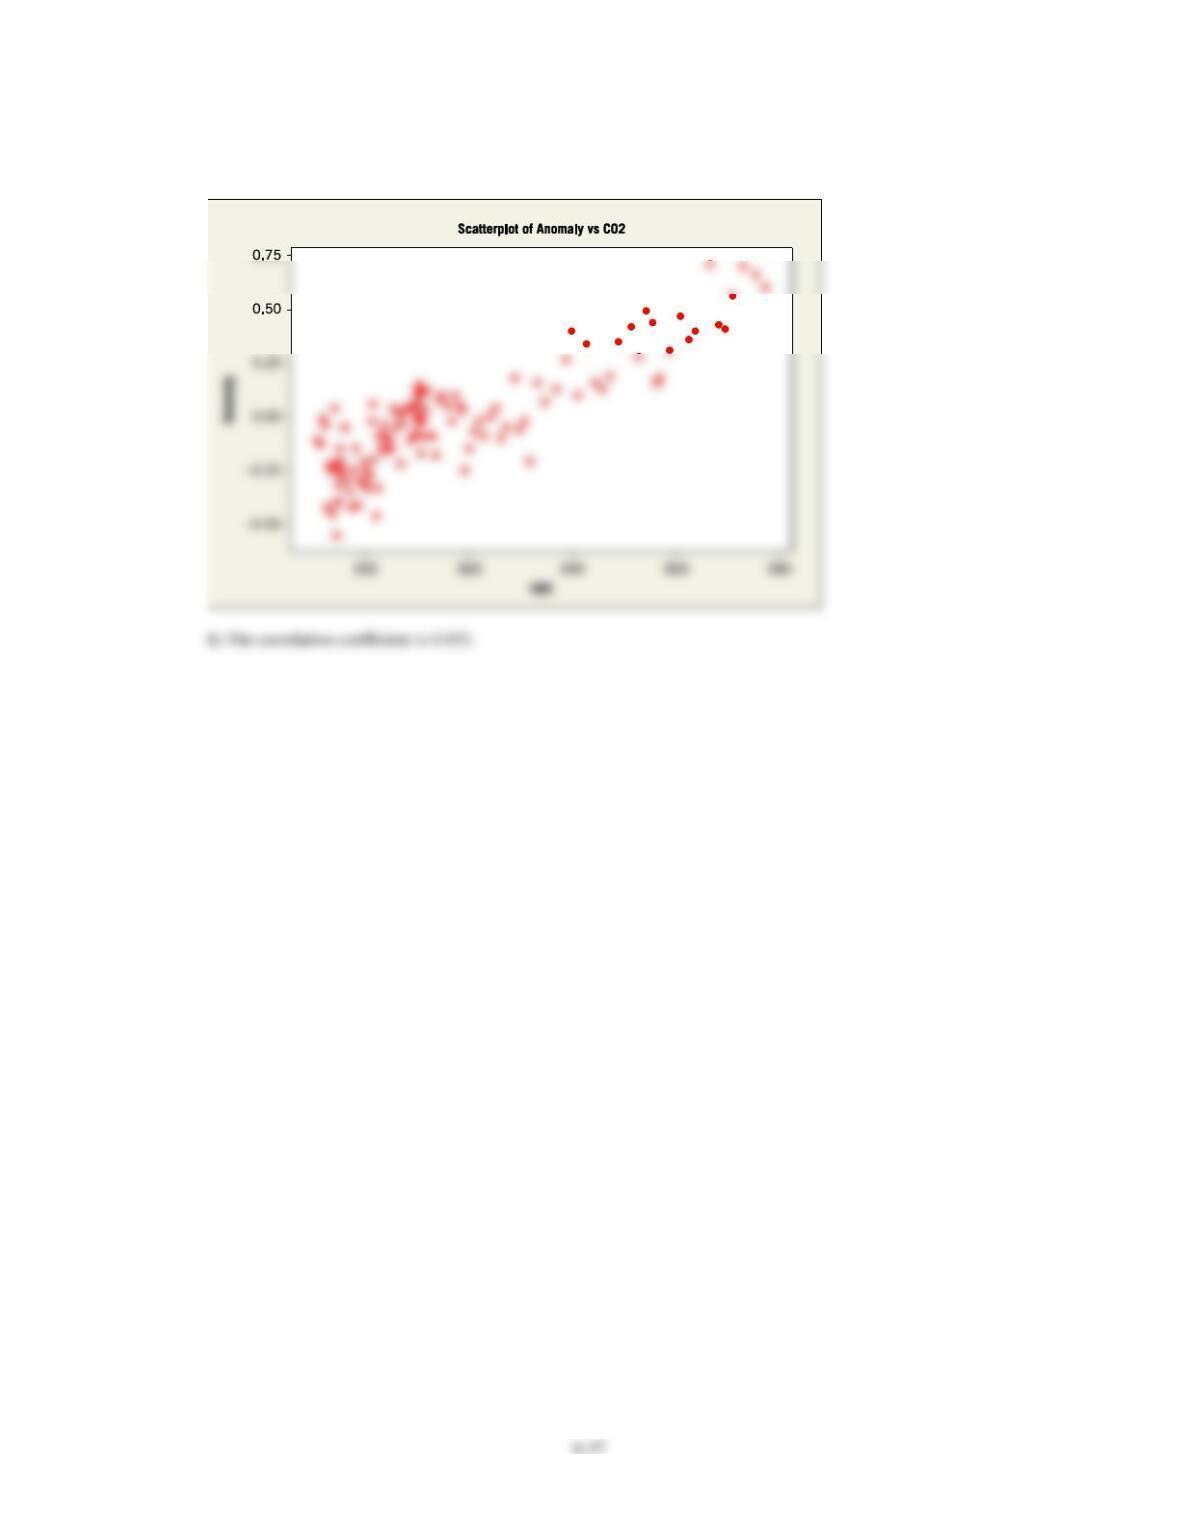
6.S18
a) The scatter plot indicates and approximately linear relationship.