C
D
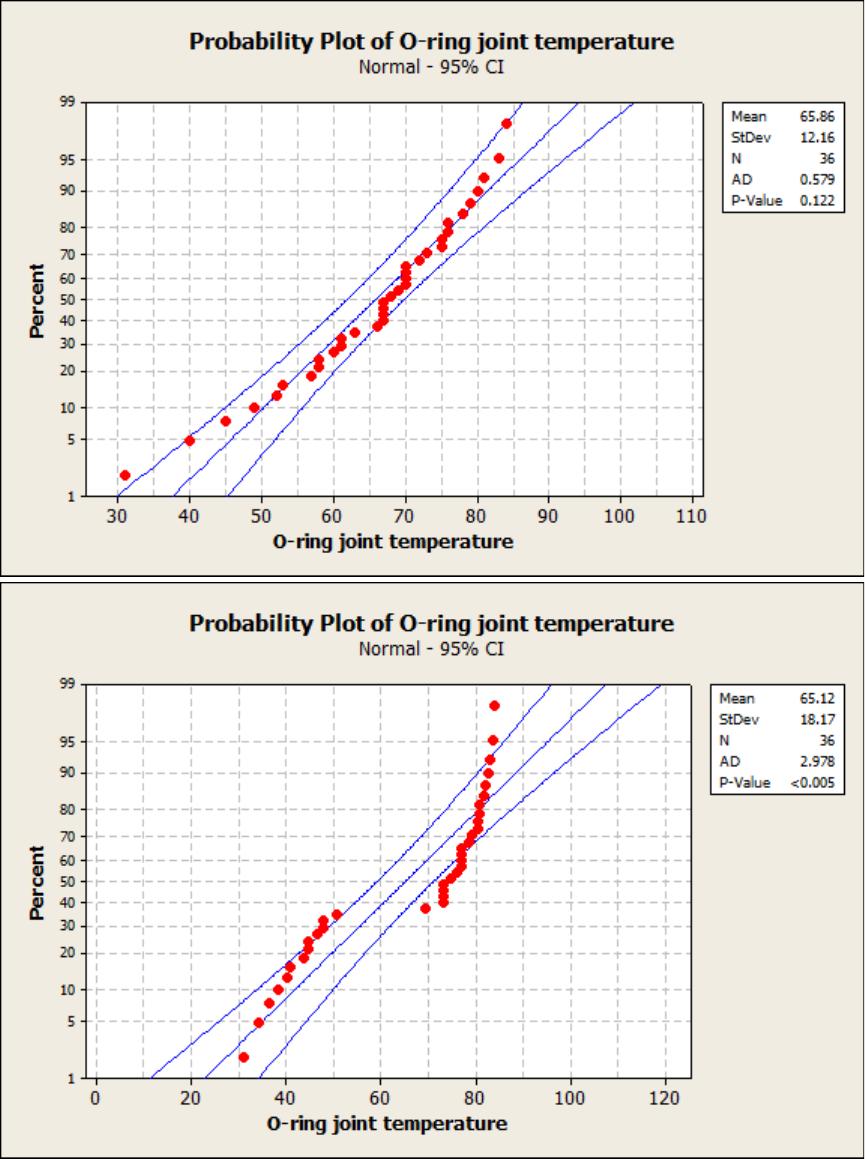
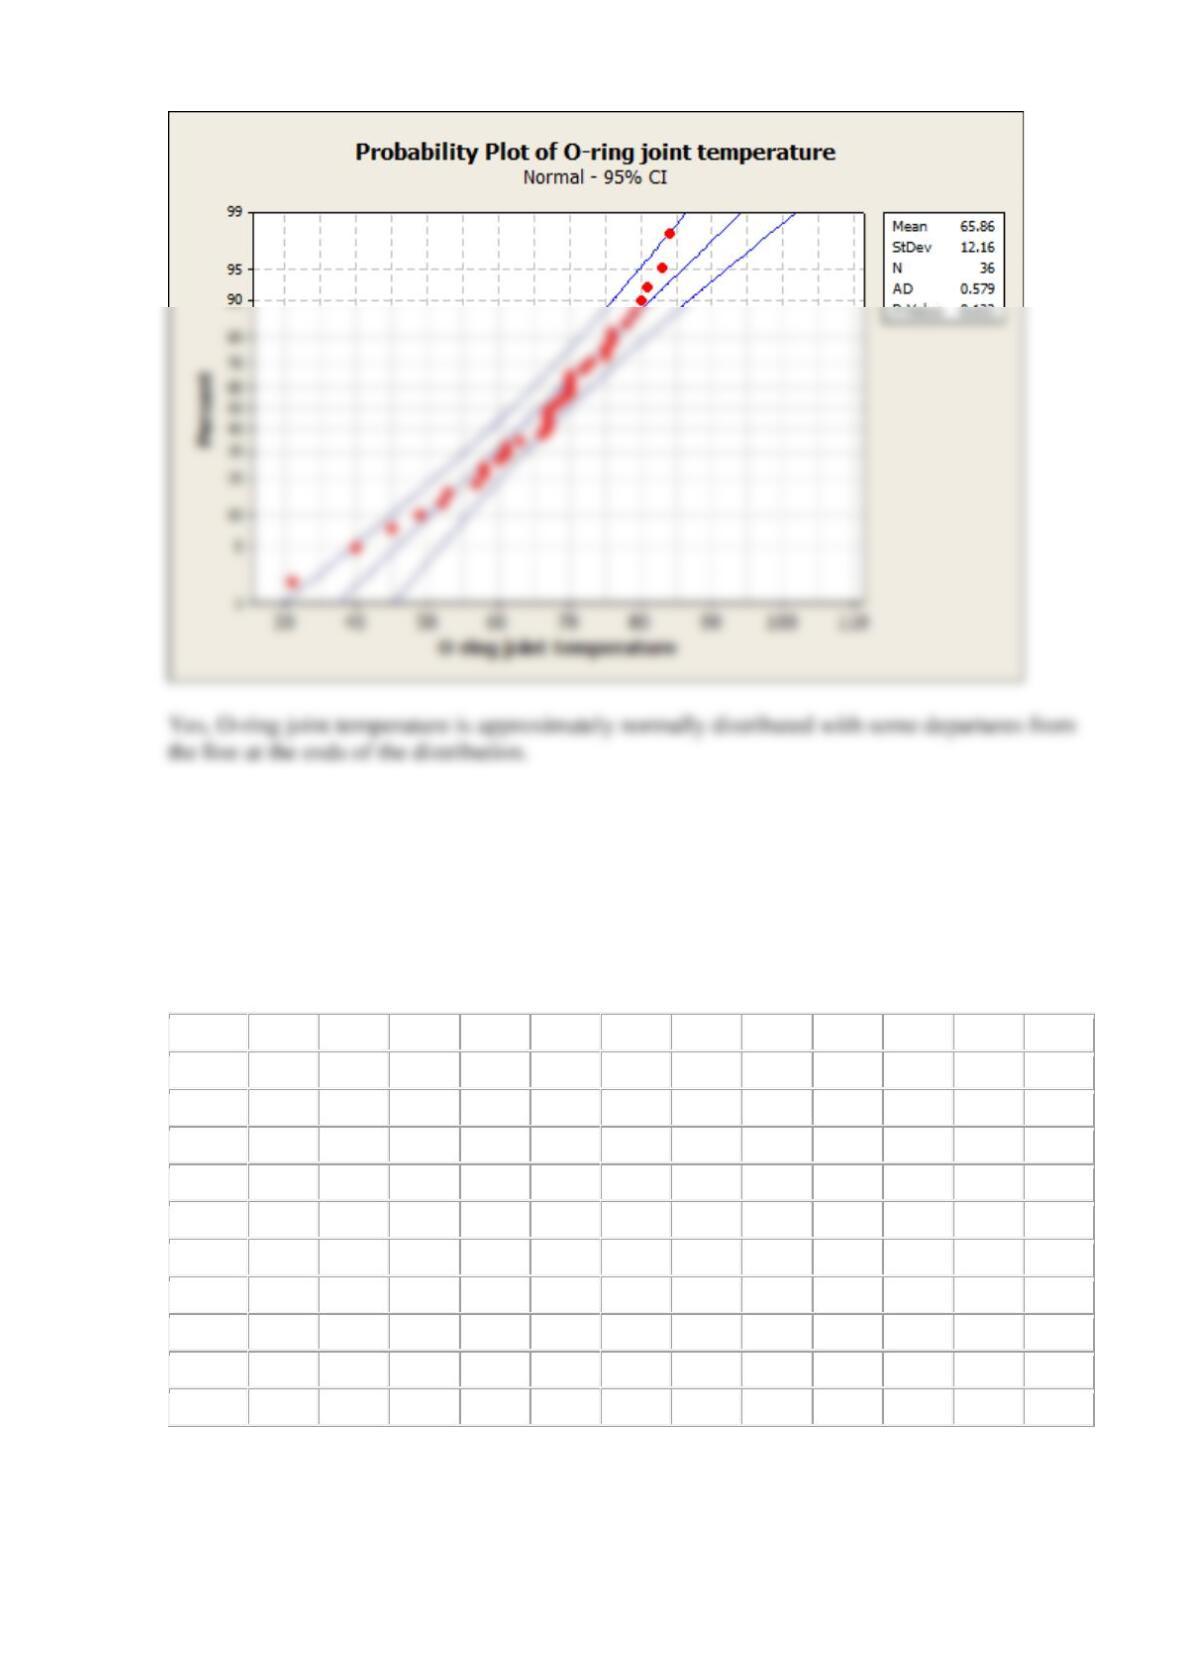
Does it seem reasonable to assume that O-ring joint temperature is normally distributed?
SOLUTION
Reserve Supplemental Exercises Chapter 6 Problem 1
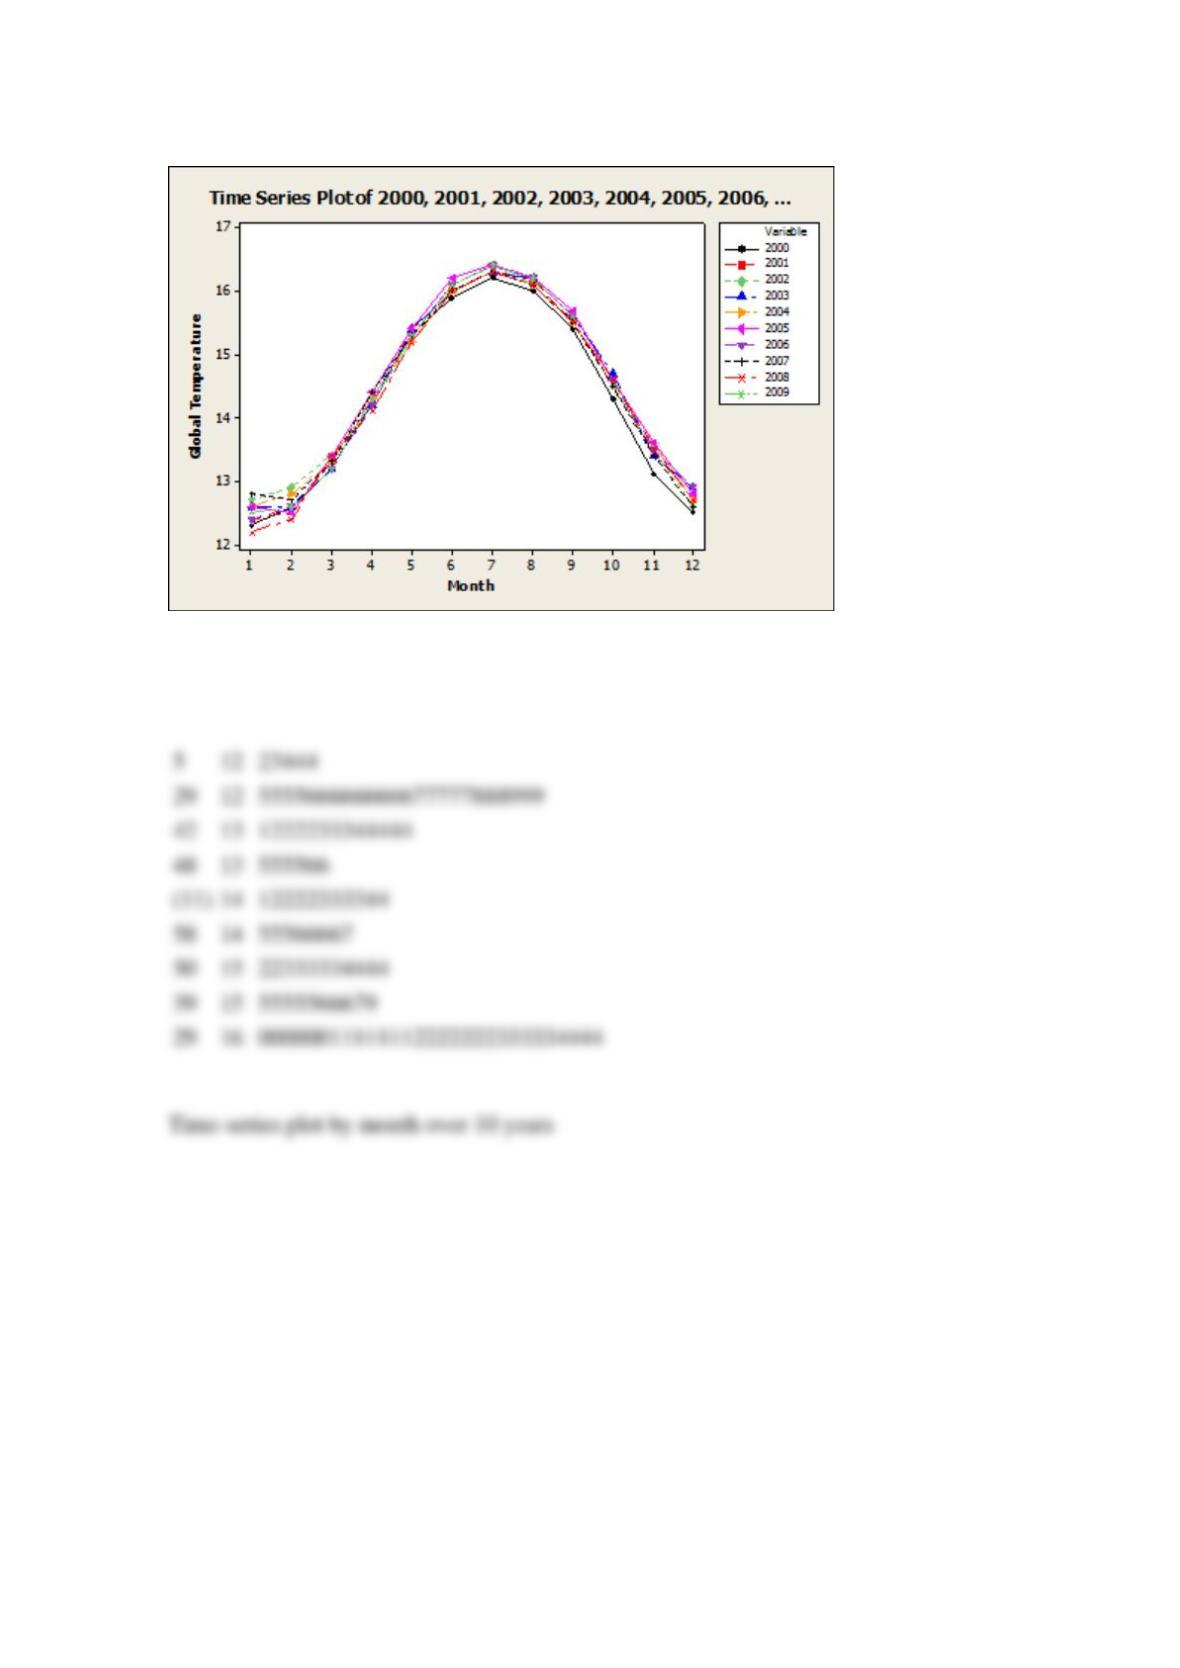
The National Oceanic and Atmospheric Administration provided the monthly absolute estimates
of global (land and ocean combined) temperature index (degrees C) from 2000. See the table
below. Construct and interpret either a digidot plot or a separate stem-and-leaf and time series
plot of these data.
Table. Global Monthly Temperature
Year
1
2
3
4
5
6
7
8
9
10
11
12
2000
12.3
12.6
13.2
14.3
15.3
15.9
16.2
16.0
15.4
14.3
13.1
12.5
2001
12.4
12.5
13.3
14.2
15.4
16.0
16.3
16.2
15.5
14.5
13.5
12.7
2002
12.7
12.9
13.4
14.2
15.3
16.1
16.4
16.1
15.5
14.5
13.5
12.6
2003
12.6
12.6
13.2
14.2
15.4
16.0
16.3
16.2
15.6
14.7
13.4
12.9
2004
12.6
12.8
13.3
14.3
15.2
16.0
16.3
16.1
15.5
14.6
13.6
12.7
2005
12.6
12.5
13.4
14.4
15.4
16.2
16.4
16.2
15.7
14.6
13.6
12.8
2006
12.4
12.6
13.2
14.2
15.3
16.1
16.4
16.2
15.6
14.6
13.5
12.9
2007
12.8
12.7
13.3
14.4
15.3
16.0
16.3
16.1
15.5
14.5
13.4
12.6
2008
12.2
12.4
13.4
14.1
15.2
16.0
16.3
16.1
15.5
14.6
13.5
12.7
2009
12.5
12.6
13.2
14.3
15.3
16.1
16.4
16.2
15.6
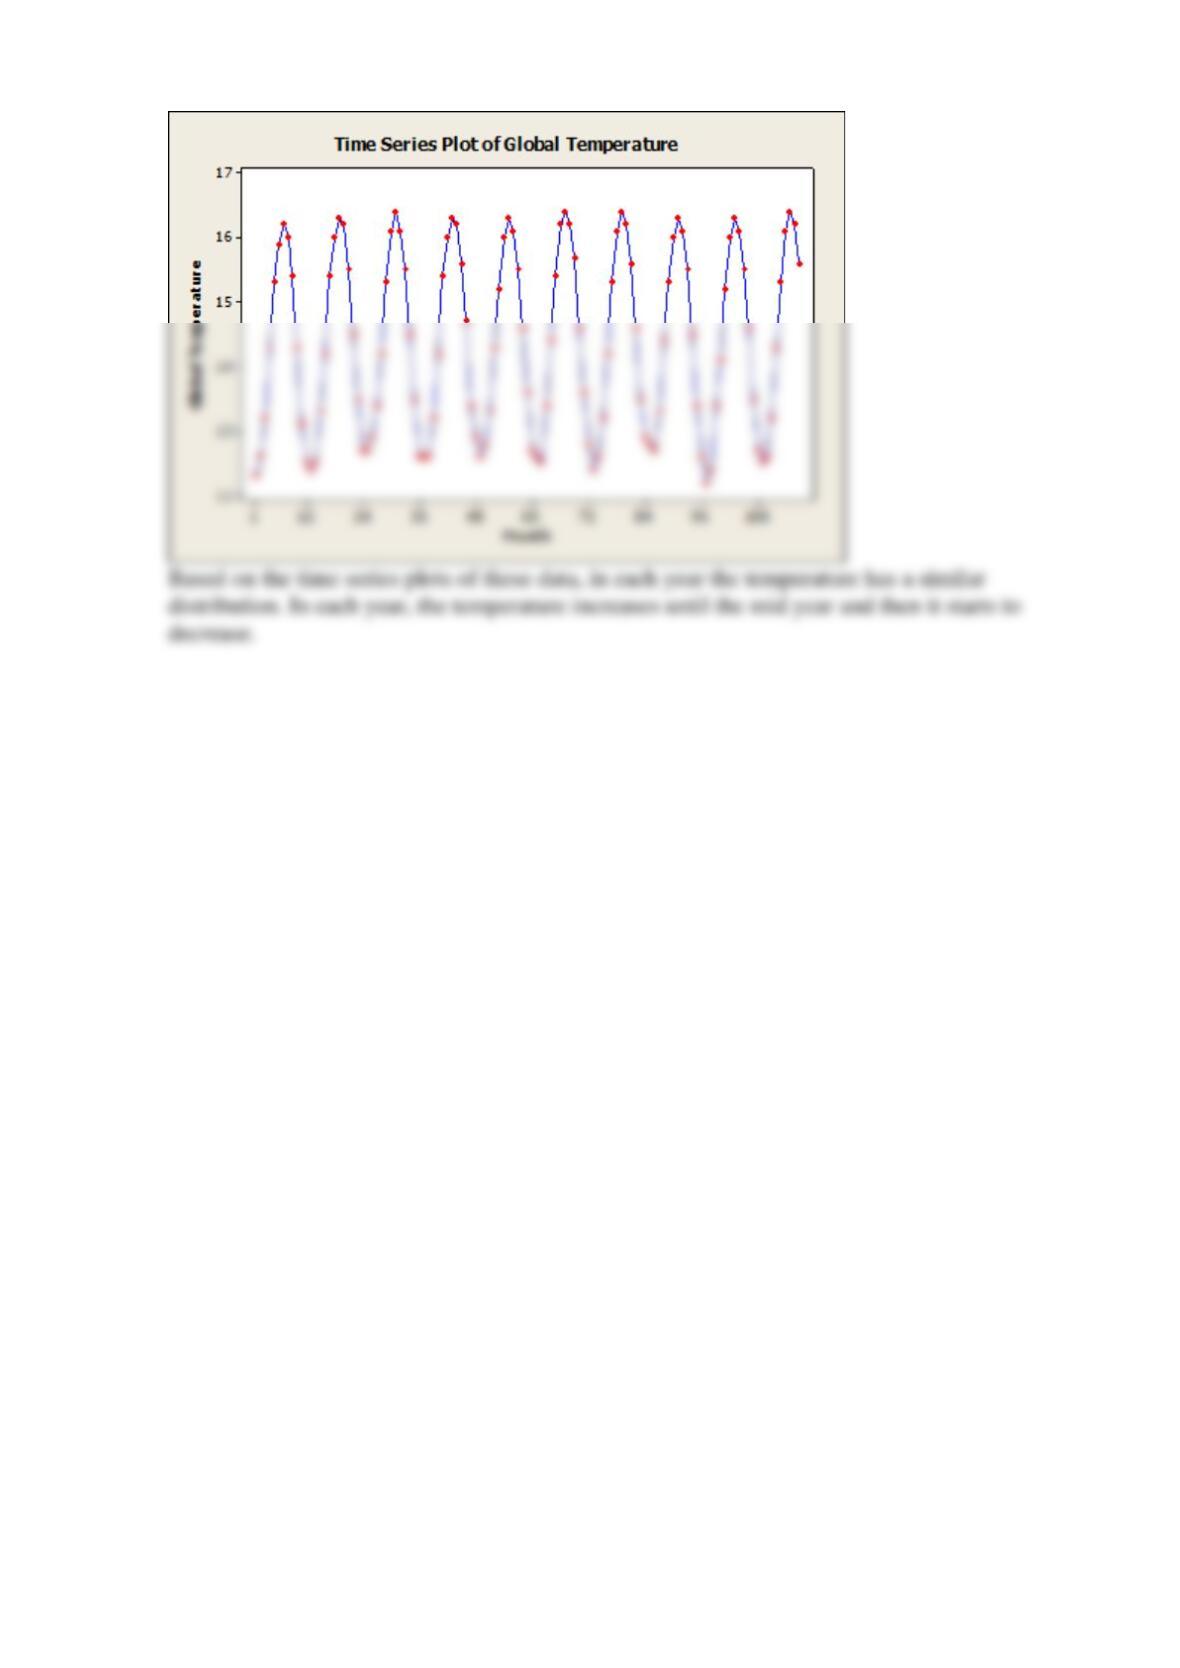
In each year the temperature has a _____ distribution. In each year, the temperature ______ until
the mid year and then it starts to ______.
SOLUTION
Stem-and-leaf of Global Temperature N = 117
Leaf Unit = 0.10
Reserve Supplemental Exercises Chapter 6 Problem 2
An article in Quality Engineering (1992, Vol. 4, pp. 487–495) presents viscosity data from a
batch chemical process. A sample of these data is in the table below.
13.3
14.3
14.9
15.2
15.8
14.2
16.0
14.0
14.5
16.1
13.7
15.2
13.7
16.9
14.9
14.4
15.3
13.1
15.2
15.9
15.1
14.9
13.6
13.7
15.3
15.5
14.5
16.5
13.4
15.2
15.3
13.8
14.3
12.6
15.3
14.8
14.1
14.4
14.3
15.6
14.8
14.6
15.6
15.1
14.8
15.2
15.6
14.5
15.2
14.3
15.8
17.0
14.3
14.6
16.1
12.8
14.5
15.4
13.3
14.9
14.3
16.4
13.9
16.1
14.6
15.2
14.1
14.8
16.4
14.2
15.2
16.6
14.1
16.8
15.4
14.0
16.9
15.7
14.4
15.6
Reading left to right and up to down, draw a time series plot of all the data and comment on any
features of the data that are revealed by this plot.
Consider the notion that the first 40 observations (the first 4 columns) were generated from a
specific process, whereas the last 40 observations were generated from a different process.
Does the plot indicate that the two processes generate similar results?
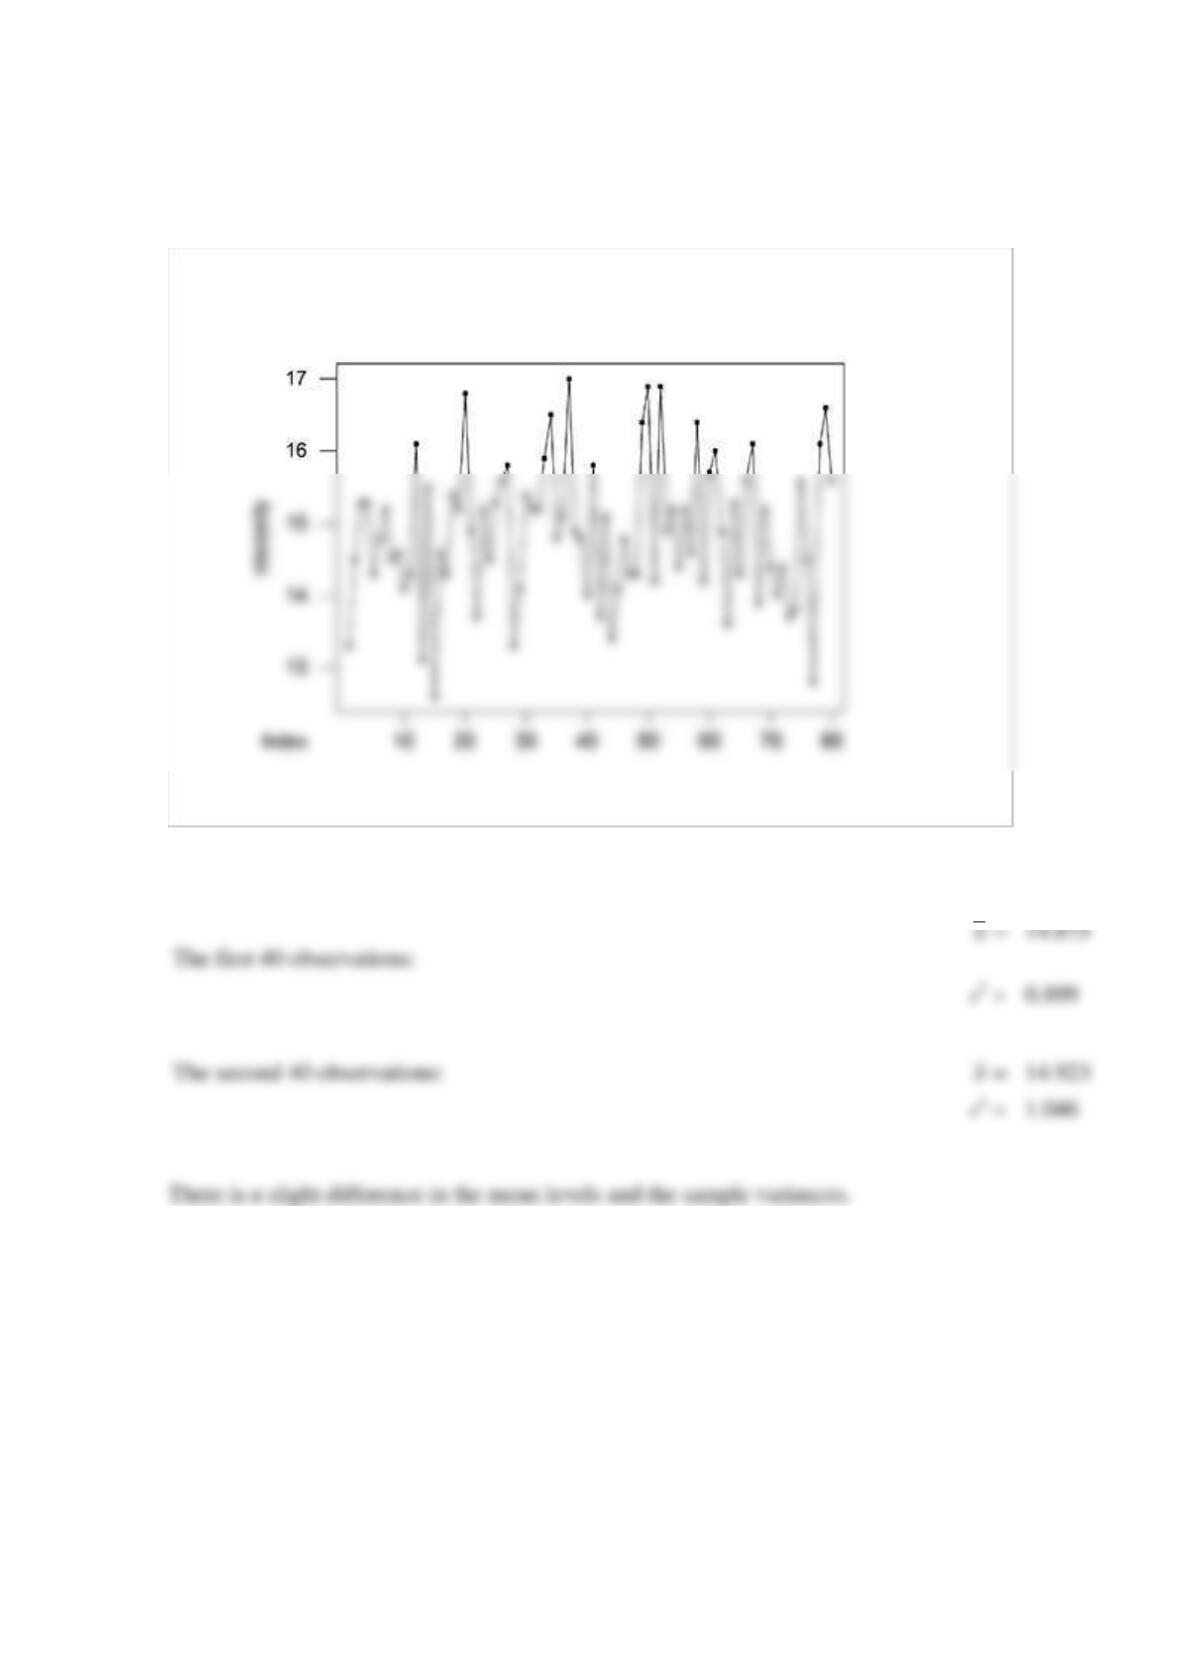
Calculate the sample mean and sample variance of the first 40 and the second 40 observations
SOLUTION
No, the mean of the second set of 40 data points appears to be slightly greater
than the mean of the first set of 40.
Reserve Supplemental Exercises Chapter 6 Problem 3
An article in Quality Engineering (1992, Vol. 4, pp. 487–495) presents viscosity data from a
batch chemical process. A sample of these data is in the table below.
13.3
14.3
14.9
15.2
15.8
14.2
16.0
14.0
14.5
16.1
13.7
15.2
13.7
16.9
14.9
14.4
15.3
13.1
15.2
15.9
15.1
14.9
13.6
13.7
15.3
15.5
14.5
16.5
13.4
15.2
15.3
13.8
14.3
12.6
15.3
14.8
14.1
14.4
14.3
15.6
14.8
14.6
15.6
15.1
14.8
15.2
15.6
14.5
15.2
14.3
15.8
17.0
14.3
14.6
16.1
12.8
14.5
15.4
13.3
14.9
14.3
16.4
13.9
16.1
14.6
15.2
14.1
14.8
16.4
14.2
15.2
16.6
14.1
16.8
15.4
14.0
16.9
15.7
14.4
15.6
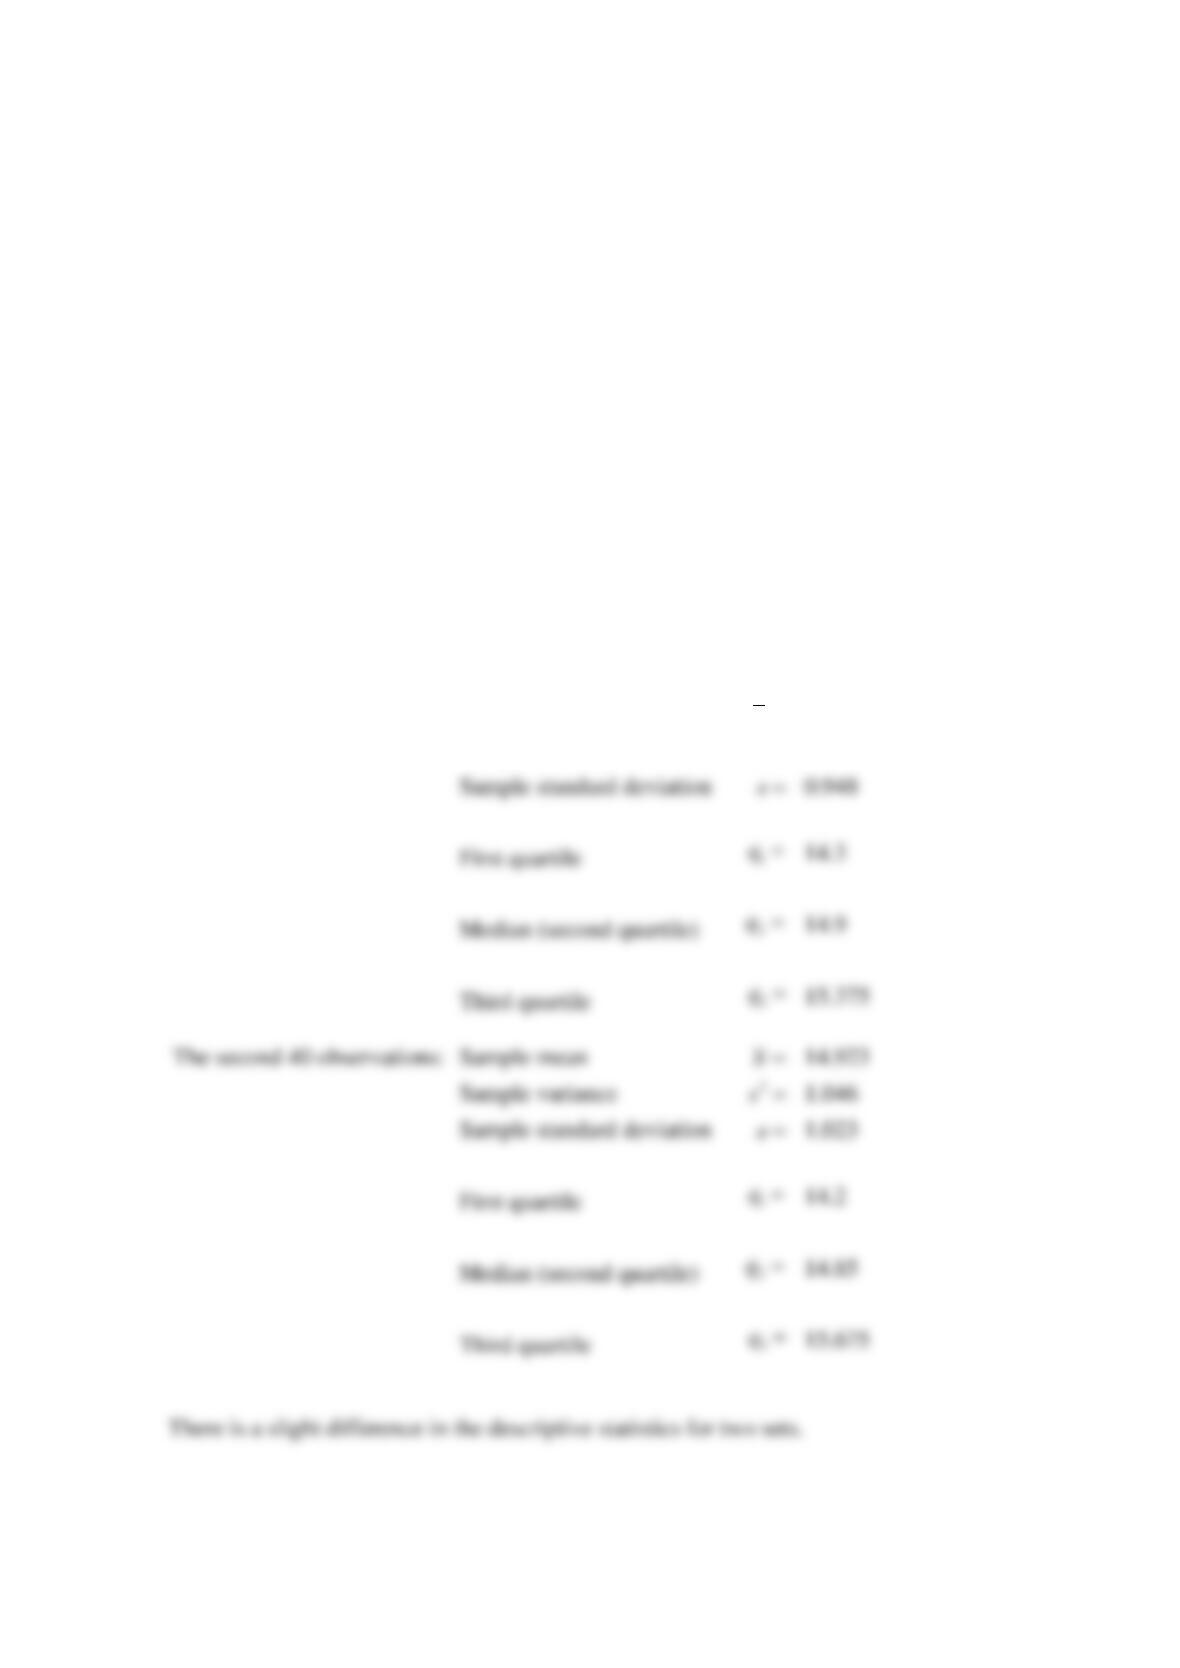
Use the data above to calculate the descriptive statistics for two groups of observations: the first
40 observations (the first 4 columns) and the last 40.
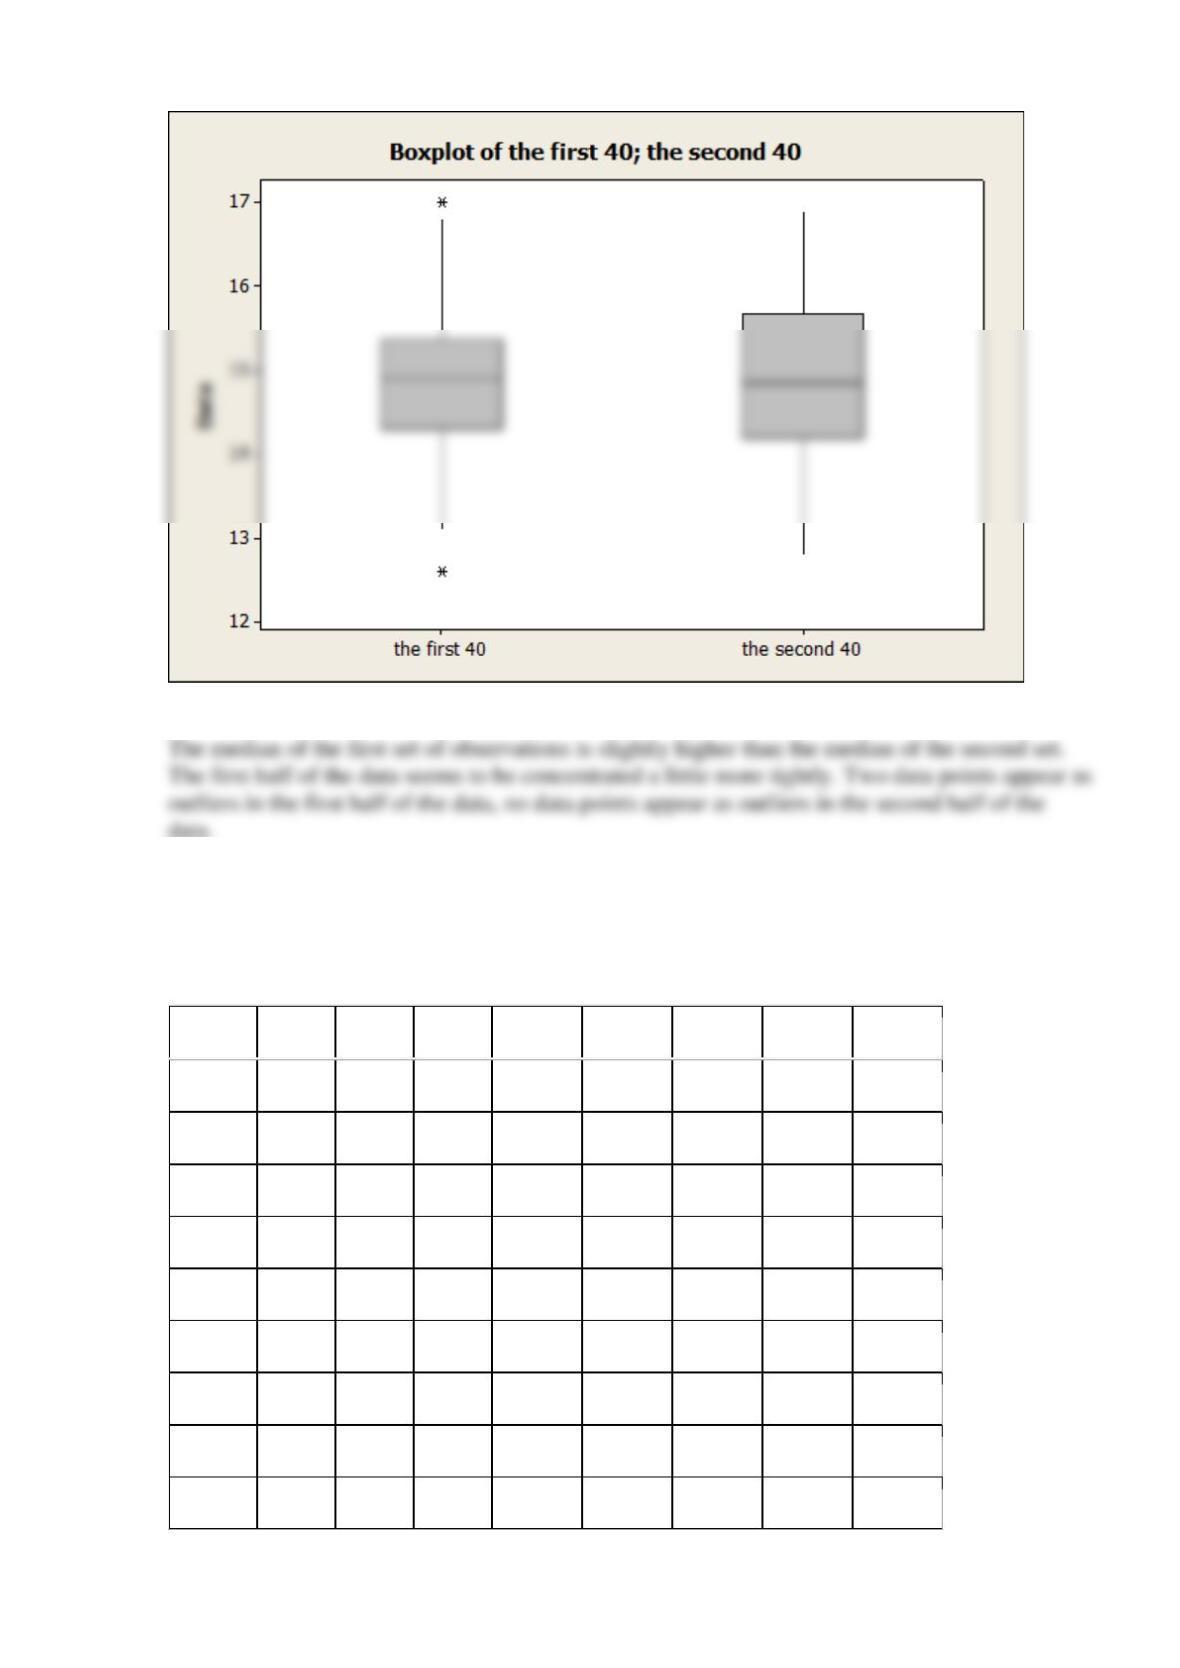
Prepare comparative box plots for two groups of observations:
The median of the first set of observations is _____ the median of the second set. The ___ half of
the data seems to be concentrated a little more tightly. ____ data point(s) appear(s) as outliers in
the first half of the data, ____ data point(s) appear(s) as outliers in the second half of the data.
SOLUTION
The first 40 observations:
Sample mean
x=
14.875
Sample variance
2
s=
0.899
Sample standard deviation
0.948
First quartile
Median (second quartile)
Third quartile
The second 40 observations:
Sample mean
x=
14.923
Sample variance
1.046
Sample standard deviation
1.023
First quartile
Median (second quartile)
Third quartile
Reserve Supplemental Exercises Chapter 6 Problem 4
The data shown in the table are monthly champagne sales in France (1962–1969) in thousands of
bottles.
Month
1962
1963
1964
1965
1966
1967
1968
1969
Jan.
2.851
2.541
3.113
5.375
3.633
4.016
2.639
3.934
Feb.
2.672
2.475
3.006
3.088
4.292
3.957
2.899
3.162
Mar.
2.755
3.031
4.047
3.718
4.154
4.510
3.370
4.286
Apr.
2.721
3.266
3.523
4.514
4.121
4.276
3.740
4.676
May
2.946
3.776
3.937
4.520
4.647
4.968
2.927
5.010
June
3.036
3.230
3.986
4.539
4.753
4.677
3.986
4.874
July
2.282
3.028
3.260
3.663
3.965
3.523
4.217
4.633
Aug.
2.212
1.759
1.573
1.643
1.723
1.821
1.738
1.659
Sept.
2.922
3.595
3.528
4.739
5.048
5.222
5.221
5.591
Oct.
4.301
4.474
5.211
5.428
6.922
6.873
6.424
6.981
Nov.
5.764
6.838
7.614
8.314
9.858
10.803
9.842
9.851
Dec.
7.132
8.357
9.254
10.651
11.331
13.916
13.076
12.670
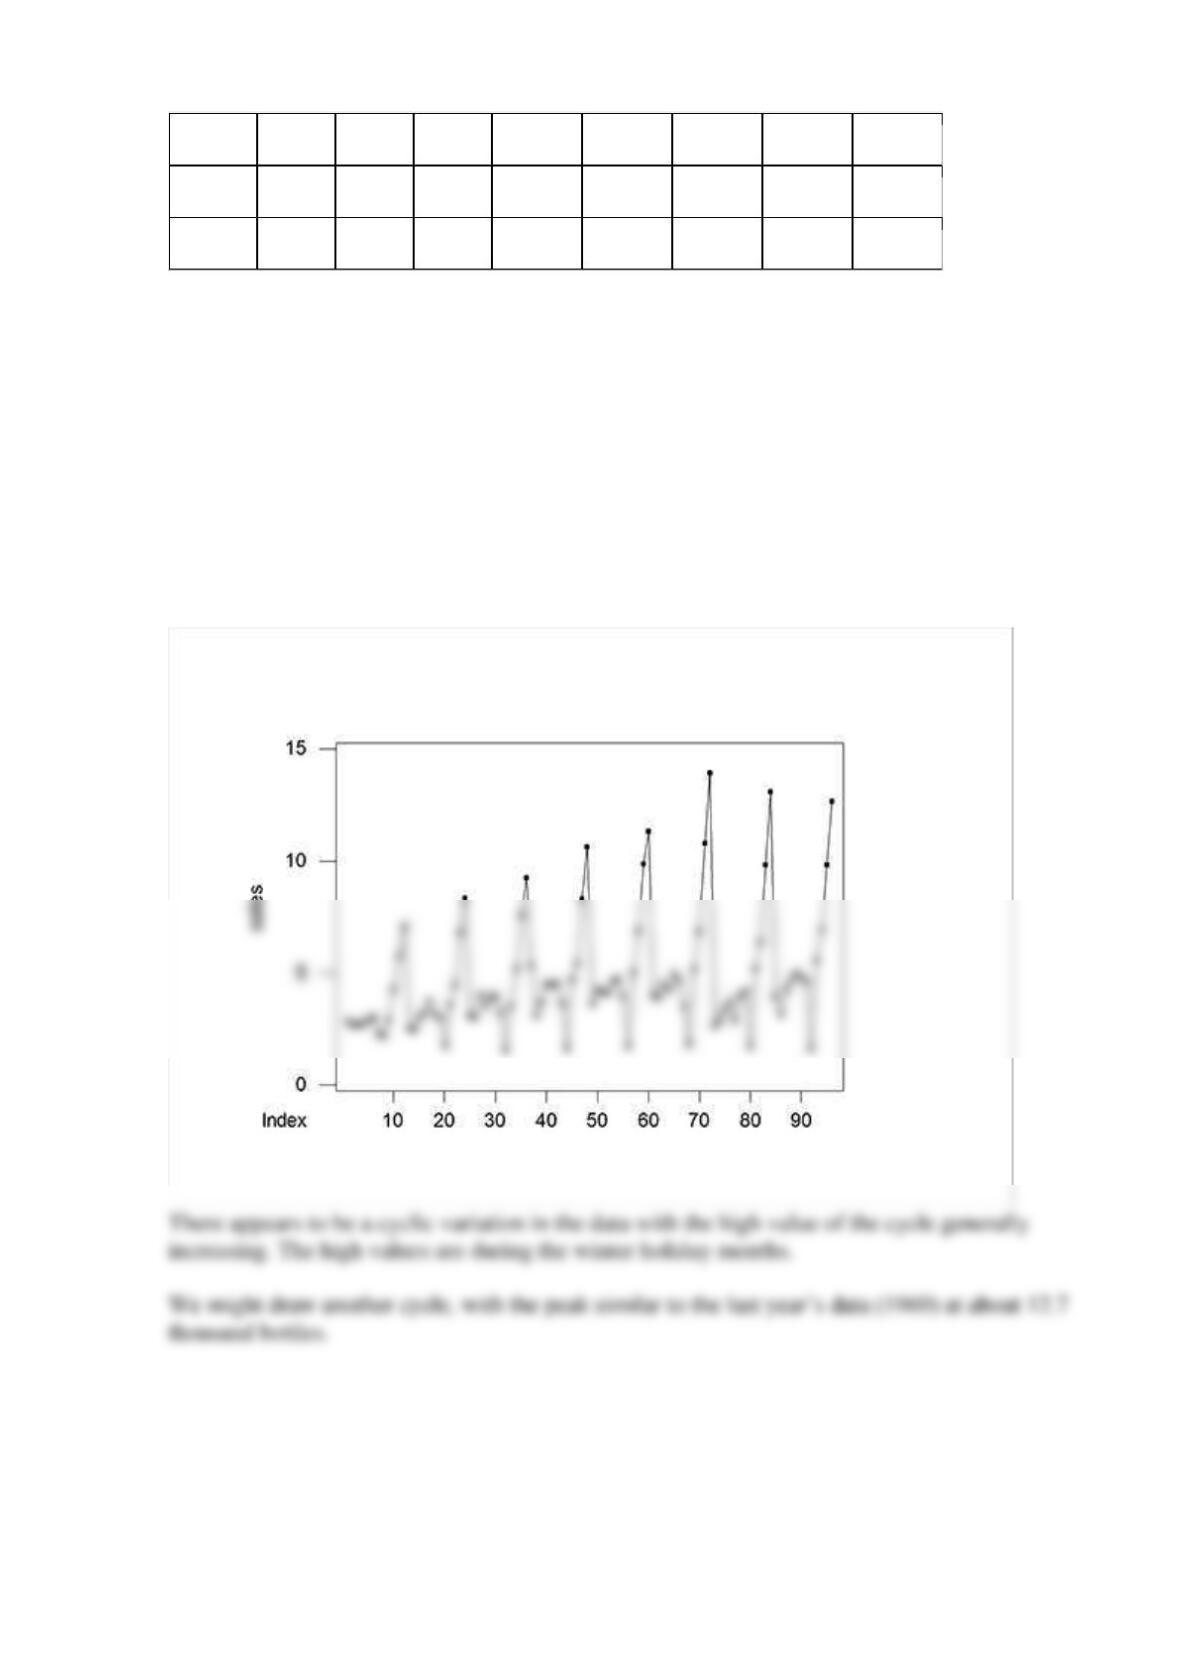
Construct a time series plot of the data and comment on any features of the data that reveals by
this plot.
There appears to be a ____ variation in the data with the highest value of the year _____. The
high values are during the _______.
Speculate on how you would use a graphical procedure to forecast monthly champagne sales for
the year 1970.
SOLUTION
Reserve Supplemental Exercises Chapter 6 Problem 5
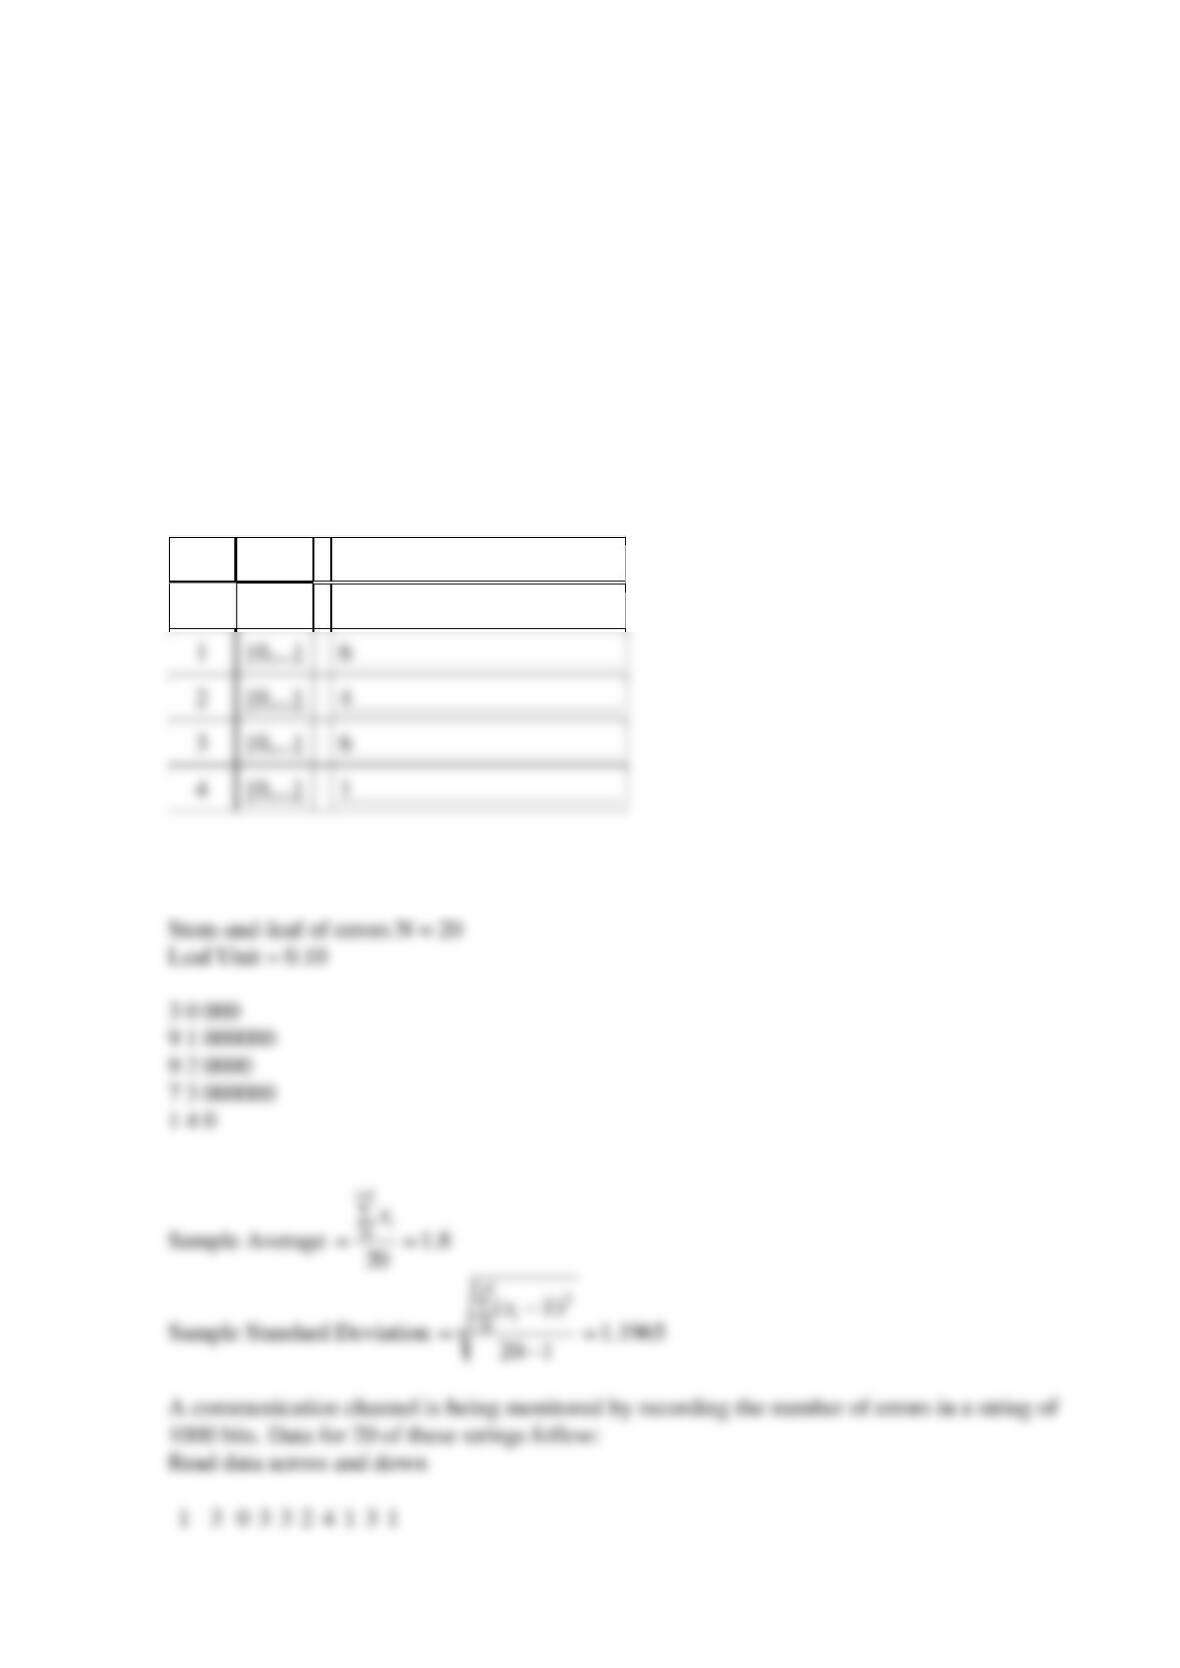
A communication channel is being monitored by recording the number of errors in a string of
1000 bits. Data for 20 of these strings follow:
1
3
0
3
3
2
4
1
3
1
1
1
2
3
3
2
0
2
0
1
Fill the cells of the stem-and-leaf plot of the data with the number of zeros in the sequences. Leaf
unit is equal to 0.10.
Find the sample average and standard deviation.
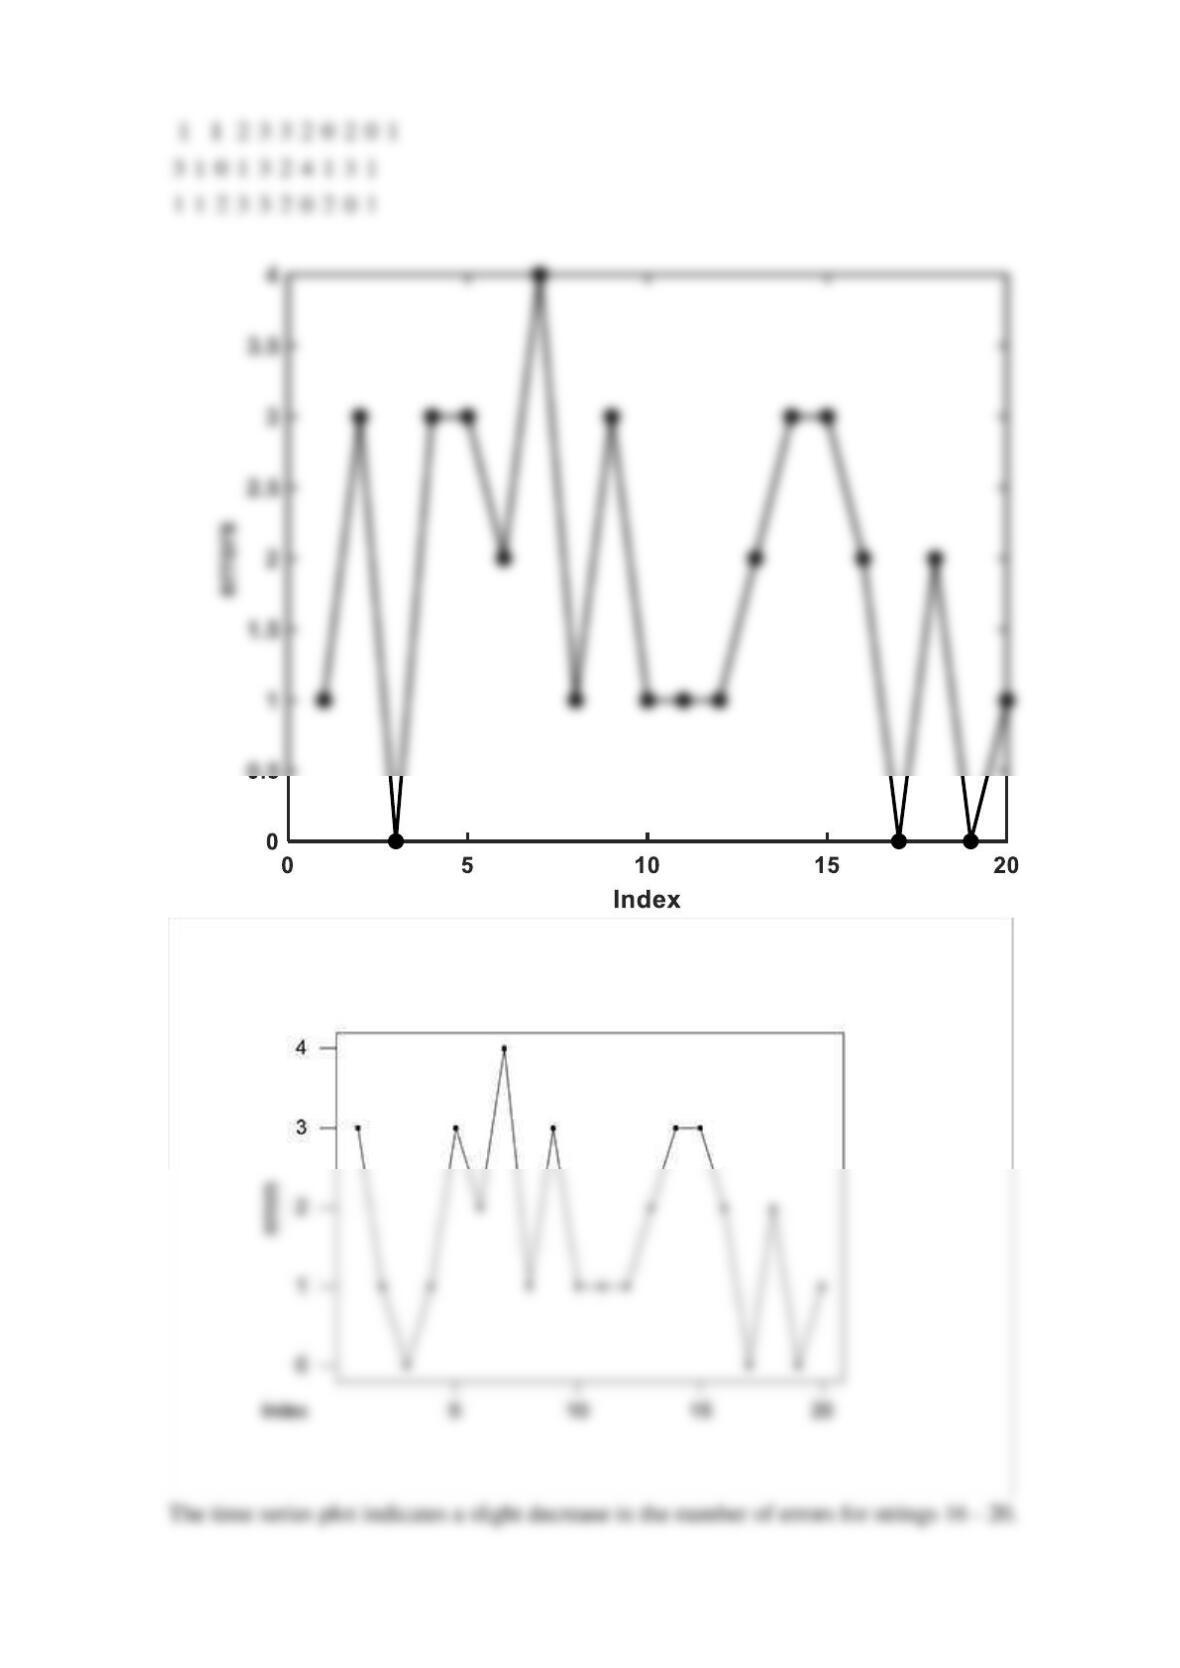
Construct a time series plot of the data. Is there evidence that there was an increase or decrease
in the number of errors in a string?
SOLUTION
Stem
Leaf
Number of zeros in sequence
0
{0,…}
3
Computer-generated stem-and-leaf diagram is
Reserve Supplemental Exercises Chapter 6 Problem 6
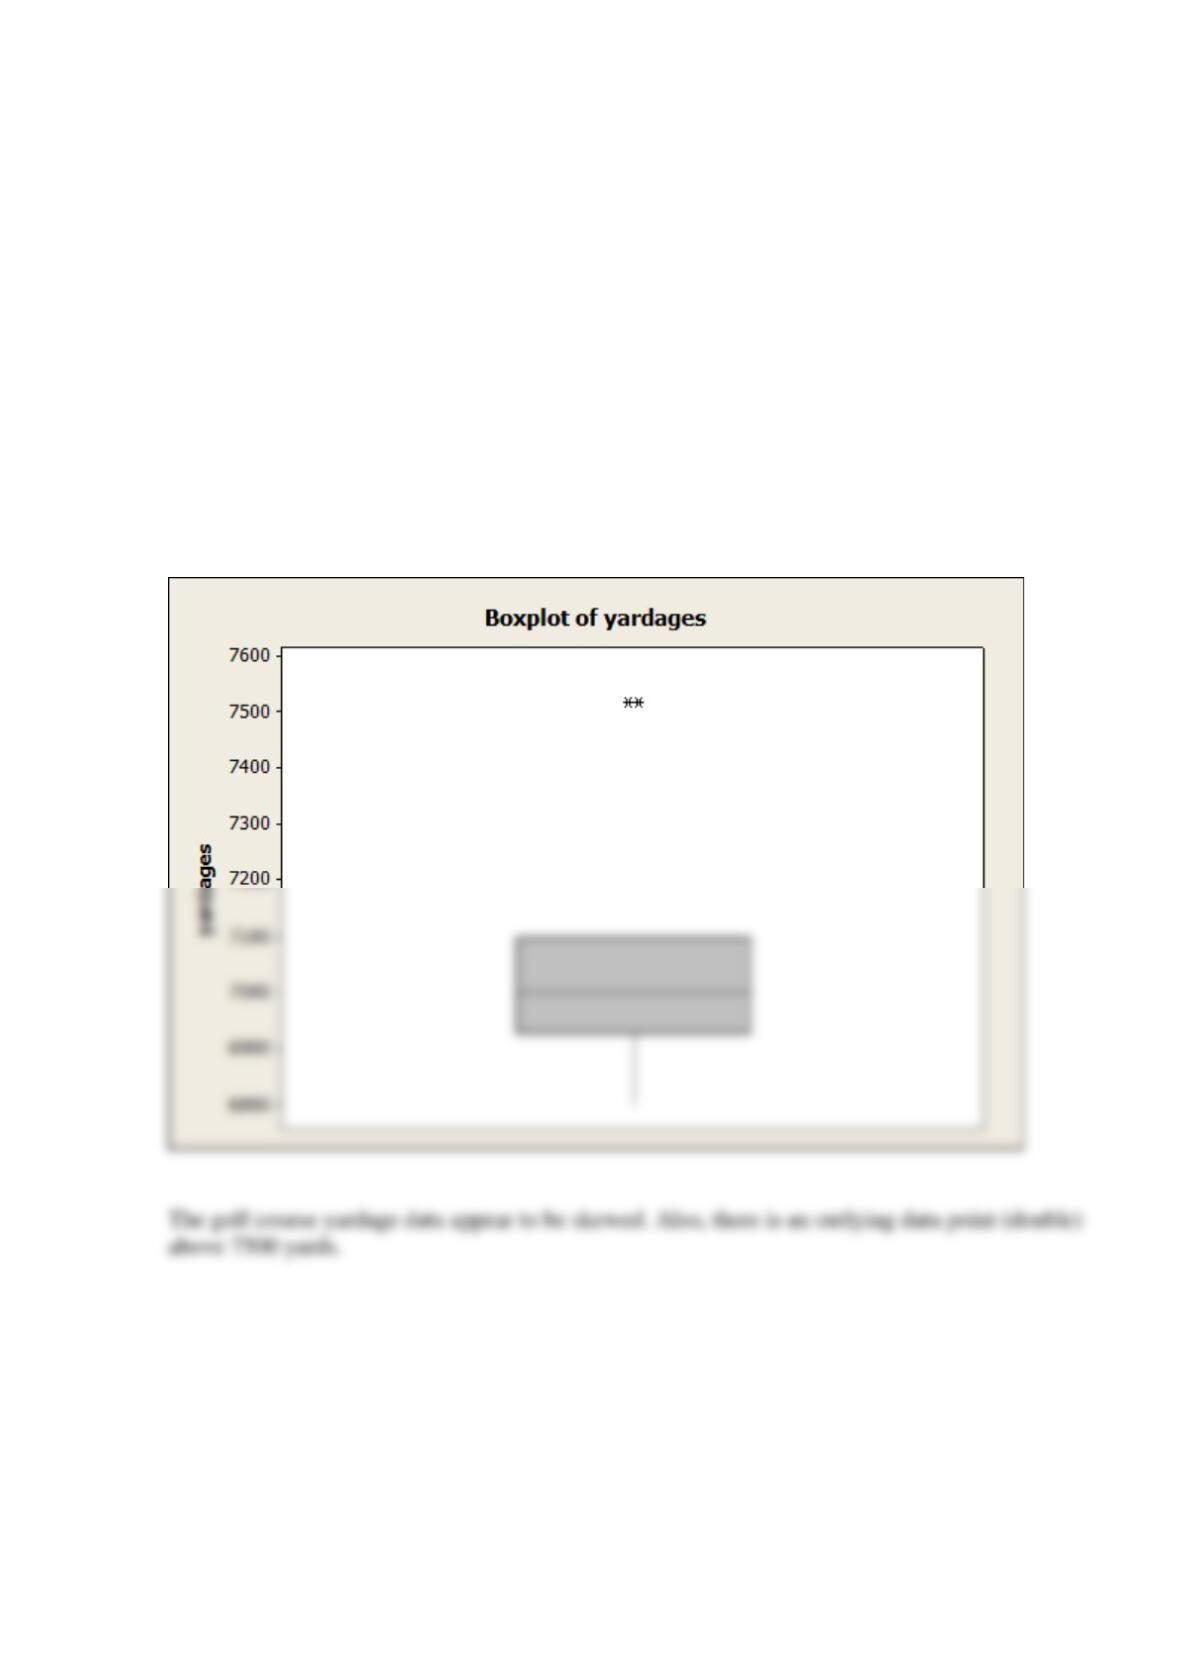
The January 1990 issue of Arizona Trend contains a supplement describing the 12 “best” golf
courses in the state. The yardages (lengths) of these courses are as follows: 6981, 7099, 6930,
6992, 7518, 7100, 6935, 7518, 7013, 6800, 7041, and 6890.
Use the data above to calculate the descriptive statistics for the golf course yardage data.
Construct a box plot of the yardages and fill the blanks in the interpretation of the plot.
The golf course yardage data appear to be _____. Also, there ____ outlying data point(s) ____.
SOLUTION
Reserve Supplemental Exercises Chapter 6 Problem 7
An article in Quality Engineering (1992, Vol. 4, pp. 487–495) presents viscosity data from a
batch chemical process. A sample of these data is in the table below.
13.3
14.3
14.9
15.2
15.8
14.2
16.0
14.0
14.5
16.1
13.7
15.2
13.7
16.9
14.9
14.4