C
D
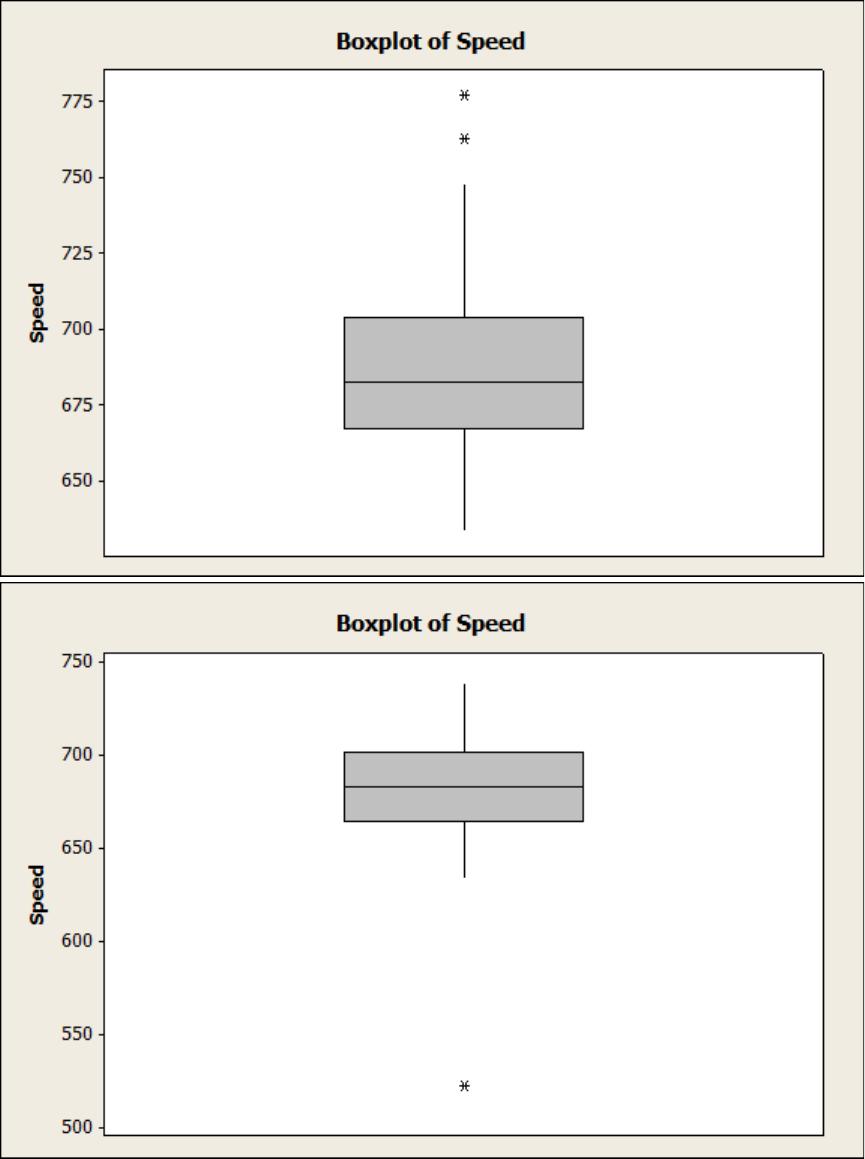
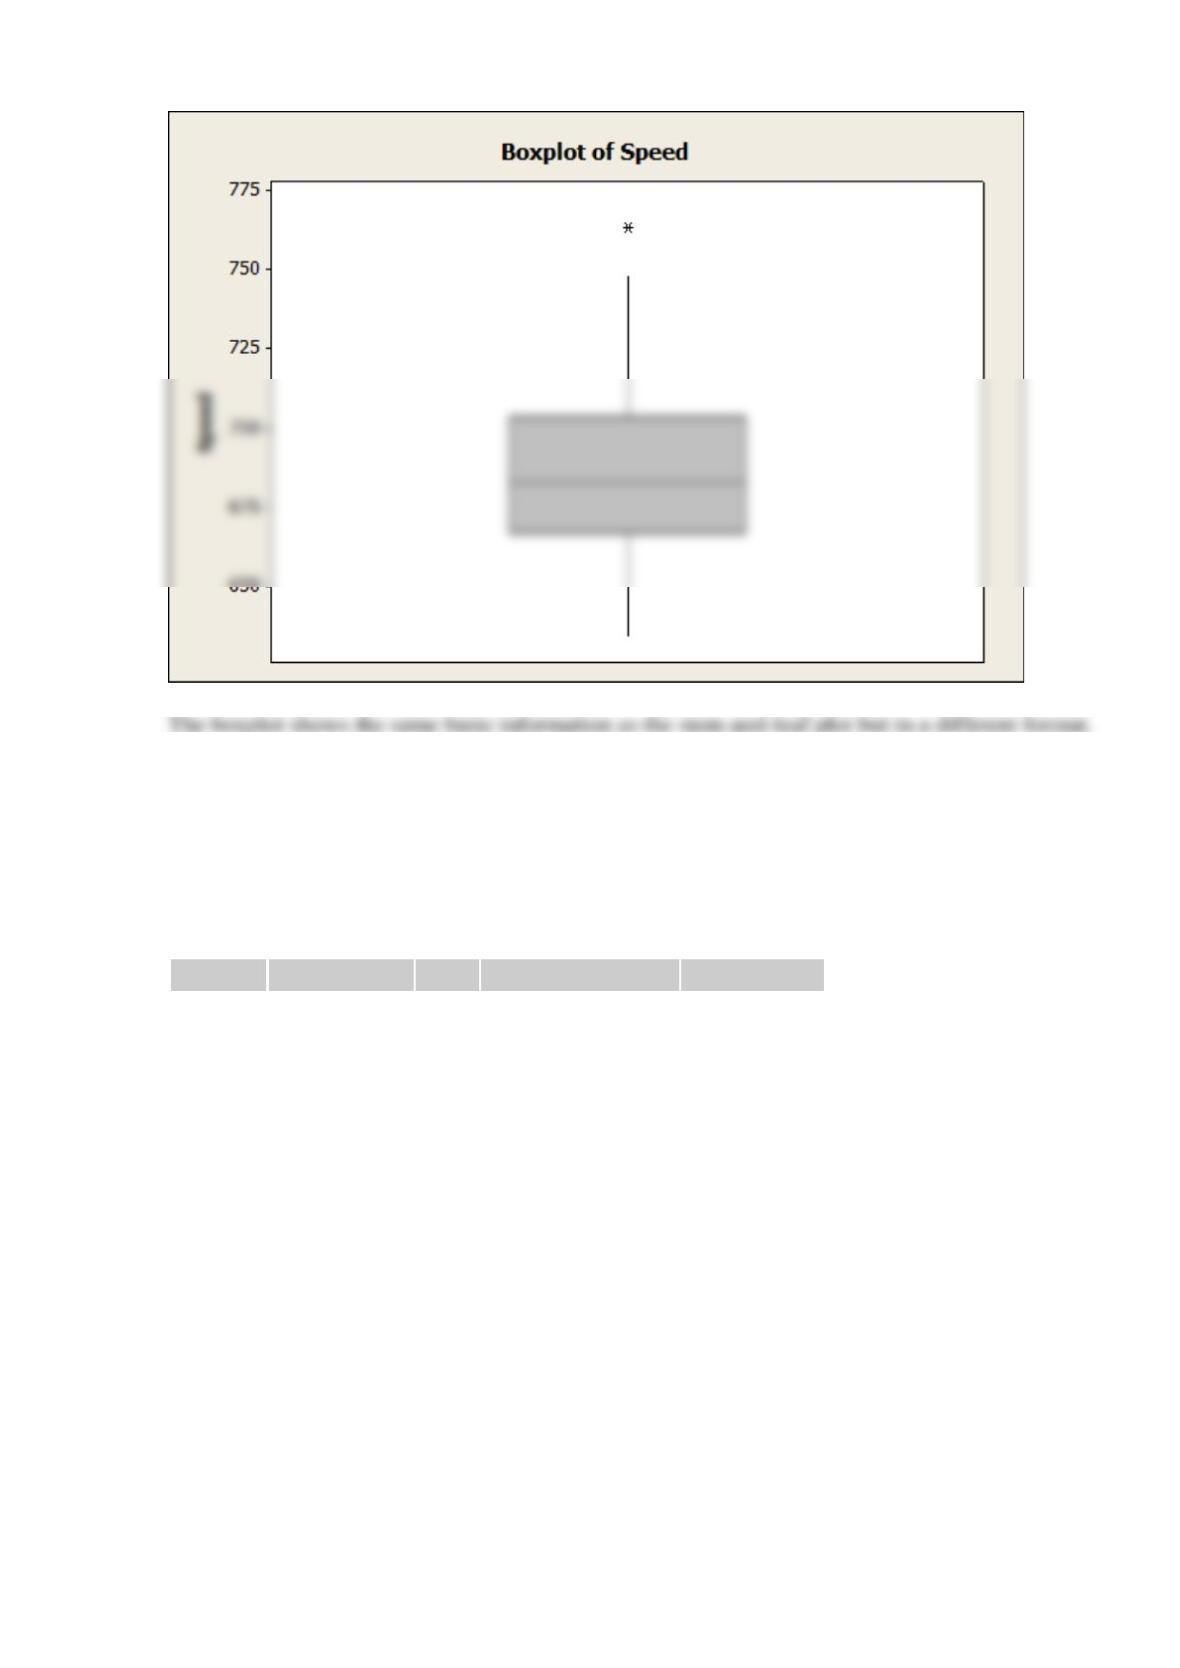
How does the boxplot compare in interpretive value to the original stem-and-leaf diagram?
SOLUTION
Reserve Problems Chapter 6 Section 6 Problem 1
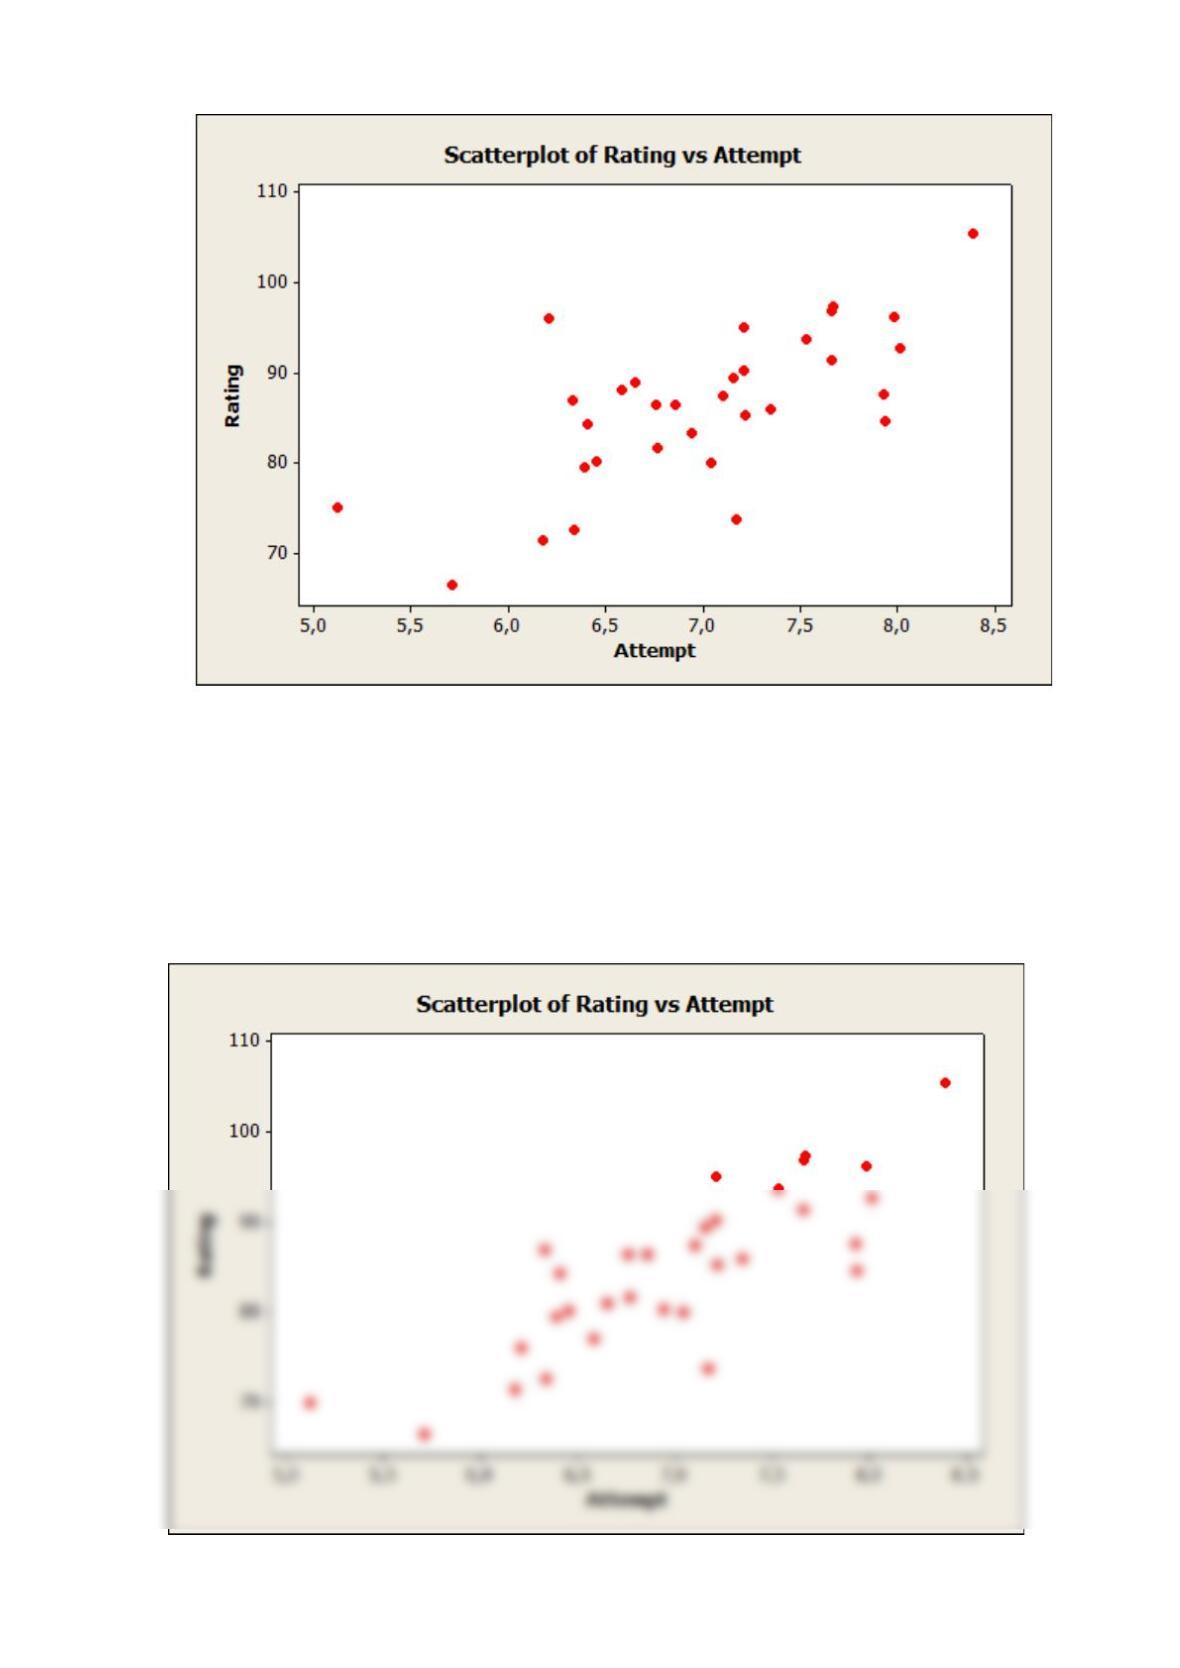
The following table presents data on the ratings of quarterbacks for the 2008 National Football
league season (source: The Sports Network). It is suspected that the rating (y) is related to the
average number of yards gained per pass attempt (x).
Player
Team
Yards per Attempt
Rating Points
Philip
Rivers
SD
8.39
105.5
Chad
Pennington
MIA
7.67
97.4
Kurt
Warner
ARI
7.66
96.9
Drew
Brees
NO
7.98
96.2
Peyton
Manning
IND
7.21
95
Aaron
Rodgers
GB
7.53
93.8
Matt
Schaub
HOU
8.01
92.7
Tony
Romo
DAL
7.66
91.4
Jeff
Garcia
TB
7.21
90.2
Matt
Cassel
NE
7.16
89.4
Matt
Ryan
ATL
7.93
87.7
Shaun
Hill
SF
7.10
87.5
Seneca
Wallace
SEA
6.33
87
Eli
Manning
NYG
6.76
86.4
Donovan
McNabb
PHI
6.86
86.4
Jay
Cutler
DEN
7.35
86
Trent
Edwards
BUF
7.22
85.4
Jake
Delhomme
CAR
7.94
84.7
Jason
Campbell
WAS
6.41
84.3
David
Garrard
JAC
6.77
81.7
Brett
Favre
NYJ
6.65
81
Joe
Fiacco
BAL
6.94
80.3
Kerry
Collins
TEN
6.45
80.2
Ben
Roethlisberger
PIT
7.04
80.1
Kyle
Orton
CHI
6.39
79.6
JaMarcus
Russel
OAK
6.58
77.1
Tyler
Thigpen
KC
6.21
76
Gus
Freotte
MIN
7.17
73.7
Dan
Orlovsky
DET
6.34
72.6
Marc
Bulger
STL
6.18
71.4
Ryan
Fitzpatrick
CIN
5.12
70
Derek
Anderson
CLE
5.71
66.5
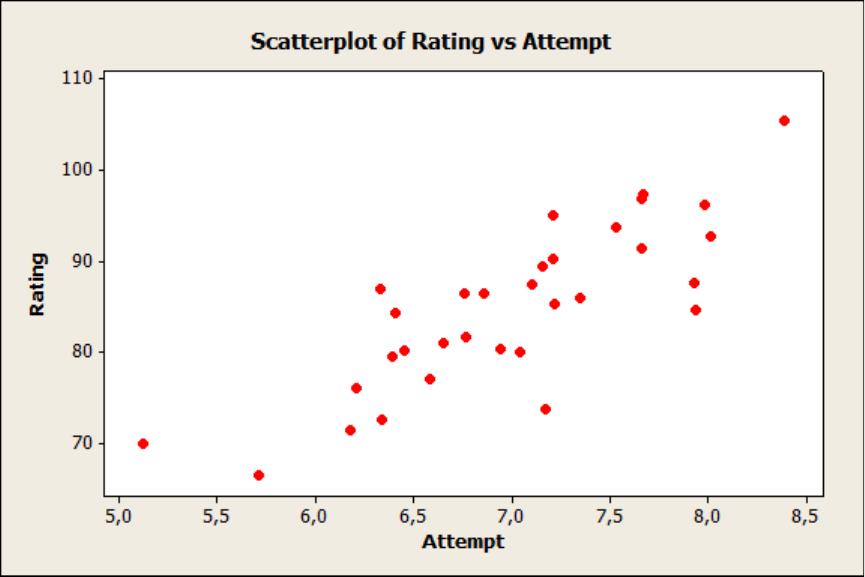
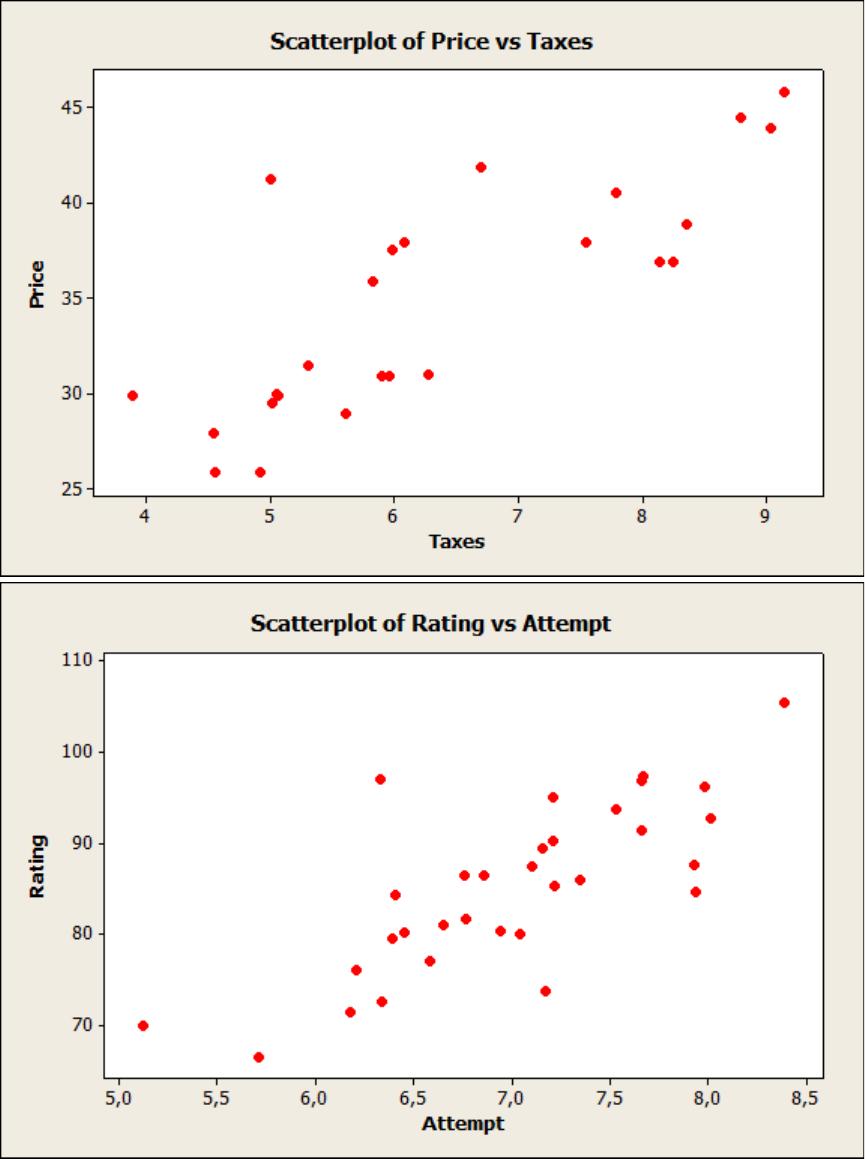
(a) Select the correct scatterplot.
A
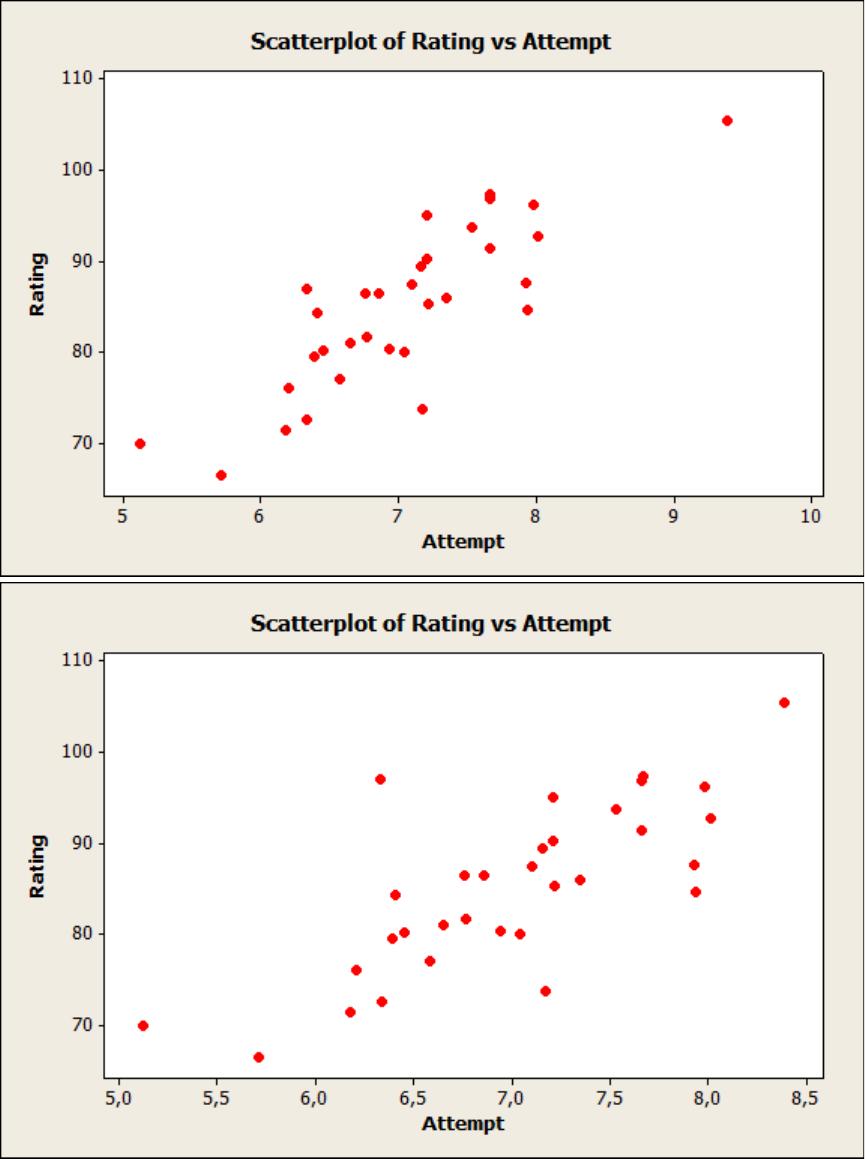
B
C
D
(b) Comment on the suspicion that rating is related to yards per attempt.
(c) What is the simple correlation coefficient between these two variables?
SOLUTION
(a)

(b)
Reserve Problems Chapter 6 Section 6 Problem 2
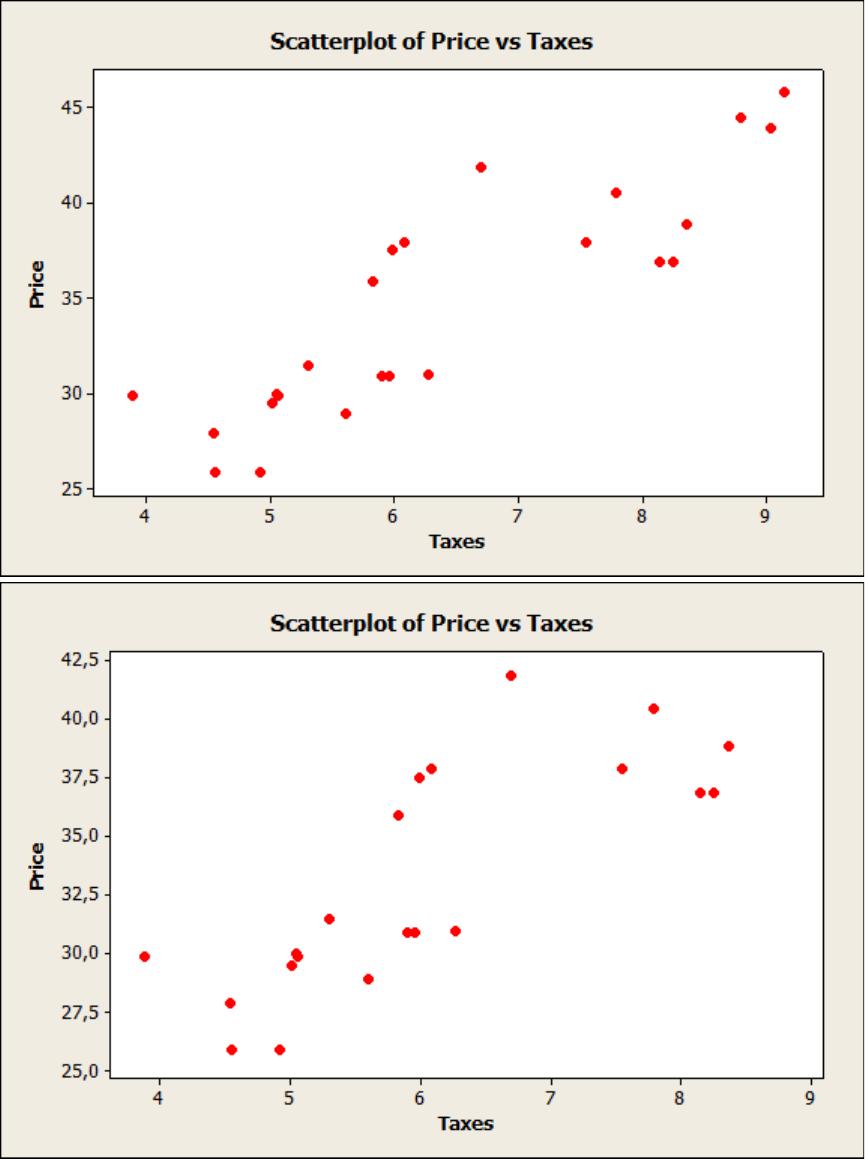
An article in Technometrics by S. C. narula and J. F. Wellington [“Prediction, Linear Regression,
and a Minimum Sum of Relative Errors” (1977, Vol. 19)] presents data on the selling price and
annual taxes for 24 houses. The data are shown in the following table.
Sale
Price/1000
Taxes (local,
school,
country)/1000
Sale
Price/1000
Taxes (local,
school,
country)/1000
25.9
4.9176
30.0
5.0500
29.5
5.0208
36.9
8.2464
27.9
4.5429
41.9
6.6969
25.9
4.5573
40.5
7.7841
29.9
5.0597
43.9
9.0384
29.9
3.8910
37.5
5.9894
30.9
5.8980
37.9
7.5422
28.9
5.6039
44.5
8.7951
35.9
5.8282
37.9
6.0831
31.5
5.3003
38.9
8.3607
31.0
6.2712
36.9
8.1400
30.9
5.9592
45.8
9.1416
(a) Select the correct scatterplot.
A
B
C
D
(b) Comment on the widely held belief that price is related to taxes paid.
(c) What is the simple correlation coefficient between these two variables?
SOLUTION
(a)
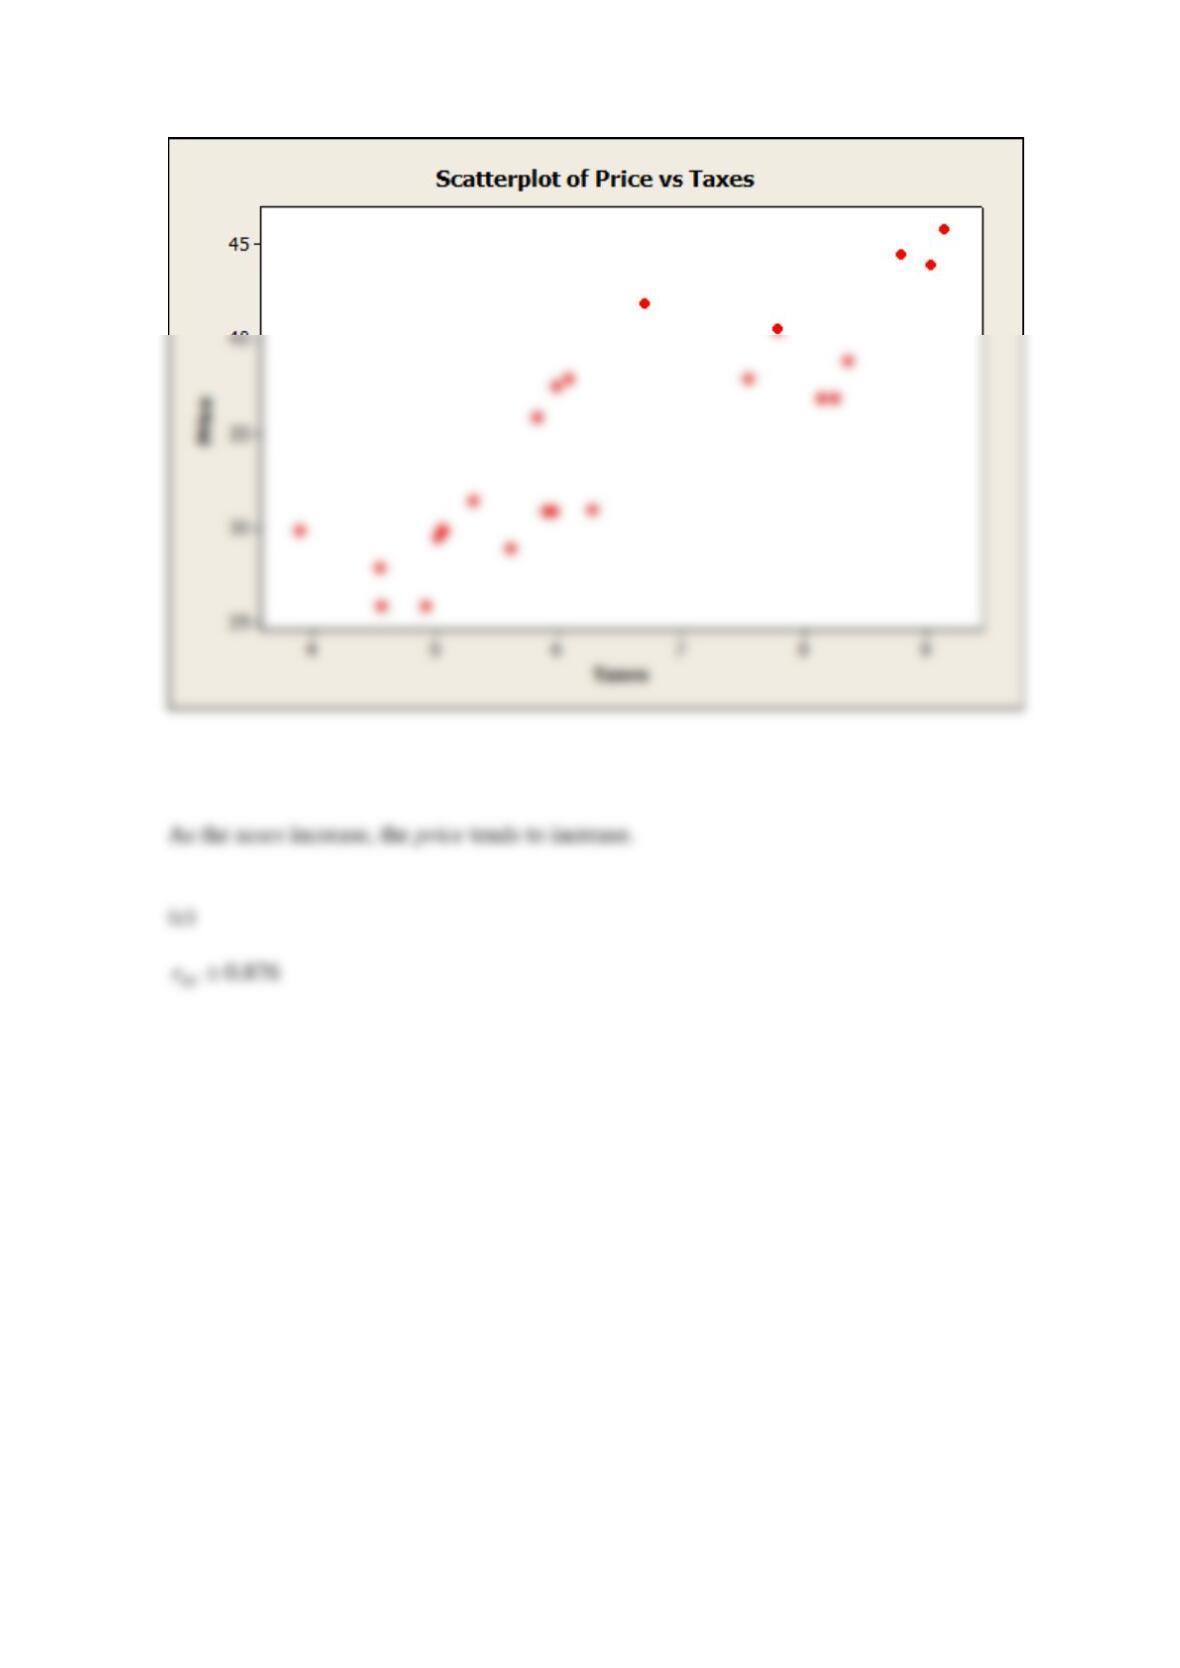
(b)
Reserve Problems Chapter 6 Section 7 Problem 1
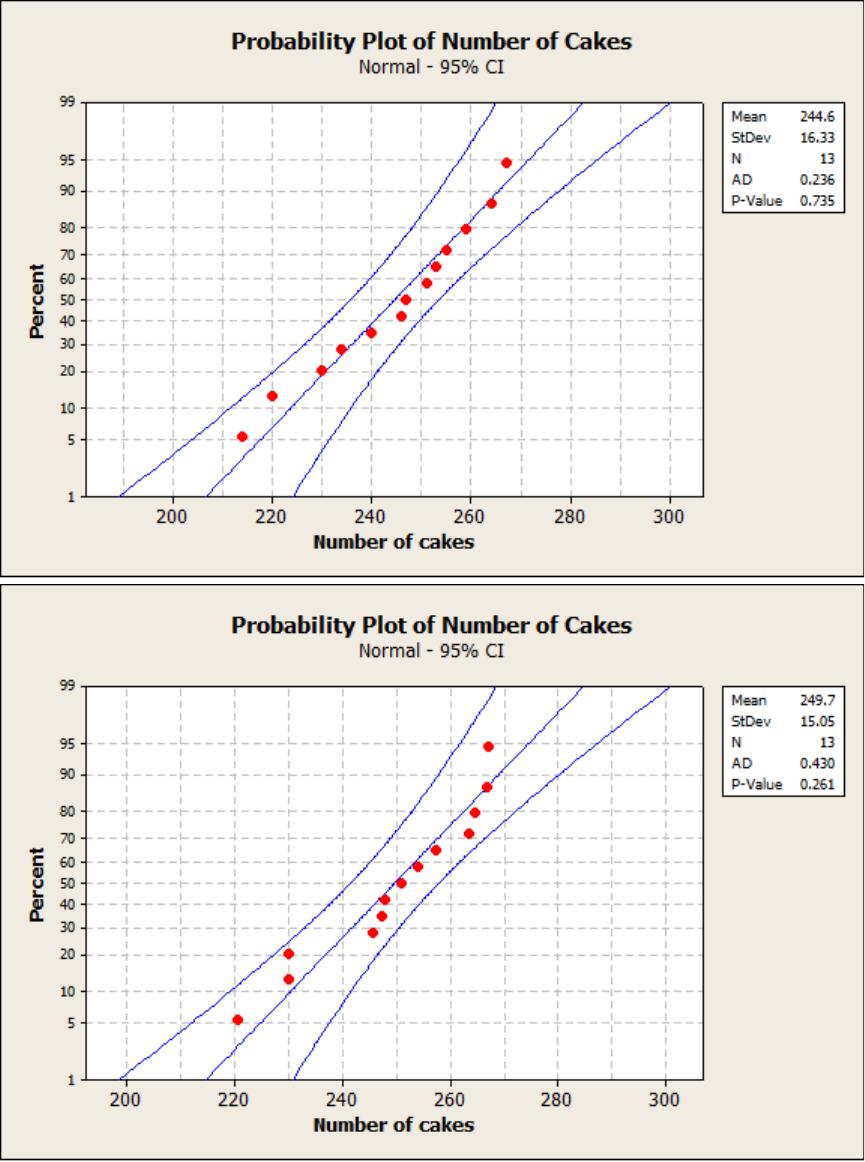
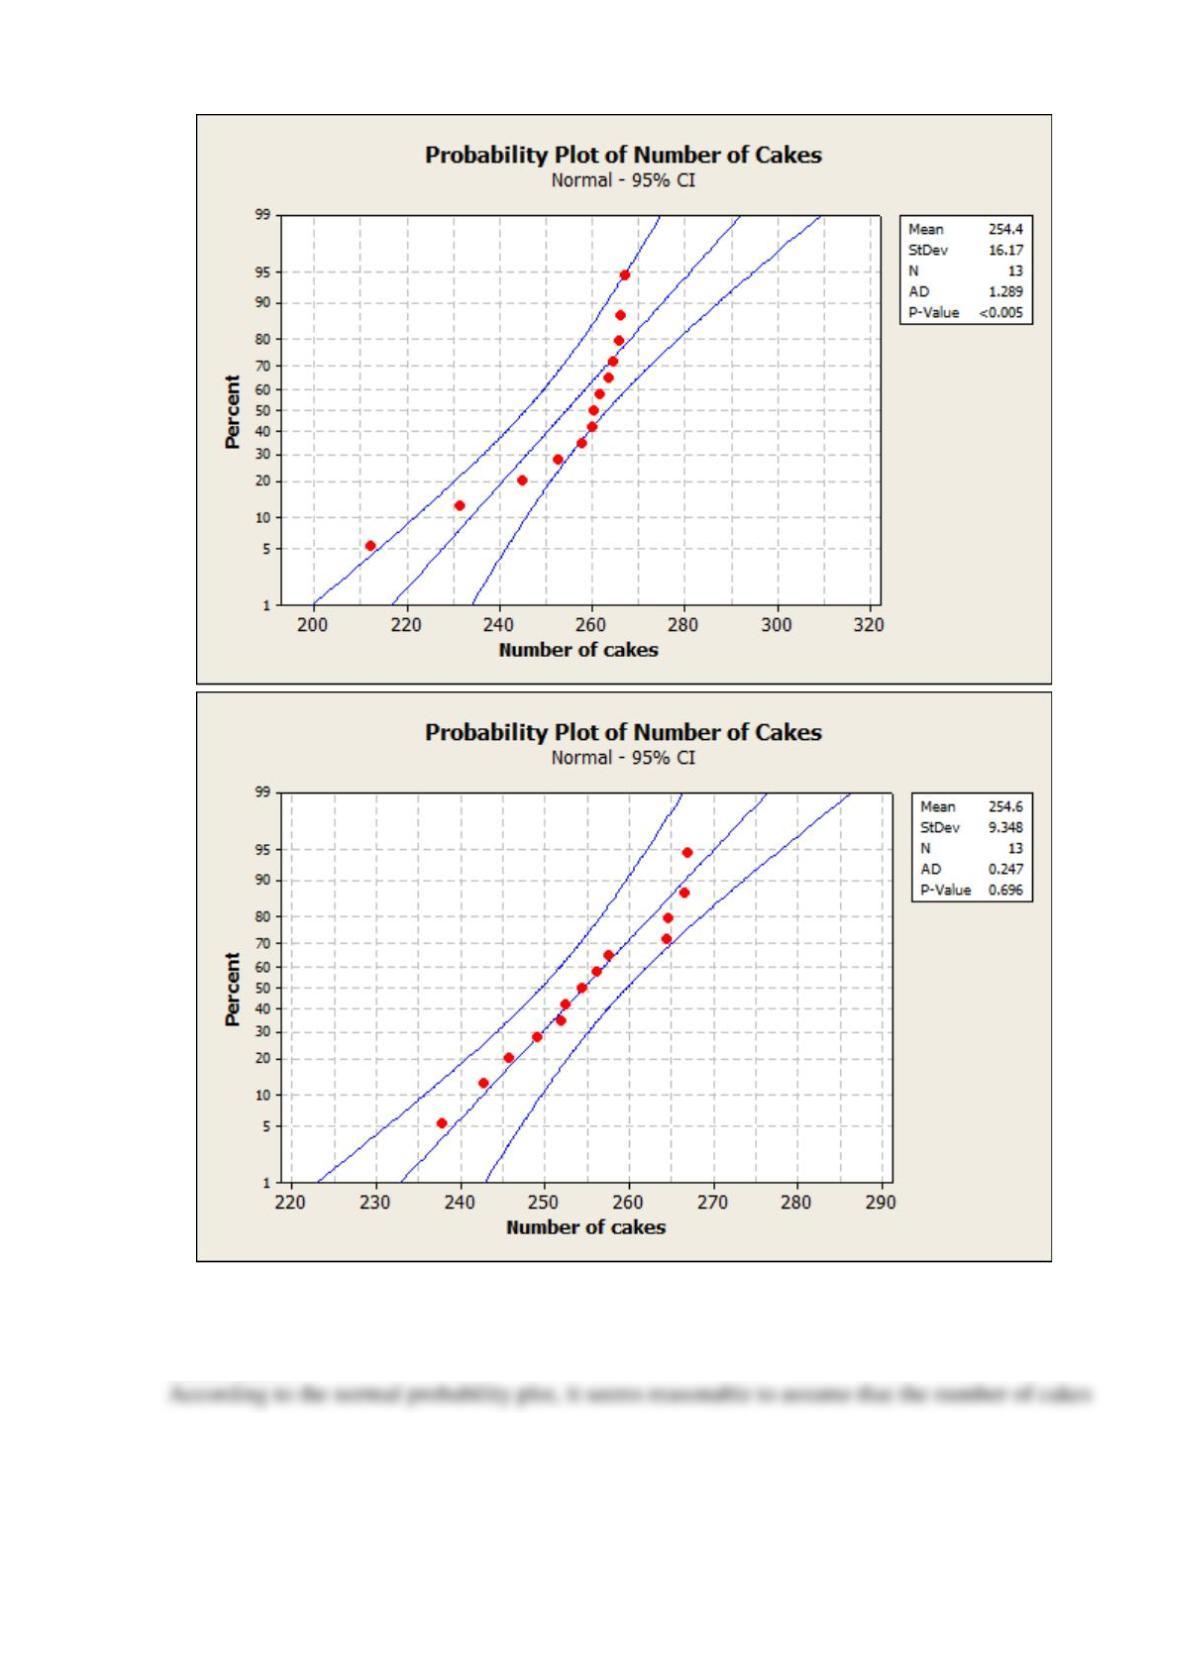
The following data are the numbers of cakes sold by a bakery on different days: 234, 246, 214,
267, 253, 220, 259, 264, 240, 251, 230, 247, 255.
Choose the correct normal probability plot of this data:
A
B
C
D
Does it seem reasonable to assume that the number of cakes sold is normally distributed?
SOLUTION
Reserve Problems Chapter 6 Section 7 Problem 2
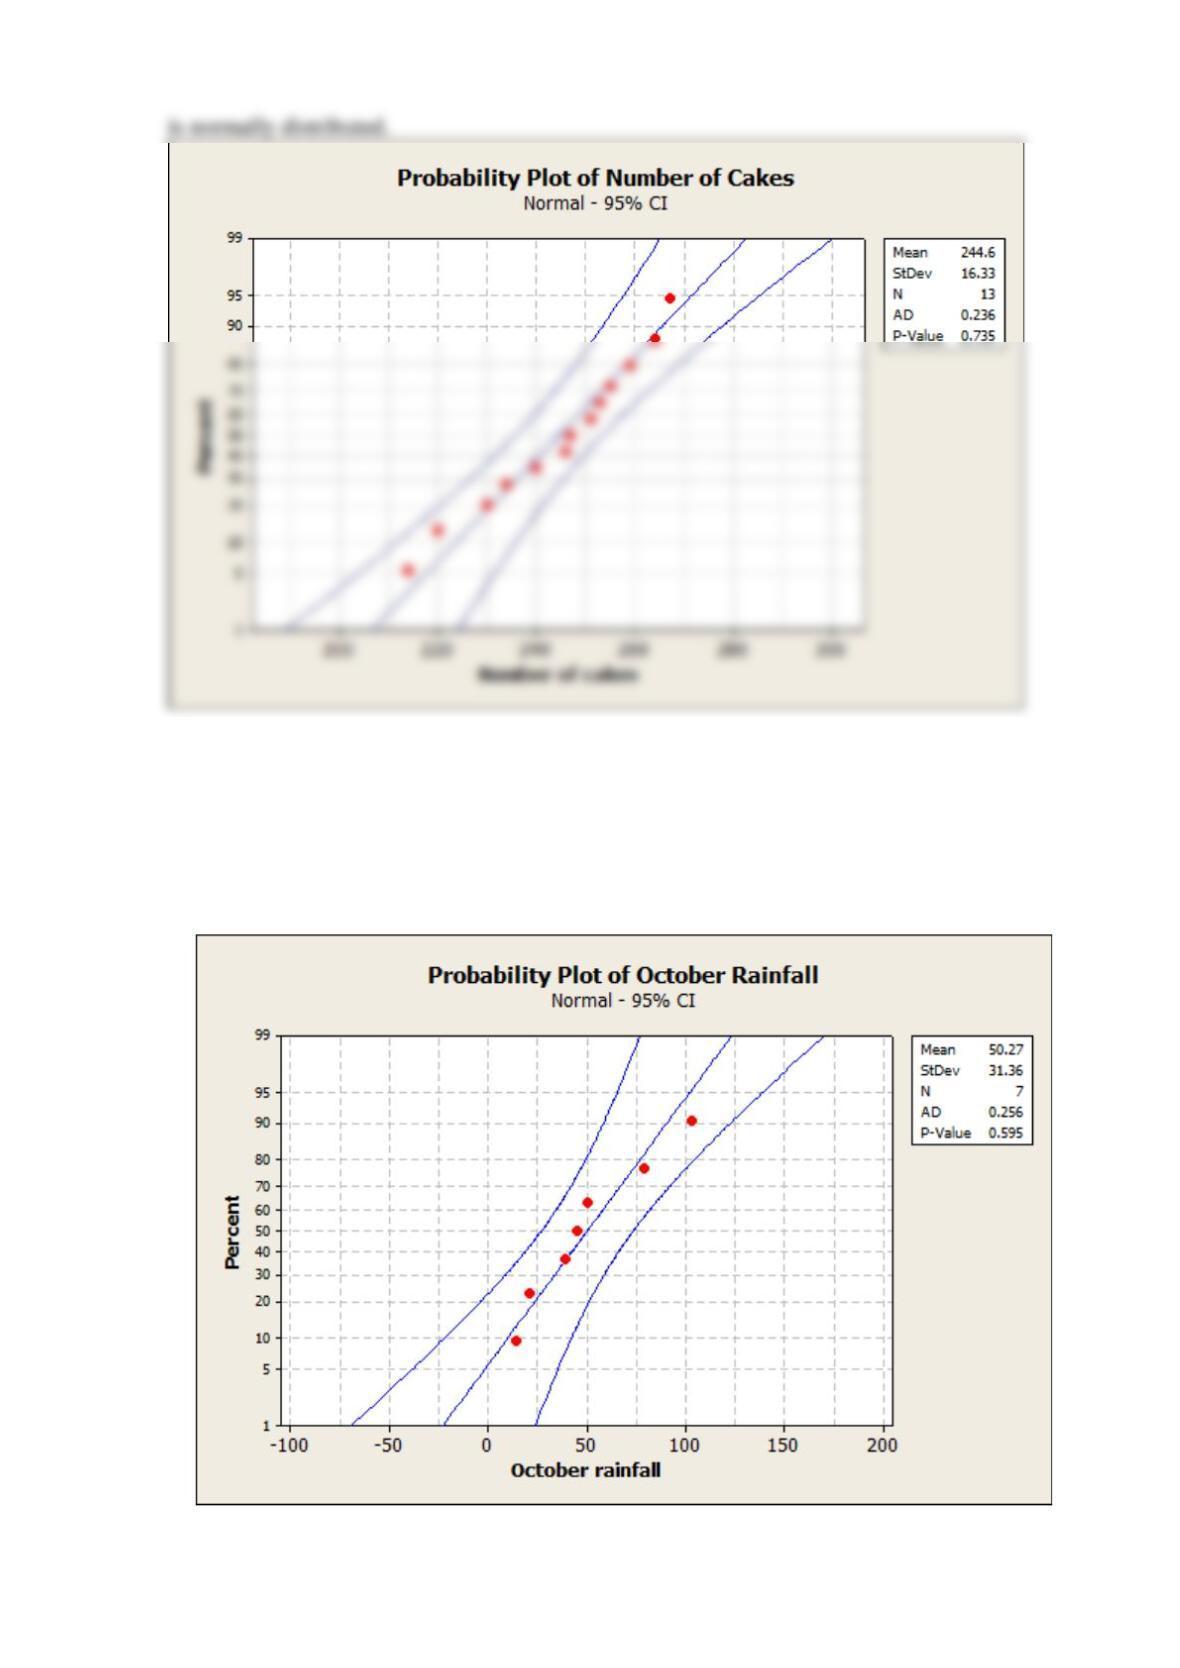
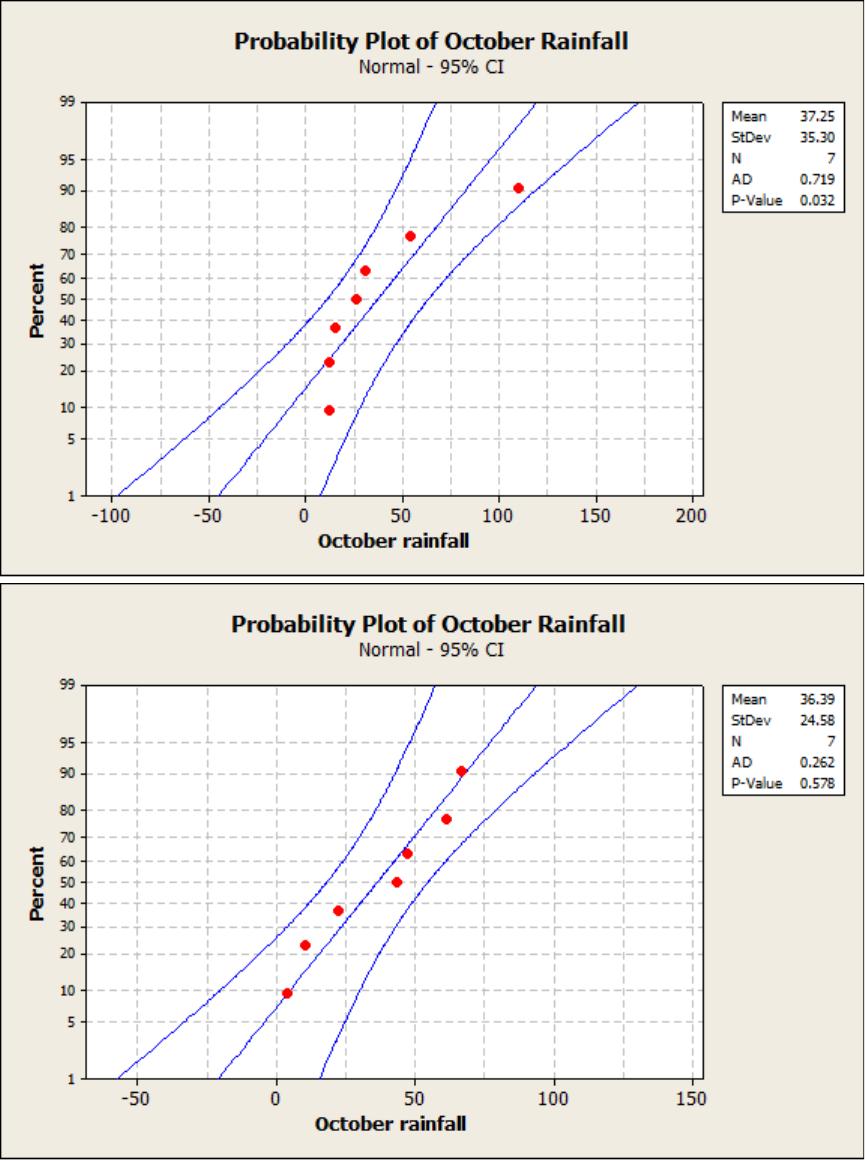
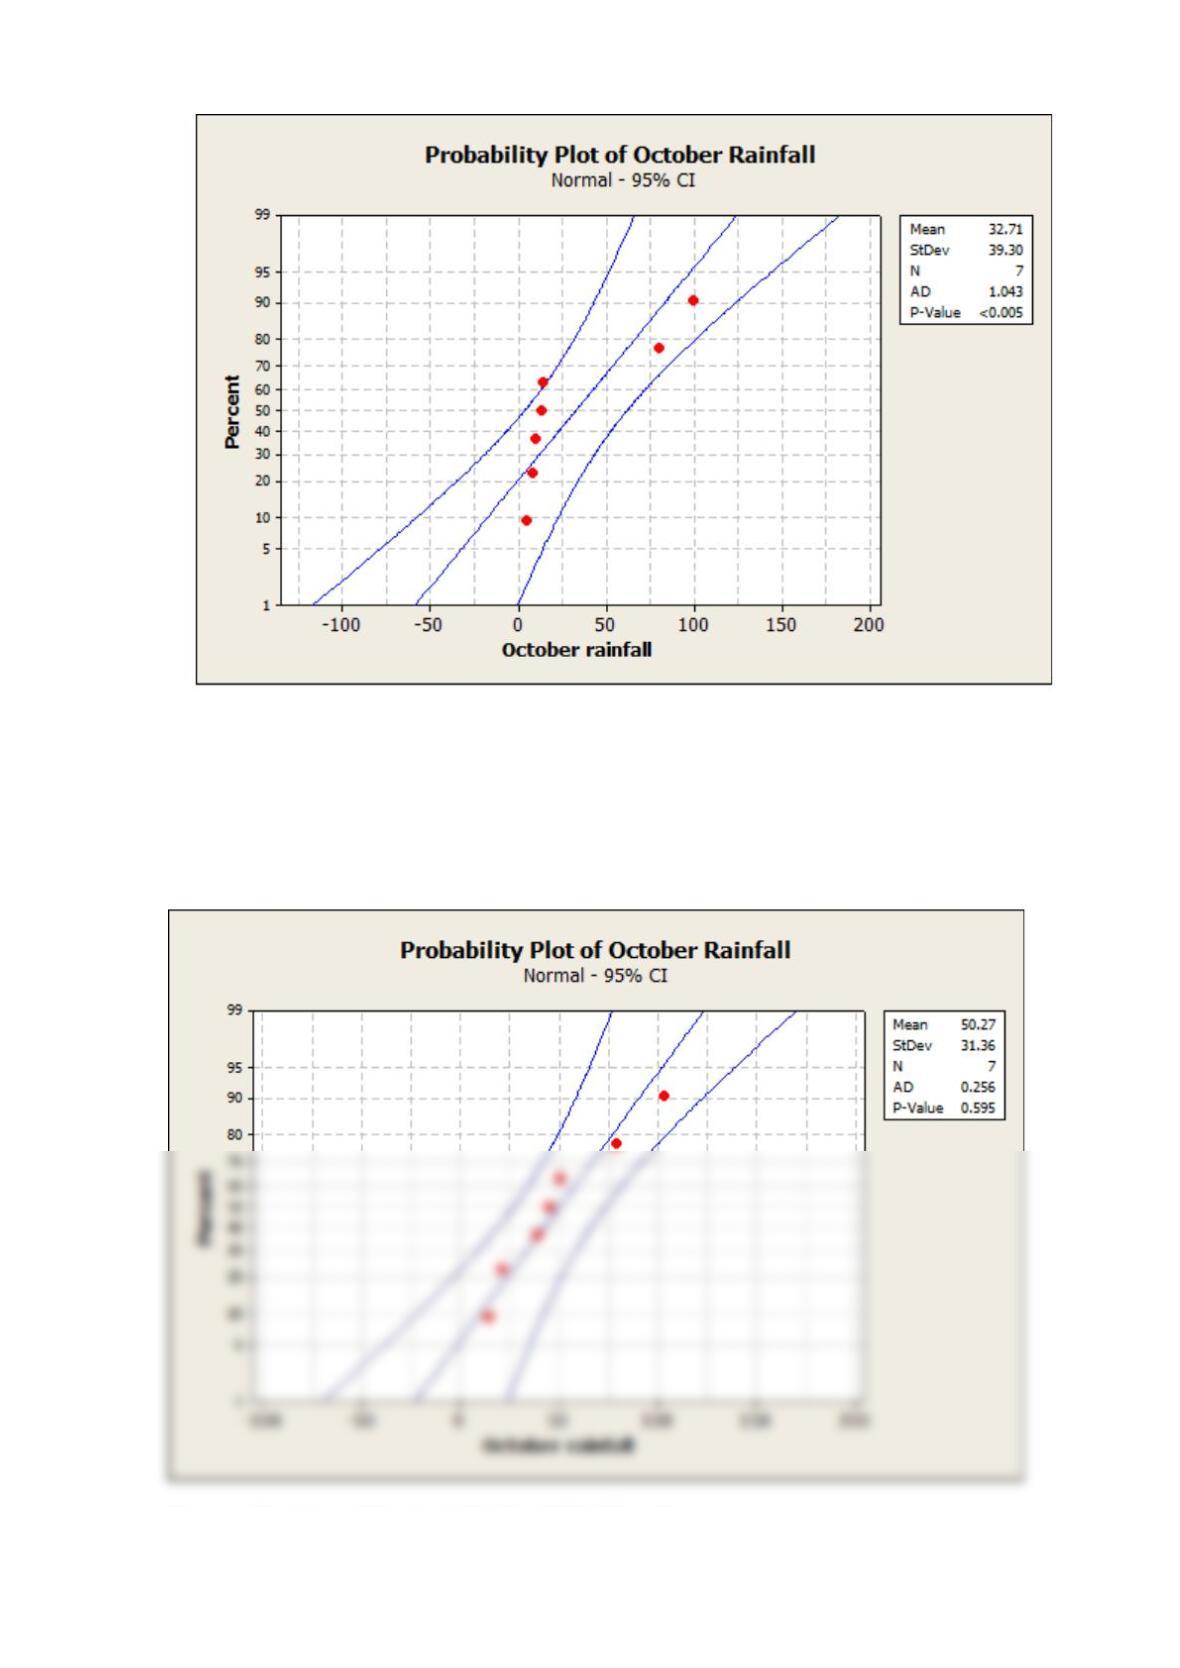
The following data are the measurements of October rainfall (mm) in Kiev from 2010 to 2016:
44.9, 78.8, 50.6, 14.2, 21.3, 39, 103.1
Choose the correct normal probability plot of this data:
A
B
C
D
Does it seem reasonable to assume that the rainfall is normally distributed?
SOLUTION
According to the normal probability plot, it seems reasonable to assume that the rainfall is
normally distributed.
Reserve Problems Chapter 6 Section 7 Problem 3
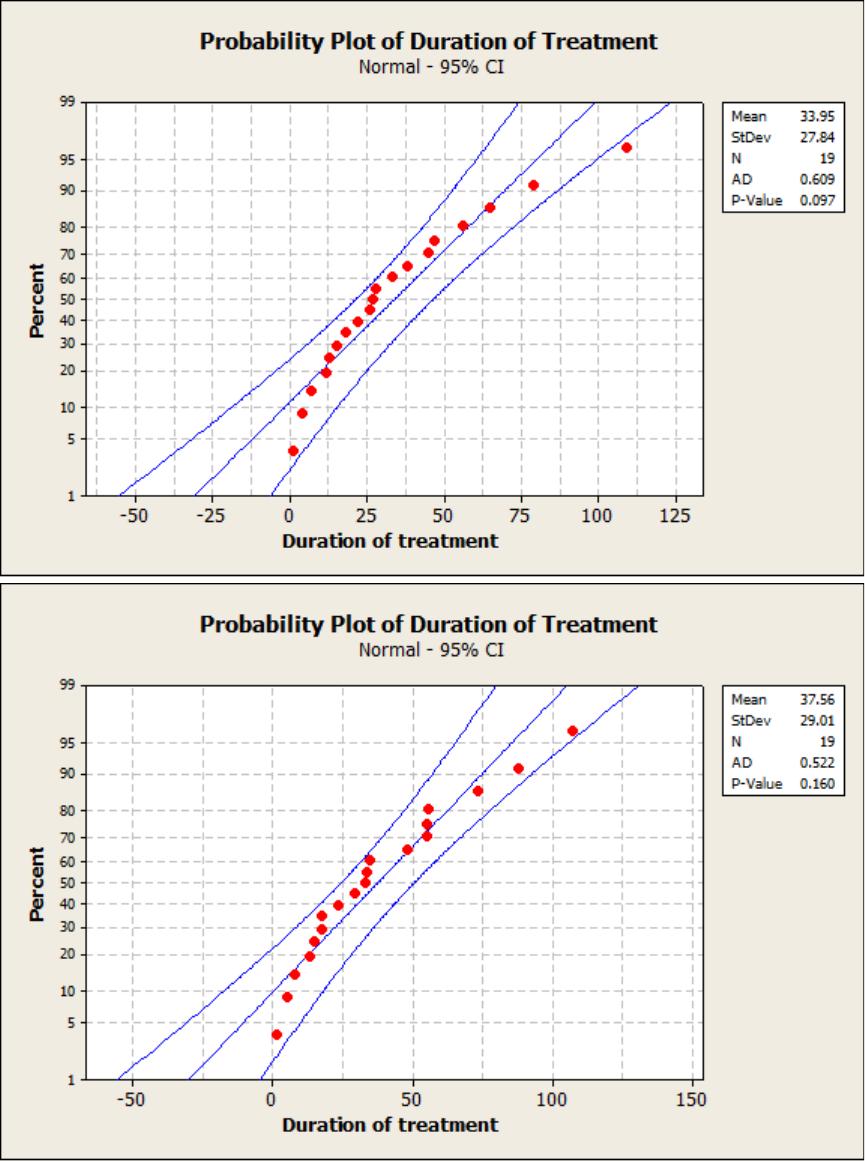
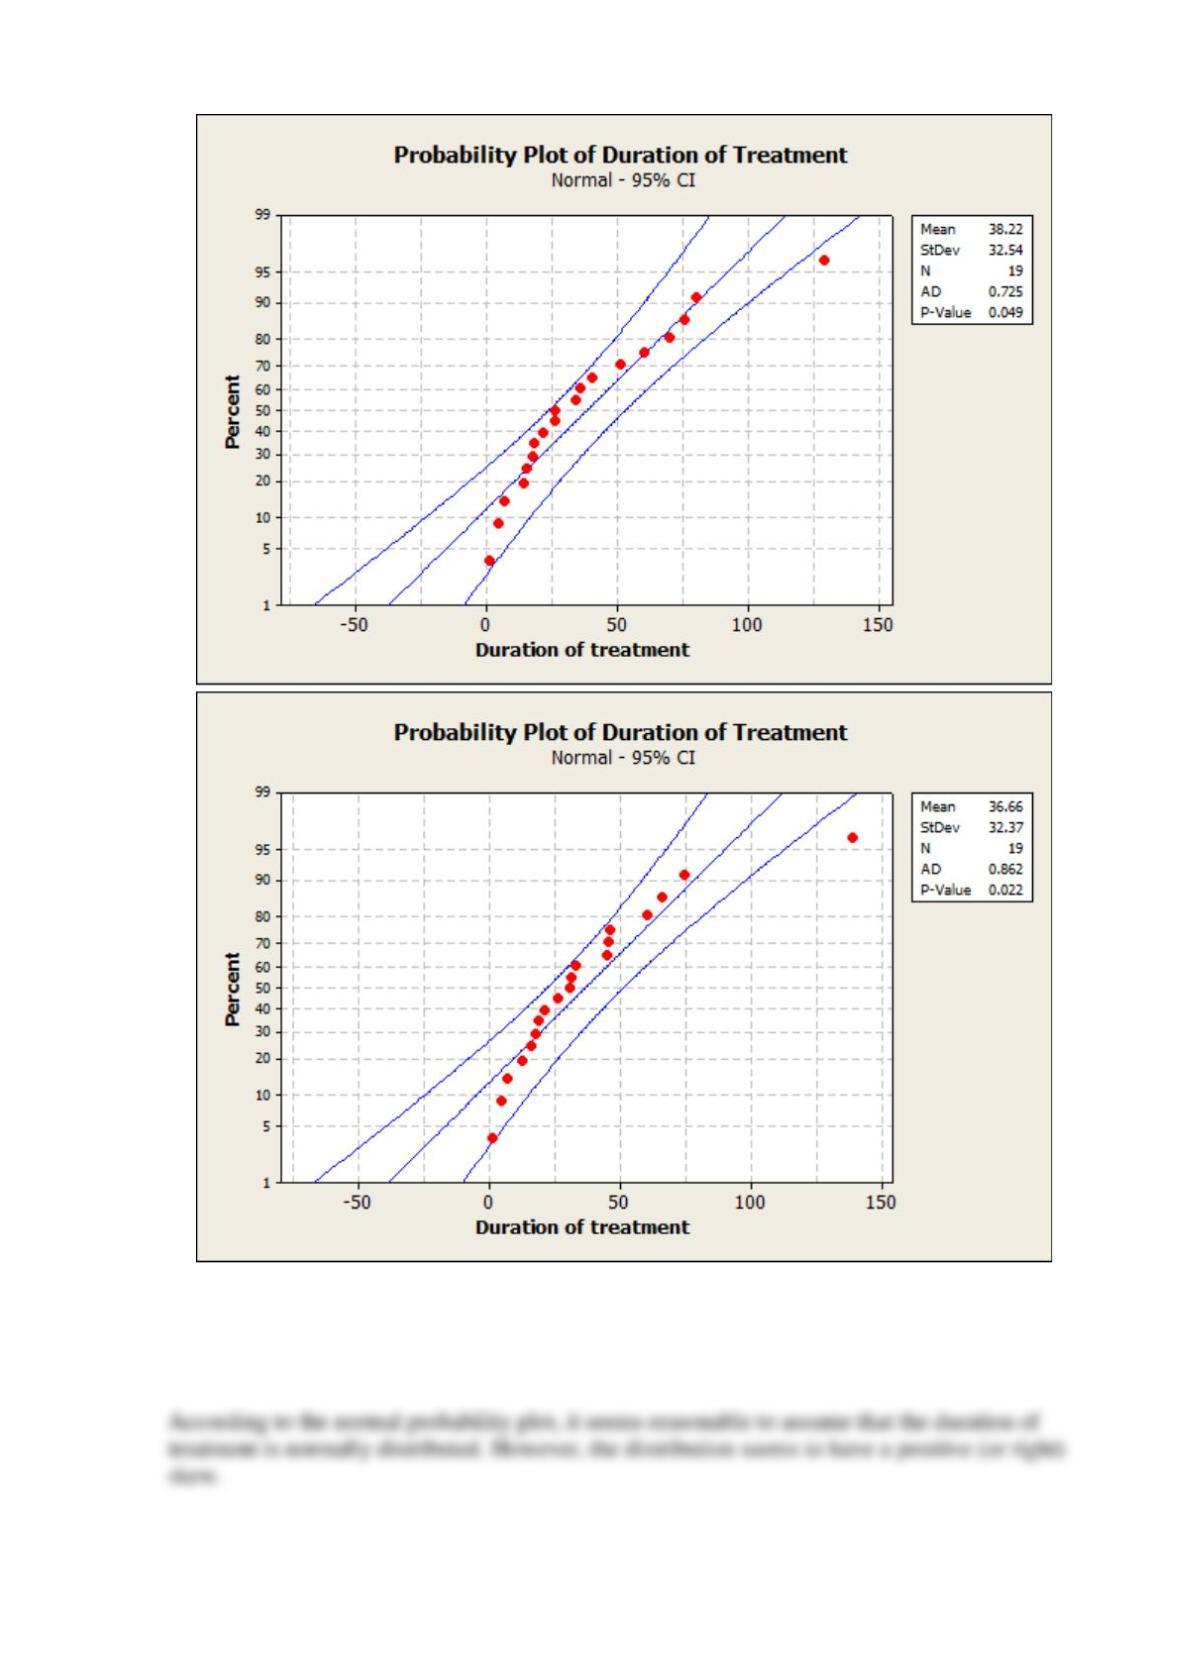
On Mondays 19 Patients receive hemodialysis treatment in a dialysis unit. Here are the durations
of their treatment in months: 1, 4, 7, 12, 13, 15, 18, 22, 26, 27, 28, 33, 38, 45, 47, 56, 65, 79, 109.
Choose the correct normal probability plot of this data:
A
B
C
D
Does it seem reasonable to assume that the duration of treatment is normally distributed?
SOLUTION
Reserve Problems Chapter 6 Section 7 Problem 4
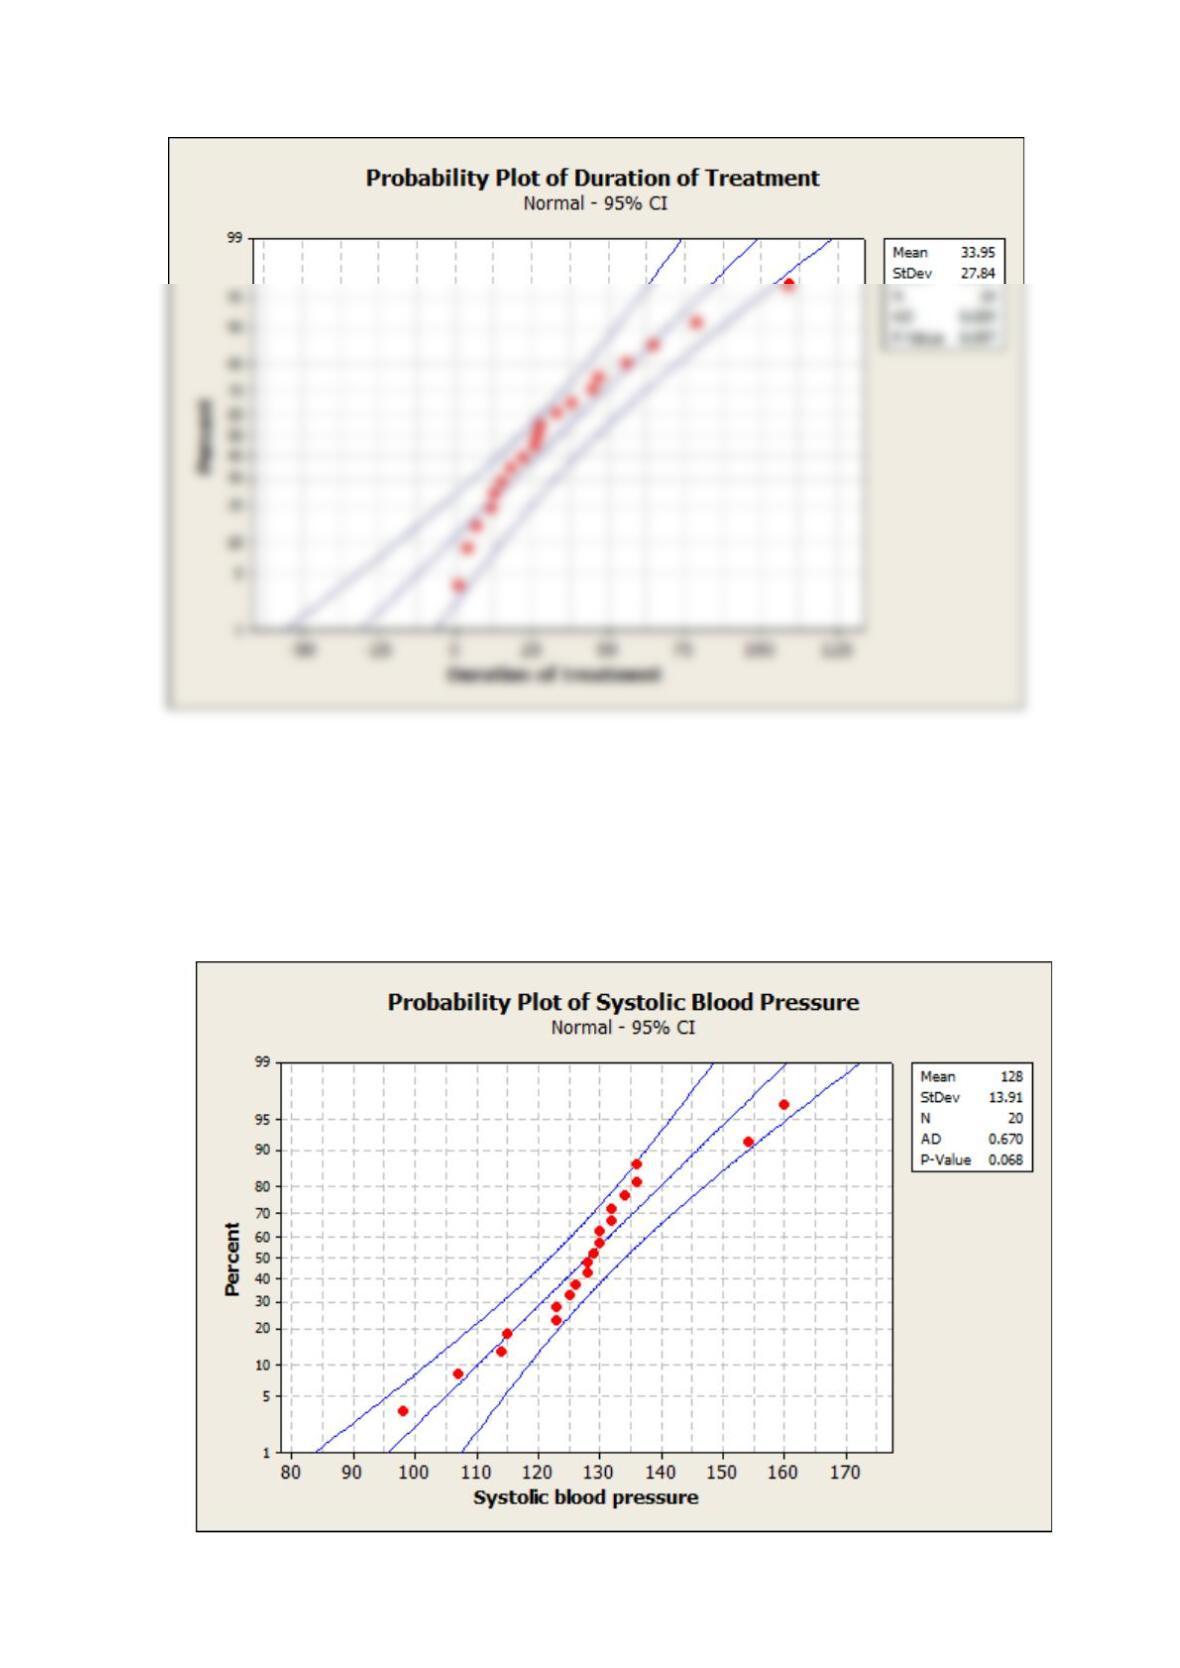
The following data are the results of 20 measurements of patient’s systolic blood pressure during
the period of illness: 98, 160, 136, 128, 130, 114, 123, 134, 128, 107, 123, 125, 129, 132, 154,
115, 126, 132, 136, 130.
Choose the correct normal probability plot of this data:
A
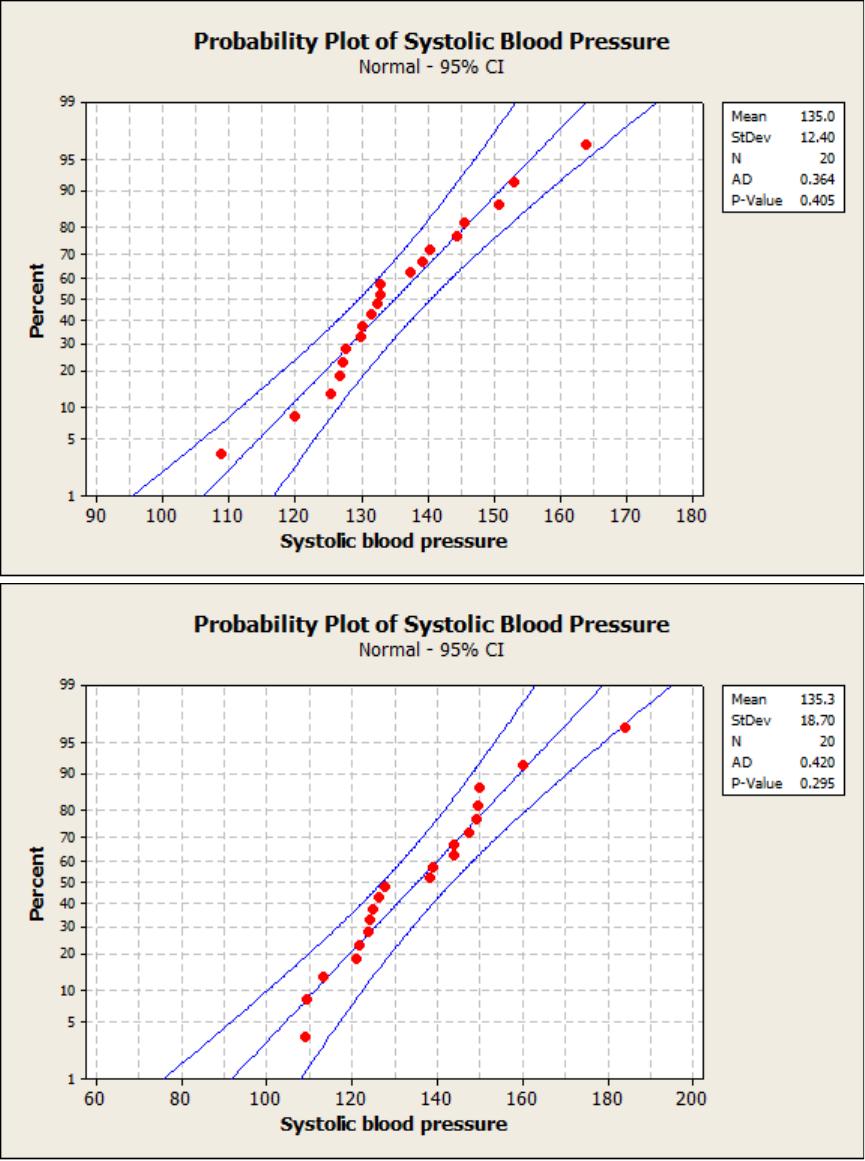
B
C
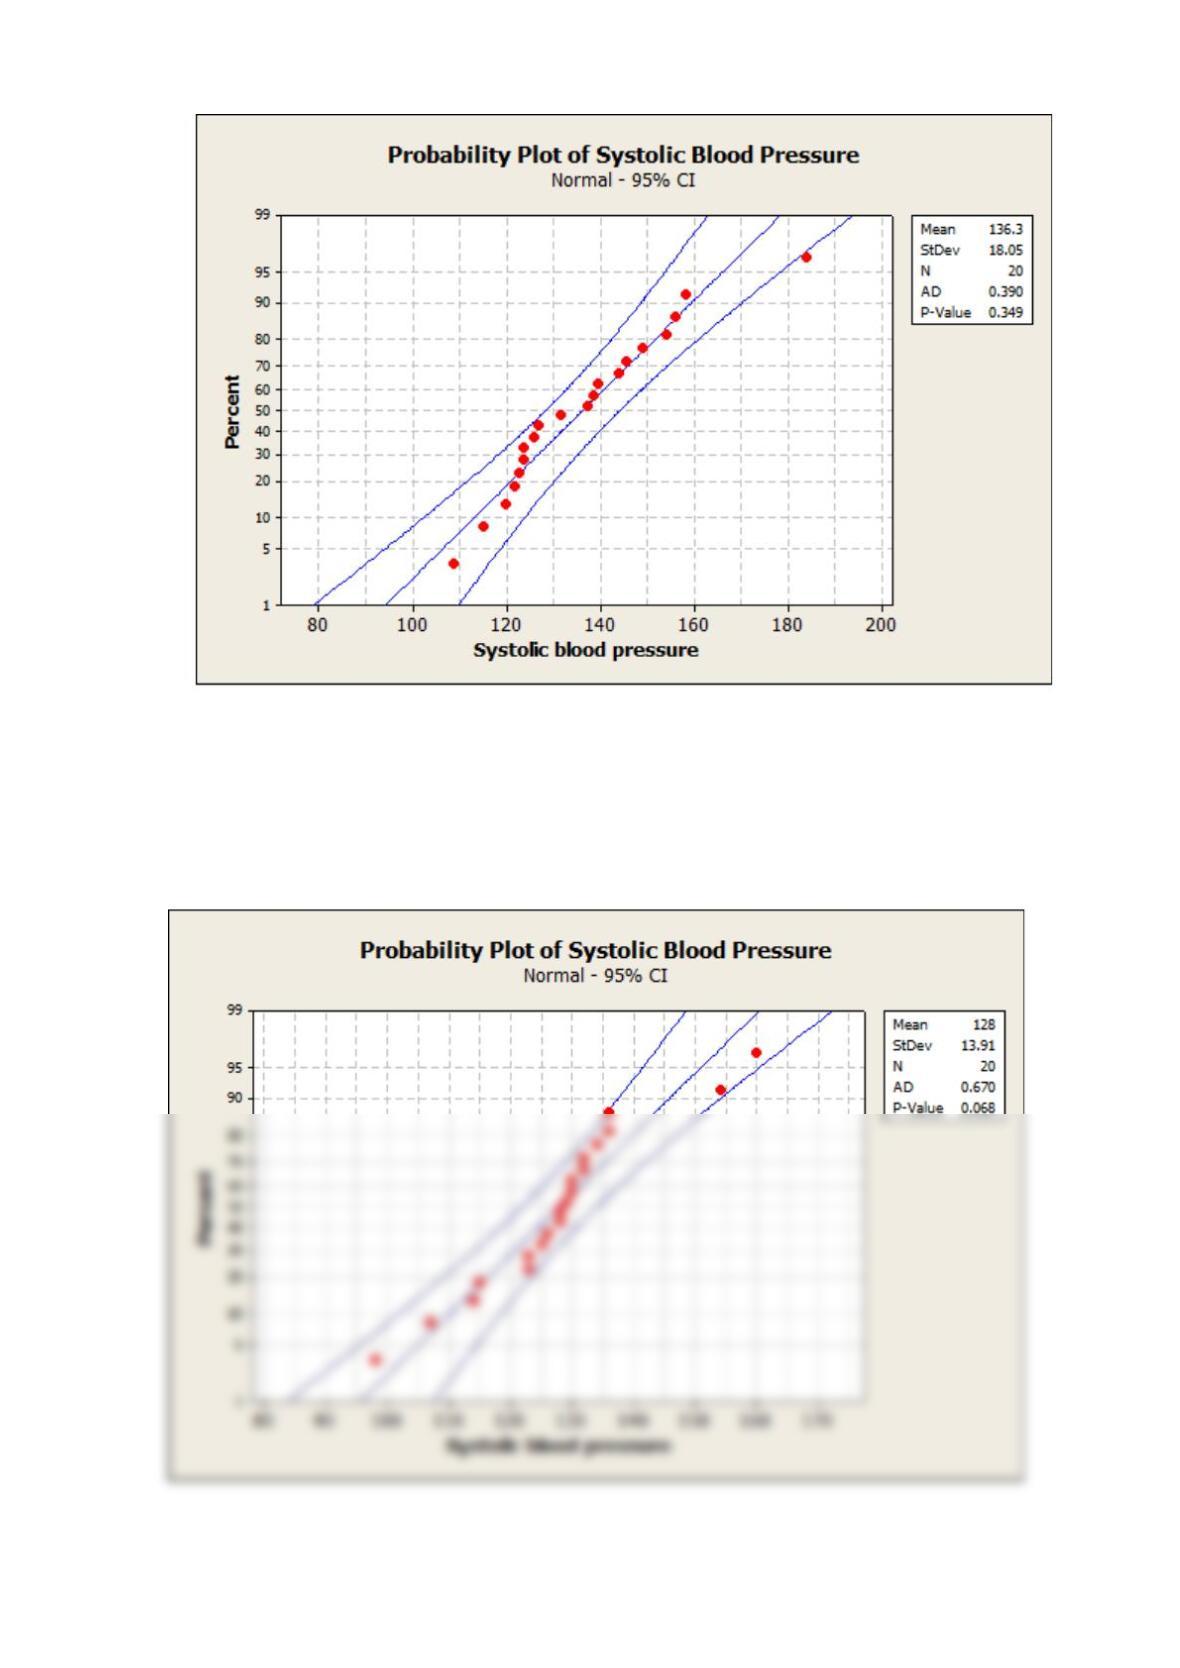
D
Does it seem reasonable to assume that the systolic blood pressure is normally distributed?
SOLUTION
According to the normal probability plot, it seems reasonable to assume that the systolic blood
pressure is normally distributed. However, the distribution seems to be heavy-tailed.
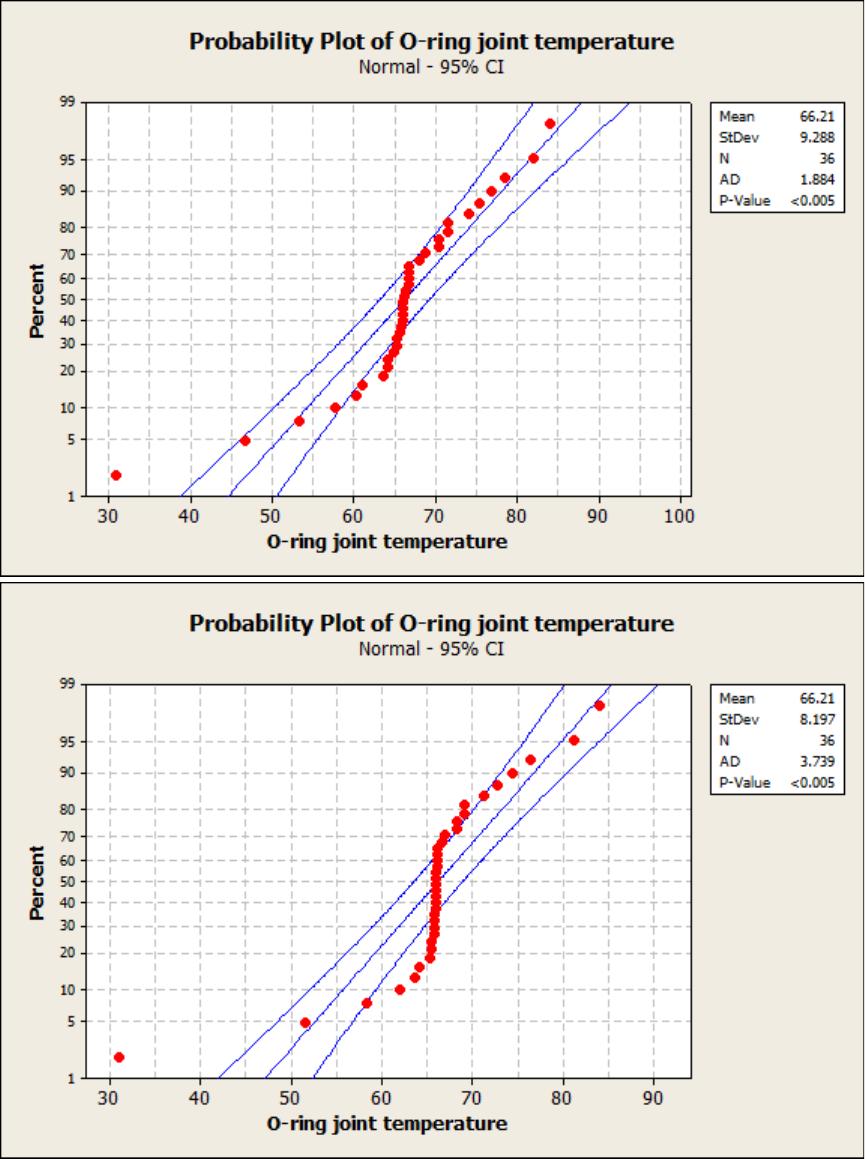
Reserve Problems Chapter 6 Section 7 Problem 5
The following data are the joint temperatures of the O-rings (°F) for each test firing or actual
launch of the space shuttle rocket motor (from Presidential Commission on the Space Shuttle
Challenger Accident, Vol. 1, pp. 129–131): 84, 49, 61, 40, 83, 67, 45, 66, 70, 69, 80, 58, 68, 60,
67, 72, 73, 70, 57, 63, 70, 78, 52, 67, 53, 67, 75, 61, 70, 81, 76, 79, 75, 76, 58, 31.
Select the correct normal probability plot of the O-ring joint temperature data.
A
B