13.2
15.1
16.2
11.9
11.7
14.0
15.0
15.1
17.0
16.2
14.2
14.6
14.6
14.8
15.1
15.3
13.6
14.2
16.2
12.2
16.0
12.7
12.9
13.7
16.1
14.4
16.7
12.5
13.4
12.9
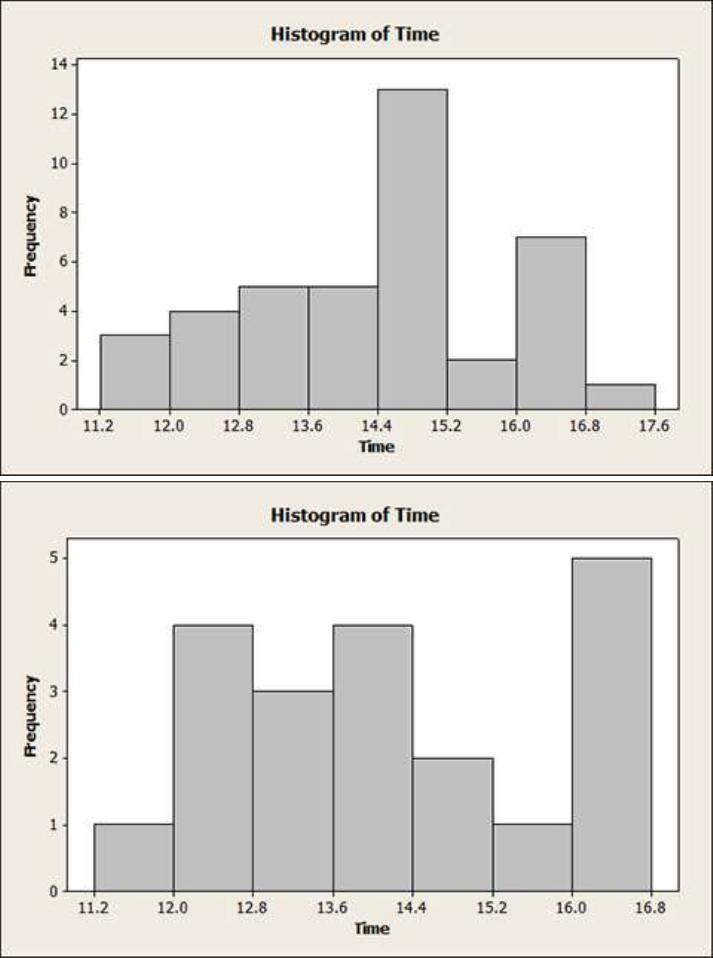
Choose the correct histogram for the data.
A
B
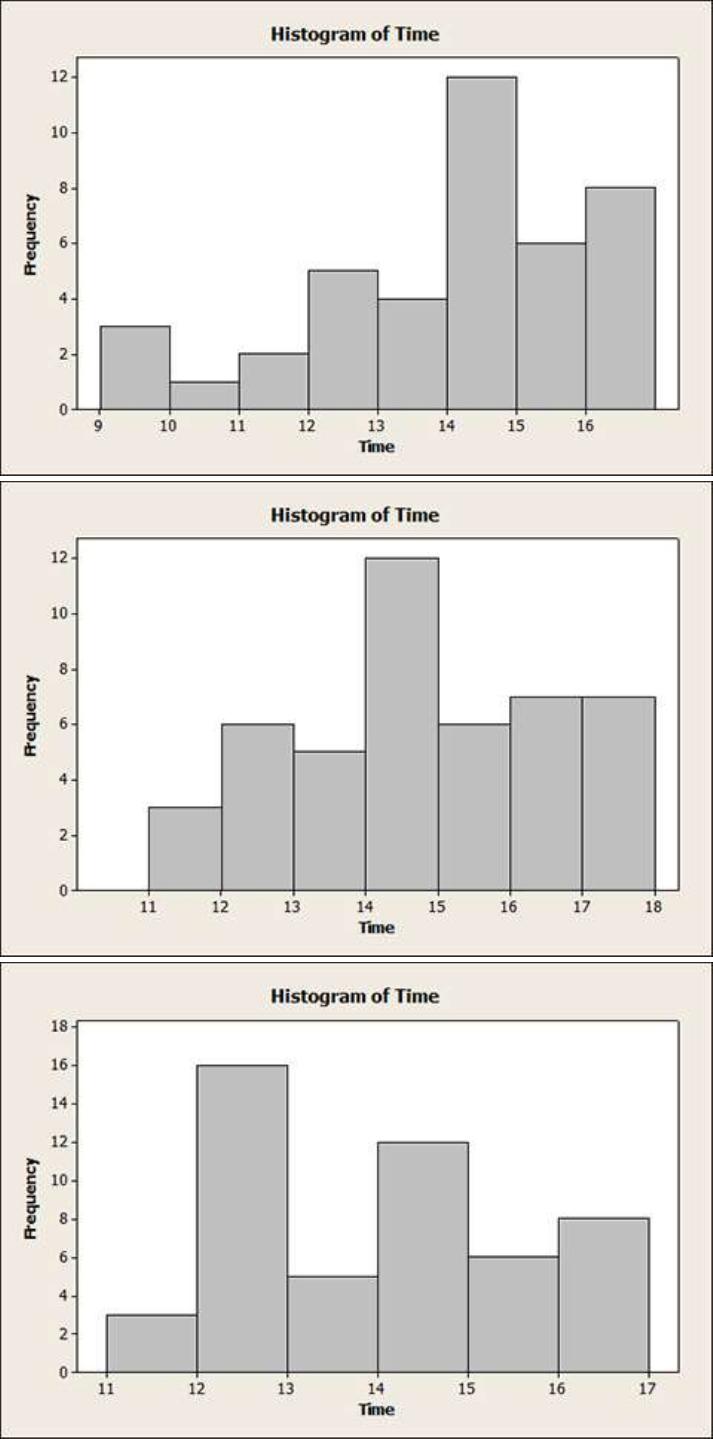
C
D
E
SOLUTION
Let mark the histograms with letters as follows.
Reserve Problems Chapter 6 Section 3 Problem 2
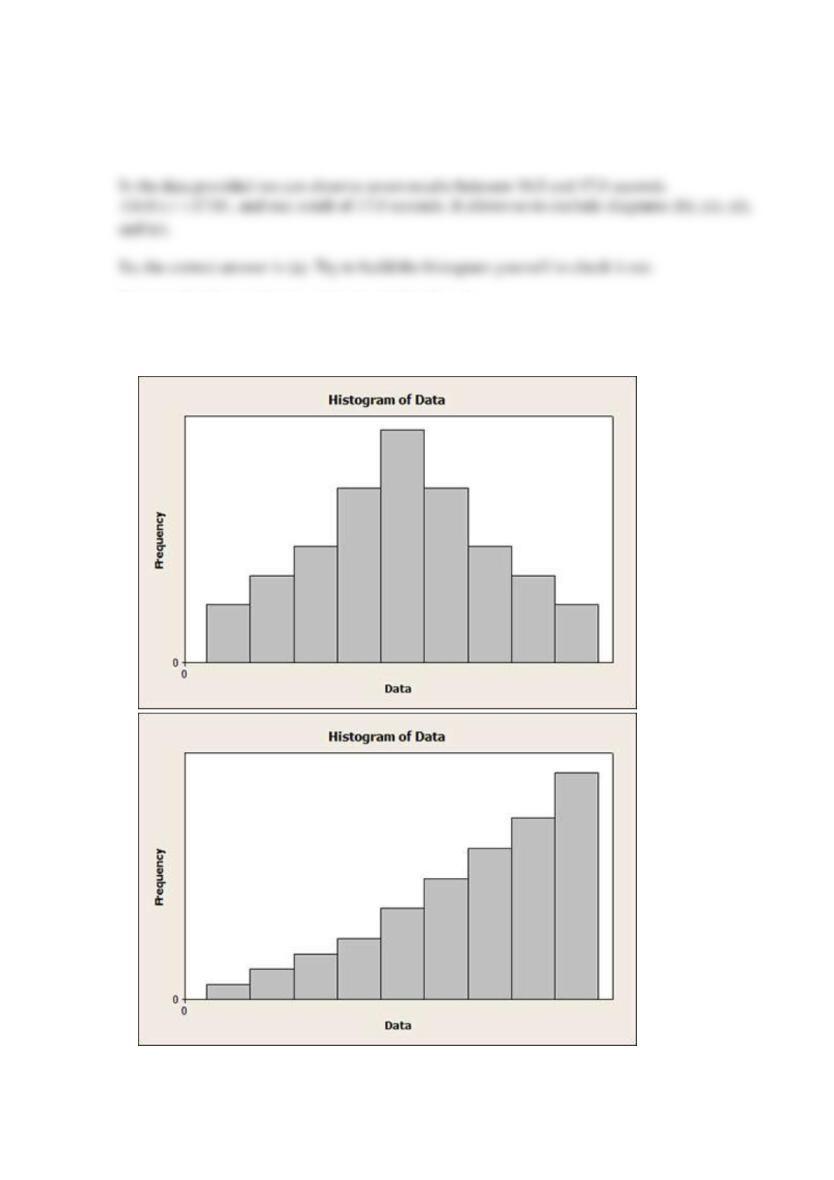
In which histogram do mode, median, and mean most likely coincide?
A
B
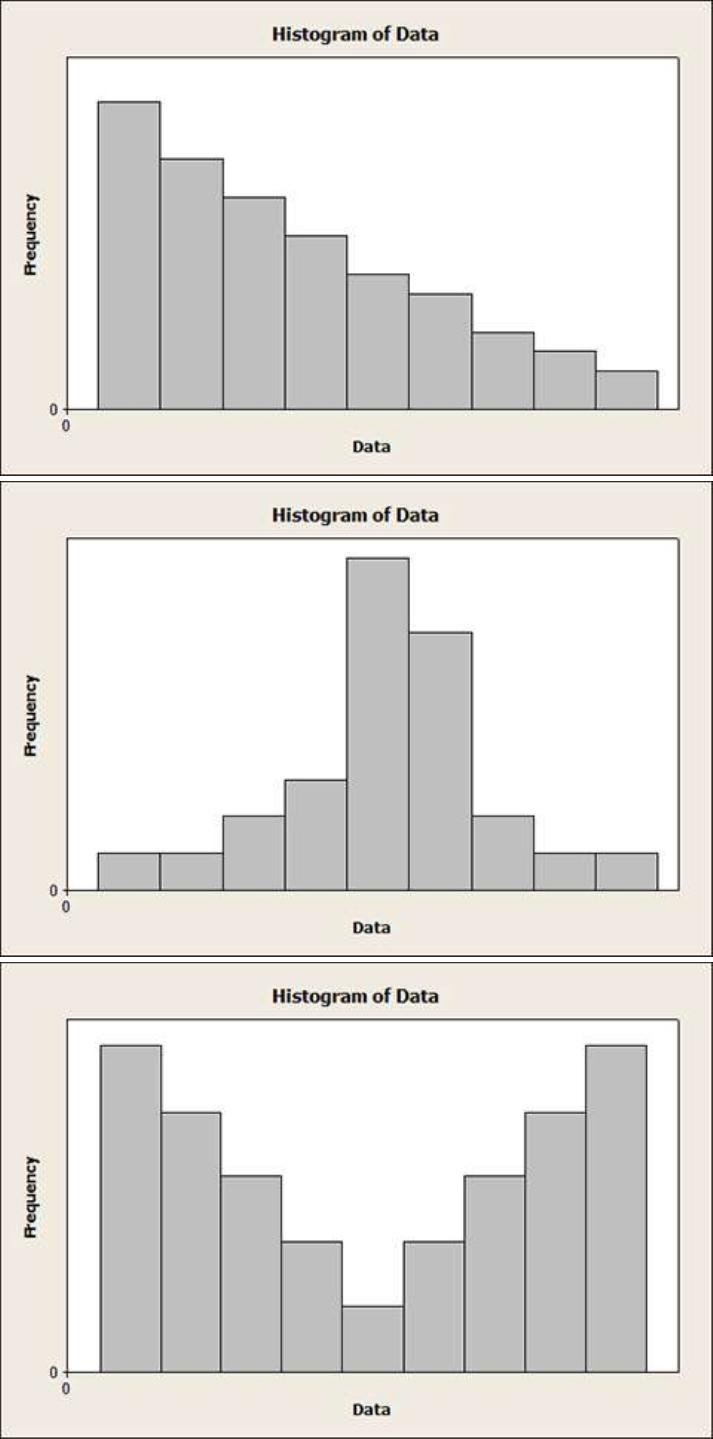
C
D
E

SOLUTION
Reserve Problems Chapter 6 Section 3 Problem 3
The following table contains frequency and relative frequency distribution for resistance of different specimens. X is the resistance measured in Ohms.
Class
100 150x
150 200x
200 250x
250 300x
300 350x
350 400x
400 450x
Frequency
5
6
12
22
17
12
6
Relative
frequency
0.0625
0.0750
0.1500
0.2750
0.2125
0.1500
0.0750
Determine the cumulative relative frequency for the specimens with the resistance between 250 and 300 Ohms.
SOLUTION
First, calculate the cumulative relative frequency for the specimens with the resistance between 250 and 300 – it equals the sum of all relative
Reserve Problems Chapter 6 Section 3 Problem 4
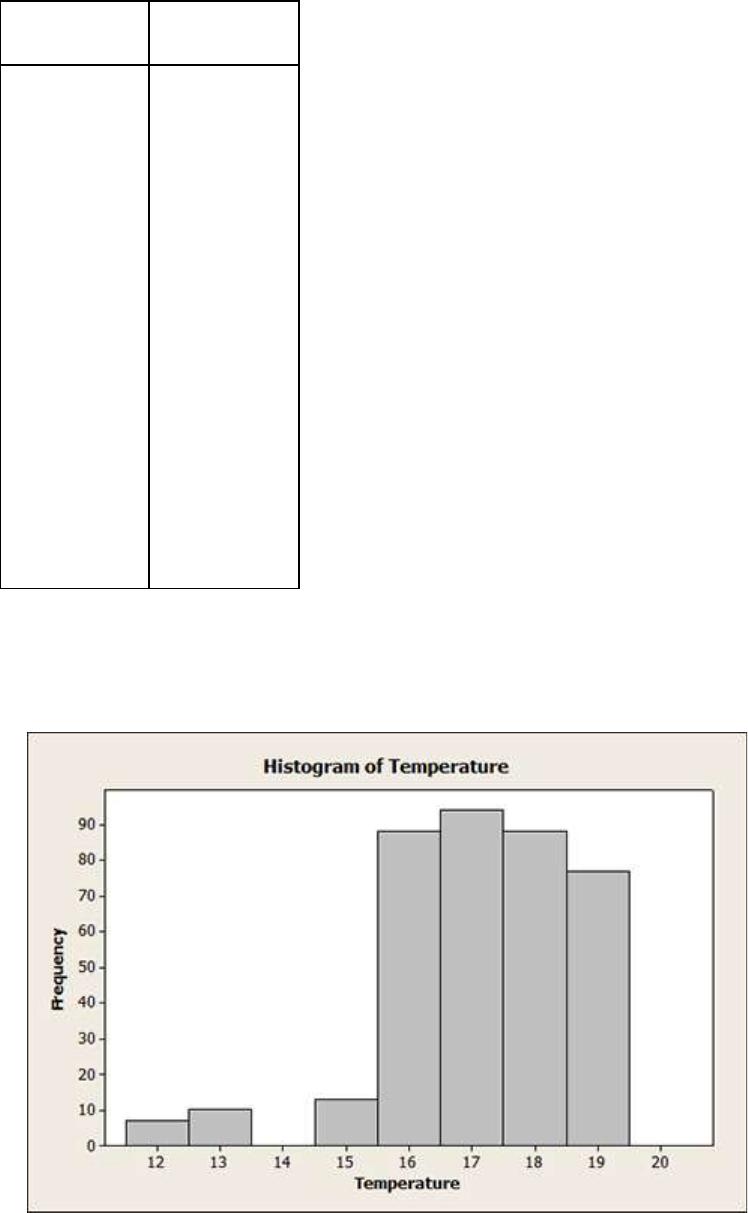
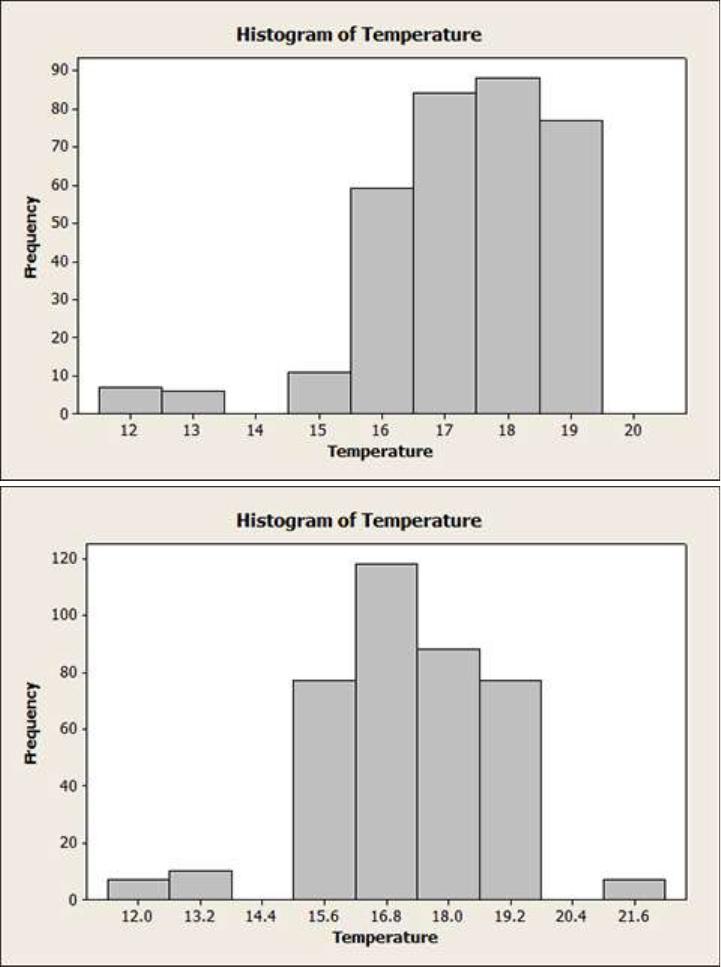
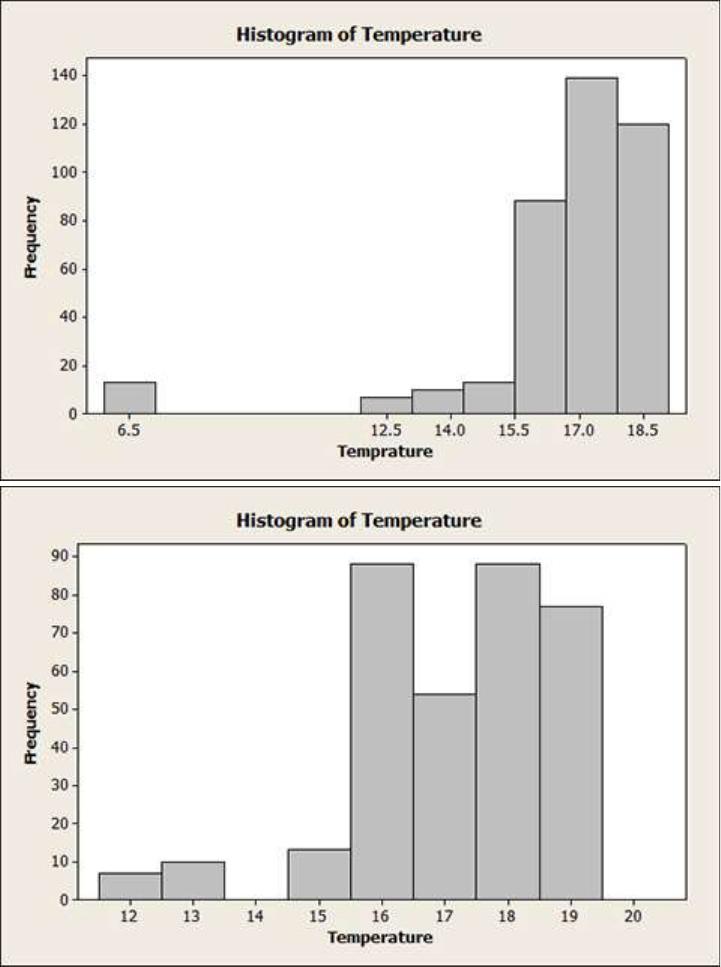
According to the data, obtained from the daily temperature observation, we obtained the
following information, shown in the table.
Temperature,
°C
Frequency
12.1
7
13.2
9
15.1
12
15.6
15
15.7
17
16.0
31
16.3
22
16.9
42
17.1
51
17.7
44
18.2
42
18.6
27
18.8
32
19.0
13
19.1
4
Choose the correct histogram for the data.
A
B
C
D
E
SOLUTION
Let mark the histograms with letters as follows.
(a)
(b)
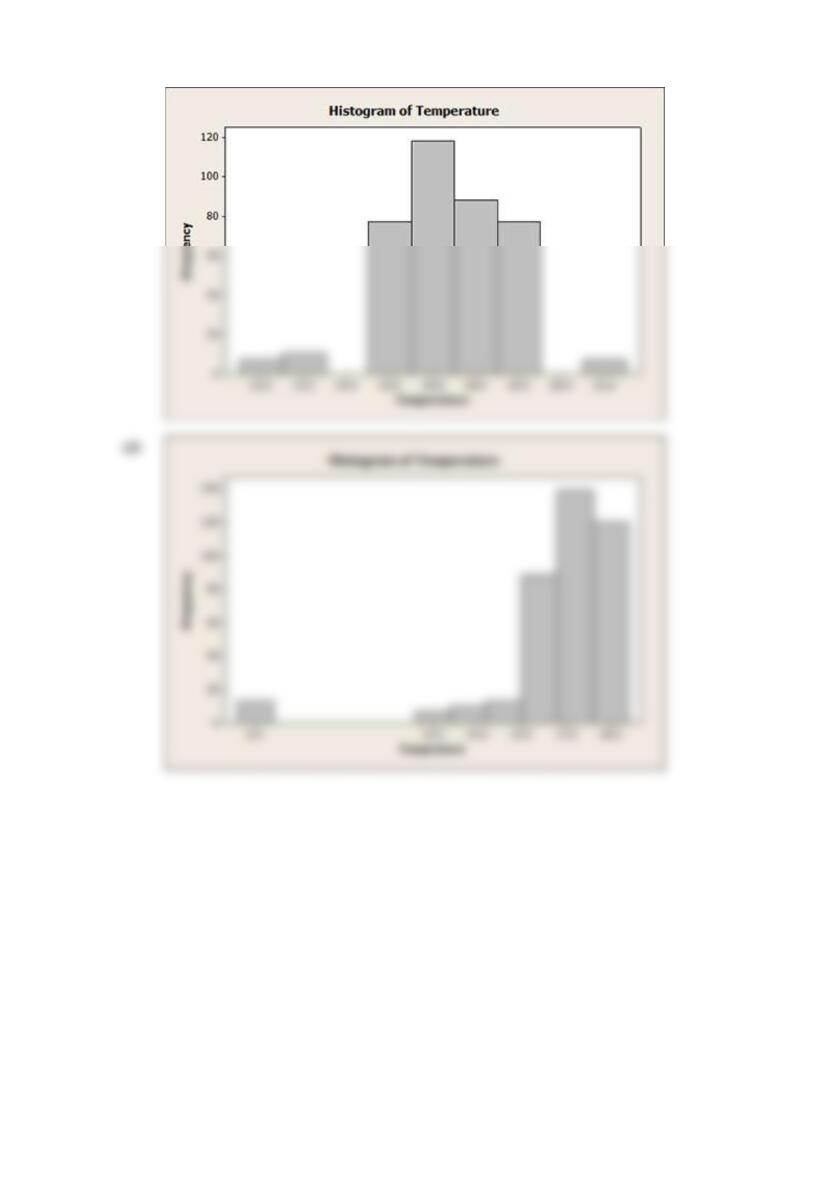
(c)
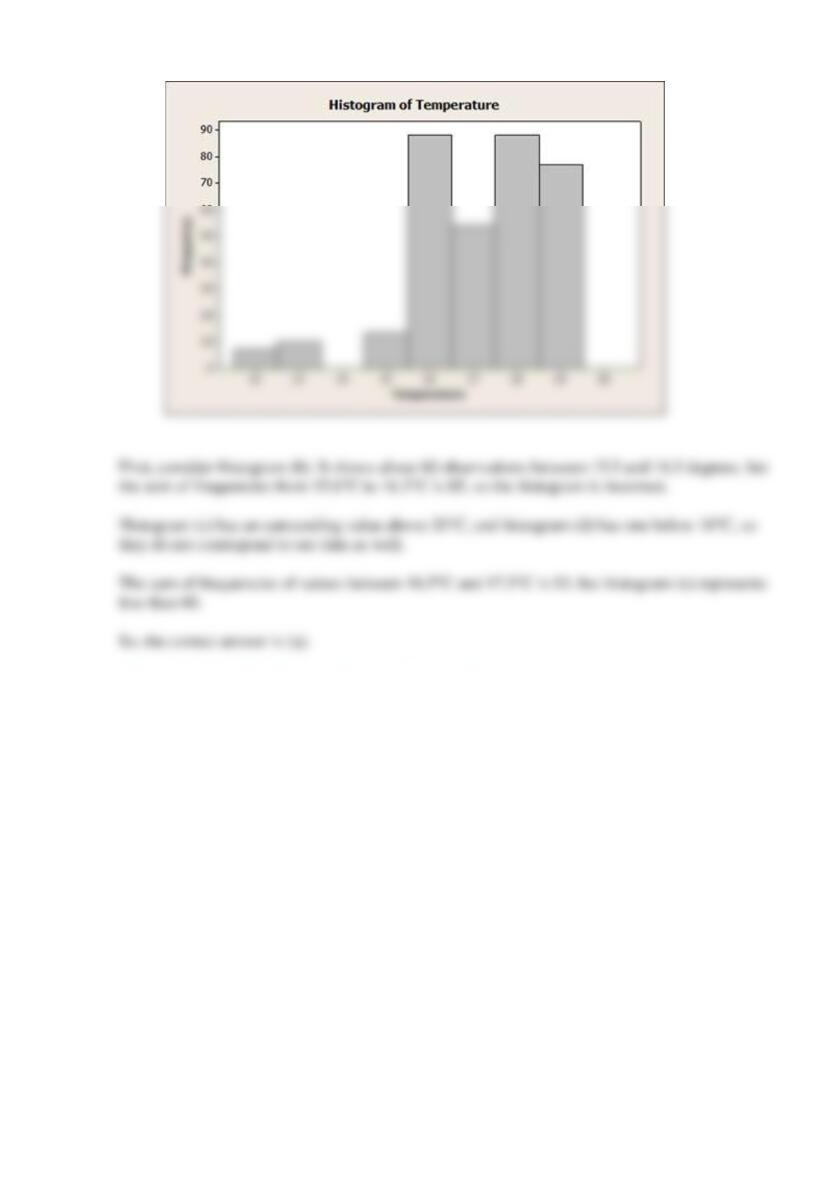
(e)
Reserve Problems Chapter 6 Section 3 Problem 5
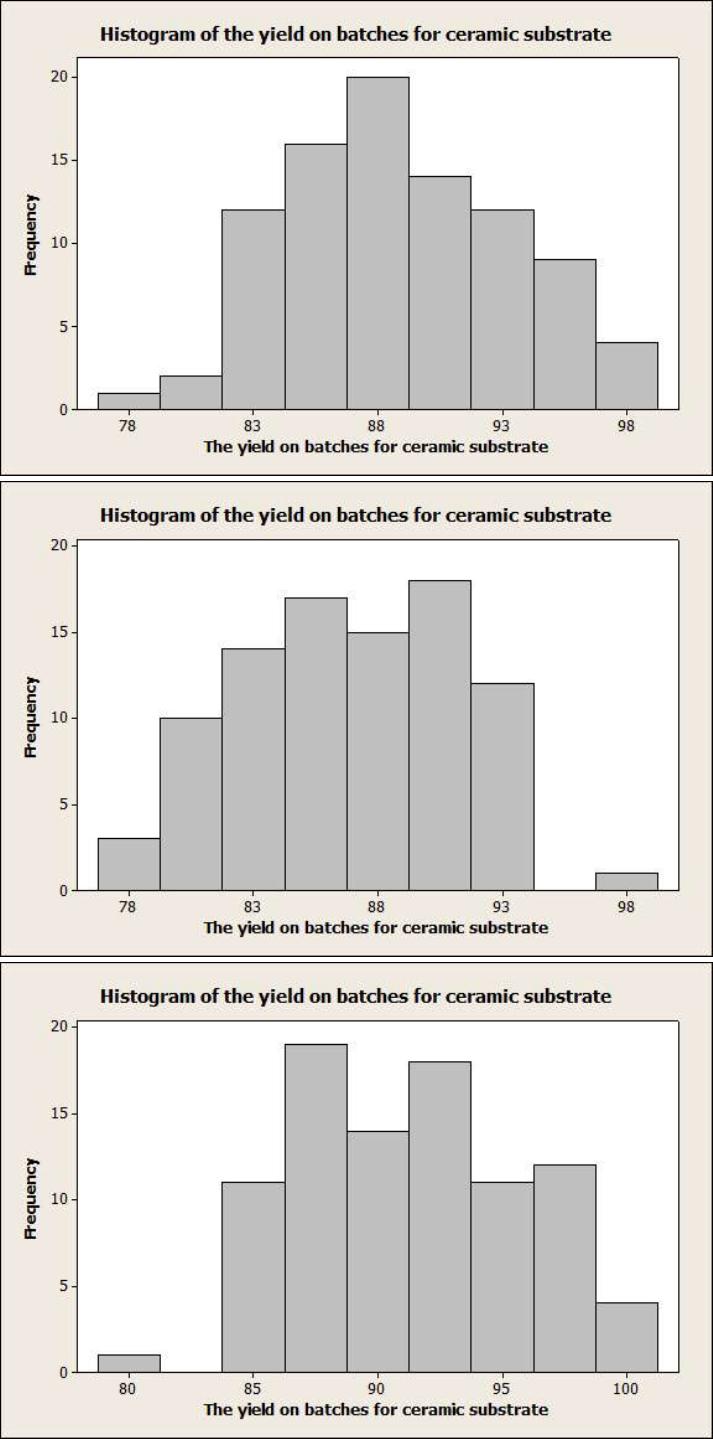
The following data represent the yield on 90 consecutive batches for ceramic substrate to which
a metal coating has been applied by a vapor-deposition process.
94.1
86.1
95.3
84.9
88.8
84.6
94.4
84.1
93.2
90.4
94.1
78.3
86.4
83.6
96.1
83.7
90.6
89.1
97.8
89.6
85.1
85.4
98.0
82.9
91.4
87.3
93.1
90.3
84.0
89.7
85.4
87.3
88.2
84.1
86.4
93.1
93.7
87.6
86.6
86.4
86.1
90.1
87.6
94.6
87.7
85.1
91.7
84.5
95.1
95.2
94.1
96.3
90.6
89.6
87.5
90.0
86.1
92.1
94.7
89.4
90.0
84.2
92.4
94.3
96.4
91.1
88.6
90.1
85.1
87.3
93.2
88.2
92.4
84.1
94.3
90.5
86.6
86.7
86.4
90.6
82.6
97.3
95.6
91.2
83.0
85.0
89.1
83.1
96.8
88.3
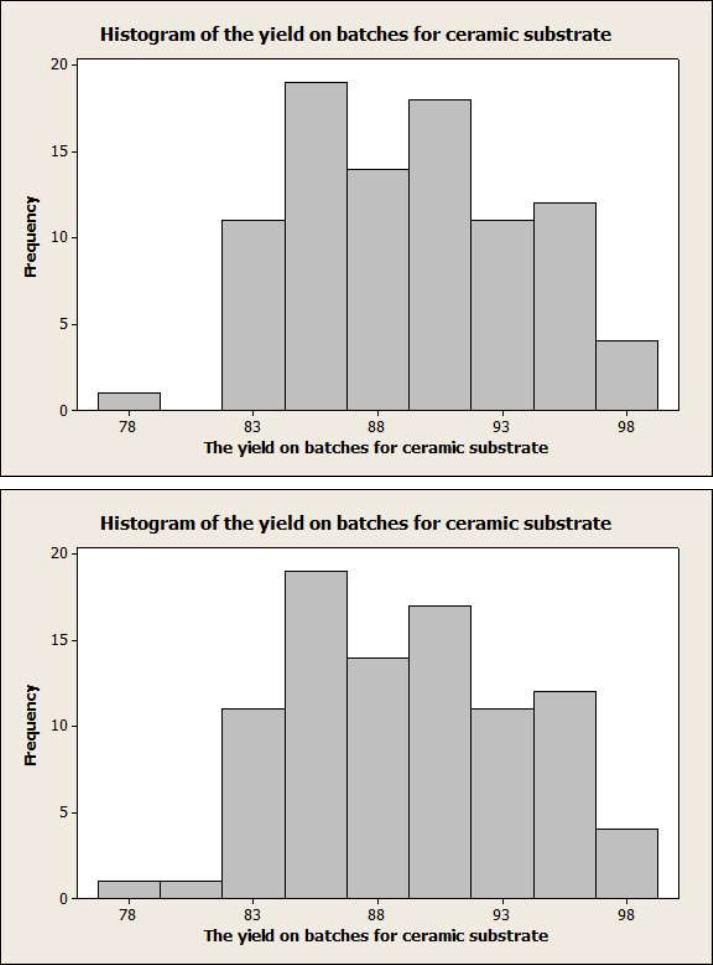
Construct a frequence distribution for these data. Use 9 bins.
Select the correct histogram.
A
B
C
D
E

SOLUTION
Class
76.75 79.25x
79.25 81.75x
81.75 84.25x
84.25 86.75x
86.75 89.25x
Reserve Problems Chapter 6 Section 3 Problem 6
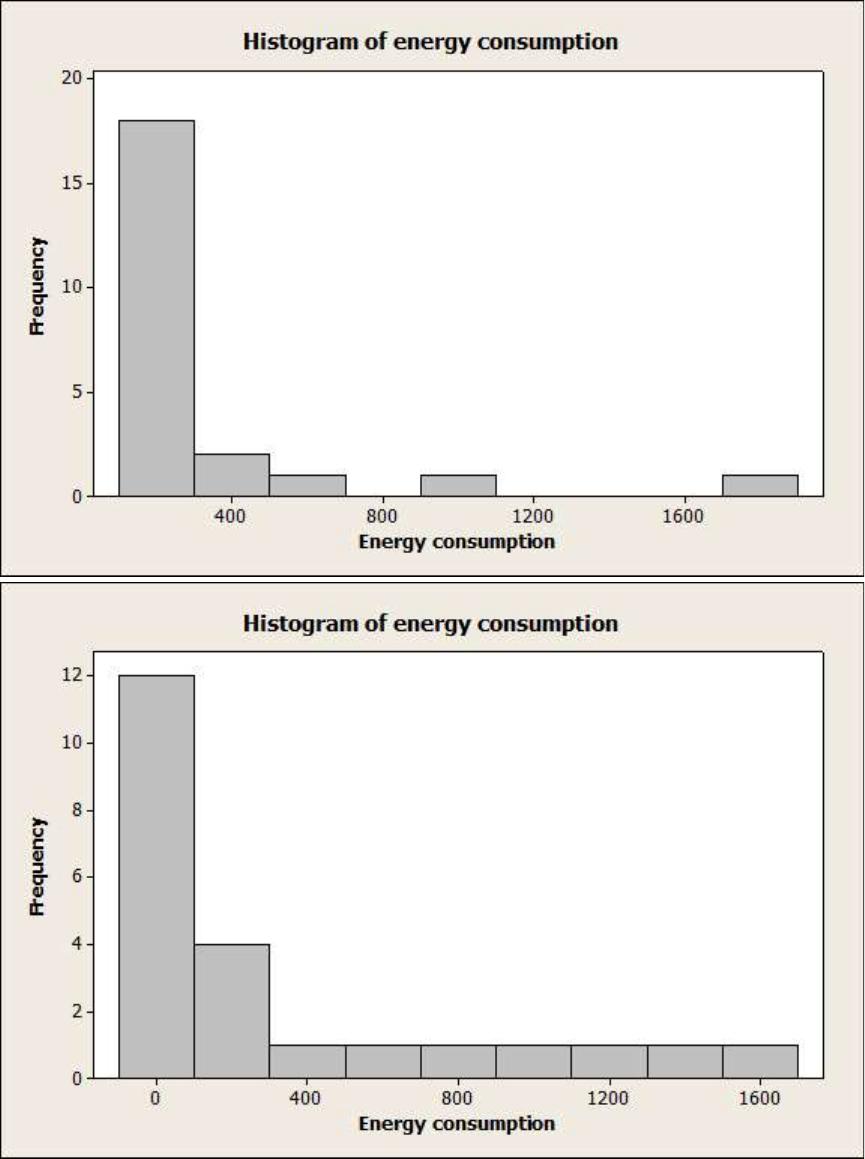
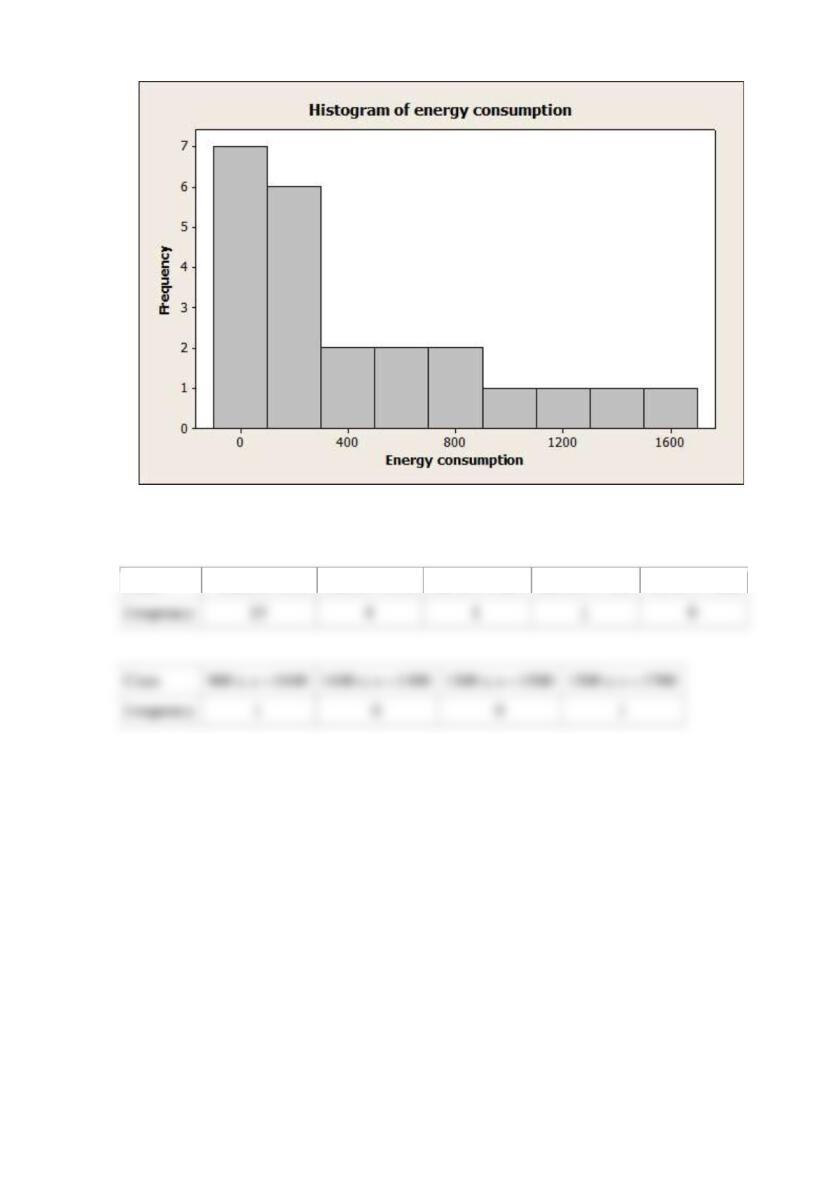
The net energy consumption (in billions of kilowatt-hours) for countries in Asia in 2003 was as
follows.
Billions of Kilowatt-Hours
Afghanistan
1.04
Australia
200.66
Bangladesh
16.20
Burma
6.88
China
1671.23
Hong Kong
38.43
India
519.04
Indonesia
101.80
Japan
946.27
Korea, North
17.43
Korea, South
303.33
Laos
3.30
Malaysia
73.63
Mongolia
2.91
Nepal
2.30
New Zealand
37.03
Pakistan
71.54
Philippines
44.48
Singapore
30.89
Sri Lanka
6.80
Taiwan
154.34
Thailand
107.34
Vietnam
36.92
Total
4393.8
Frequency
Class
Frequency
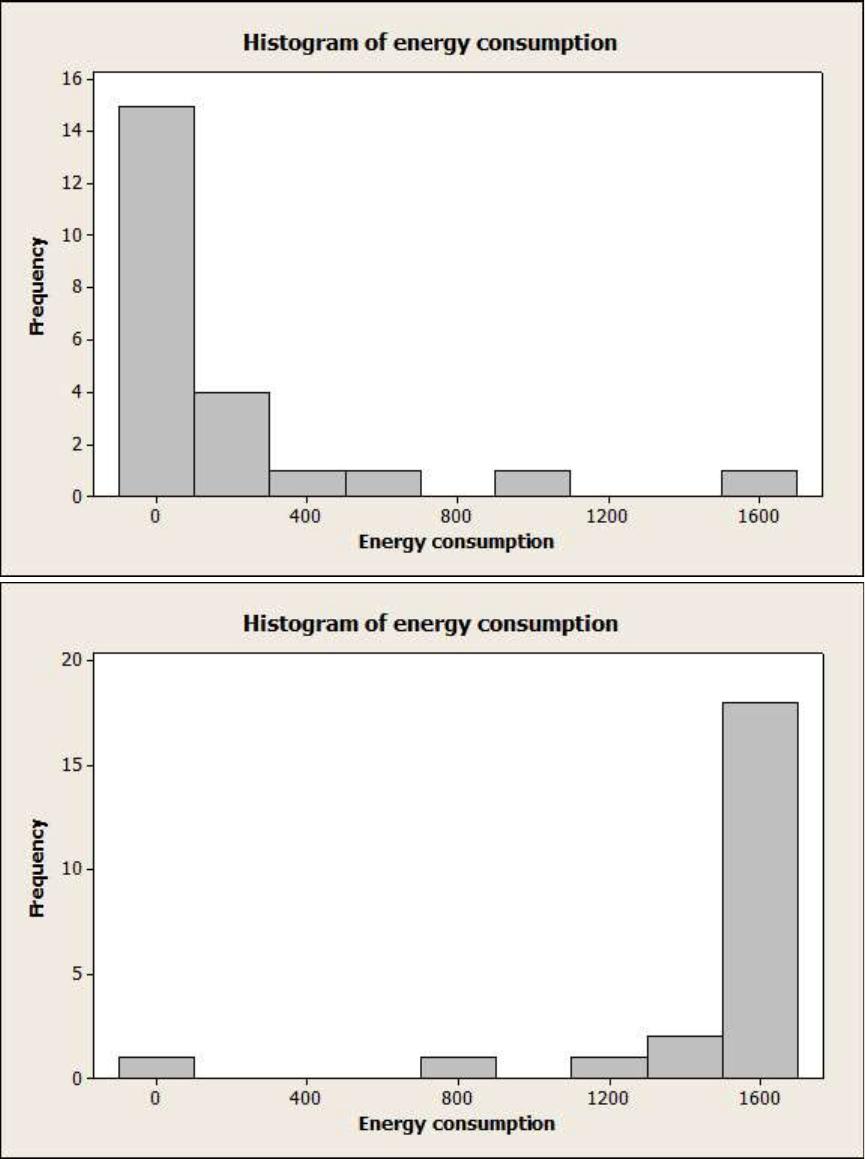
Construct a frequence distribution for these data. Use 9 bins.
Select the correct histogram.
A
B
C
D
E
SOLUTION
Class
100 100x−
100 300x
300 500x
500 700x
700 900x
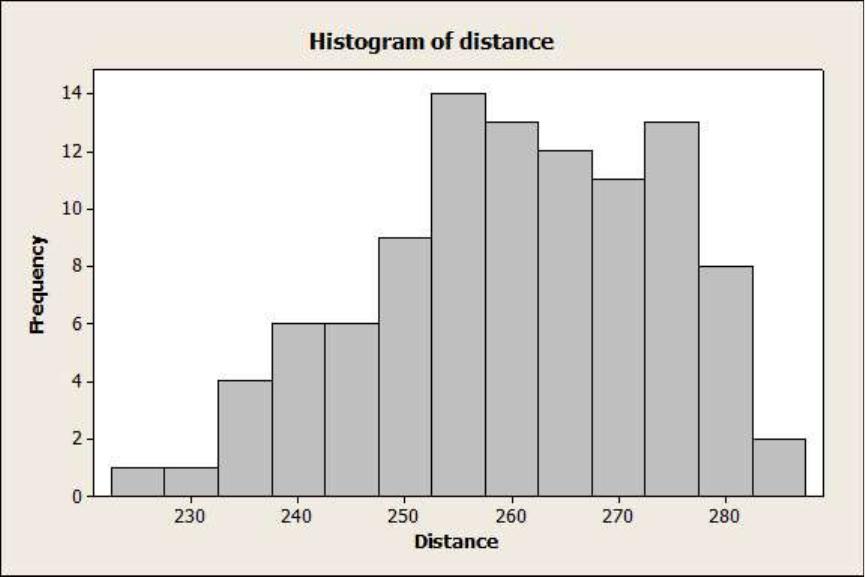
Reserve Problems Chapter 6 Section 3 Problem 7
The united States Golf Association tests golf balls to ensure that they conform to the rules of
golf. Balls are tested for weight, diameter, roundness and overall distance. The overall distance
test is conducted by hitting balls with a driver swung by a mechanical device nicknamed “Iron
Byron” after the legendary great Byron Nelson, whose swing the machine is said to emulate.
Following are 100 distances (in yards) achieved by a particular brand of golf ball in the overall
distance test.
261.3
259.4
265.7
270.6
274.2
261.4
254.5
283.7
258.1
270.5
255.1
268.9
267.4
253.6
234.3
263.2
254.2
270.7
233.7
263.5
244.5
251.8
259.5
257.5
257.7
272.6
253.7
262.2
252.0
280.3
274.9
233.7
237.9
274.0
264.5
244.8
264.0
268.3
272.1
260.2
255.8
260.7
245.5
279.6
237.8
278.5
273.3
263.7
241.4
260.6
280.3
272.7
261.0
260.0
279.3
252.1
244.3
272.2
248.3
278.7
236.0
271.2
279.8
245.6
241.2
251.1
267.0
273.4
247.7
254.8
272.8
270.5
254.4
232.1
271.5
242.9
273.6
256.1
251.6
256.8
273.0
240.8
276.6
264.5
264.5
226.8
255.3
266.6
250.2
255.8
285.3
255.4
240.5
255.0
273.2
251.4
276.1
277.8
266.8
268.5
Construct a frequence distribution for these data. Use 13 bins.
Select the correct histogram.
A
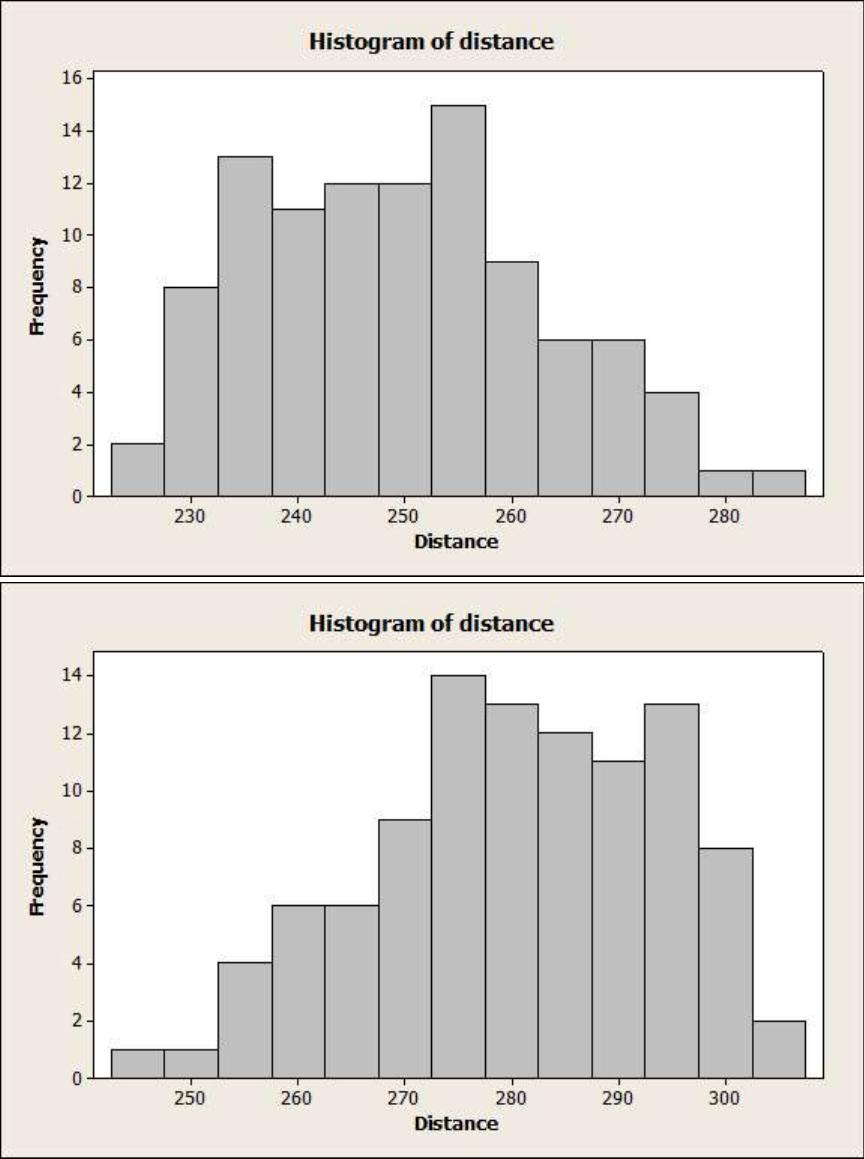
B
C
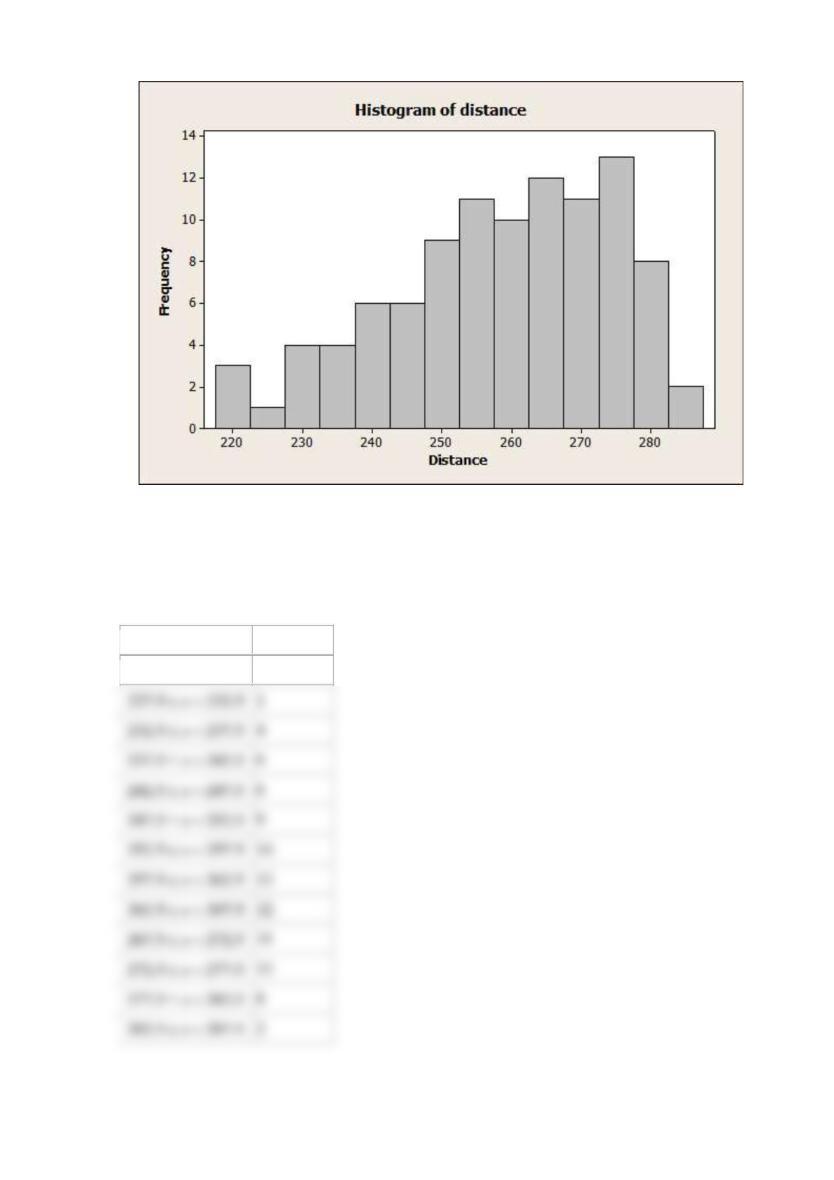
D
Does it convey the same information as the prsented stem-and-leaf display for this data?
SOLUTION
Class
Frequency
222.5 227.5x
1
227.5 232.5x
1
232.5 237.5x
4
237.5 242.5x
6
242.5 247.5x
6
247.5 252.5x
9
252.5 257.5x
14
257.5 262.5x
13
262.5 267.5x
12
267.5 272.5x
11
272.5 277.5x
13
277.5 282.5x
8
282.5 287.5x
2