Unlock document.
This document is partially blurred.
Unlock all pages and 1 million more documents.
Get Access
CHAPTER 6 RESERVE PROBLEMS
The following problems have been reserved for your use in assignments and testing and do not
appear in student versions of the text.
Reserve Problems Chapter 6 Section 1 Problem 1
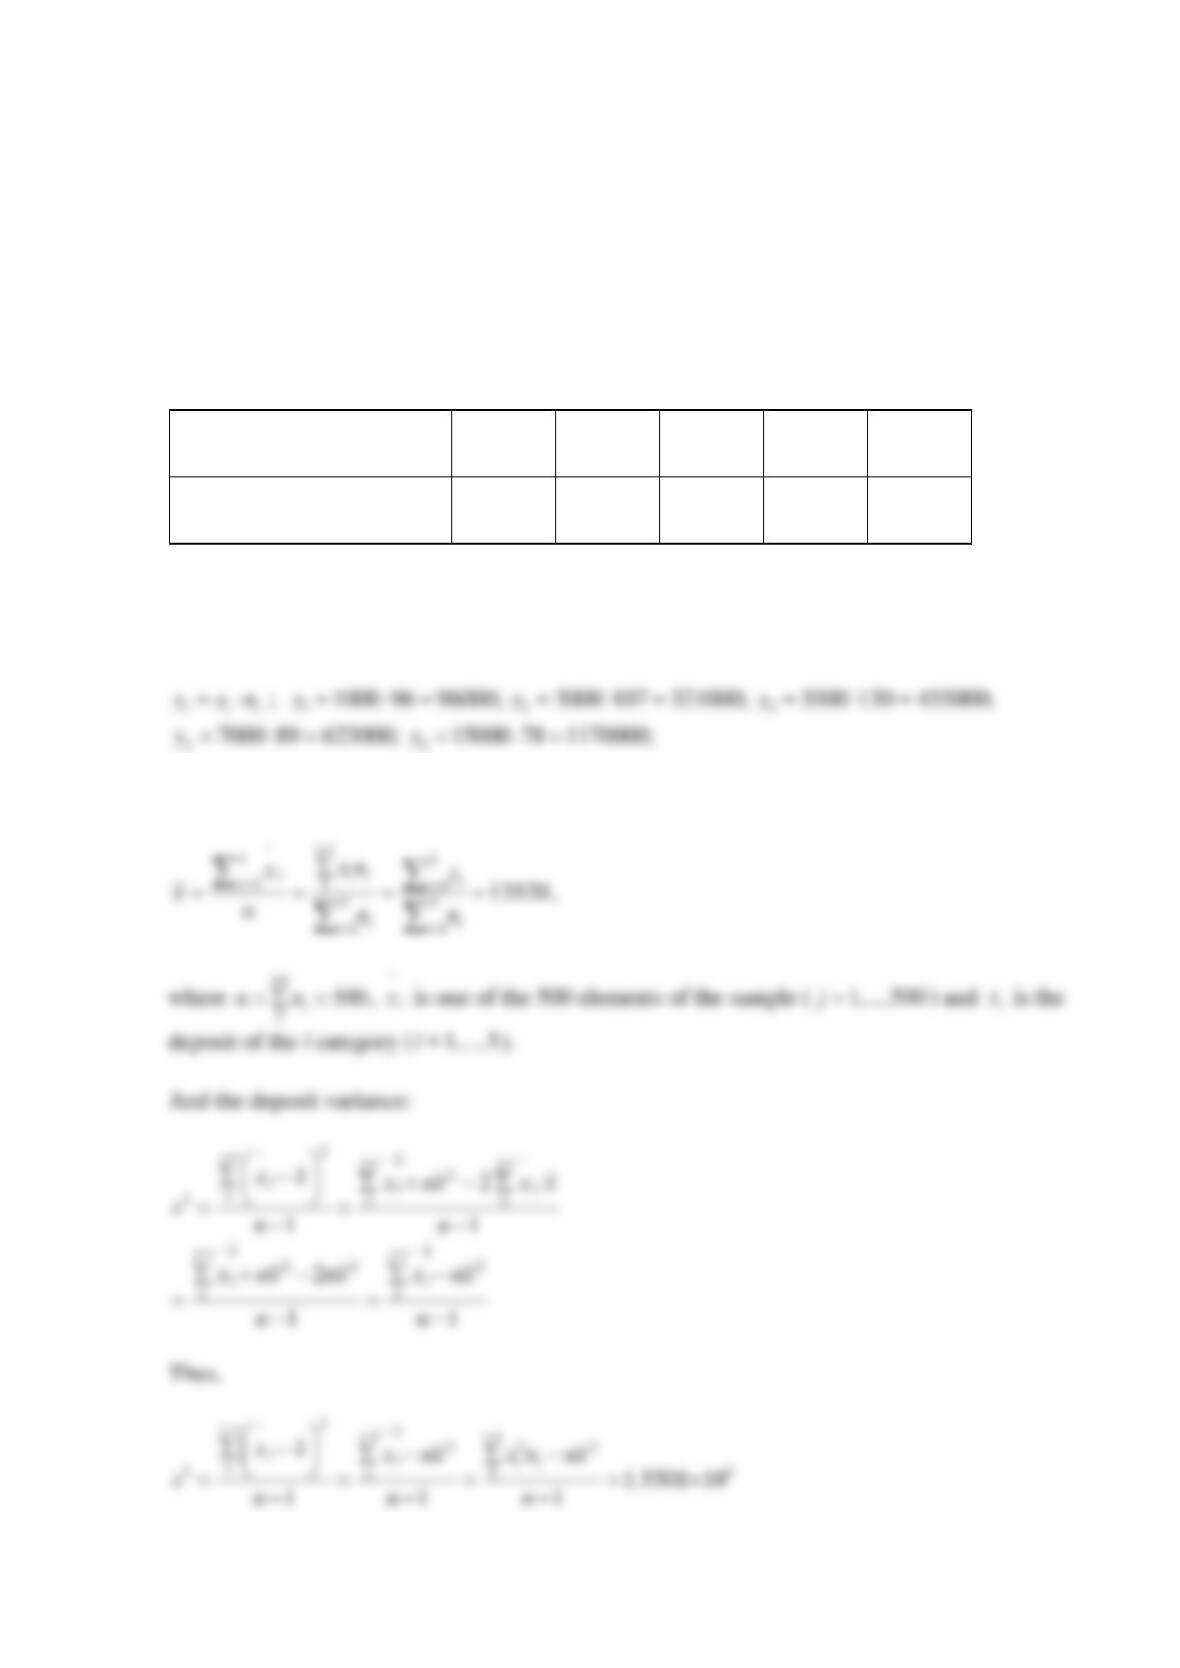
An independent research was made asking 500 people about their bank deposits. Using the data
in the table, calculate the deposit sample mean and deposit sample standard deviation.
SOLUTION
First of all, we need to multiple each deposit amount by the number of depositors:
Now calculate the deposit mean:
Amount of deposit, $
( )
i
x
1000
3000
3500
7000
15000
Number of depositors
( )
i
n
96
107
130
89
78
Reserve Problems Chapter 6 Section 1 Problem 2
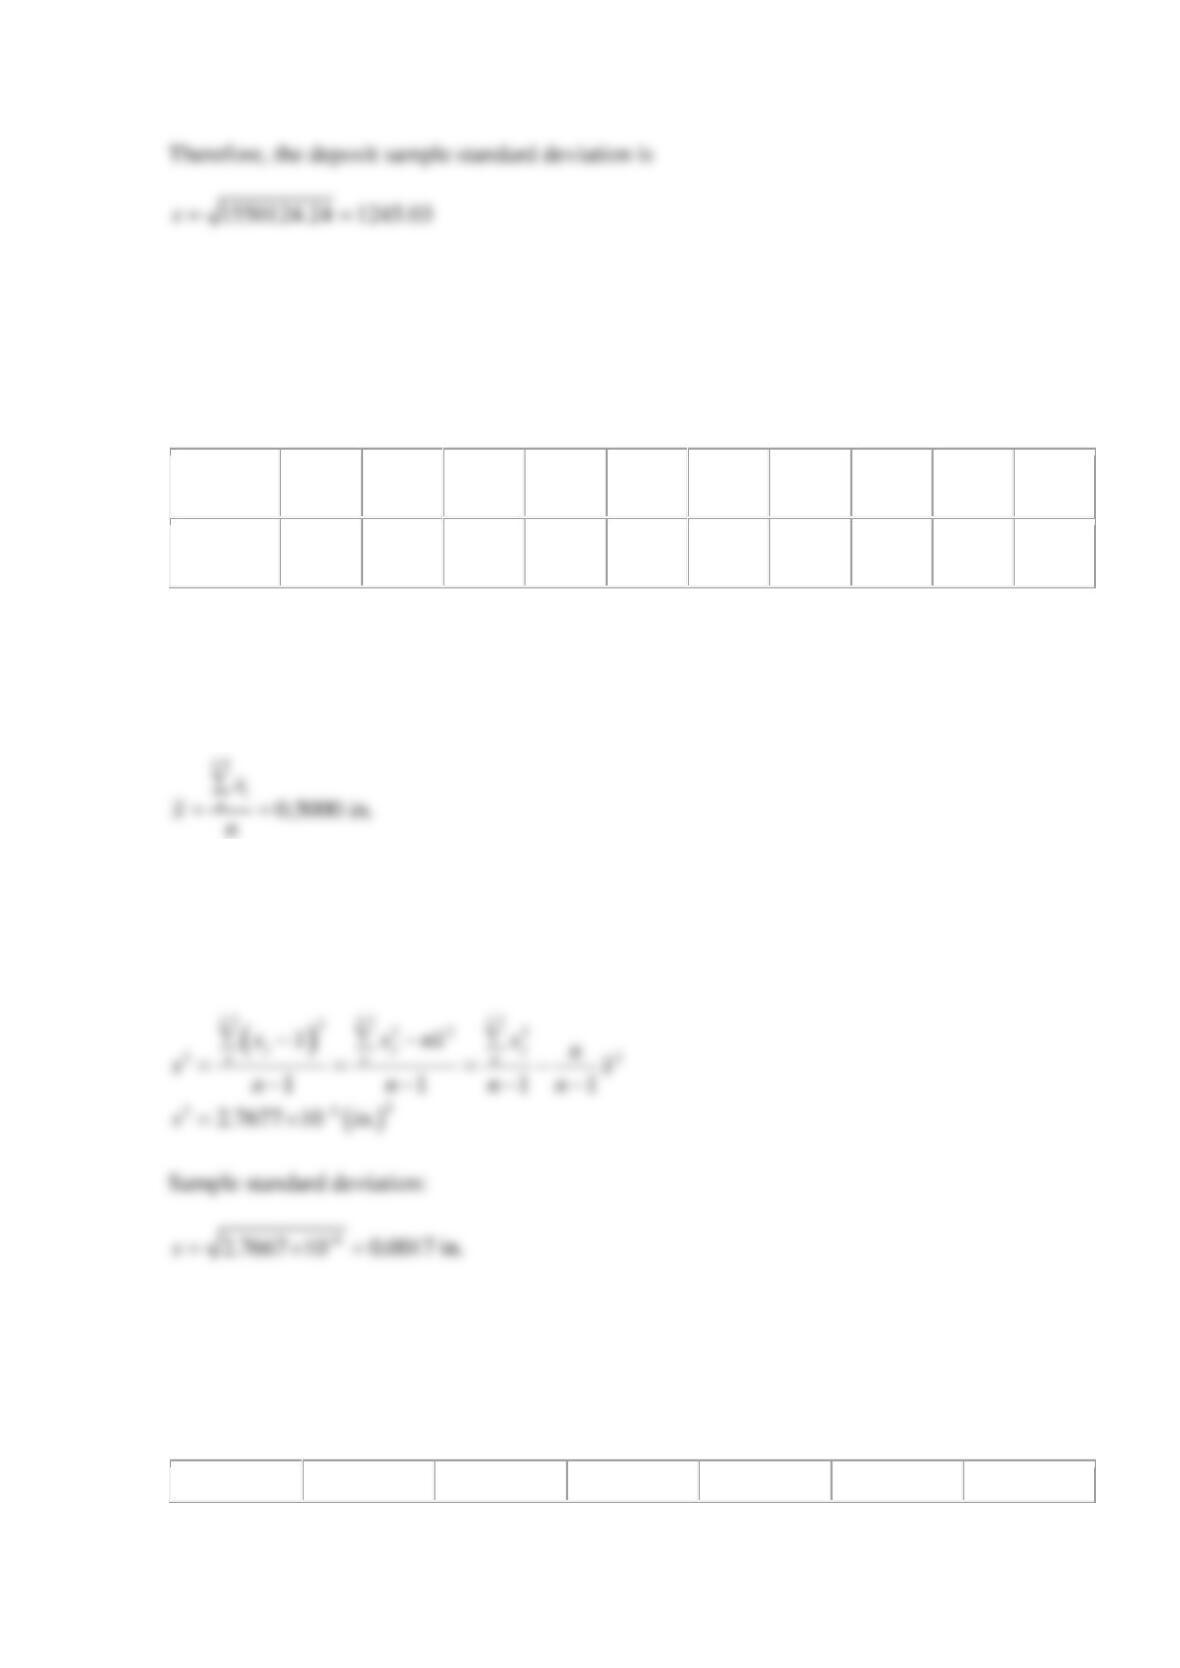
A consignment of 100 half-inch nuts was released from the factory. The diameters of 10
randomly taken nuts were measured. Calculate the sample mean and sample standard deviation
using the data in the table.
Number
of nut
1
2
3
4
5
6
7
8
9
10
Diameter,
inch
0.4983
0.5030
0.4982
0.4986
0.5010
0.5009
0.4984
0.4993
0.5014
0.5010
SOLUTION
Sample average:
Sample variance:
122.5001
j
j
n
x
=
=
Reserve Problems Chapter 6 Section 1 Problem 3
During the second part of April Chicago Bulls had 6 games with Boston Celtics. The number of
points, scored in each game is in the table. Calculate the sample mean and sample standard
deviation using the data in the table.
No
1
2
3
4
5
6
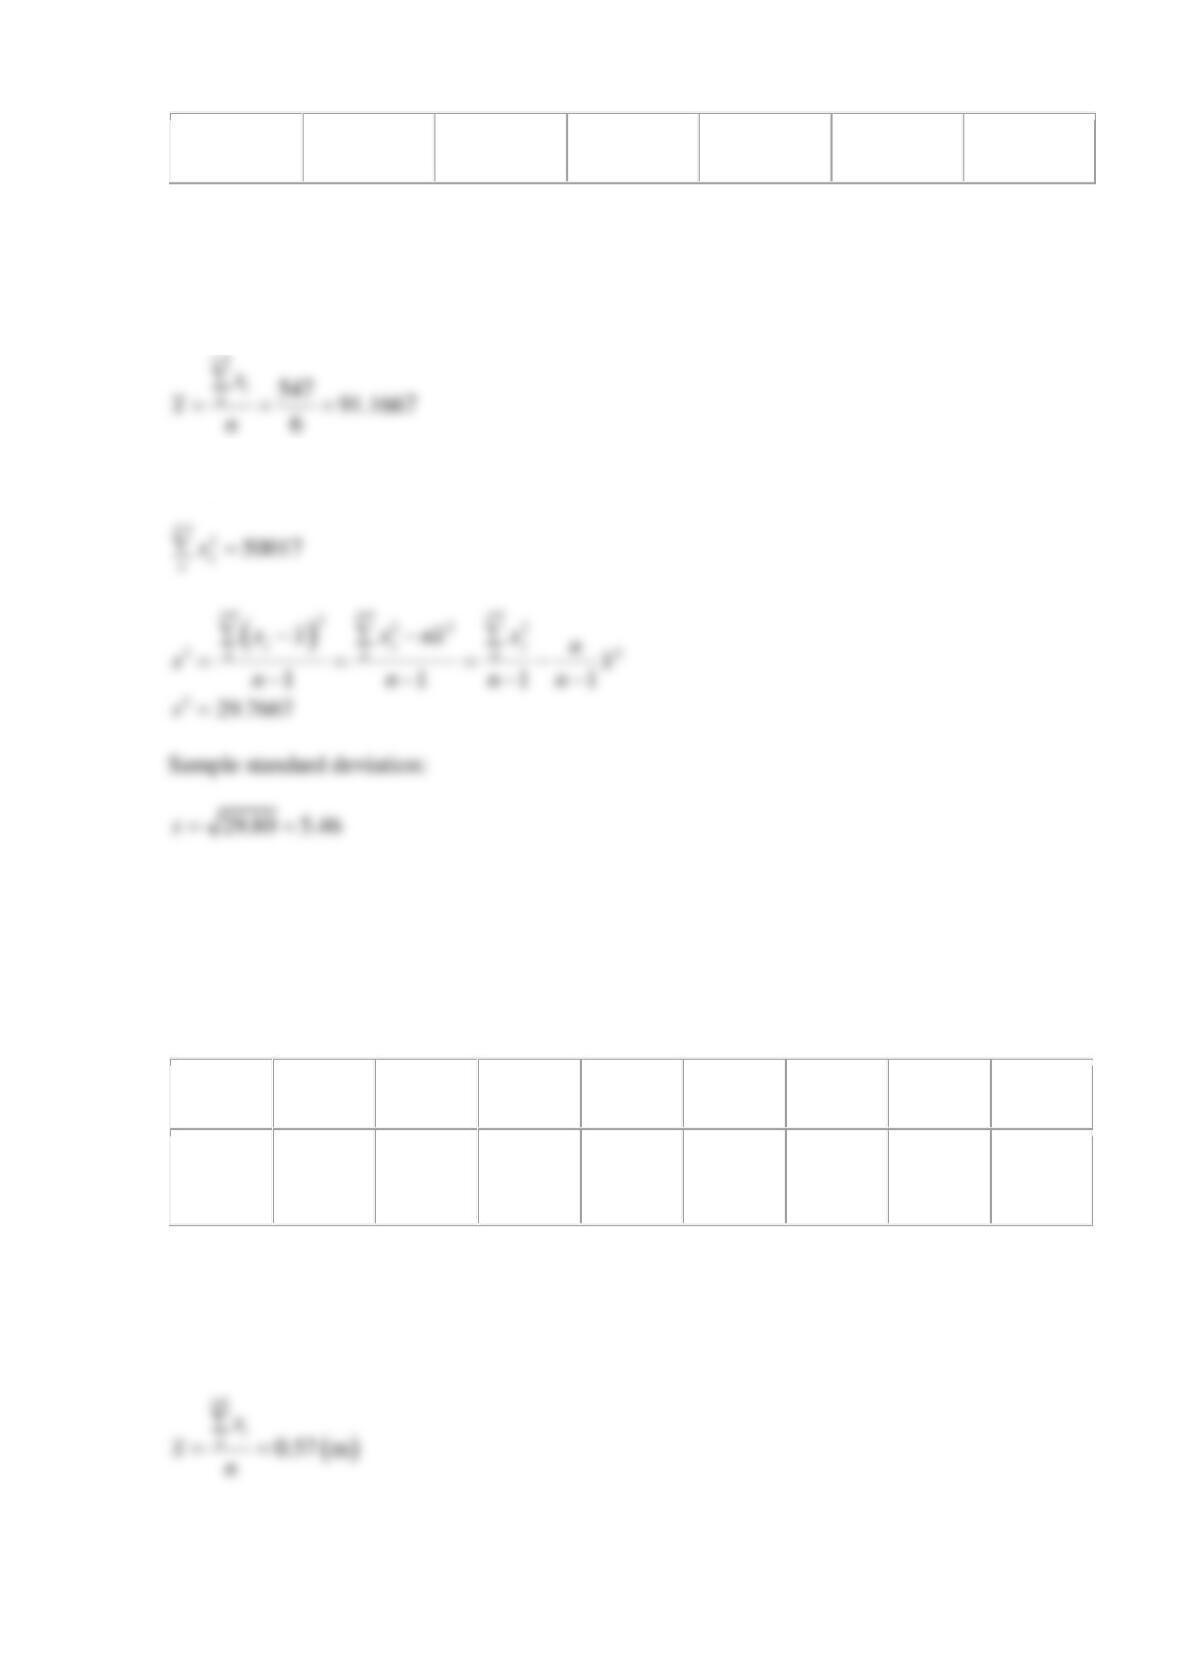
Number of
points
90
95
87
95
97
83
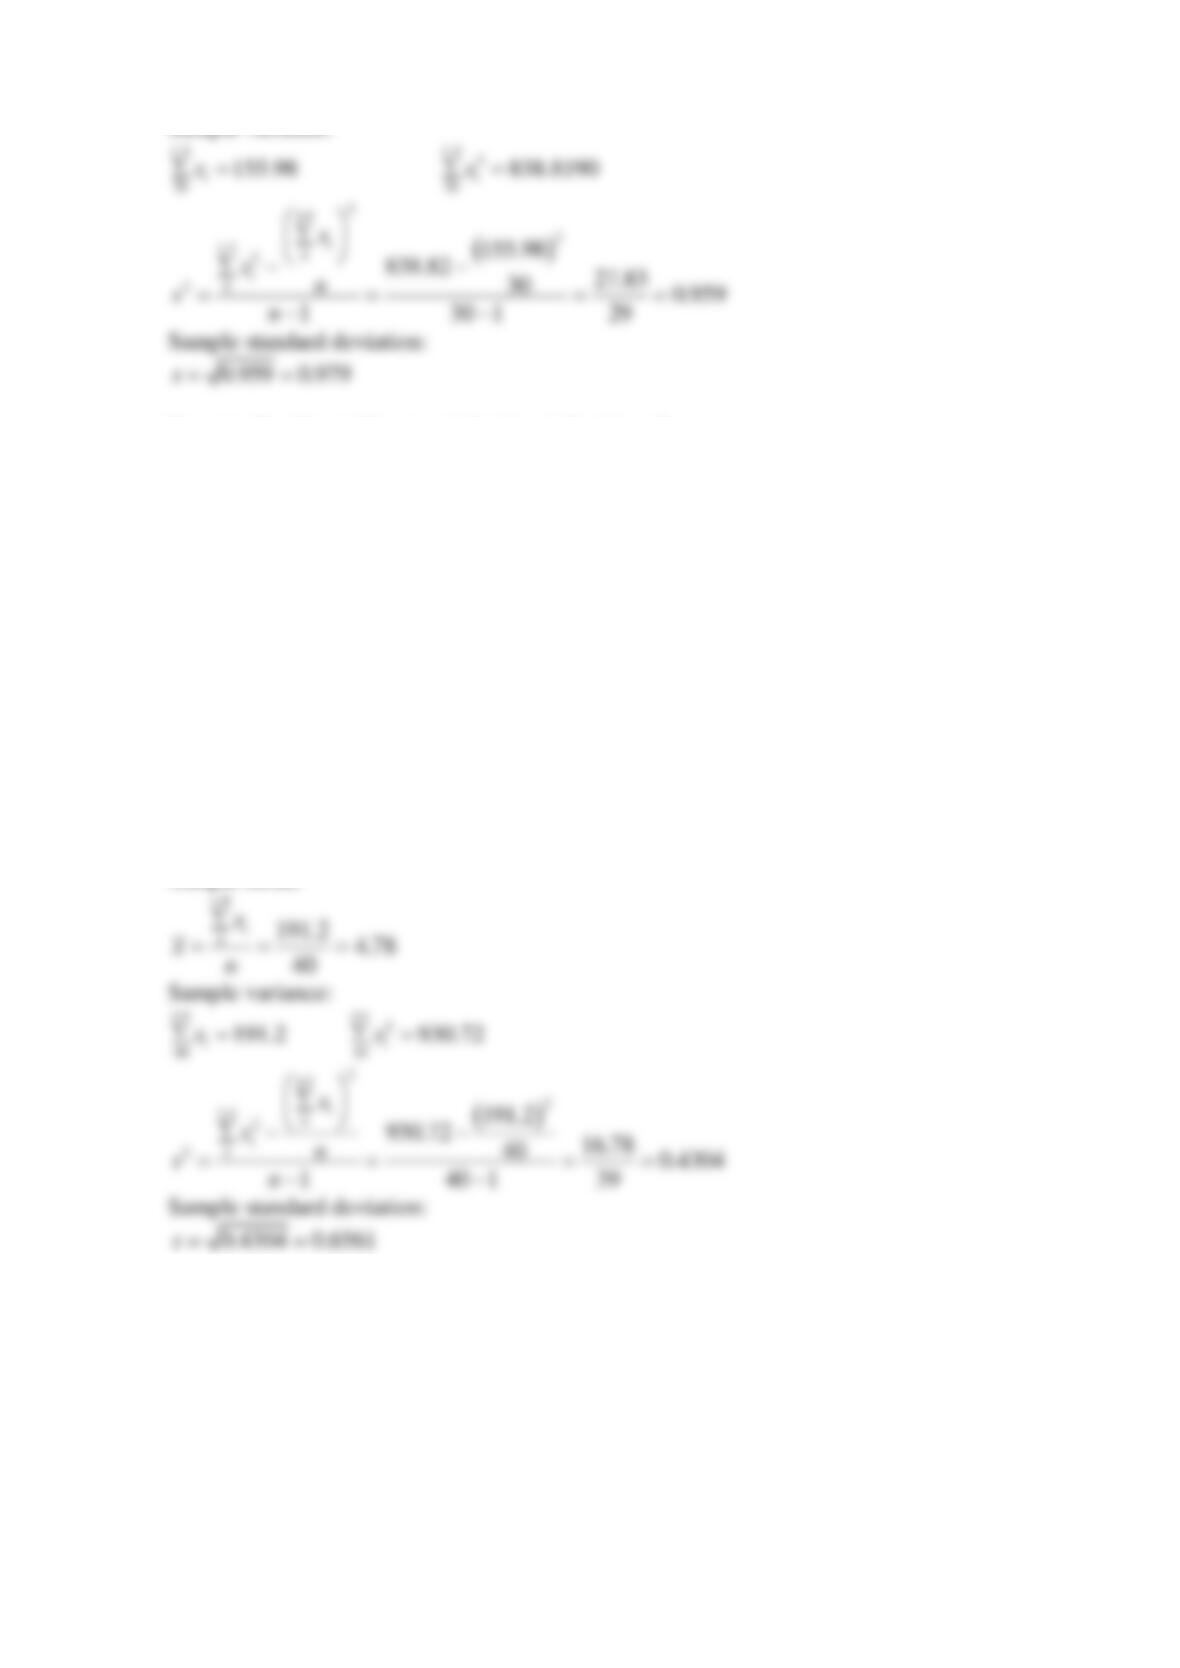
SOLUTION
Sample average:
Sample variance:
Reserve Problems Chapter 6 Section 1 Problem 4
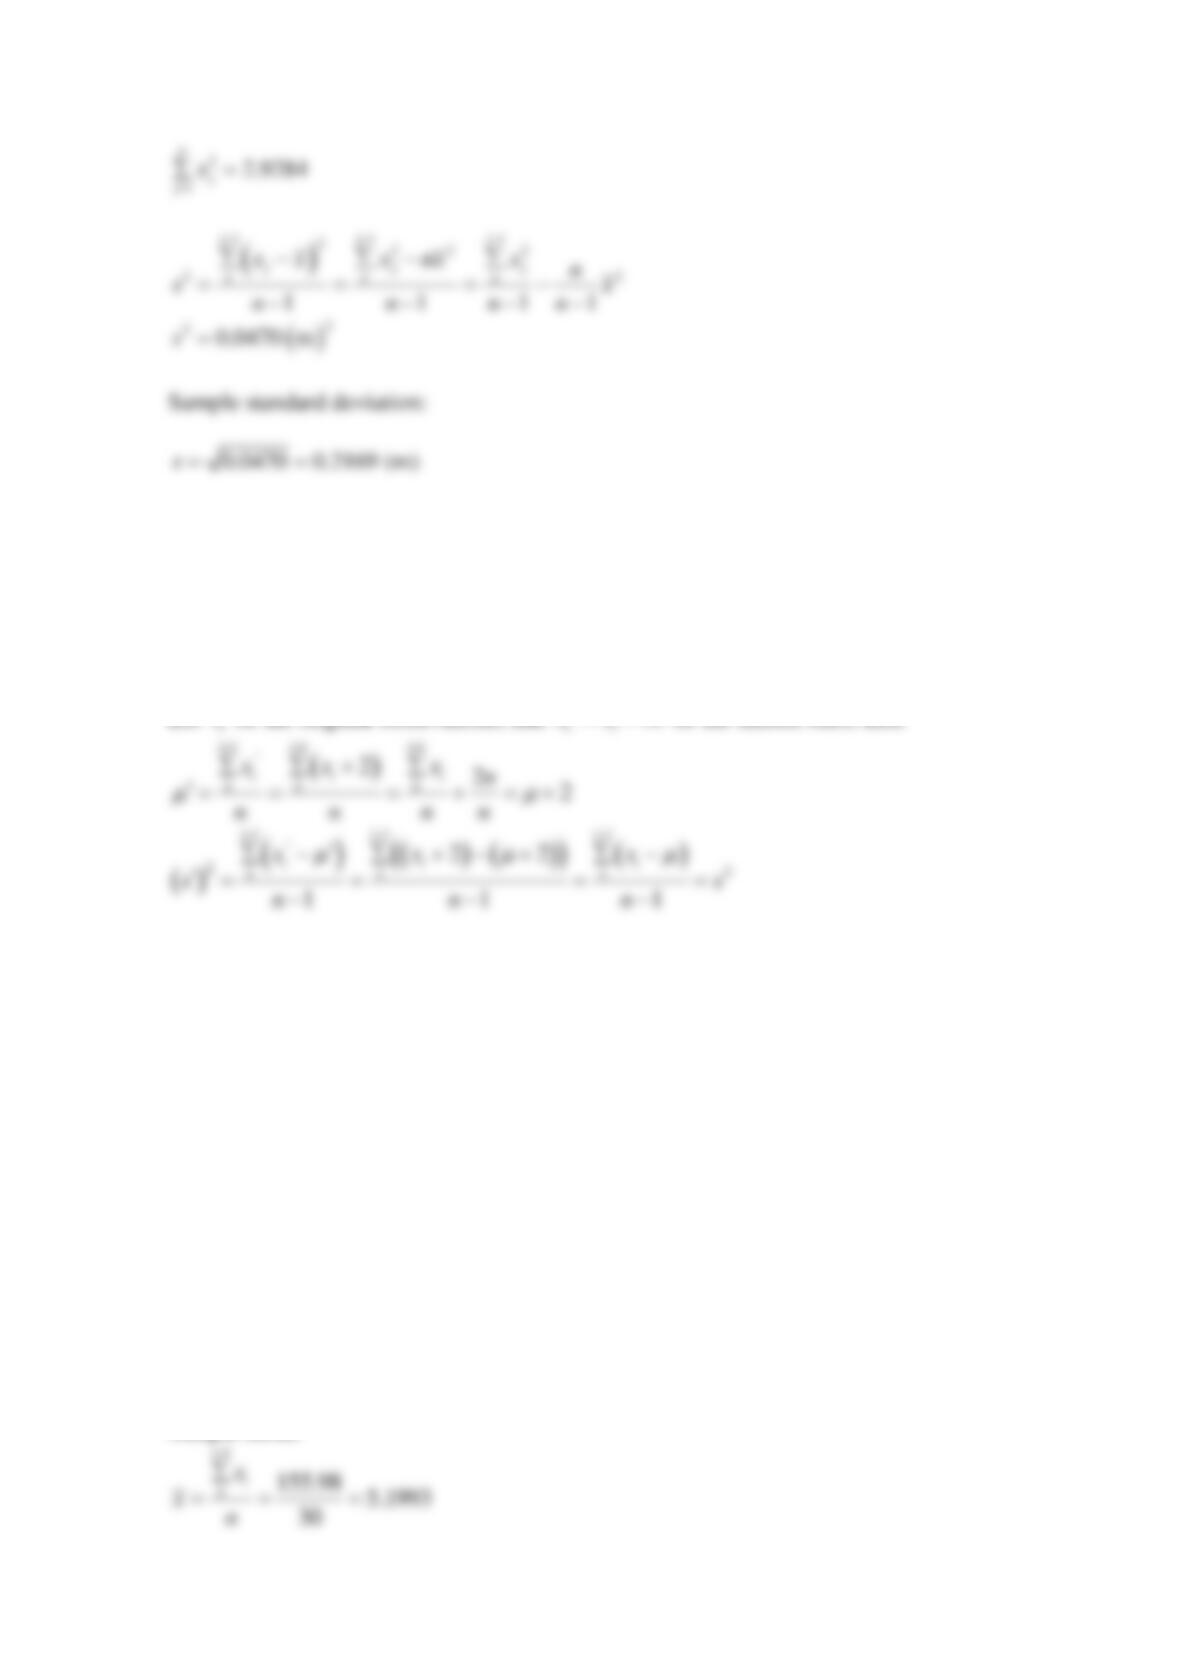
An independent research was made in a dog shelter to measure the heights of dogs of different
breeds. Eight dogs were evaluated for this experiment. The results are shown in the table below.
Calculate the sample mean and sample standard deviation using the data in the table.
Number
of dog
1
2
3
4
5
6
7
8
Dog’s
height,
m
0.75
0.15
0.35
0.60
0.62
0.58
0.75
0.76
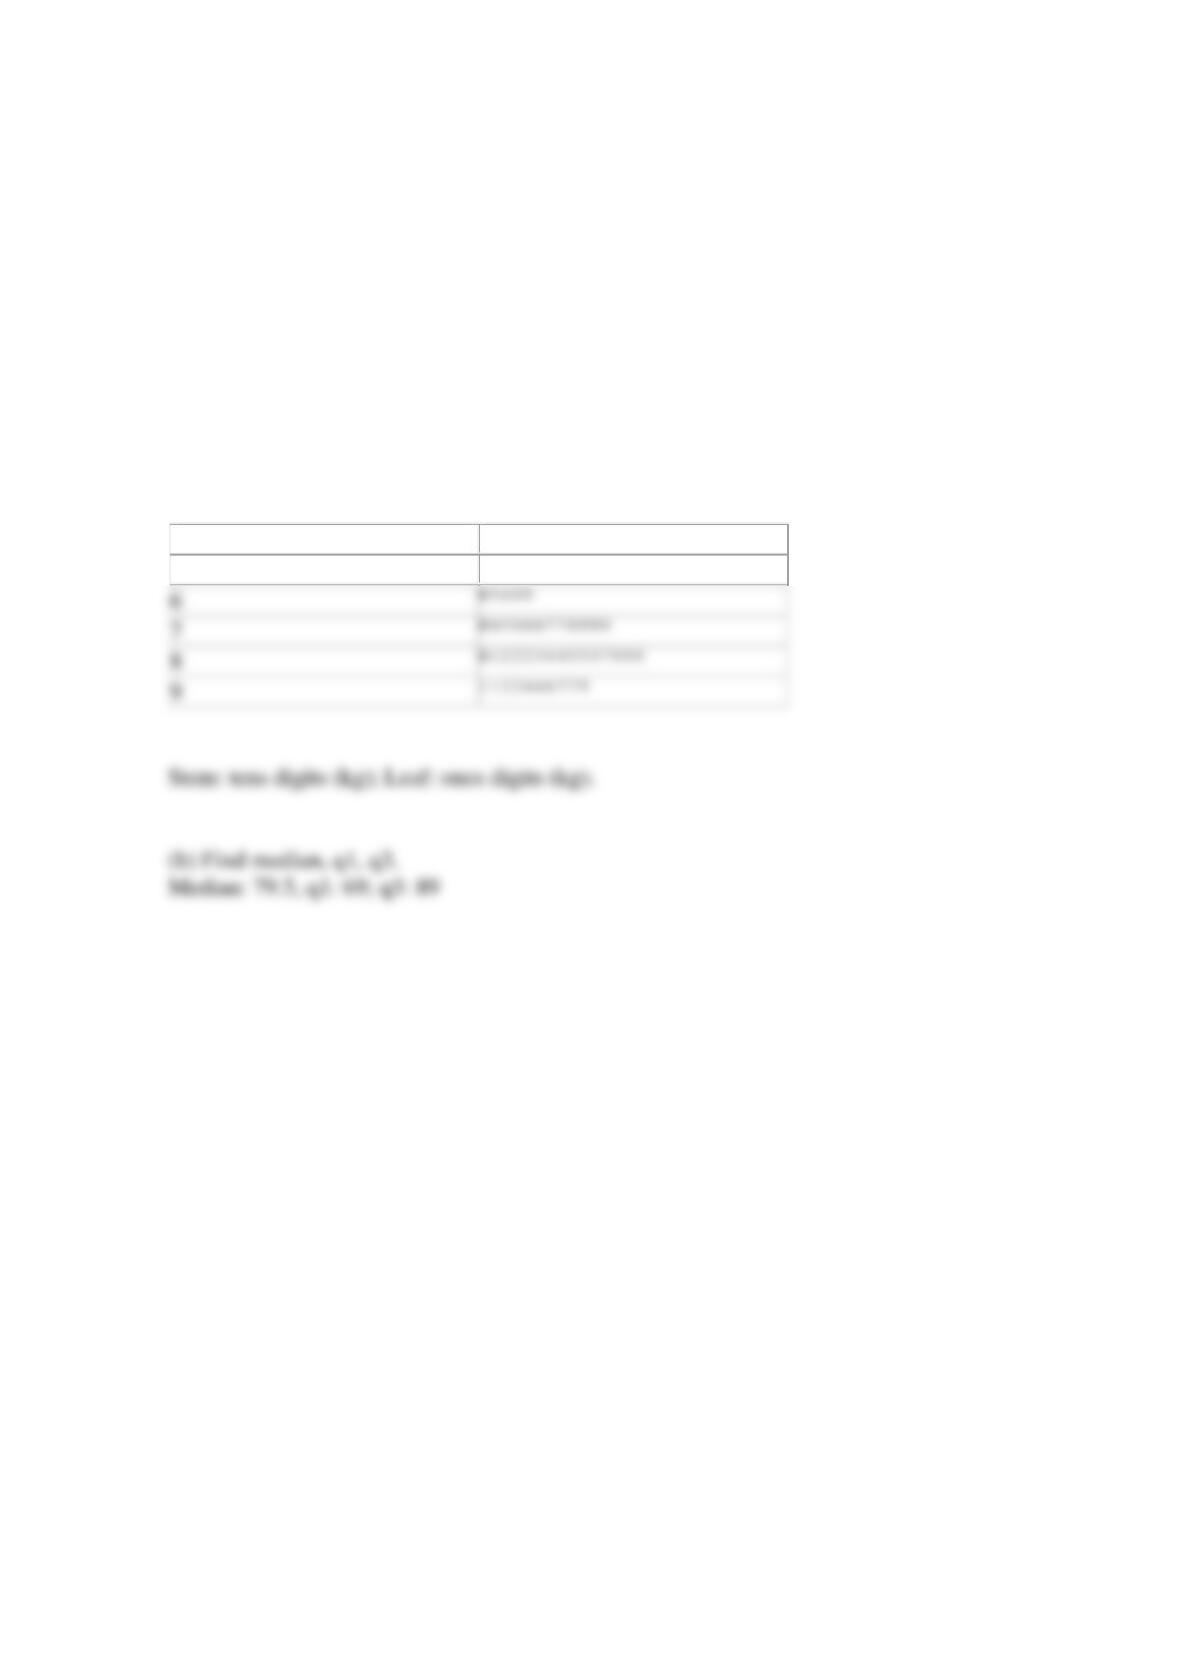
SOLUTION
Sample average:
Sample variance:
Reserve Problems Chapter 6 Section 1 Problem 5
Suppose that you add 2 to all observations in a sample. How does this change the sample mean?
How does it change the sample standard deviation?
SOLUTION
Let
x
be the original observations, and
10
xx
=+
be the shifted ones, then
Reserve Problems Chapter 6 Section 1 Problem 6
The United States has an aging infrastructure as witnessed by several recent disasters, including
the I-35 bridge failure in Minnesota. Most states inspect their bridges regularly and report their
condition (on a scale from 1–7) to the public.
Here are the condition numbers from a sample of 30 bridges
5.08
5.44
6.66
5.07
6.04
5.43
4.83
4.00
4.41
3.61
7.00
5.72
3.48
6.43
3.97
4.19
6.26
5.27
5.26
5.48
4.95
5.76
4.93
5.61
4.66
7.00
5.57
3.42
5.91
4.54
Find the sample mean and the sample standard deviation of these condition numbers.
SOLUTION
Sample mean:
Sample variance:
Reserve Problems Chapter 6 Section 1 Problem 7
In an attempt to measure the effects of acid rain, researchers measured the pH (7 is neutral and
values below 7 are acidic) of water collected from rain in Ingham County, Michigan.
5.47
5.37
5.38
4.63
4.34
5.02
3.71
4.96
4.64
5.94
5.54
5.39
4.16
5.62
4.57
5.90
5.48
4.57
4.57
4.51
4.62
4.56
4.61
4.32
3.98
5.56
4.15
3.98
5.65
3.10
5.04
4.62
4.88
4.34
4.16
4.64
5.12
3.71
4.80
5.59
Find the sample mean and sample standard deviation of these measurements.
SOLUTION
Sample mean:
Reserve Problems Chapter 6 Section 2 Problem 1
An independent research was made to calculate the mean weight of elder people in Russia. 50
men and women were interviewed for this research. Construct a stem-and-leaf diagram for the
data. Calculate the median and quartiles of these data. All values are in kg.
74
89
84
85
57
81
78
79
77
83
94
82
57
75
82
77
60
79
76
97
99
70
97
57
69
84
92
82
91
85
76
92
76
63
69
58
64
59
89
91
96
85
80
59
58
94
57
79
89
87
SOLUTION
(a) Construct a stem-and-leaf diagram.
Stem
Leaf
5
7 7 7 7 8 8 9 9
Reserve Problems Chapter 6 Section 2 Problem 2
An independent research was made to calculate the mean weight of elder people in Russia. 50
men and women were interviewed for this research. Calculate the sample median, mode, and
mean of the data. Explain how these three measures of location describe different features of the
data. All values are in kg.
74
89
84
85
57
81
78
79
77
83
94
82
57
75
82
77
60
79
76
97
99
70
97
57
69
84
92
82
91
85
76
92
76
63
69
58
64
59
89
91
94
85
80
59
58
94
57
79
89
87
SOLUTION
The median is halfway between 25th and 26th, so it is the average of the 25th and 26th values and
it equals 79.5.
Reserve Problems Chapter 6 Section 2 Problem 3
The table represents the answers of 80 respondents to the survey “How much sports trainings do
you have every year?” carried out among college students. Construct a stem-and-leaf diagram for
the data. Calculate the median and quartiles of these data.
129
157
154
191
192
142
188
126
128
180
190
166
157
147
155
154
200
128
167
143
131
156
153
168
149
144
155
188
149
142
160
149
184
187
169
161
157
134
122
173
188
183
178
148
135
188
187
166
121
177
169
182
158
169
146
173
133
189
183
143
148
121
181
145
189
120
122
189
146
190
128
142
189
131
199
182
197
148
157
140
SOLUTION
(a) Construct a stem-and-leaf diagram.
12
0 1 1 2 2 6 8 8 8 9
13
1 1 3 4 5
Reserve Problems Chapter 6 Section 2 Problem 4
The table represents the answers of 80 respondents to the survey “How much sports trainings do
you have every year?” carried out among college students. Calculate the sample median, mode,
and mean of the data. Explain how these three measures of location describe different features of
the data.
129
157
154
191
192
142
188
126
128
180
190
166
157
147
155
154
200
128
167
143
131
156
153
168
149
144
155
188
149
142
160
149
184
187
169
161
157
134
122
173
188
183
178
148
135
188
187
166
121
177
169
182
158
169
146
173
138
189
183
143
148
121
181
145
189
120
122
189
146
190
128
142
189
131
199
182
197
148
157
140
SOLUTION
The median is halfway between 40th and 41th, so it is the average of the 40th and 41th values and
it equals 157.
Reserve Problems Chapter 6 Section 2 Problem 5
The United States has an aging infrastructure as witnessed by several recent disasters, including
the I-35 bridge failure in Minnesota. Most states inspect their bridges regularly and report their
condition (on a scale from 1–7) to the public.
Here are the condition numbers from a sample of 30 bridges in New York State:
5.08
5.44
6.66
5.07
6.80
5.43
4.83
4.00
4.41
4.38
7.00
5.72
4.53
6.43
3.97
4.19
6.26
6.72
5.26
5.48
4.95
6.33
4.93
5.61
4.66
7.00
5.57
3.42
5.18
4.54
Choose the correct steam-and-leaf diagram.
A
N = 30
Leaf Unit = 0.10
1
3
4
2
3
9
6
4
0134
12
4
556899
(7)
5
0012444
11
5
567
8
6
234
5
6
678
2
7
00
B
N = 30
Leaf Unit = 0.010
1
3
4
2
3
9
6
4
0134
12
4
556899
(7)
5
0012444
11
5
567
8
6
234
5
6
678
2
7
00
C
N = 30
Leaf Unit = 0.10
1
3
4
2
3
9
6
4
0134
13
4
556899
(5)
5
0012444
11
5
567
8
6
234
5
6
678
2
7
00
D
N = 30
Leaf Unit = 0.010
1
3
4
2
3
9
6
4
0134
12
4
556899
(5)
5
0012444
11
5
567
8
6
234
5
6
678
1
7
00
Do any of the bridges appear to have unusually good or poor ratings? If so, compute the mean
with and without these bridges and comment.
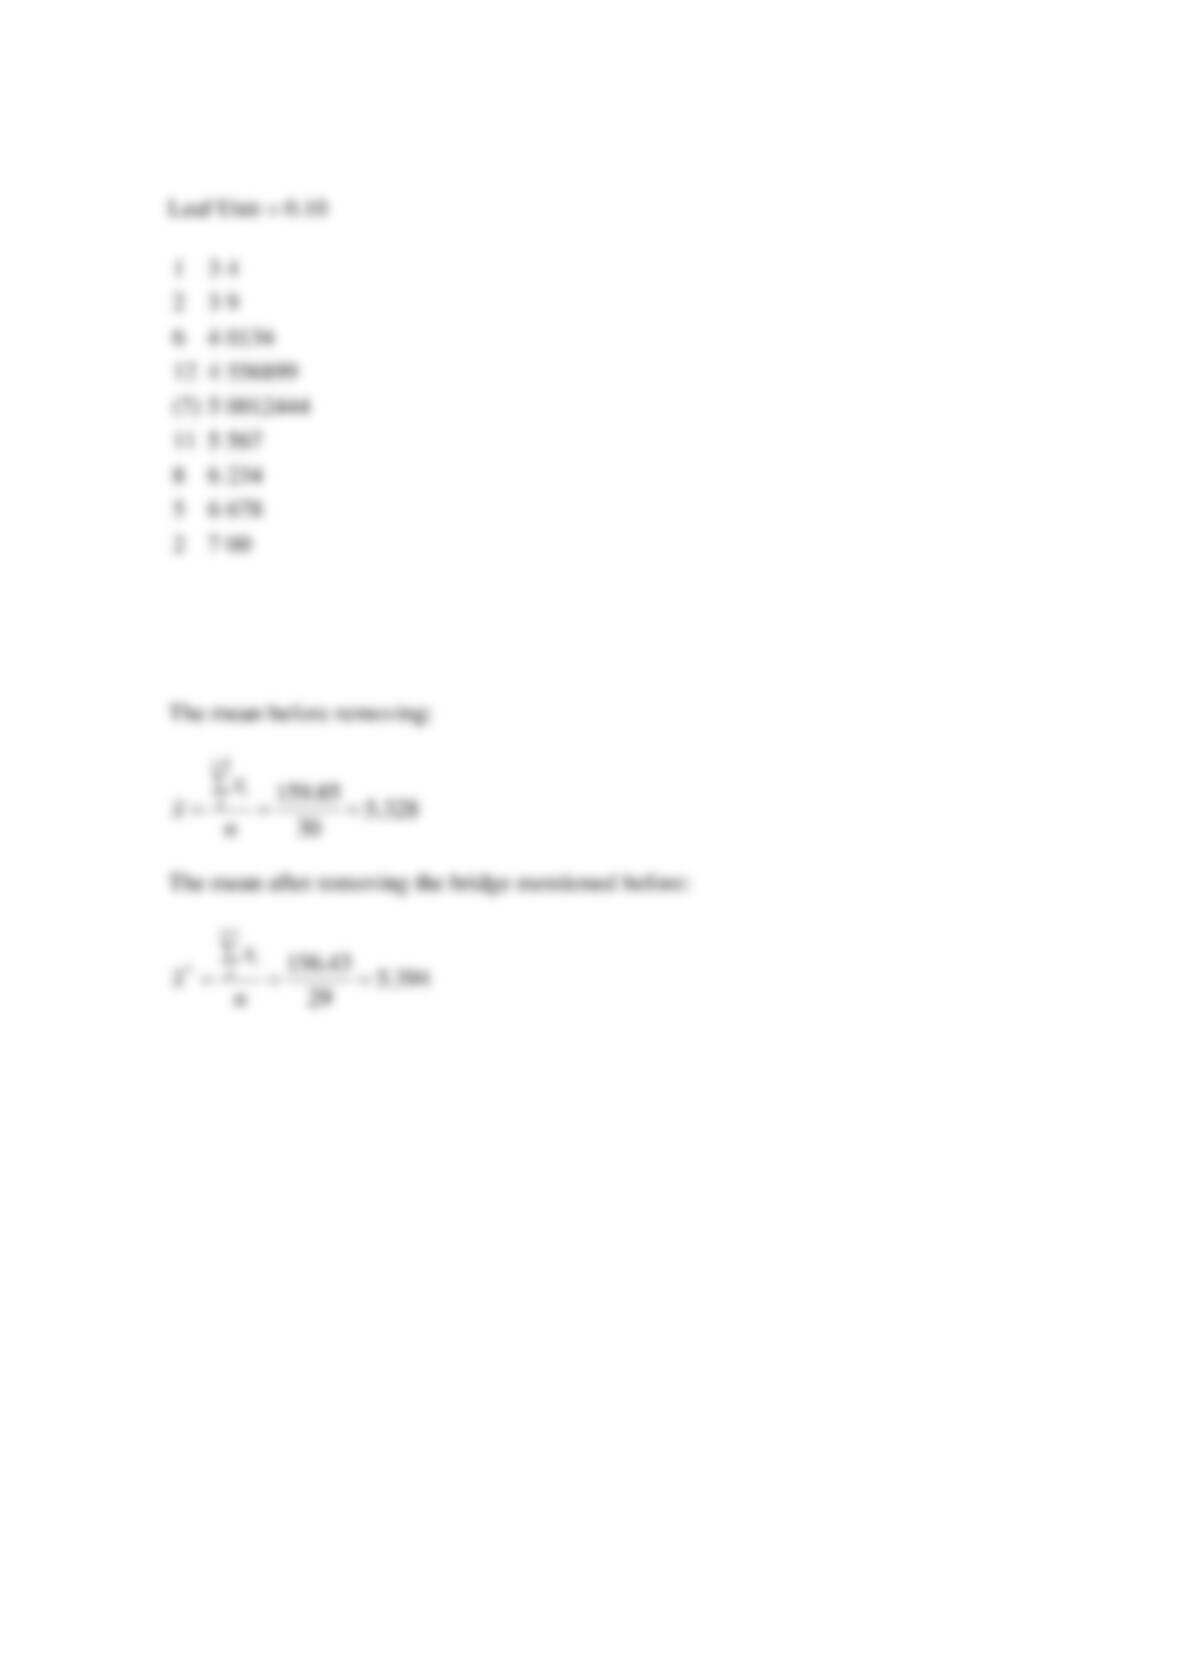
SOLUTION
(a) N = 30
(b) One particular bridge has poor rating of 3.4.
Reserve Problems Chapter 6 Section 2 Problem 6
In an attempt to measure the effects of acid rain, researchers measured the pH (7 is neutral and
values below 7 are acidic) of water collected from rain in Ingham County, Michigan.
5.47
5.37
5.38
4.63
5.37
3.74
3.71
4.96
4.64
5.11
5.65
5.39
4.16
5.62
4.57
4.64
5.48
4.57
4.57
4.51
4.86
4.56
4.61
4.32
3.98
5.70
4.15
3.98
5.65
3.10
5.04
4.62
4.51
4.34
4.16
4.64
5.12
3.71
4.64
5.59
Select the correct stem-and-leaf diagram.
A
N=40. Leaf Unit = 0.10
1
3
1
4
3
777
6
3
99
9
4
111
11
4
33
17
4
555555
(7)
4
6666666
16
4
89
14
5
011
11
5
3333
7
5
445
4
5
6667
B
N=40. Leaf Unit = 0.010
1
3
1
4
3
777
6
3
99
9
4
111
11
4
33
17
4
555555
(7)
4
6666666
16
4
89
14
5
011
11
5
3333
7
5
445
4
5
6667
C
N=40. Leaf Unit = 0.10
1
3
1
4
3
777
6
3
99
9
4
111
11
4
33
17
4
555555
(6)
4
666666
16
4
89
14
5
011
11
5
3333
7
5
445
4
5
6667
D
N=40. Leaf Unit = 0.10
1
3
1
3
3
77
6
3
999
9
4
111
11
4
33
17
4
555555
(6)
4
666666
16
4
89
14
5
0111
10
5
333
7
5
445
4
5
6667
Many scientists consider rain with pH below 5.3 to be acid rain. What percentage of these
samples could be consider as acid rain?
SOLUTION
Reserve Problems Chapter 6 Section 2 Problem 7
The following data represent the yield on 90 consecutive batches of ceramic substrate to which a
metal coating has been applied by a vapor-deposition process.
94.1
86.1
95.3
84.9
88.8
84.6
94.4
84.1
93.2
90.4
94.1
78.3
86.4
83.6
96.1
83.7
90.6
89.1
97.8
89.6
85.1
85.4
98.0
82.9
91.4
87.3
93.1
90.3
84.0
89.7
85.4
87.3
88.2
84.1
86.4
93.1
93.7
87.6
86.6
86.4
86.1
90.1
87.6
94.6
87.7
85.1
91.7
84.5
95.1
95.2
94.1
96.3
90.6
89.6
87.5
90.0
86.1
92.1
94.7
89.4
90.0
84.2
92.4
94.3
96.4
91.1
88.6
90.1
85.1
87.3
93.2
88.2
92.4
84.1
94.3
90.5
86.6
86.7
86.4
90.6
82.6
97.3
95.6
91.2
83.0
85.0
89.1
83.1
96.8
88.3
Select the correct stem-and-leaf display for these data.
A
N=90. Leaf Unit = 1
1
7e|8
7
8t|223333
21
8f|44444444555555
38
8s|66666666667777777
(11)
8e|88888999999
41
9z|00000000001111
27
9t|22223333
19
9f|444444445555
7
9s|666677
1
9e|8
B
N=90. Leaf Unit = 10
1
7e|8
7
8t|223333
21
8f|44444444555555
38
8s|66666666667777777
(13)
8e|88888999999
41
9z|00000000001111
27
9t|22223333
19
9f|444444445555
7
9s|666677
1
9e|8
C
N=90. Leaf Unit = 1
1
7e|8
6
8t|223333
14
8f|44444444555555
17
8s|66666666667777777
(11)
8e|88888999999
14
9z|00000000001111
8
9t|22223333
12
9f|444444445555
6
9s|666677
1
9e|8
D
N=90. Leaf Unit = 10
1
7e|8
7
8t|223333
20
8f|4444444555555
37
8s|6666666667777777
(11)
8e|88888999999
39
9z|000000000111
27
9t|22223333
18
9f|44444445555
7
9s|666677
1
9e|8
Calculate the median of these data. Calculate the quartiles of these data.
Reserve Problems Chapter 6 Section 2 Problem 8
The net energy consumption (in billions of kilowatt-hours) for countries in Asia in 2003 was as
follows
Billions of Kilowatt-Hours
Afghanistan
1.04
Australia
200.66
Bangladesh
16.20
Burma
6.88
China
1671.23
Hong Kong
38.43
India
519.04
Indonesia
101.80
Japan
946.27
Korea, North
17.43
Korea, South
303.33
Laos
3.30
Malaysia
73.63
Mongolia
2.91
Nepal
2.30
New Zealand
37.03
Pakistan
71.54
Philippines
44.48
Singapore
30.89
Sri Lanka
6.80
Taiwan
154.34
Thailand
107.34
Vietnam
36.92
Total
4393.8
Select the correct stem-and-leaf display of these data.
A
N=23, Leaf Unit = 100
(18)
0|000000000000000111
5
0|23
3
0|5
2
0|9
1
1|6
B
N=24, Leaf Unit = 100
(18)
0|000000000000000111
6
0|23
4
0|5
3
0|9
2
1|6
1
4|3
C
N=23, Leaf Unit = 100
(17)
0|00000000000000111
5
0|23
3
0|5
2
0|9
1
1|6
D
N=24, Leaf Unit = 100
(19)
0|0000000000000000111
5
0|23
3
0|5
2
0|9
1
1|6
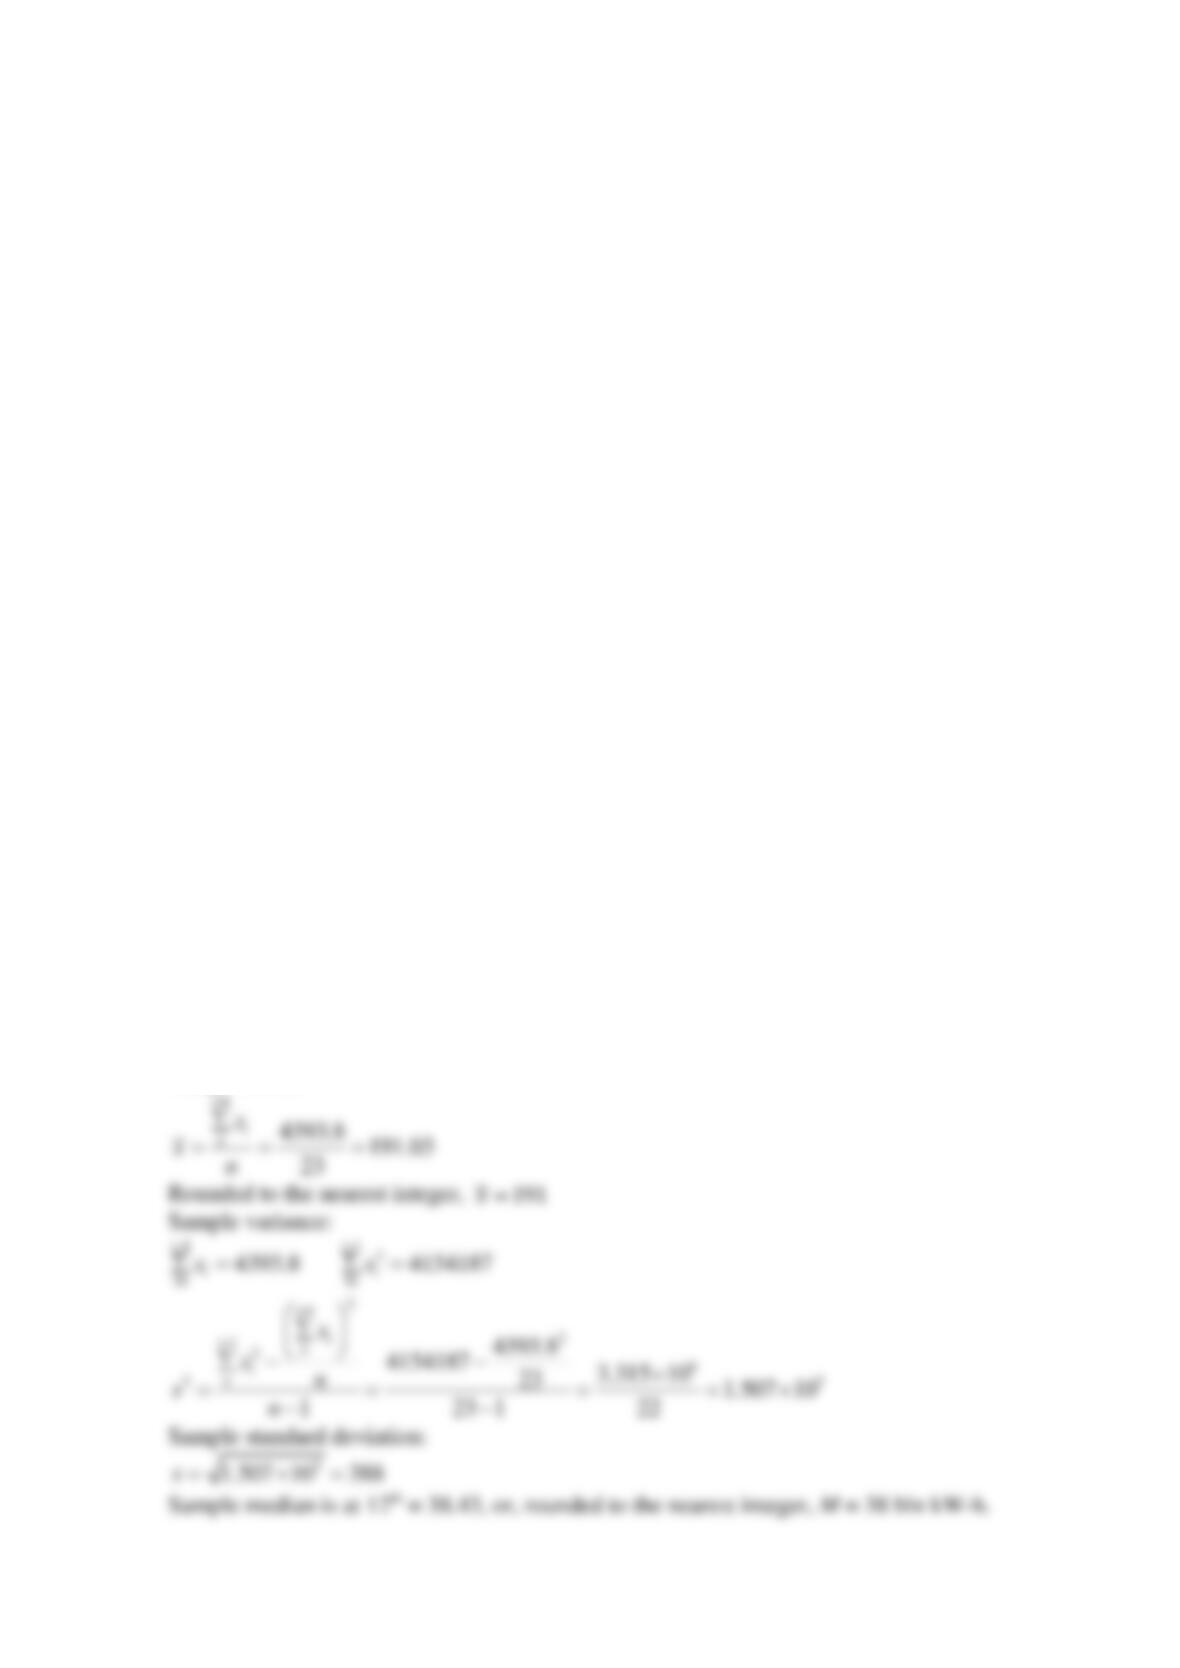
Compute the sample mean, sample standard deviation, and sample median:
SOLUTION
Do not use the total as an observation. There are 23 observations. (N=23, Leaf Unit = 100)
Sample mean:
Reserve Problems Chapter 6 Section 2 Problem 9
The United States Golf Association tests golf balls to ensure that they conform to the rules of
golf. Balls are tested for weight, diameter, roundness, and overall distance. The overall distance
test is conducted by hitting balls with a driver swung by a mechanical device nicknamed “Iron
Byron” after the legendary great Byron Nelson, whose swing the machine is said to emulate.
Following are 100 distances (in yards) achieved by a particular brand of golf ball in the overall
distance test.
261.3
259.4
265.7
270.6
274.2
261.4
254.5
283.7
258.1
270.5
255.1
268.9
267.4
253.6
234.3
263.2
254.2
270.7
233.7
263.5
244.5
251.8
259.5
257.5
257.7
272.6
253.7
262.2
252.0
280.3
274.9
233.7
237.9
274.0
264.5
244.8
264.0
268.3
272.1
260.2
255.8
260.7
245.5
279.6
237.8
278.5
273.3
263.7
241.4
260.6
230.3
272.7
261.0
260.0
279.3
252.1
244.3
272.2
248.3
278.7
236.0
271.2
279.8
245.6
241.2
251.1
267.0
273.4
247.7
254.8
272.8
270.5
254.4
232.1
271.5
242.9
273.6
256.1
251.6
256.8
273.0
240.8
276.6
264.5
264.5
226.8
255.3
266.6
250.2
255.8
285.3
255.4
240.5
255.0
273.2
251.4
276.1
277.8
266.8
268.5
Select the correct stem-and-leaf diagram for these data.
A
N=100, Leaf Unit = 1
1
22|6
5
23|2334
8
23|677
16
24|00112444
20
24|5578
33
25|0111122334444
46
25|5555556677899
(15)
26|000011123334444
39
26|56677888
31
27|0000112222233333444
12
27|66788999
4
28|003
1
28|5
B
N=100, Leaf Unit = 1
1
22|6
5
23|2334
8
23|677
16
24|00112444
20
24|5578
33
25|0111122334444
46
25|5555556677899
(14)
26|00011123334444
39
26|56677888
31
27|0000112222233333444
12
27|66788999
4
28|003
1
28|5
C
N=100, Leaf Unit = 1
1
22|6
5
23|2334
8
23|677
16
24|00112444
20
24|5578
33
25|0111122334444
46
25|5555556677899
(16)
26|0000111123334444
39
26|56677888
31
27|0000112222233333444
12
27|66788999
4
28|003
1
28|5
D
N=100, Leaf Unit = 1
1
22|6
5
23|2334
8
23|677
16
24|00112444
20
24|5578
34
25|01111122334444
45
25|555556677899
(15)
26|000011123334444
40
26|566778888
30
27|000011222233333444
12
27|66788999
4
28|003
1
28|5
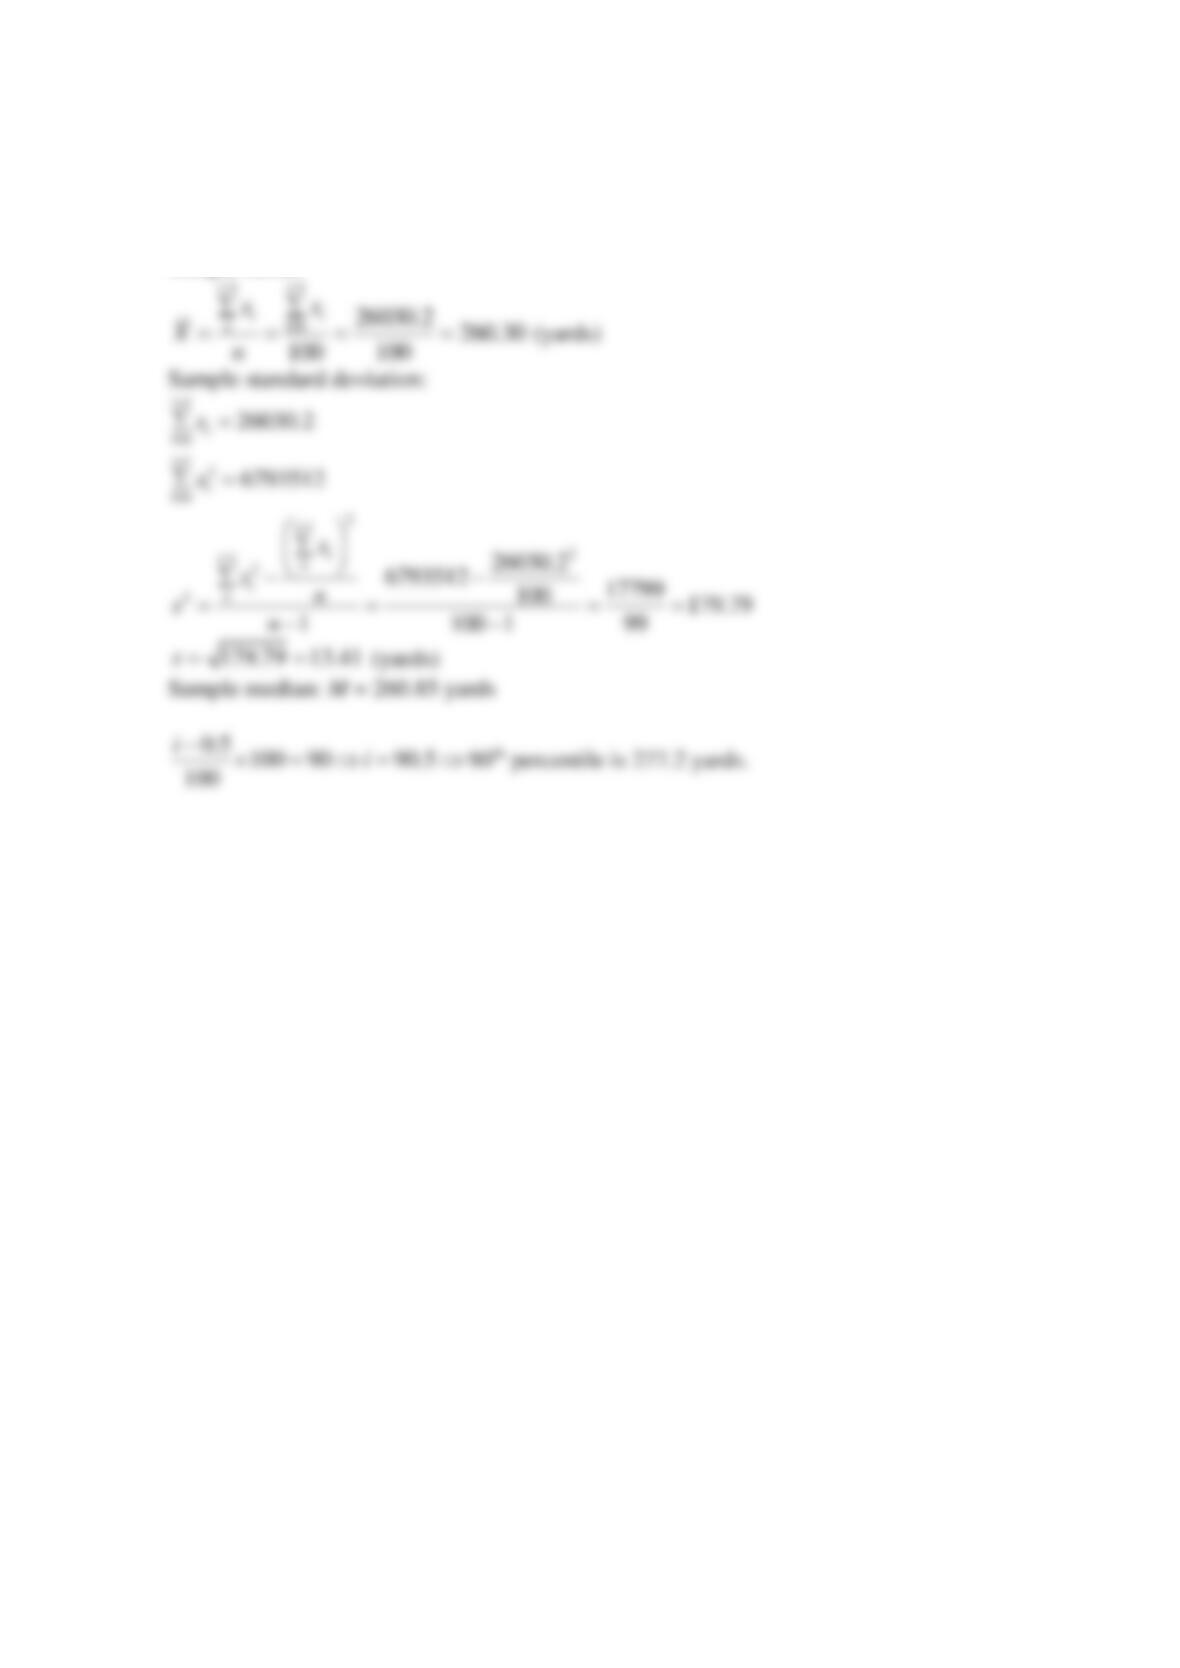
Compute the sample mean, sample standard deviation, and the sample median.
What is the 90th percentile of distances?
SOLUTION
Sample mean:
Reserve Problems Chapter 6 Section 2 Problem 10
A semiconductor manufacturer produces devices used as central processing units in personal
computers. The speed of the devices (in megahertz) is important because it determines the price
that the manufacturer can charge for the devices. The following table contains measurements on
120 devices.
680
669
719
699
670
710
722
663
658
634
720
690
677
669
700
718
690
681
702
696
692
690
694
660
649
675
701
721
683
735
688
763
672
698
659
704
681
679
691
683
705
746
706
649
668
672
690
724
652
720
660
695
701
724
668
698
668
660
680
739
717
727
653
637
660
693
679
682
724
642
704
695
704
652
664
702
661
720
695
670
656
718
660
648
683
723
710
680
684
705
681
748
697
703
660
722
662
644
683
695
678
674
656
667
683
691
680
685
681
715
665
676
665
675
655
659
720
675
697
663
Select the correct stem-and-leaf diagram for these data
A
N=120, Leaf Unit = 1.0
2
63|47
7
64|24899
16
65|223566899
35
66|0000001233455788899
48
67|002245567899
(17)
68|00001111233333458
55
69|0000112345555677889
36
70|011223444556
24
71|0057889
17
72|000012234447
5
73|59
3
74|68
1
76|3
B
N=120, Leaf Unit = 1.0
2
63|47
7
64|24899
16
65|223566899
35
66|0000001233455788899
48
67|002245567899
(19)
68|0000111112333333458
55
69|0000112345555677889
36
70|011223444556
24
71|0057889
17
72|000012234447
5
73|59
3
74|68
1
76|3
C
N=120, Leaf Unit = 1.0
2
63|47
7
64|24899
16
65|223566899
34
66|000001233455788899
48
67|002245567899
(17)
68|00001111233333458
55
69|0000112345555677889
36
70|011223444556
24
71|0057889
16
72|00012234447
5
73|59
3
74|68
1
76|3
D
N=120, Leaf Unit = 10
2
63|47
7
64|24899
16
65|223566899
35
66|0000001233455788899
48
67|002245567899
(17)
68|00001111233333458
55
69|0000112345555677889
36
70|011223444556
24
71|0057889
17
72|000012234447
5
73|59
3
74|68
1
76|3
Compute the sample mean, the sample standard deviation, and the sample median.
What percentage of the devices has a speed exceeding 700 MHz?
SOLUTION
Sample mean:
Reserve Problems Chapter 6 Section 3 Problem 1
The following times (in seconds) were captured for athletes running the 100 meter race.
12.1
13.2
11.8
14.7
15.2
16.4
14.9
14.8
14.8
14.7


