Stem-and-leaf display. Yard: unit = 1.0
1 22 | 6
(15) 26 | 000011123334444
39 26 | 56677888
Yes, the histogram shows the same shape as the stem-and-leaf display.
Reserve Problems Chapter 6 Section 3 Problem 8
A semiconductor manufacturer produces devices used as central processing units in personal
computers. The speed of the devices (in megahertz) is important because it determines the price
that the manufacturer can charge for the devices. The following table contains measurements on
120 devices.
680
669
719
699
670
710
722
663
658
634
720
690
677
669
700
718
690
681
702
696
692
690
694
660
679
675
701
721
683
735
688
763
672
698
659
704
681
679
691
683
705
746
706
649
668
672
690
724
652
720
660
695
701
724
668
698
668
660
680
739
717
727
653
637
660
693
679
682
724
642
704
695
704
652
664
702
661
720
695
670
656
718
660
648
683
723
710
680
684
705
681
748
697
703
660
722
662
644
683
695
678
674
656
667
683
691
680
685
681
715
665
676
665
675
655
659
720
675
697
663
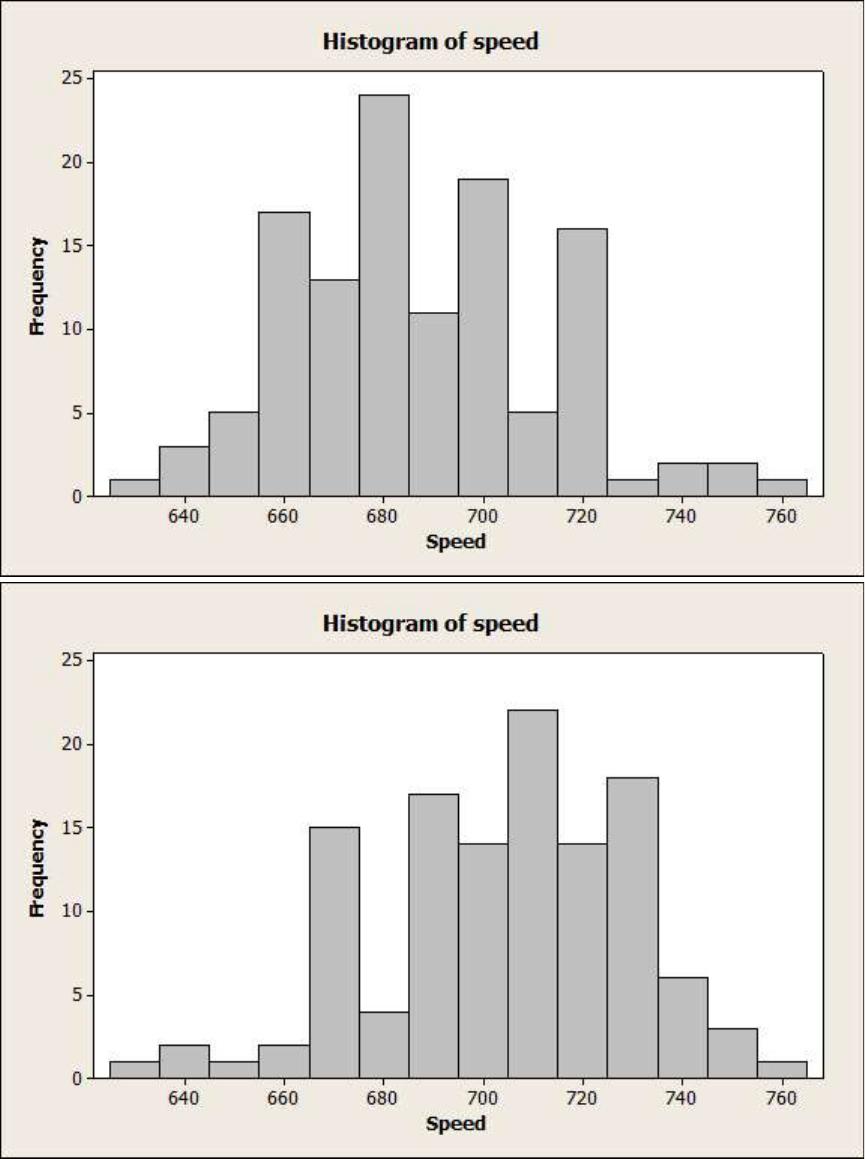
Construct a frequence distribution for these data. Use 14 bins.
Select the correct histogram.
A
B
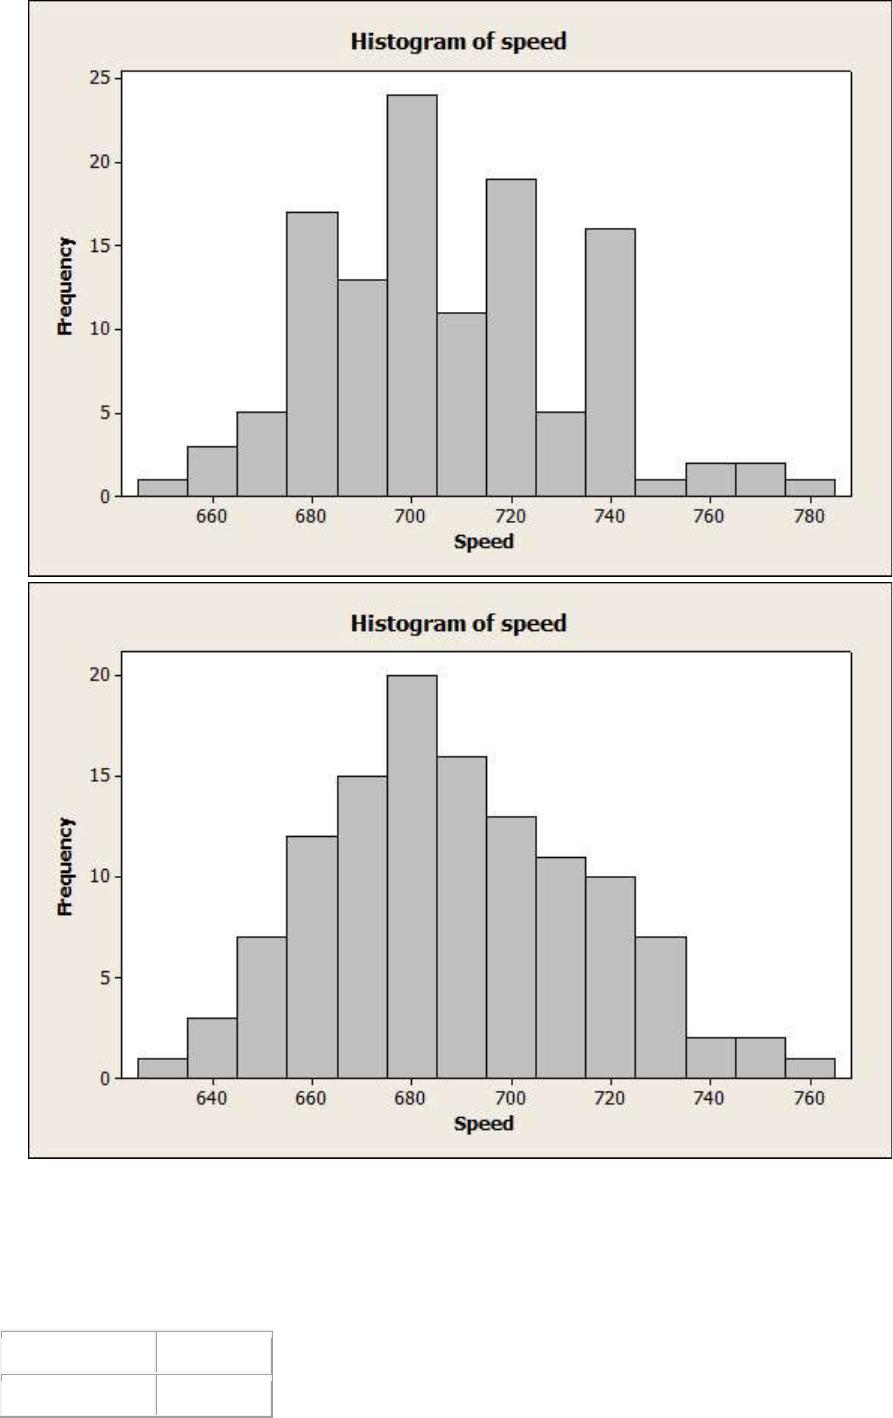
C
D
Does it convey the same information as the prsented stem-and-leaf display for this data?
SOLUTION
Class
Frequency
625 635x
1
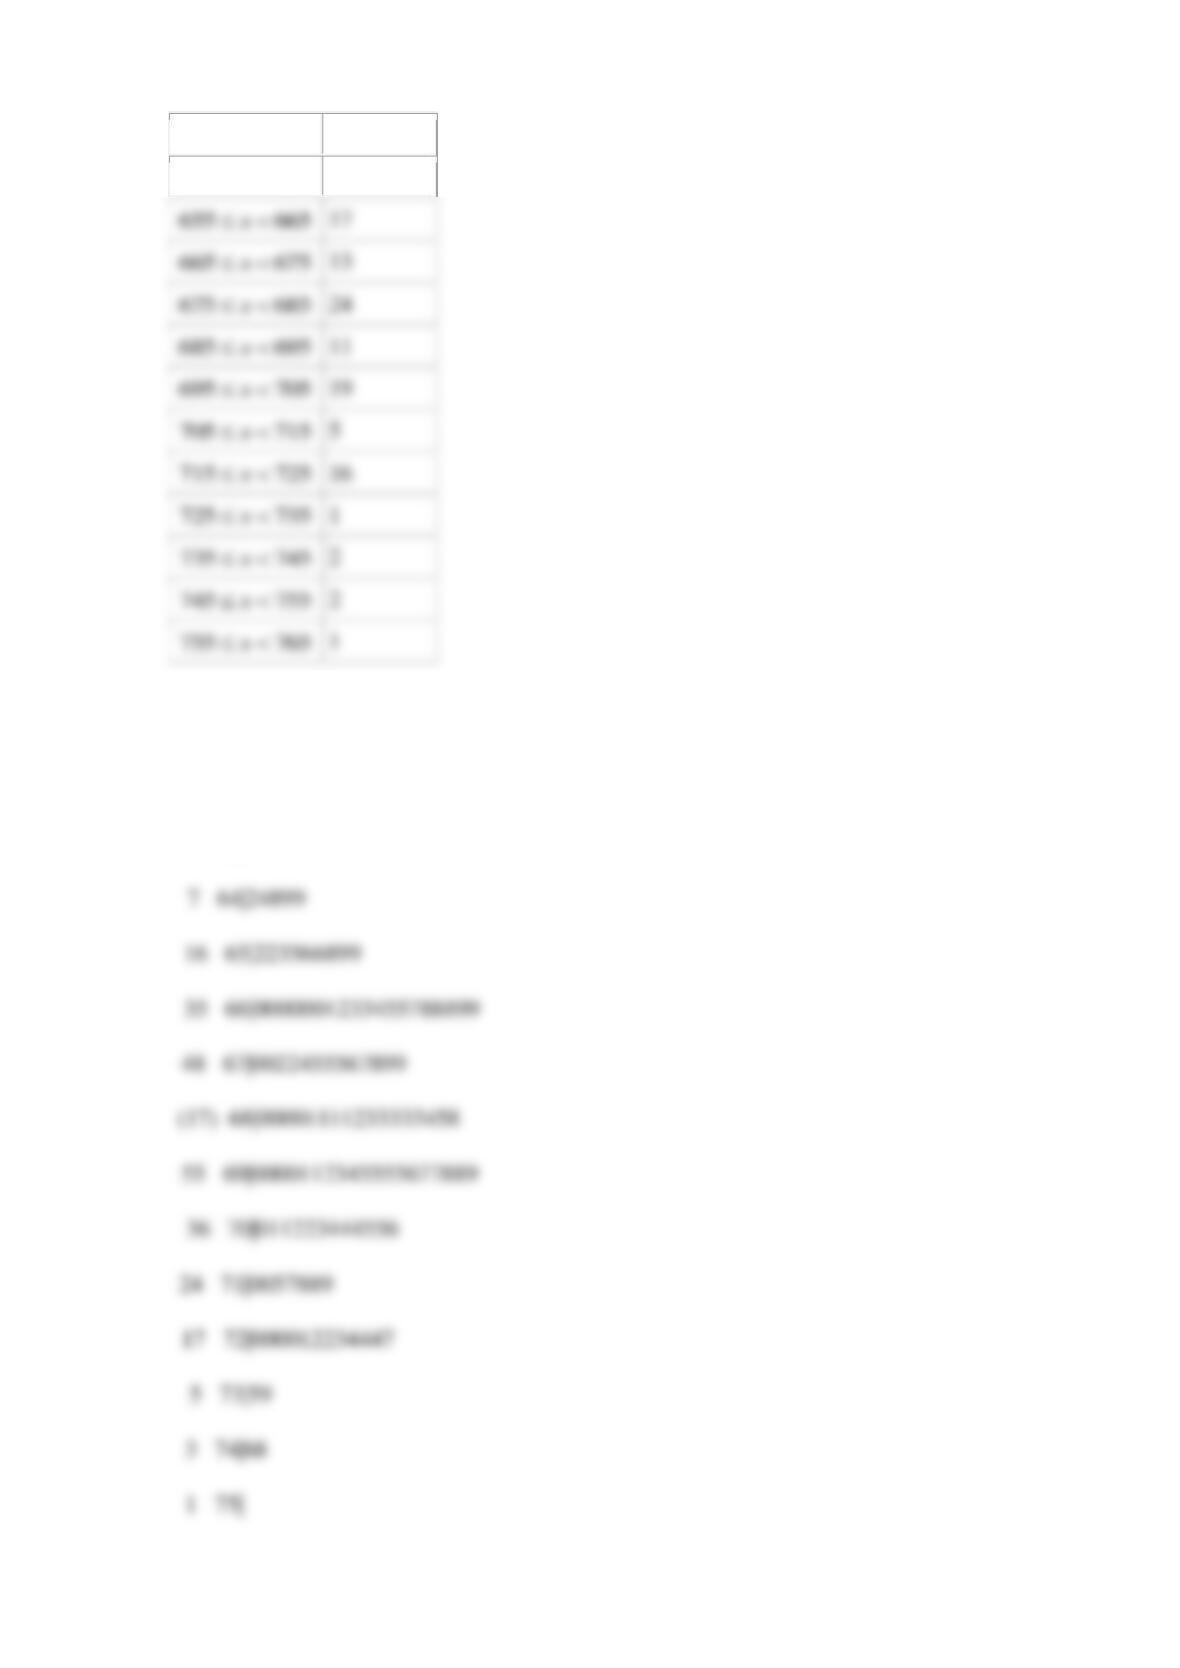
635 645x
3
645 655x
5
Stem-and-leaf of speed (in megahertz) N = 120
Leaf Unit = 1.0 63|4 represents 634 megahertz
2 63|47
655 665x
17
665 675x
13
675 685x
24
685 695x
11
695 705x
19
705 715x
5
715 725x
16
1
735 745x
2
745 755x
2
755 765x
1
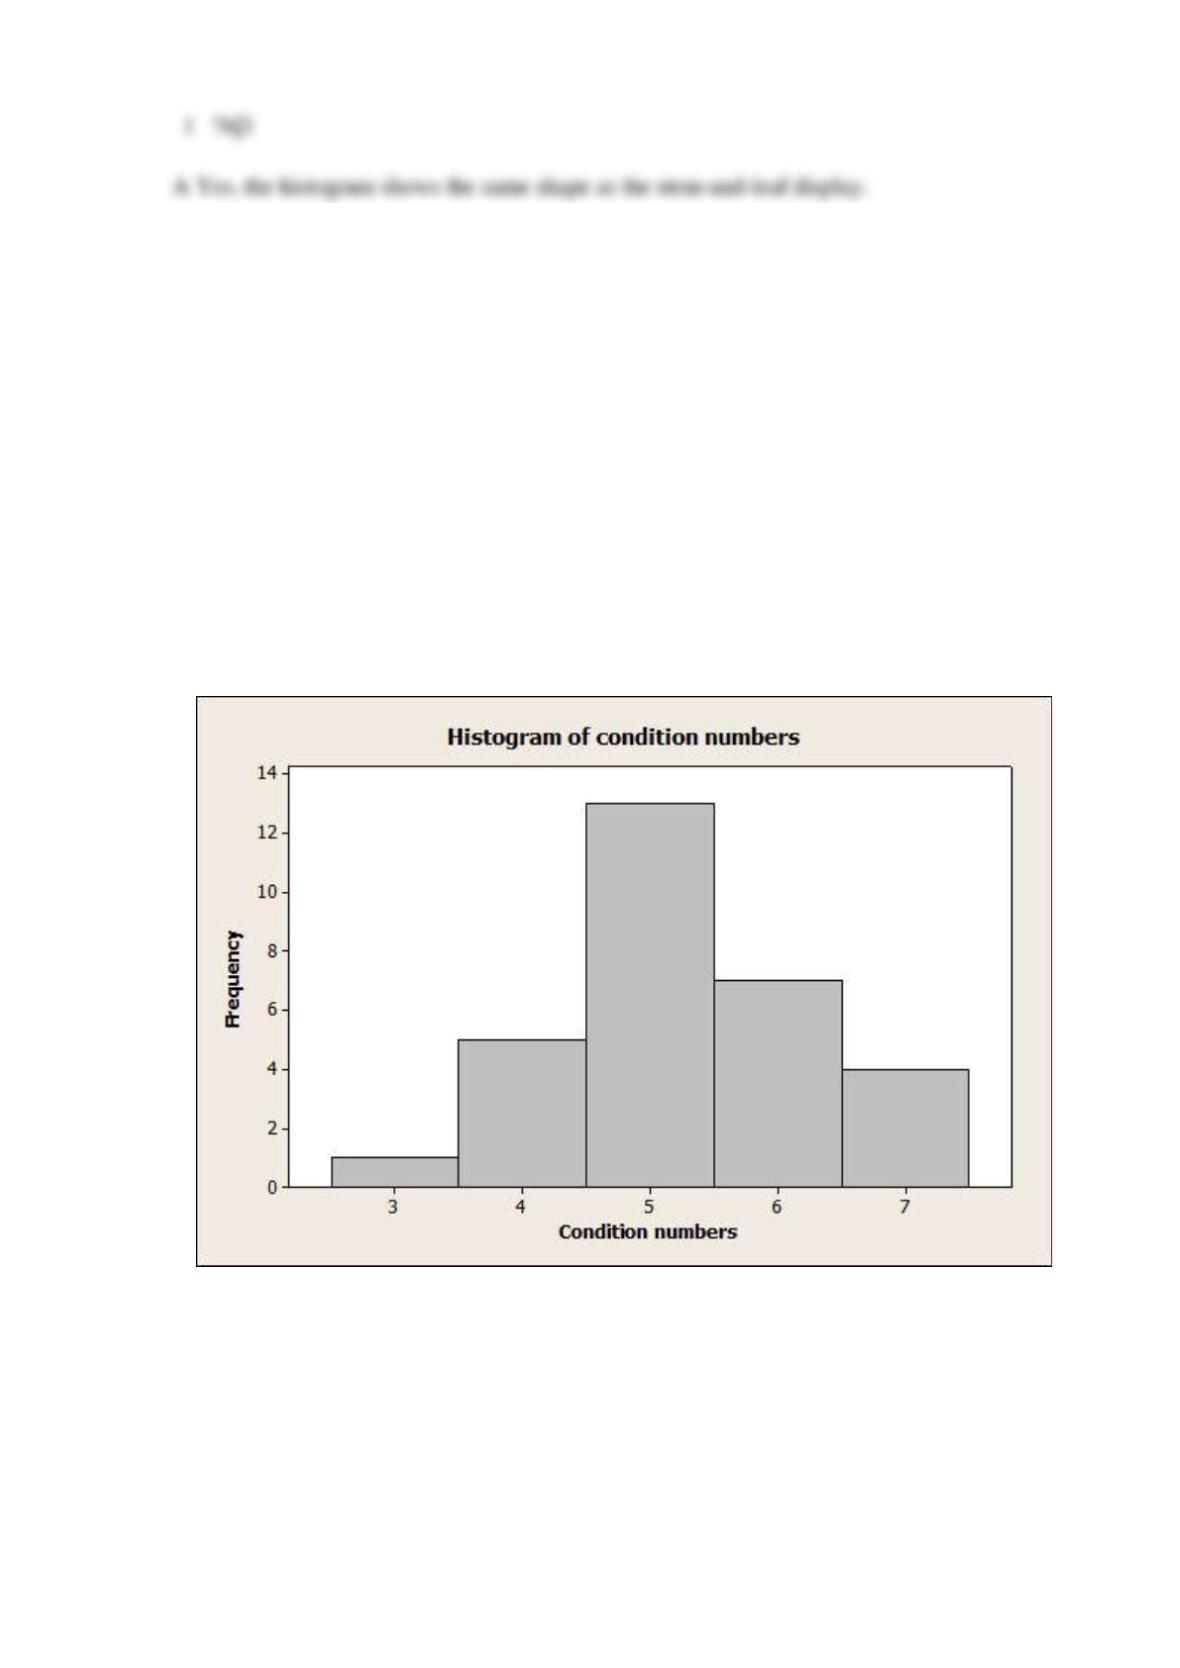
Reserve Problems Chapter 6 Section 3 Problem 9
The United States has an aging infrastructure as witnessed by several resent disasters, including
the I-35 bridge failure in Minnesota. Most states inspect their bridges regularly and report their
condition (on a scale from 1-7) to the public. Here are condition numbers from a sample of 30
bridges in New York State:
5.08
5.44
6.66
5.07
6.80
5.43
4.83
4.00
4.41
4.38
7.00
5.72
4.53
6.43
3.97
4.19
6.26
6.72
5.26
5.48
4.95
6.33
4.93
5.61
4.66
7.00
5.57
3.42
5.18
4.54
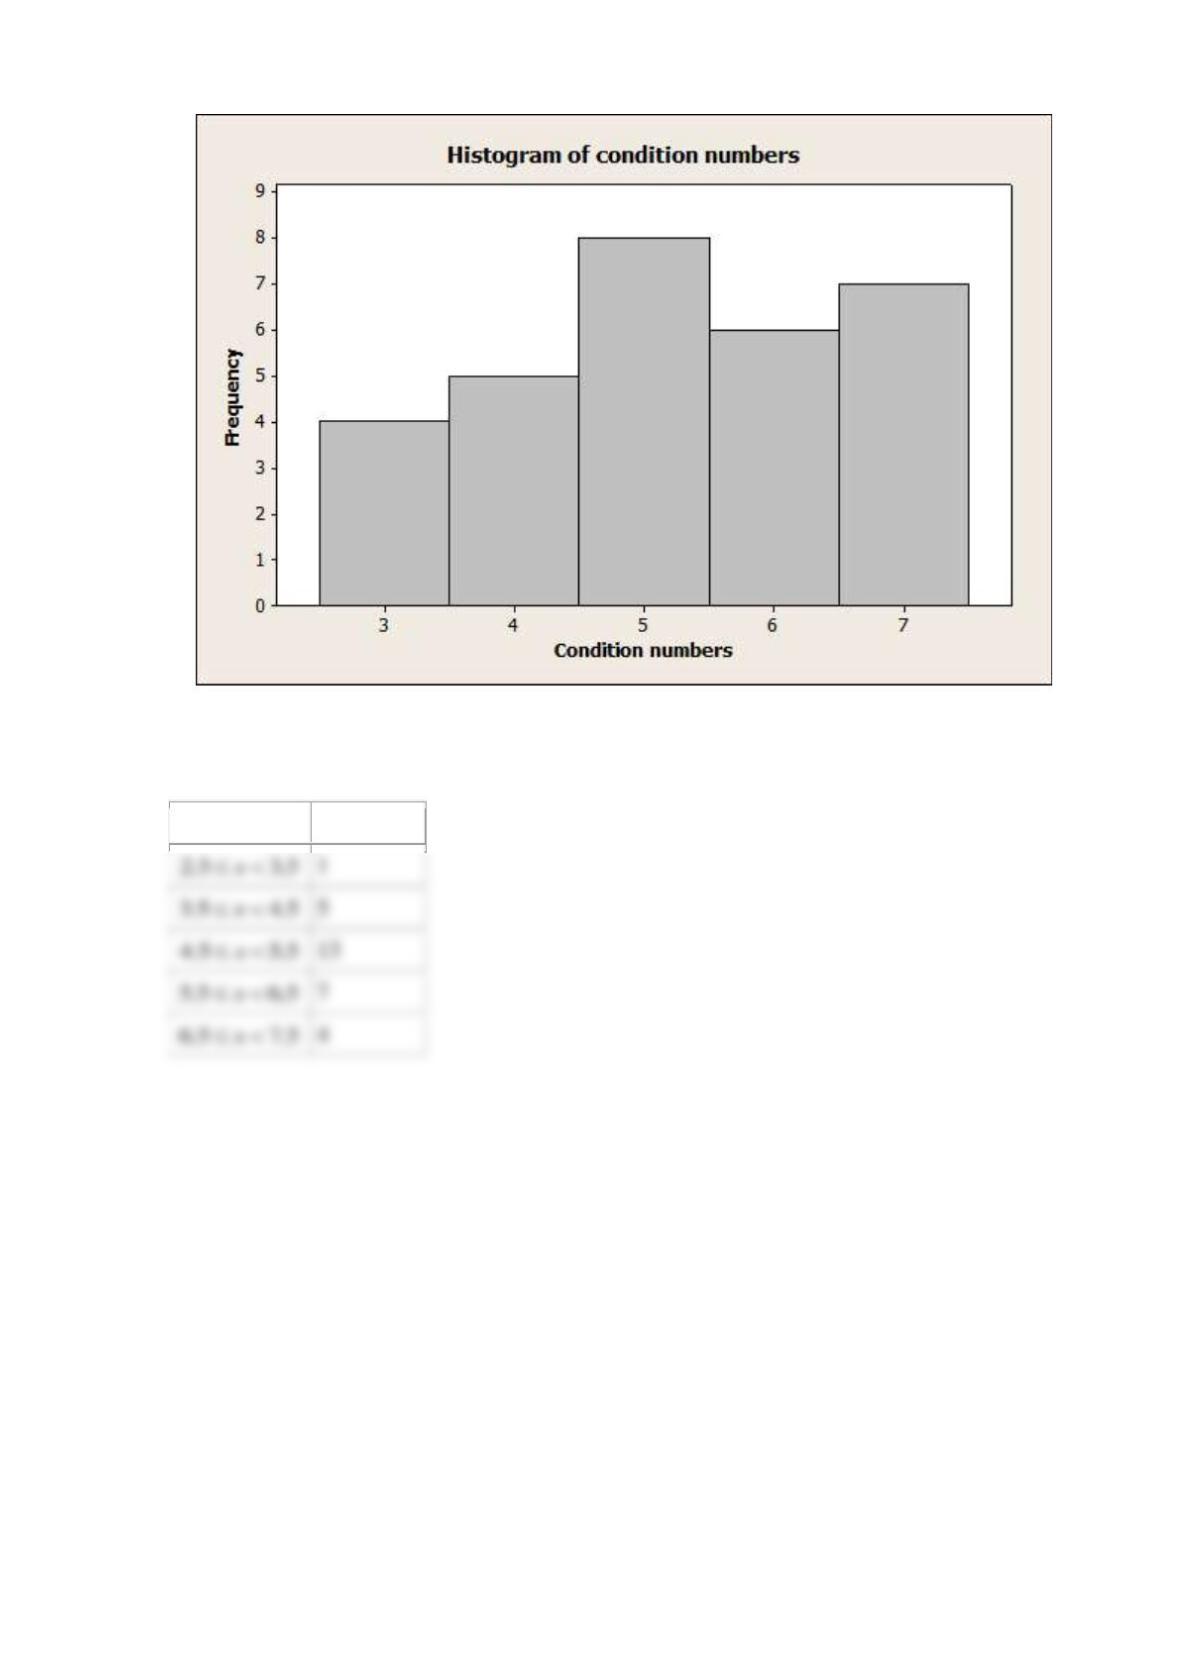
Construct a frequence distribution for these data. Use 5 bins.
Select the correct histogram.
A
A
Yes, the histogram shows the same shape as the stem-and-leaf display.
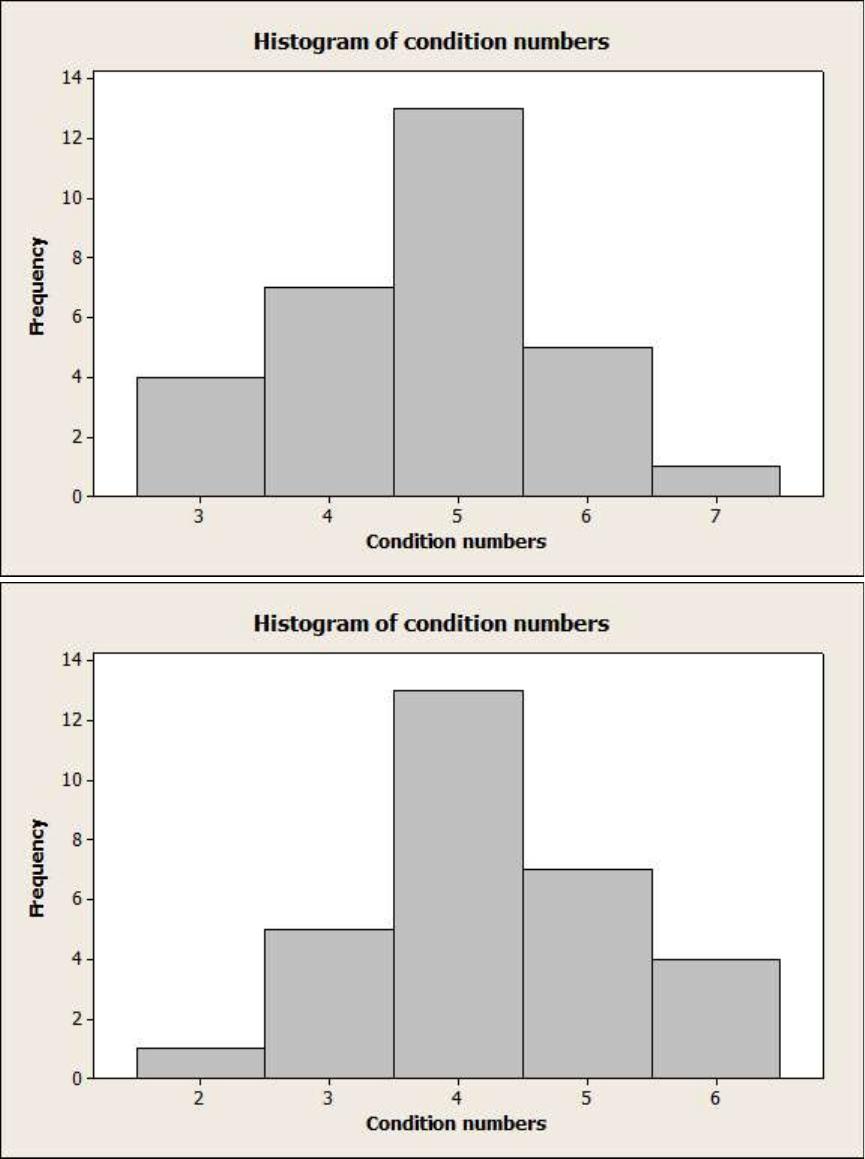
B
C
D
SOLUTION
Class
Frequency
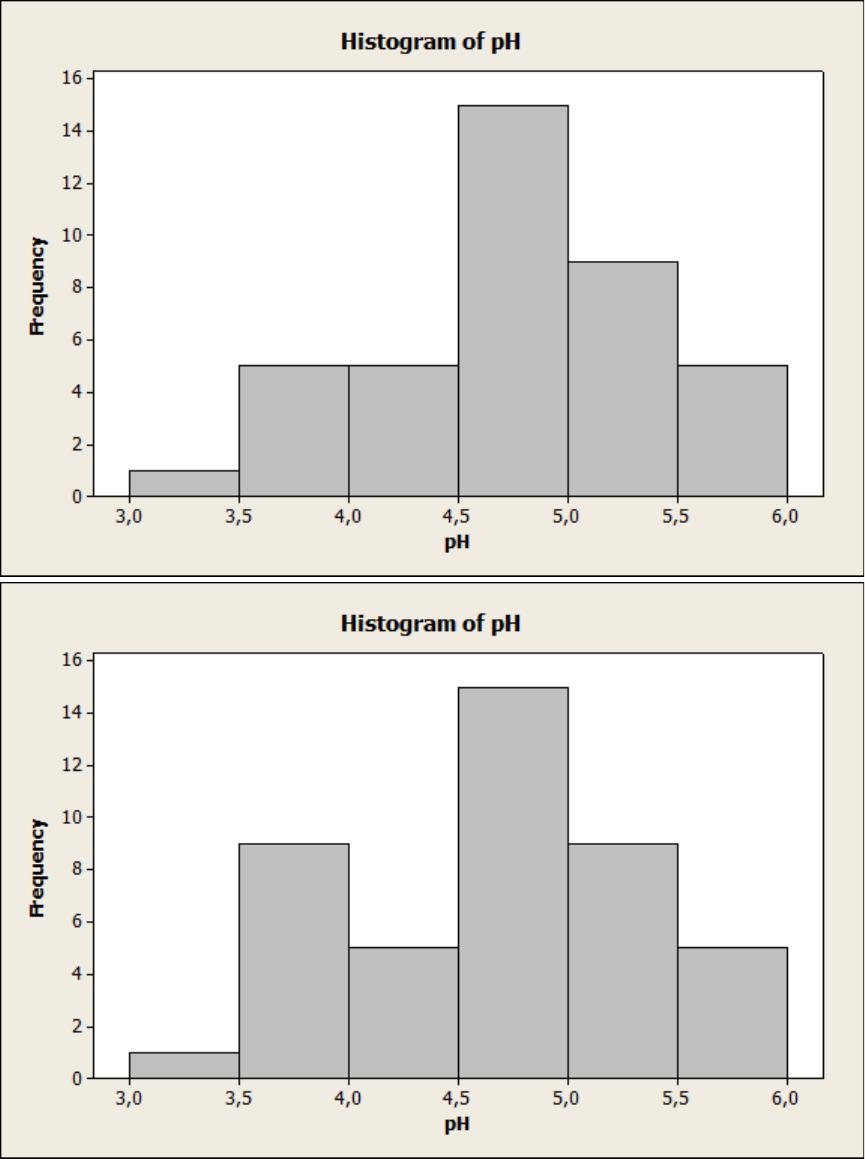
Reserve Problems Chapter 6 Section 3 Problem 10
In an attempt to measure the effects of acid rain, researchers measured the pH (7 is neutral and
values below 7 are acidic) of water collected from rain in Ingham County, Michigan.
5.47
5.37
5.38
4.63
5.37
3.74
3.71
4.96
4.64
5.11
5.65
5.39
4.16
5.62
4.57
4.64
5.48
4.57
4.57
4.51
4.86
4.56
4.61
4.32
3.98
5.70
4.15
3.98
5.65
3.10
5.04
4.62
4.51
4.34
4.16
4.64
5.12
3.71
4.64
5.59
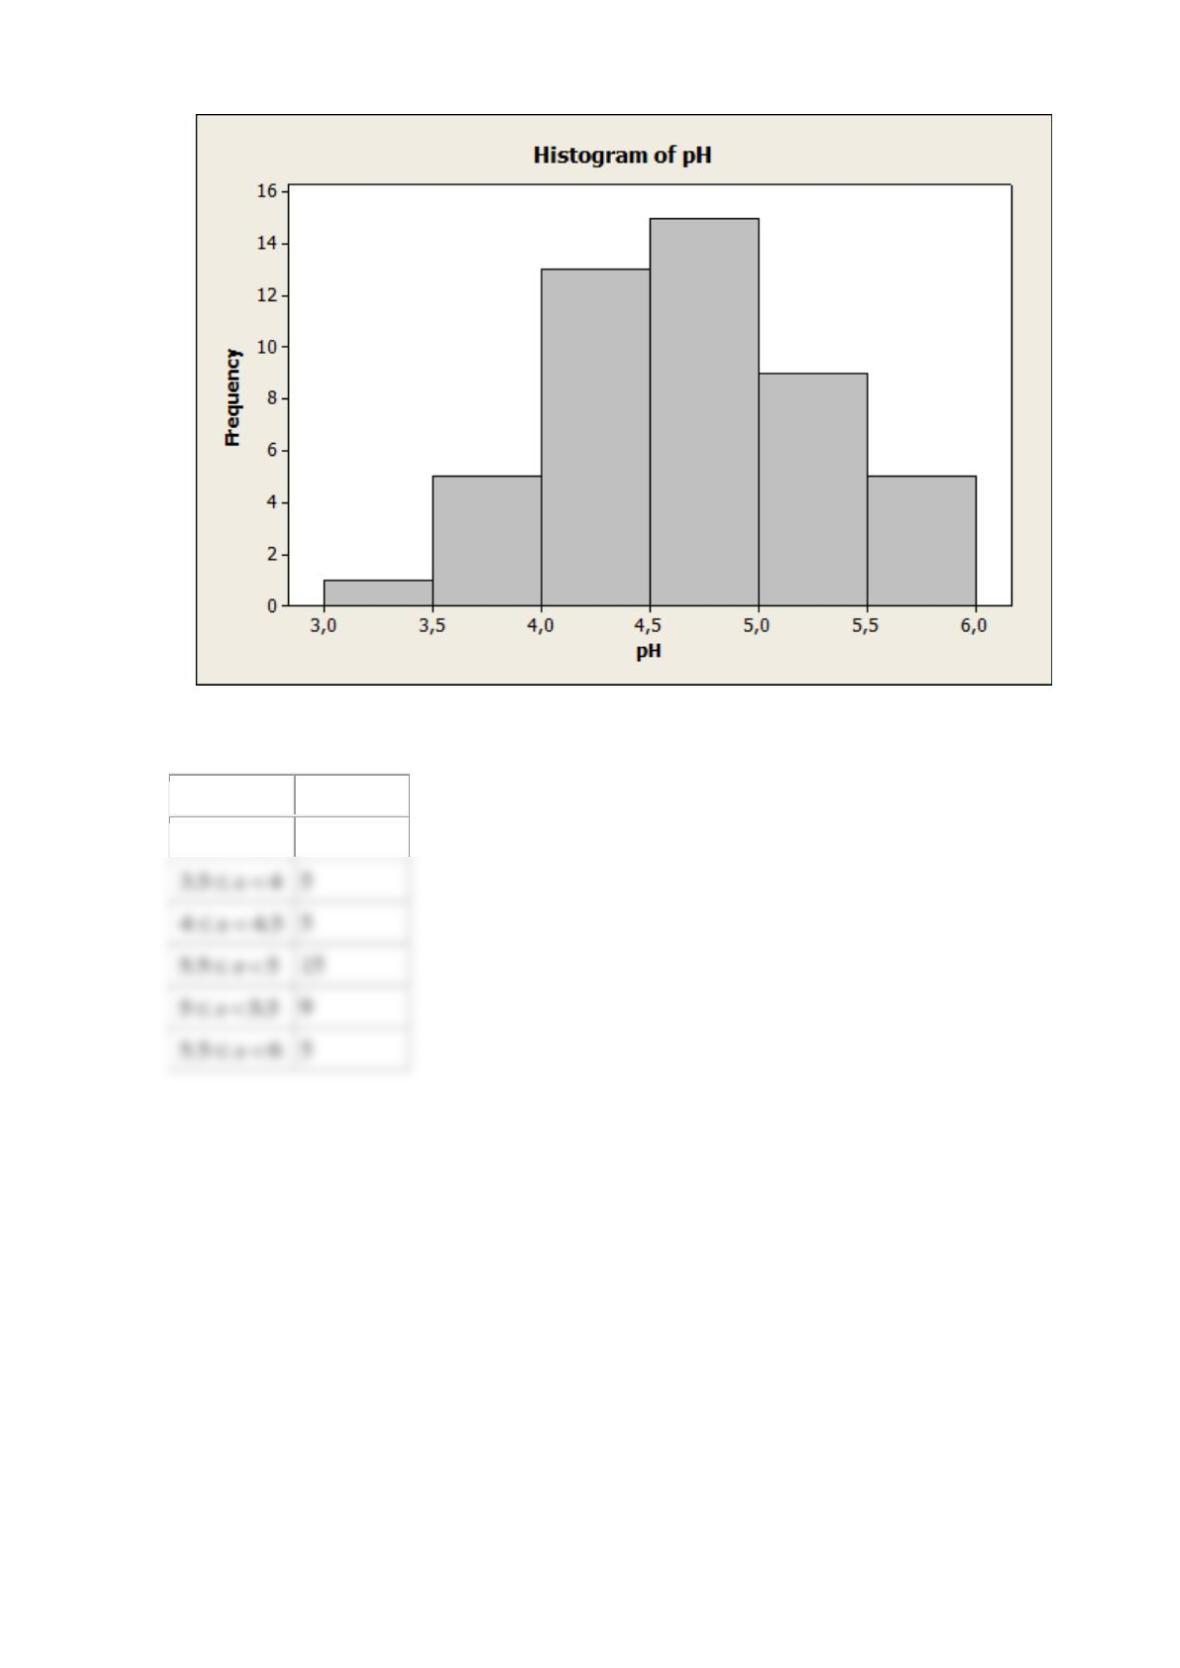
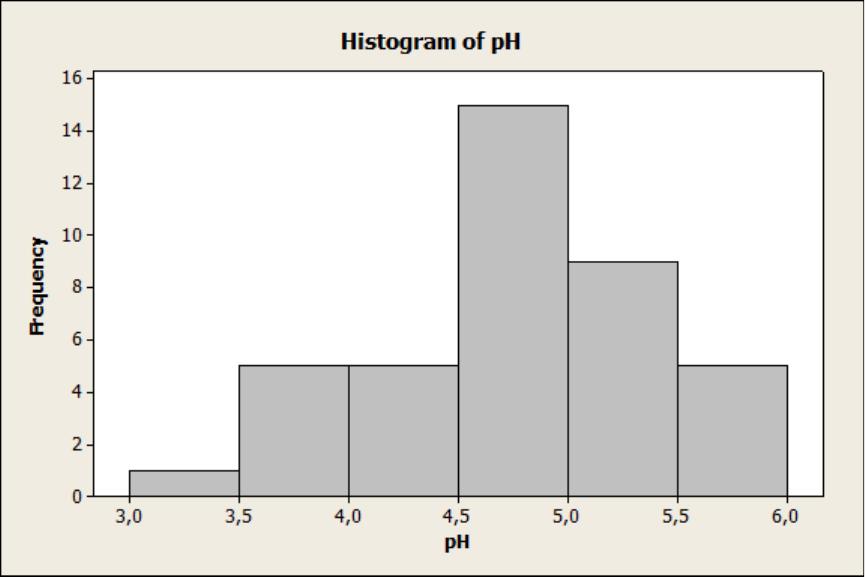
Construct a frequence distribution for these data. Use 6 bins.
Select the correct histogram.
A
B
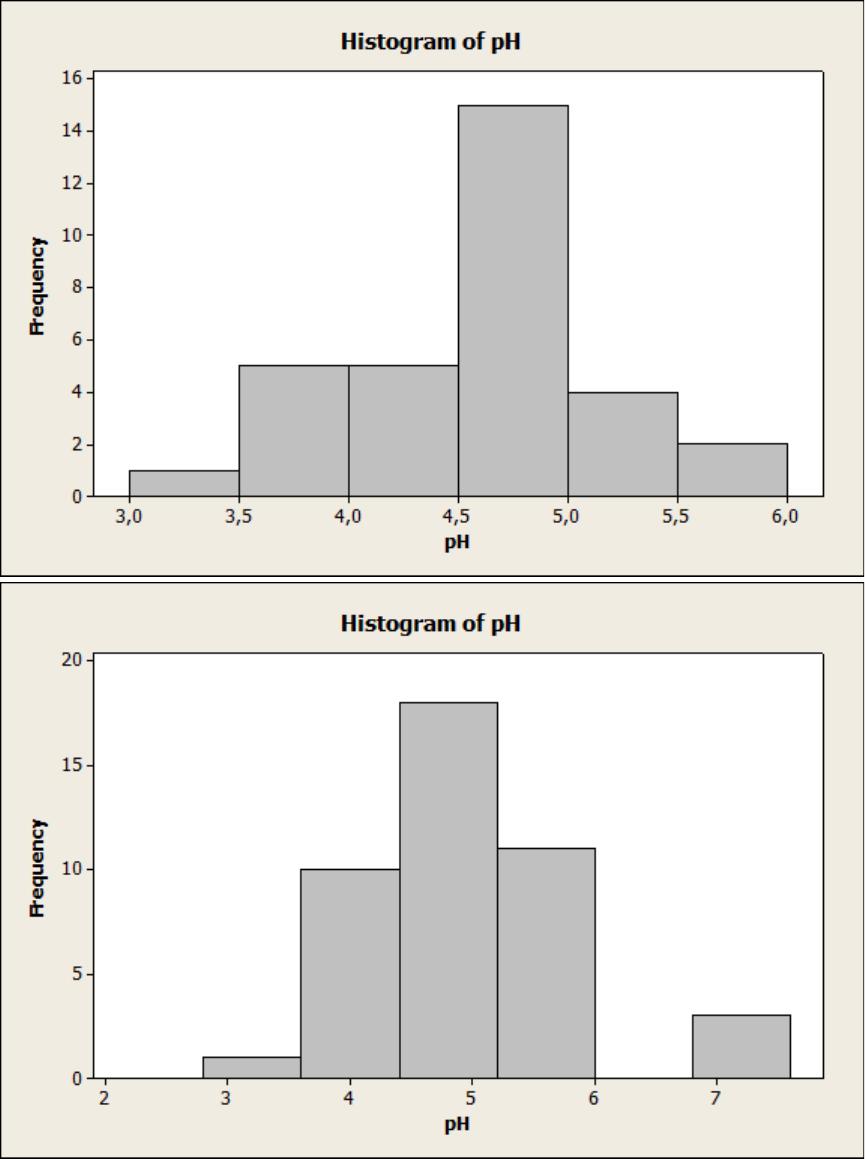
C
D
E
SOLUTION
Class
Frequency
3 3.5x
1
5
5
15
9
5
Reserve Problems Chapter 6 Section 3 Problem 11
Cloud seeding, a process in which chemicals such as silver iodide and frozen carbon dioxide are
introduced by aircraft into clouds to promote rainfall was widely used in the 20-th century.
Recent research has questioned its effectiveness [Journal of Atmospheric Research (2010, Vol.
97 (2), pp. 513-525)]. An experiment was performed by randomly assigning 52 clouds to be
seeded or not. The amount of rain generated was then measured in acre-feet. Here are the data
for the unseeded and seeded clouds:
Unseeded:
81.2
26.1
95.0
41.1
28.6
21.7
11.5
68.5
345.5
321.2
1202.6
1.0
4.9
163.0
372.4
244.3
47.3
87.0
26.3
24.4
830.1
4.9
36.6
147.8
17.3
29.0
Seeded:
274.7
302.8
242.5
255.0
17.5
115.3
31.4
703.4
334.1
1697.8
118.3
198.6
129.6
274.7
119.0
1656.0
7.7
430.0
40.6
92.4
200.7
32.7
4.1
978.0
489.1
2745.6
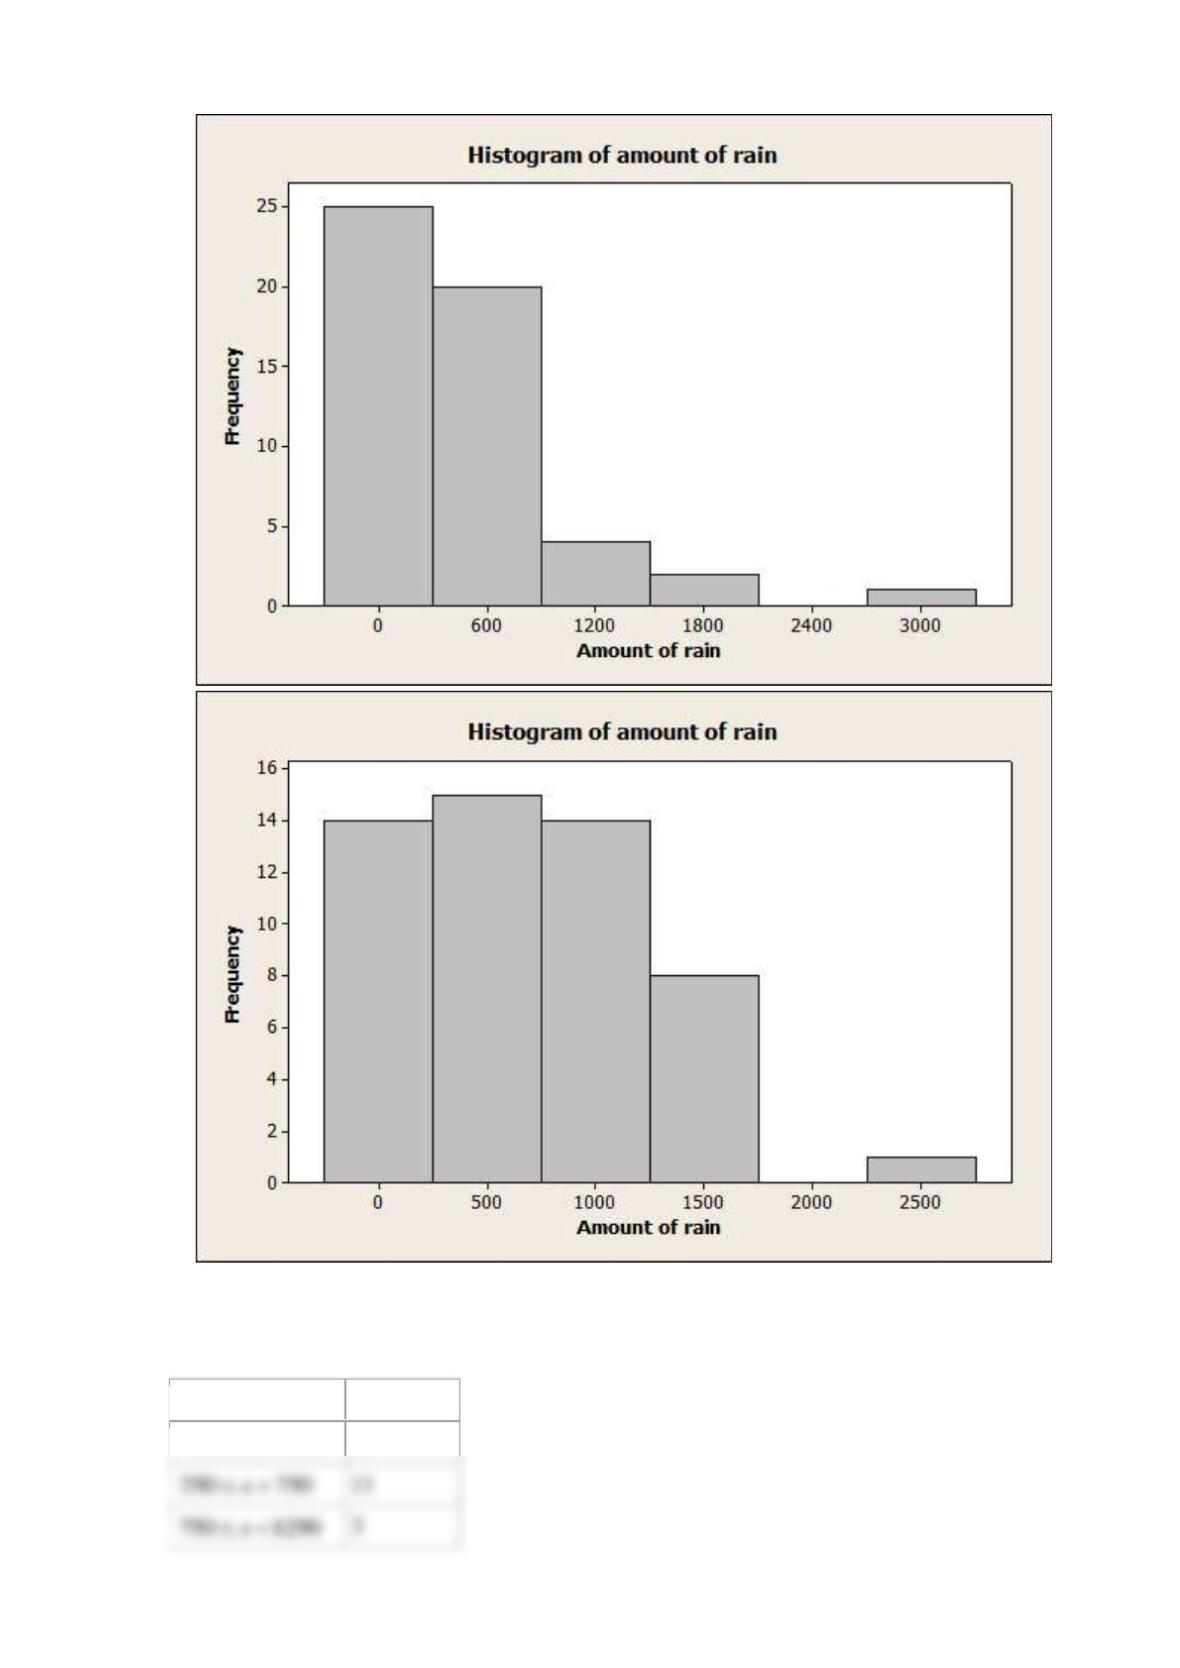
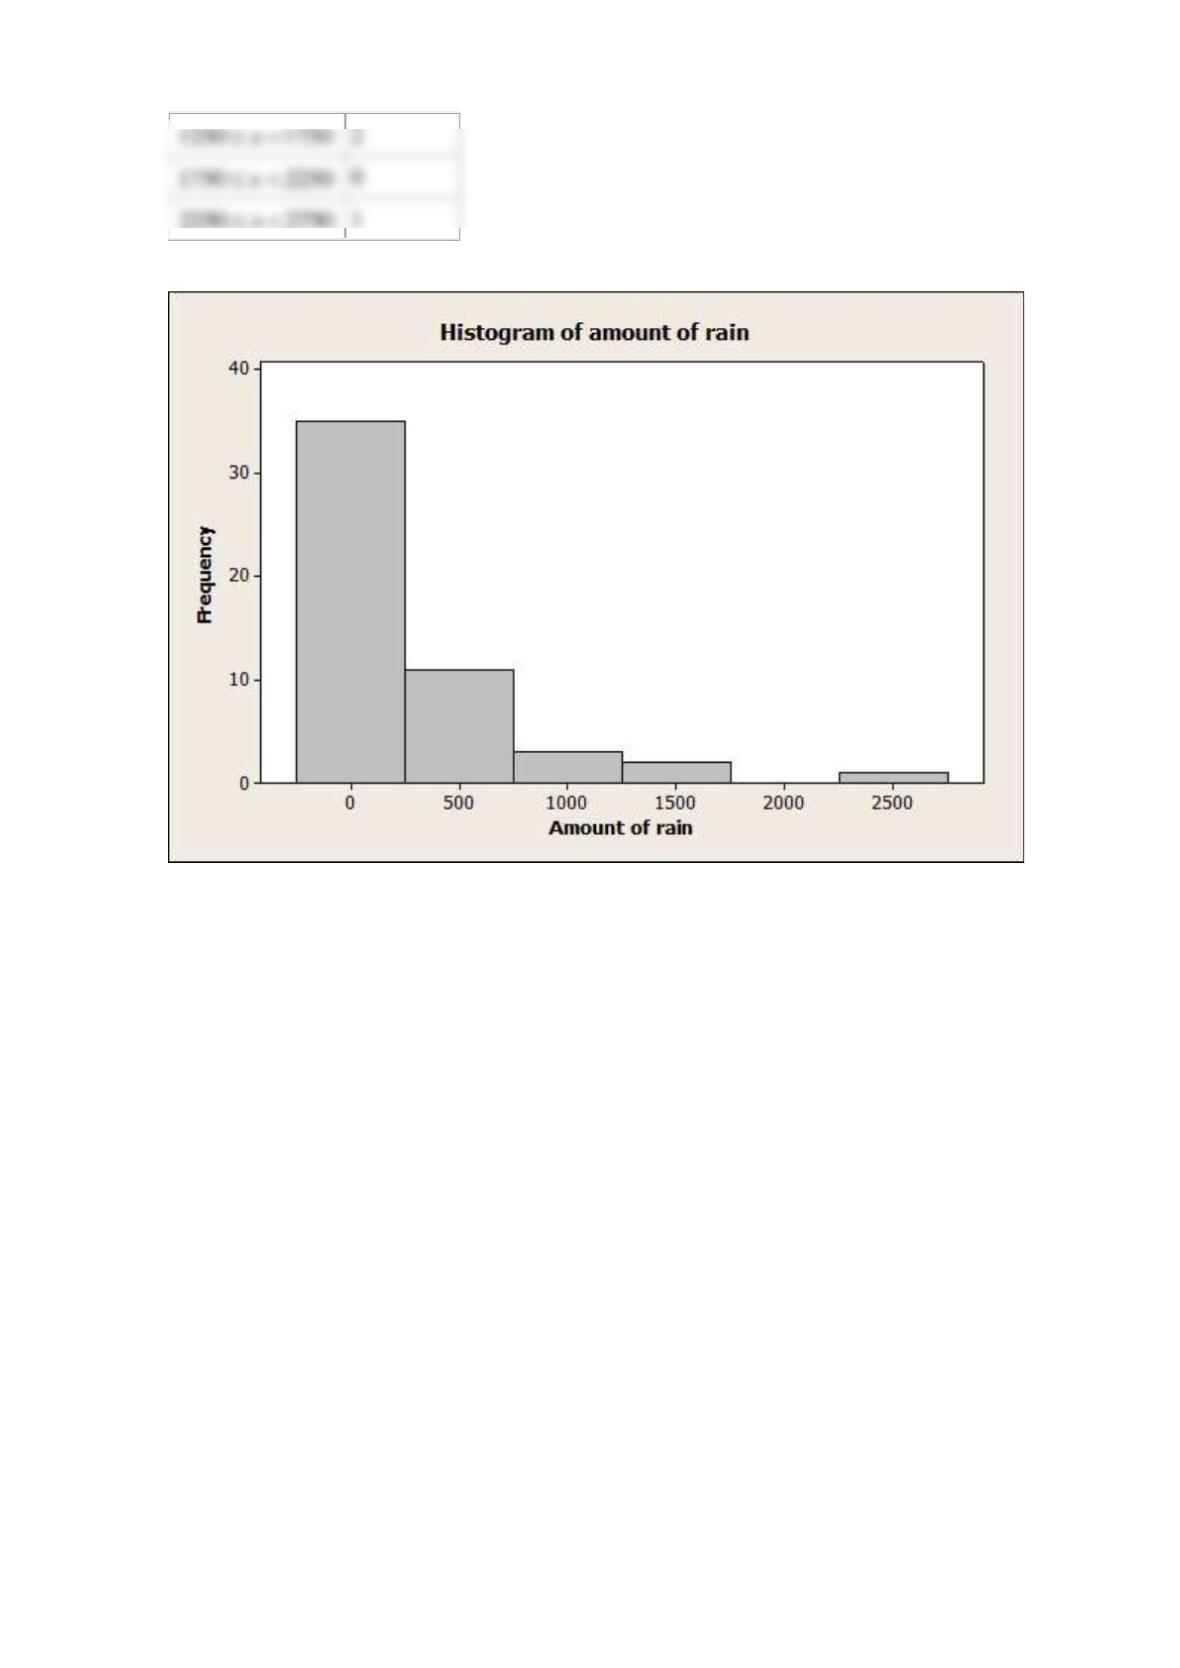
Construct a frequence distribution for the combined cloud-seeding rain measurements. Use 6
bins.
Select the correct histogram.
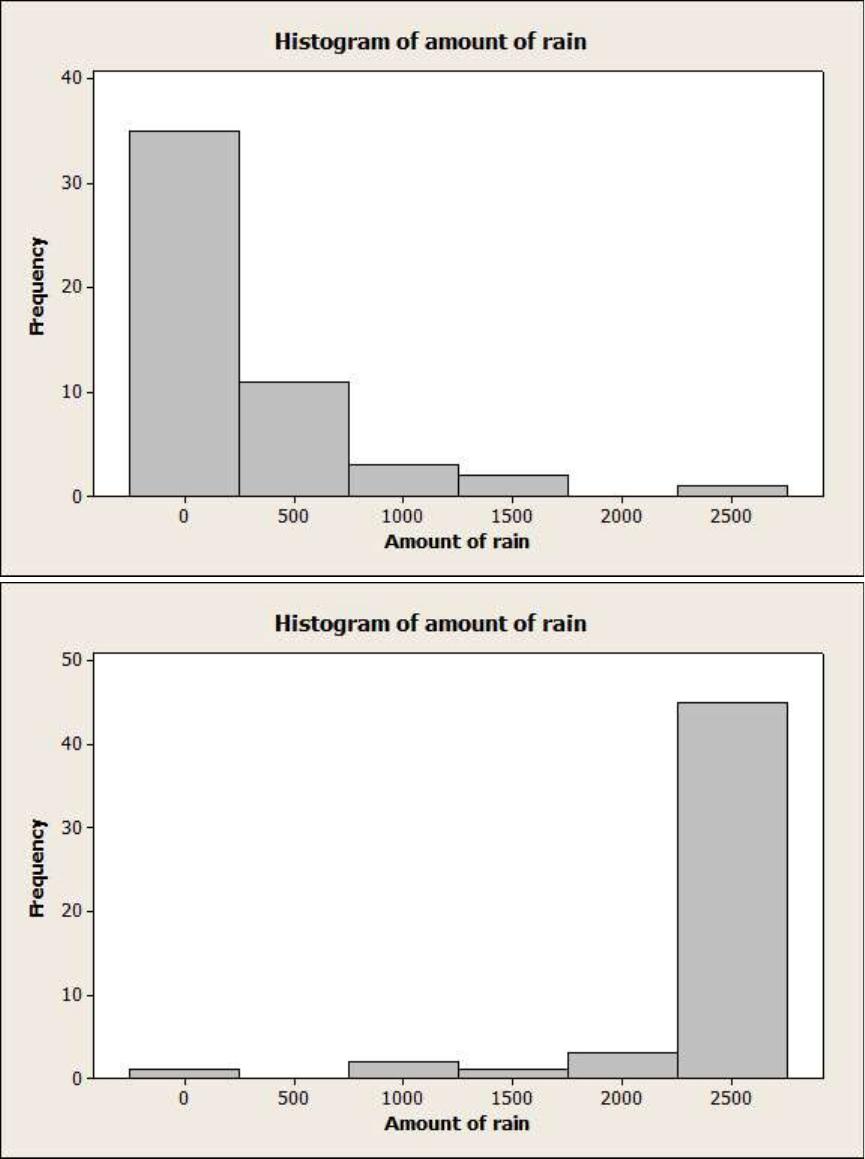
A
B
C
D
SOLUTION
Class
Frequency
250 250x−
35
Reserve Problems Chapter 6 Section 3 Problem 12
In the 2000 Sydney Olympics, a special program initiated by IOC president Juan Antonio
Samaranch allowed developing countries to send athletes to the Olympics without the usual
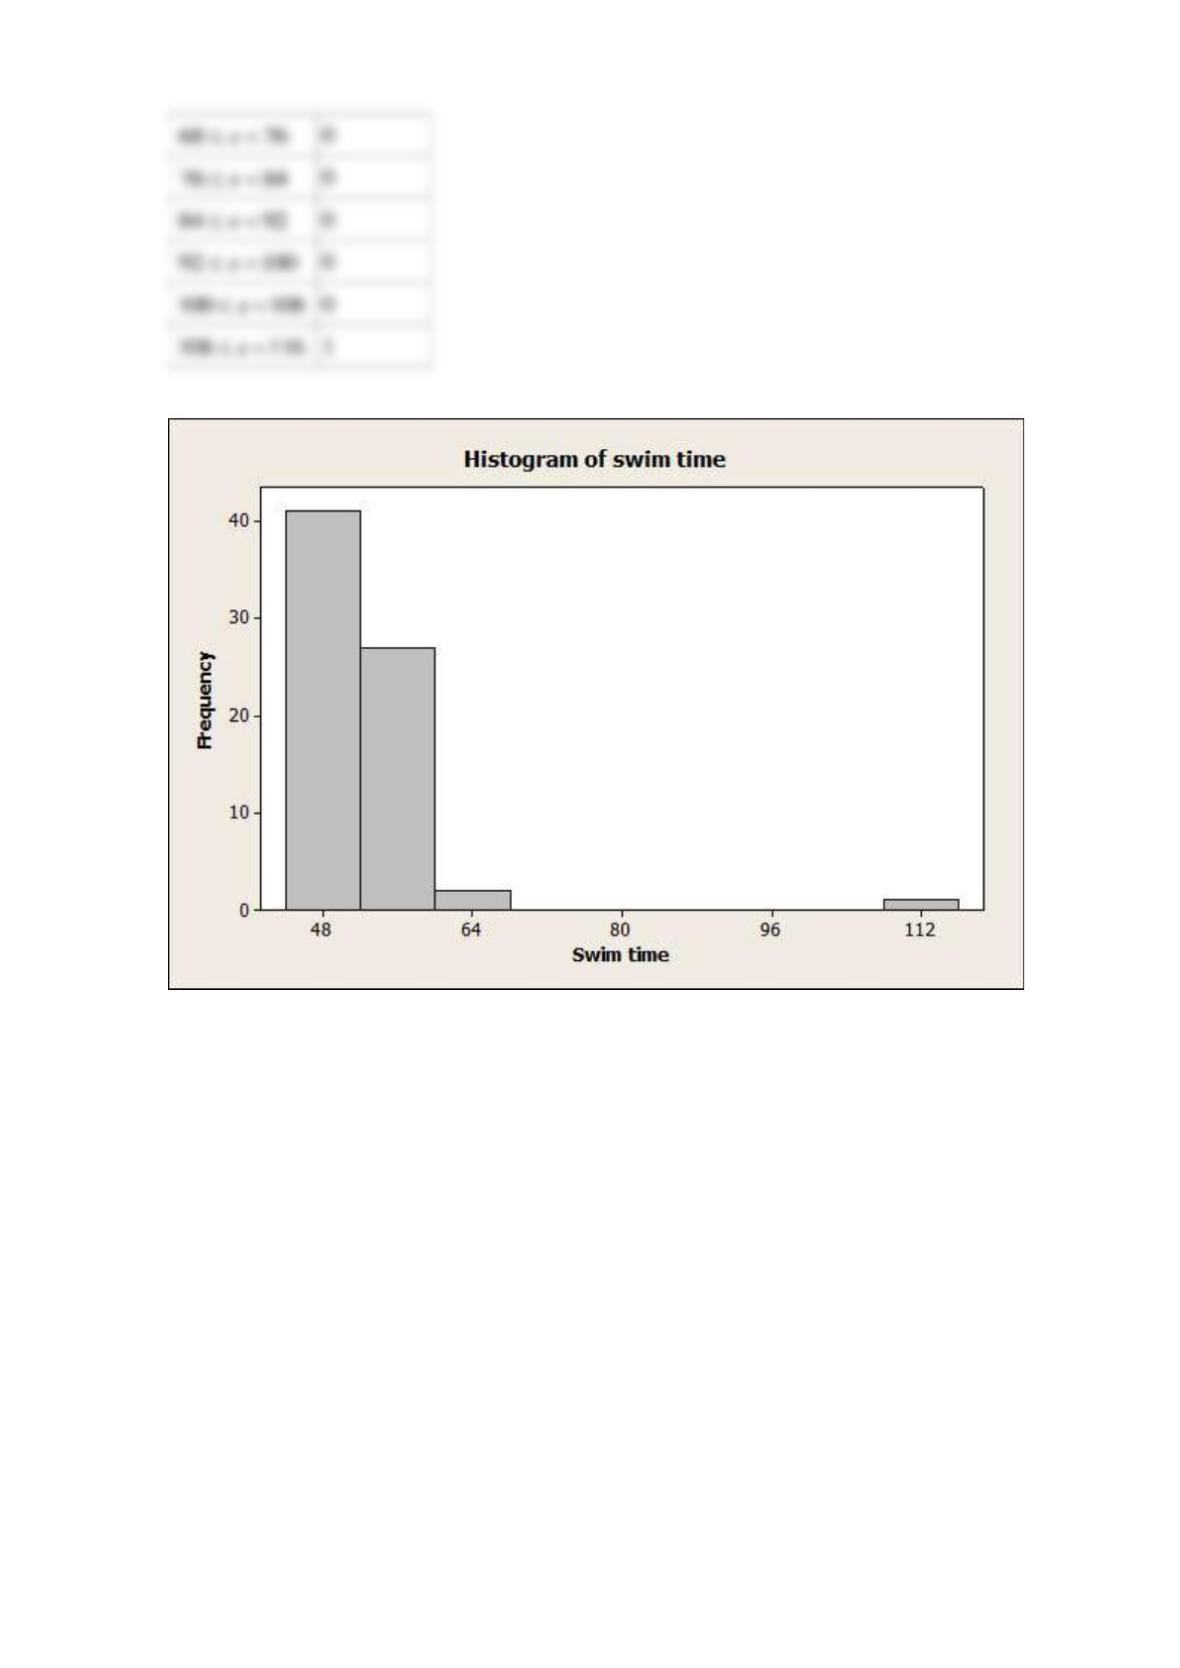
qualifying procedure. Here are the 71 times for the first round of the 100 meter men’s swim (in
seconds).
60.39
49.93
53.40
51.32
50.46
51.34
50.28
50.19
52.14
50.56
52.72
50.95
49.74
49.16
52.57
52.53
52.09
52.40
49.75
54.06
53.50
50.63
51.93
51.62
52.58
53.55
51.07
49.76
49.73
50.90
59.26
49.29
52.78
112.72
49.79
49.83
52.43
51.28
52.22
49.76
49.70
52.90
50.19
54.33
62.45
51.93
52.24
52.82
50.96
48.64
51.11
50.87
52.18
54.12
50.49
49.84
52.91
52.52
50.32
51.52
52.0
52.35
52.24
49.45
51.28
49.09
58.79
49.74
49.32
50.62
49.45
Construct a frequence distribution for this data. Use 9 bins.
Select the correct histogram.
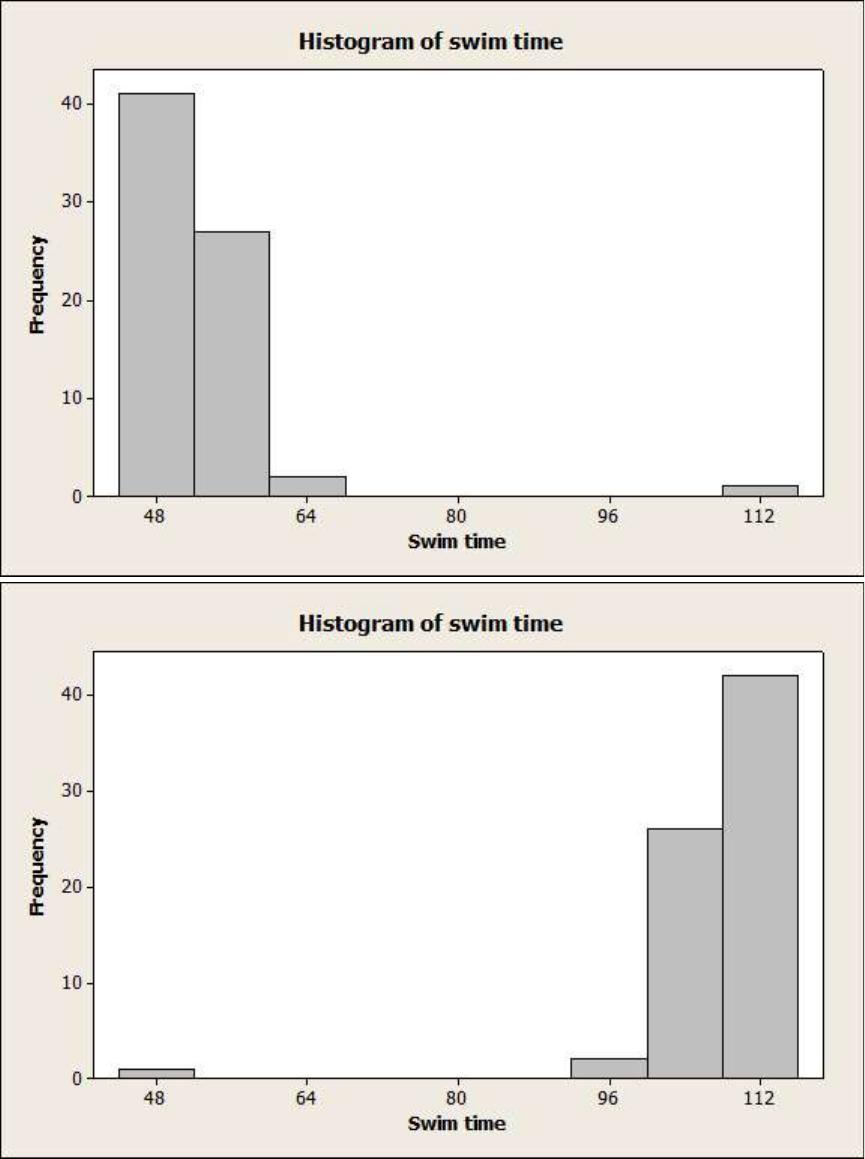
A
B
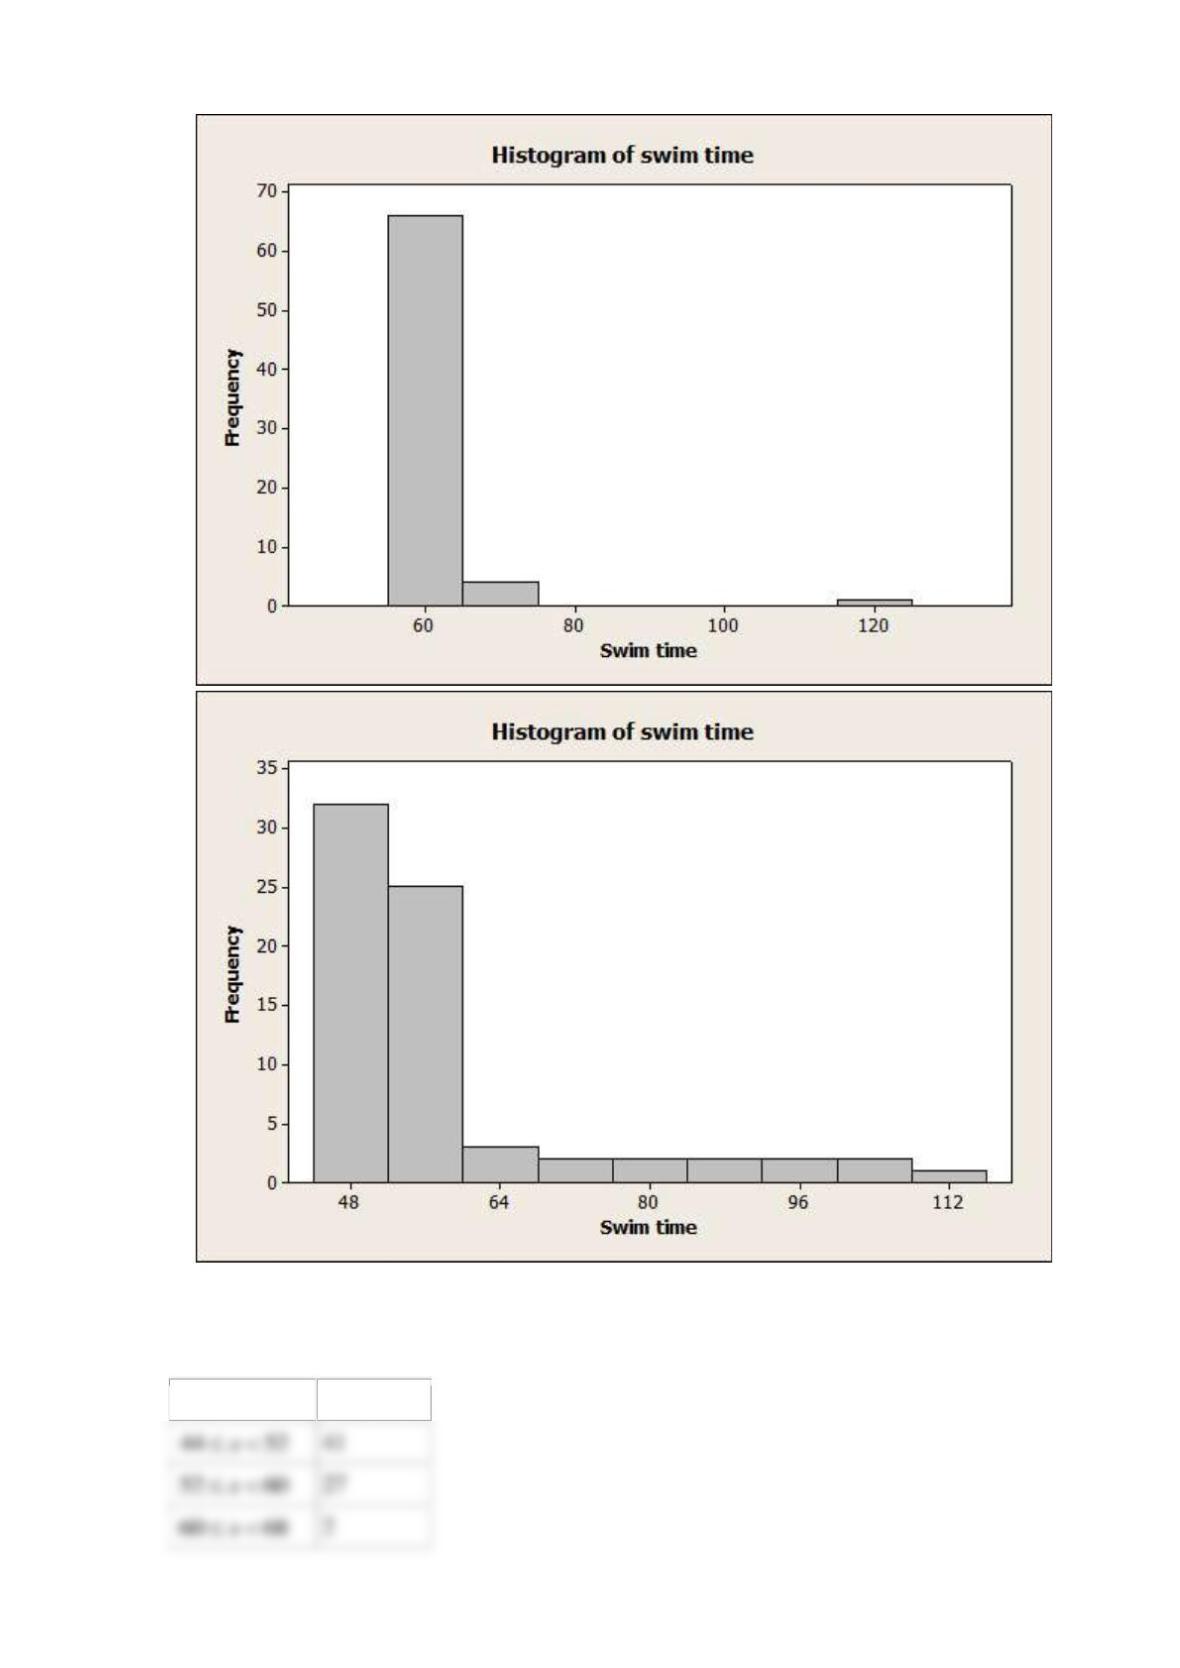
C
D
SOLUTION
Class
Frequency
41
Reserve Problems Chapter 6 Section 4 Problem 1
The driver’s reaction time in response to a particular potential traffic hazard is the time required
from the point of initial detection of the hazard in one’s field of view to the time that vehicle
control components are actuated (such as movement of one’s foot to the brake pedal). The
following data represents the measurements of the driver’s reaction time in seconds for the male
and female participants of the experiment:
0.50
0.49
0.45
0.54
0.44
0.49
0.51
0.48
0.51
0.53
0.51
0.63
0.69
0.76
0.76
0.85
(a) Calculate the sample mean of the data. Calculate the sample variance of the data. Calculate
the corresponding standard deviation.
(b) Find the median and quartiles for the data.
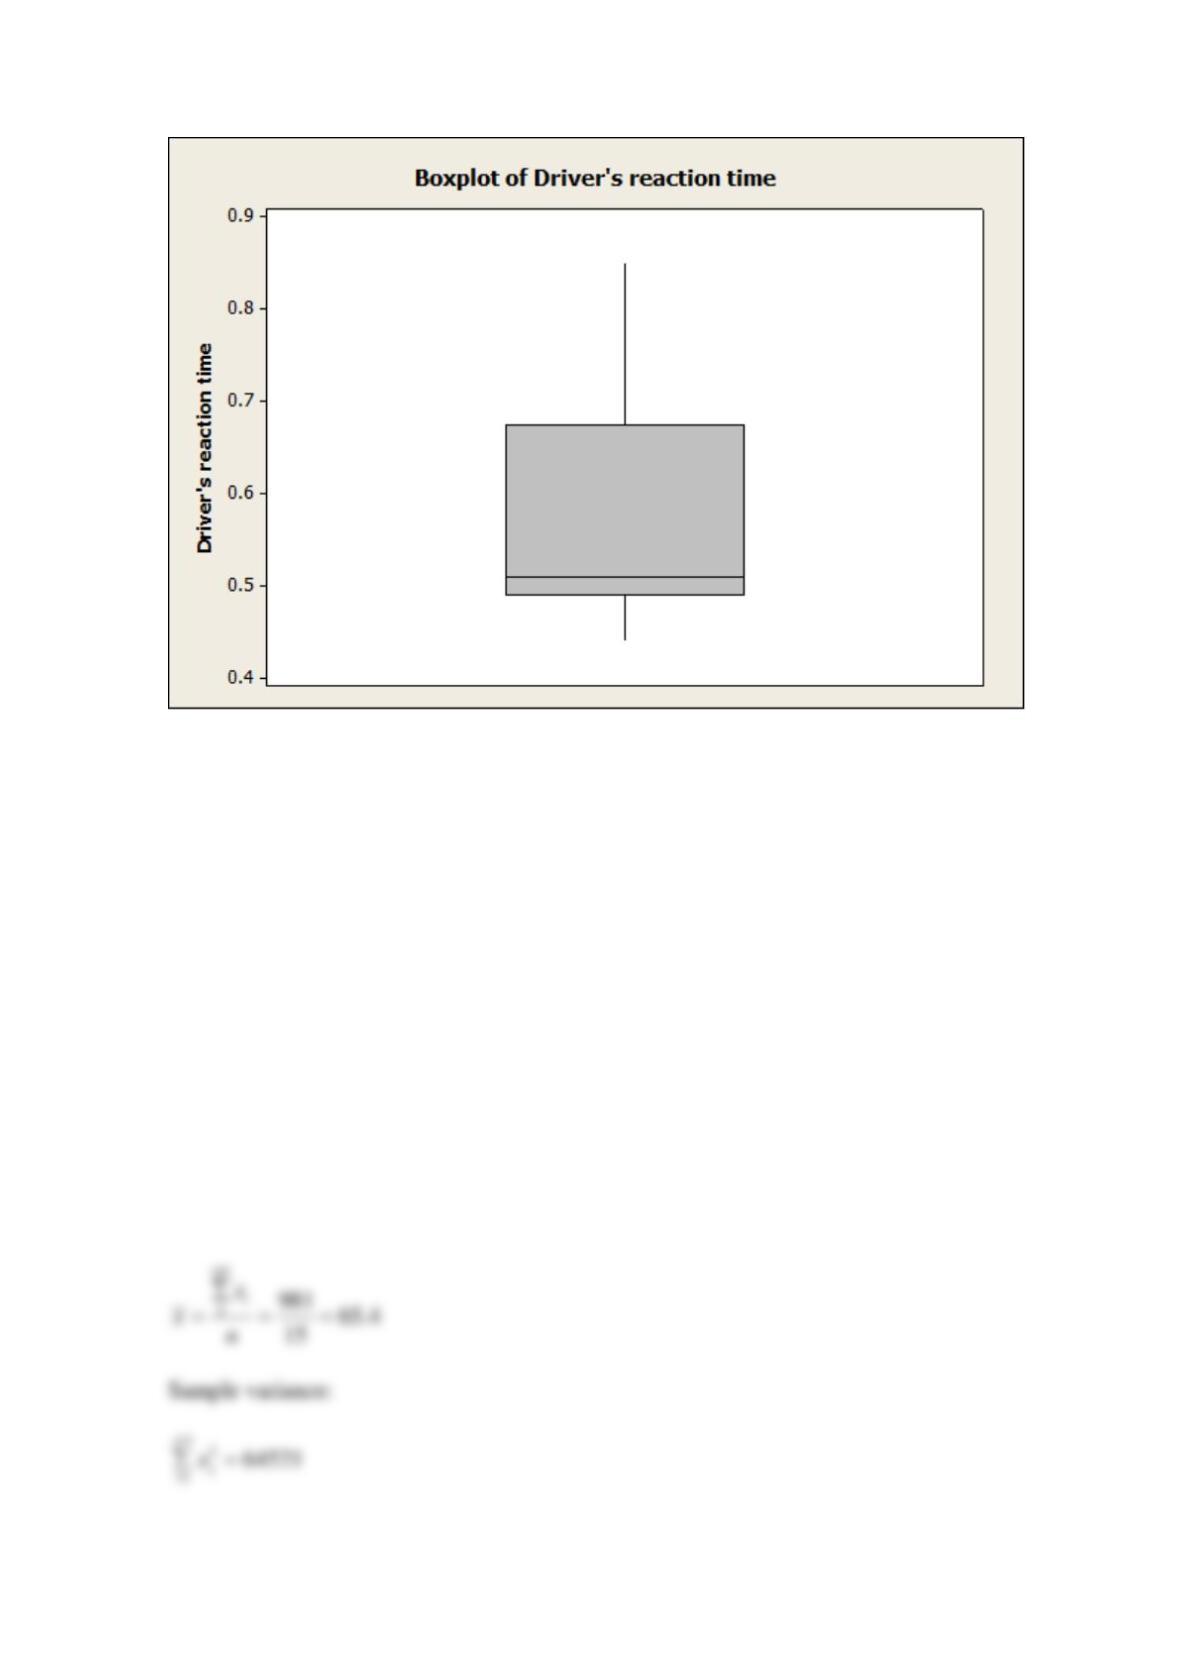
(c) Construct a box plot of the data. Find the interquartile range and determine the number of
outliers.
SOLUTION
(a) Sample mean:
Sample standard deviation:
(b)
Median 0.51=
(c)
31
0.17IQR q q= − =
Reserve Problems Chapter 6 Section 4 Problem 2
The weather forecast for New York for the period from 1 May 2017 to 15 May 2017 represents
the following set of maximal temperatures in °F: 75, 71, 61, 59, 64, 61, 62, 59, 62, 65, 65, 65, 68,
72, 72.
(a) Calculate the sample mean, sample variance, and standard deviation.
(b) Find the median and quartiles for the data.
(c) Construct a box plot of the data. Find the interquartile range and determine the number of
outliers.
SOLUTION
(a) Sample mean:
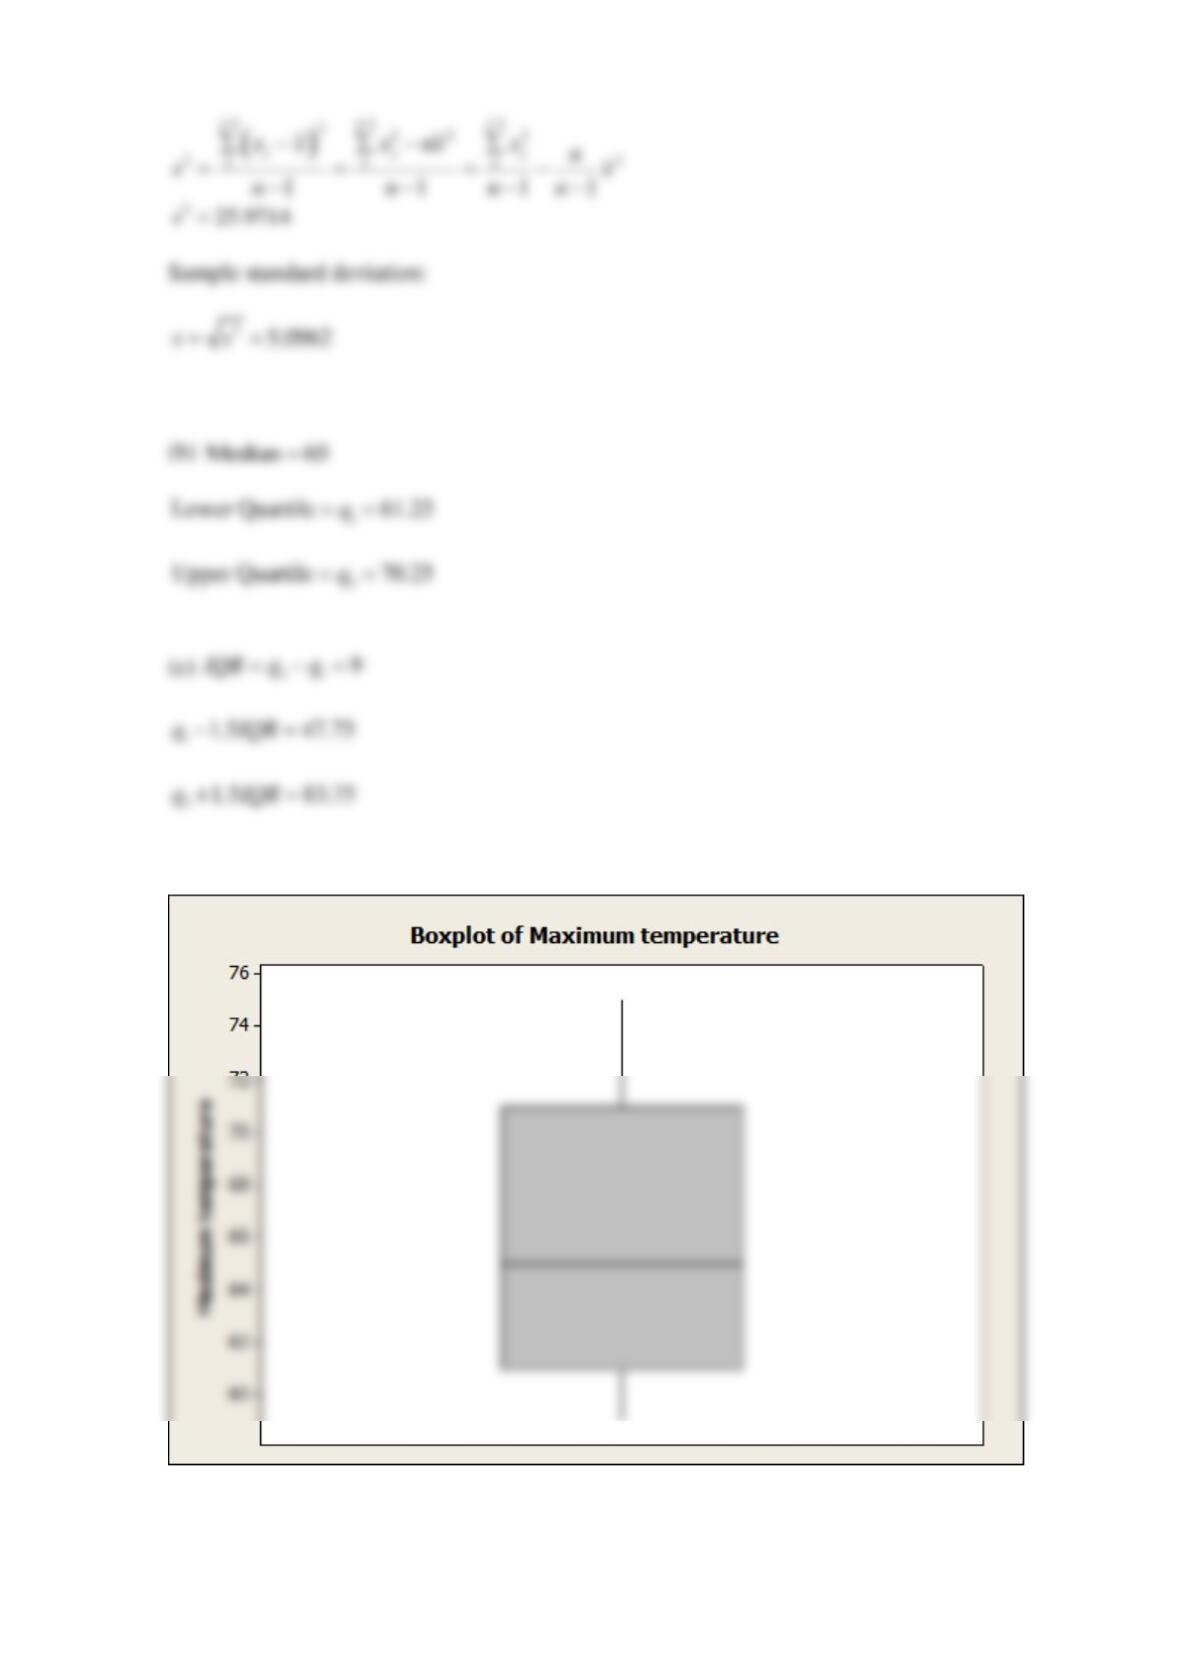
Therefore, there is no outliers and the box plot is
Reserve Problems Chapter 6 Section 4 Problem 3