Applied Statistics and Probability for Engineers, 7th edition 2017
5-1
CHAPTER 5
Section 5-1
5.1.1 First, f(x,y) ≥ 0. Let R denote the range of (X, Y)
Then,
= + + + + =
1 1 1 1 1
( , ) 1
4 8 4 2 4
R
f x y
a) P(X < 2.5, Y < 3) = f(1.5,2) + f(1,1) = 1/8 + 1/4 = 3/8
5.1.2 f(x,y) ≥ 0 and
( , ) 1
R
f x y =
a)
1 1 3
( 0.5, 1.5) ( 1, 2) ( 0.5, 1) 8 4 8
XY XY
P X Y f f = − − + − − = + =
Applied Statistics and Probability for Engineers, 7th edition 2017
5-2
5.1.3 a) The range of (X,Y) is
x,y
fxy (x,y)
0,0
0.857375
0,1
0.1083
0,2
0.00456
b)
x
fx(x)
0
0.970299
1
0.029403
2
0.000297
3
0.000001
5.1.4 a) The range of (X,Y) is X ≥ 0, Y ≥ 0 and X + Y ≤ 4. Here, X is the number of pages with moderate
graphic content and Y is the number of pages with high graphic output among a sample of four
pages.
The following table is for sampling without replacement. Students would have to extend the
hypergeometric distribution to the case of three classes (low, moderate, and high).
0,3
0.000064
1,0
0.027075
1,1
0.00228
1,2
0.000048
2,0
0.000285
2,1
0.000012
3,0
0.000001
Applied Statistics and Probability for Engineers, 7th edition 2017
5-3
5.1.5 a) The range of (X,Y) is X ≥ 0, Y ≥ 0, and X + Y ≤ 4.
Here, X and Y denote the number of defective items found with inspection devices 1 and 2,
respectively.
5.1.7 Number of students:
Electrical 24
Industrial 4
Mechanical 12
X and Y = numbers of industrial and mechanical students in the sample, respectively.
Applied Statistics and Probability for Engineers, 7th edition 2017
5-4
1
2
0.069329
b)
{ | 4}
( ) ( ) ( , )
XY
yx
X
y
f x yf x P X x
+
= = =
x
f(x)
0
0.644545
1
0.312507
2
0.041361
3
0.001576
4
5.1.8
++
+ = +
3 2 3 22
00
() 2
xx
x
x
y
c x y dydx xy dx
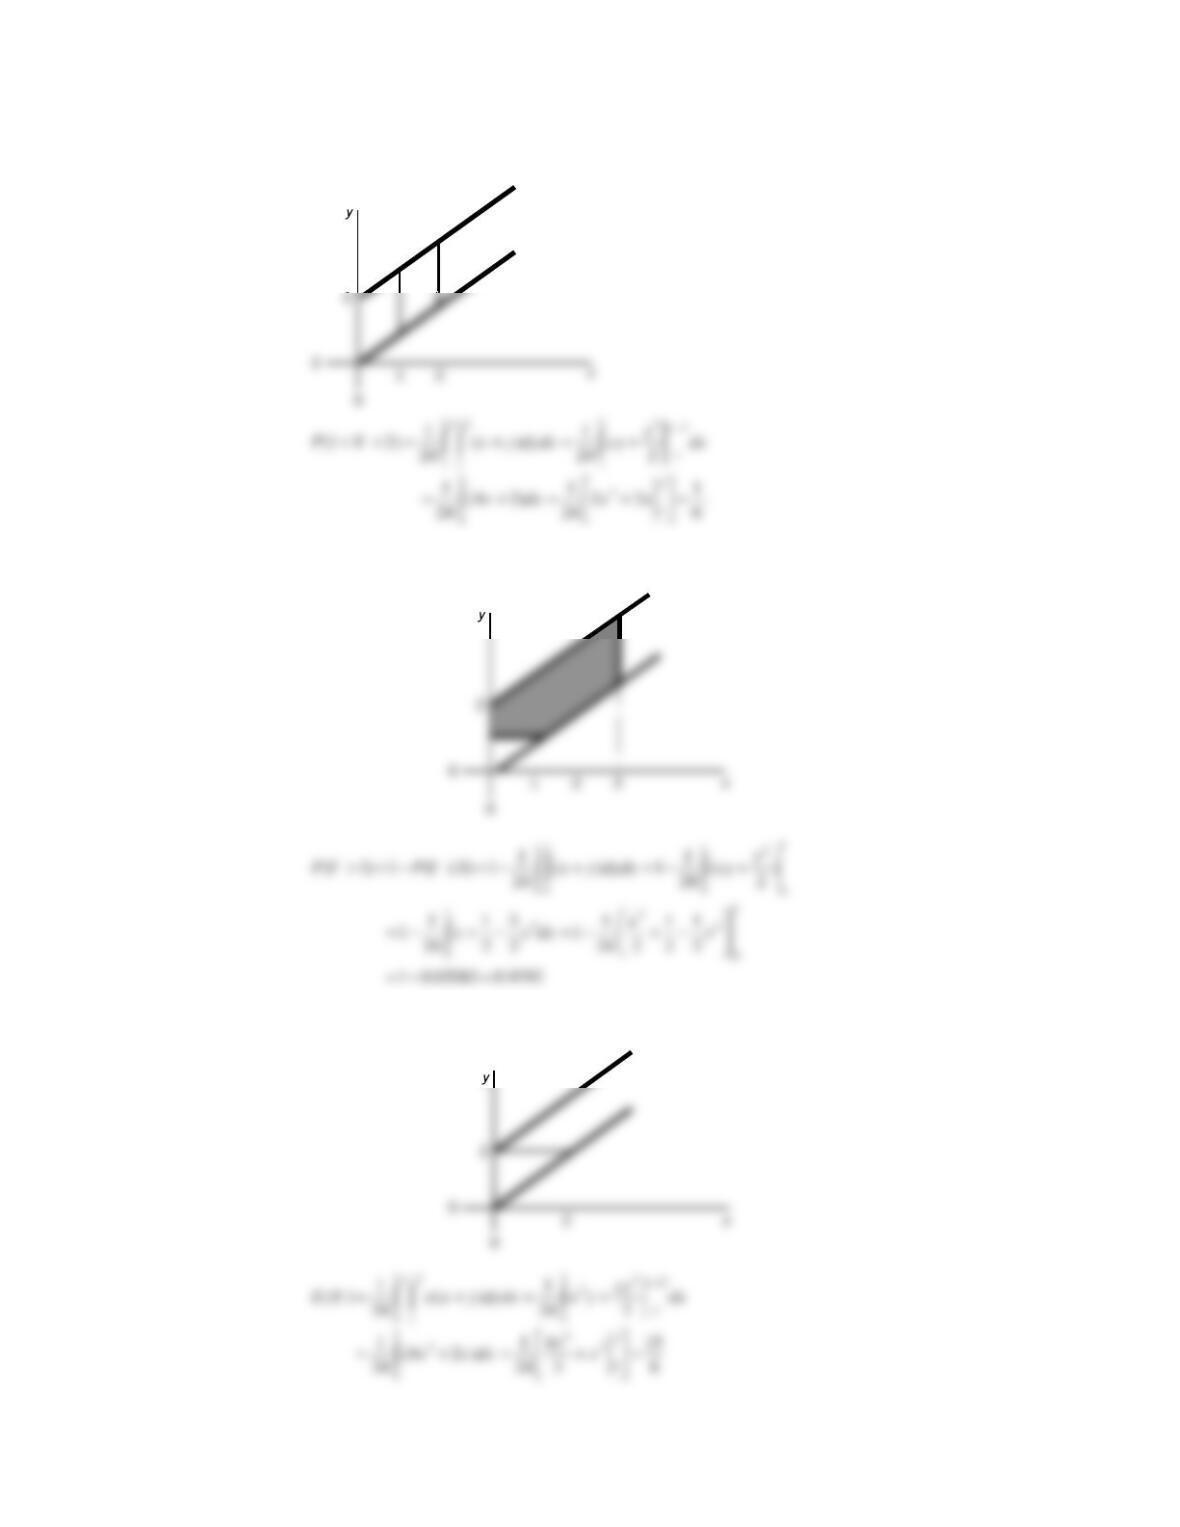
a) P(X < 1, Y < 2) equals the integral of
( , )
XY
f x y
over the following region.
1
3
0.009629
2
0
2
1
0.018908
2
2
0.004333
3
0
3
1
0.000525
4
0
Applied Statistics and Probability for Engineers, 7th edition 2017
5-5
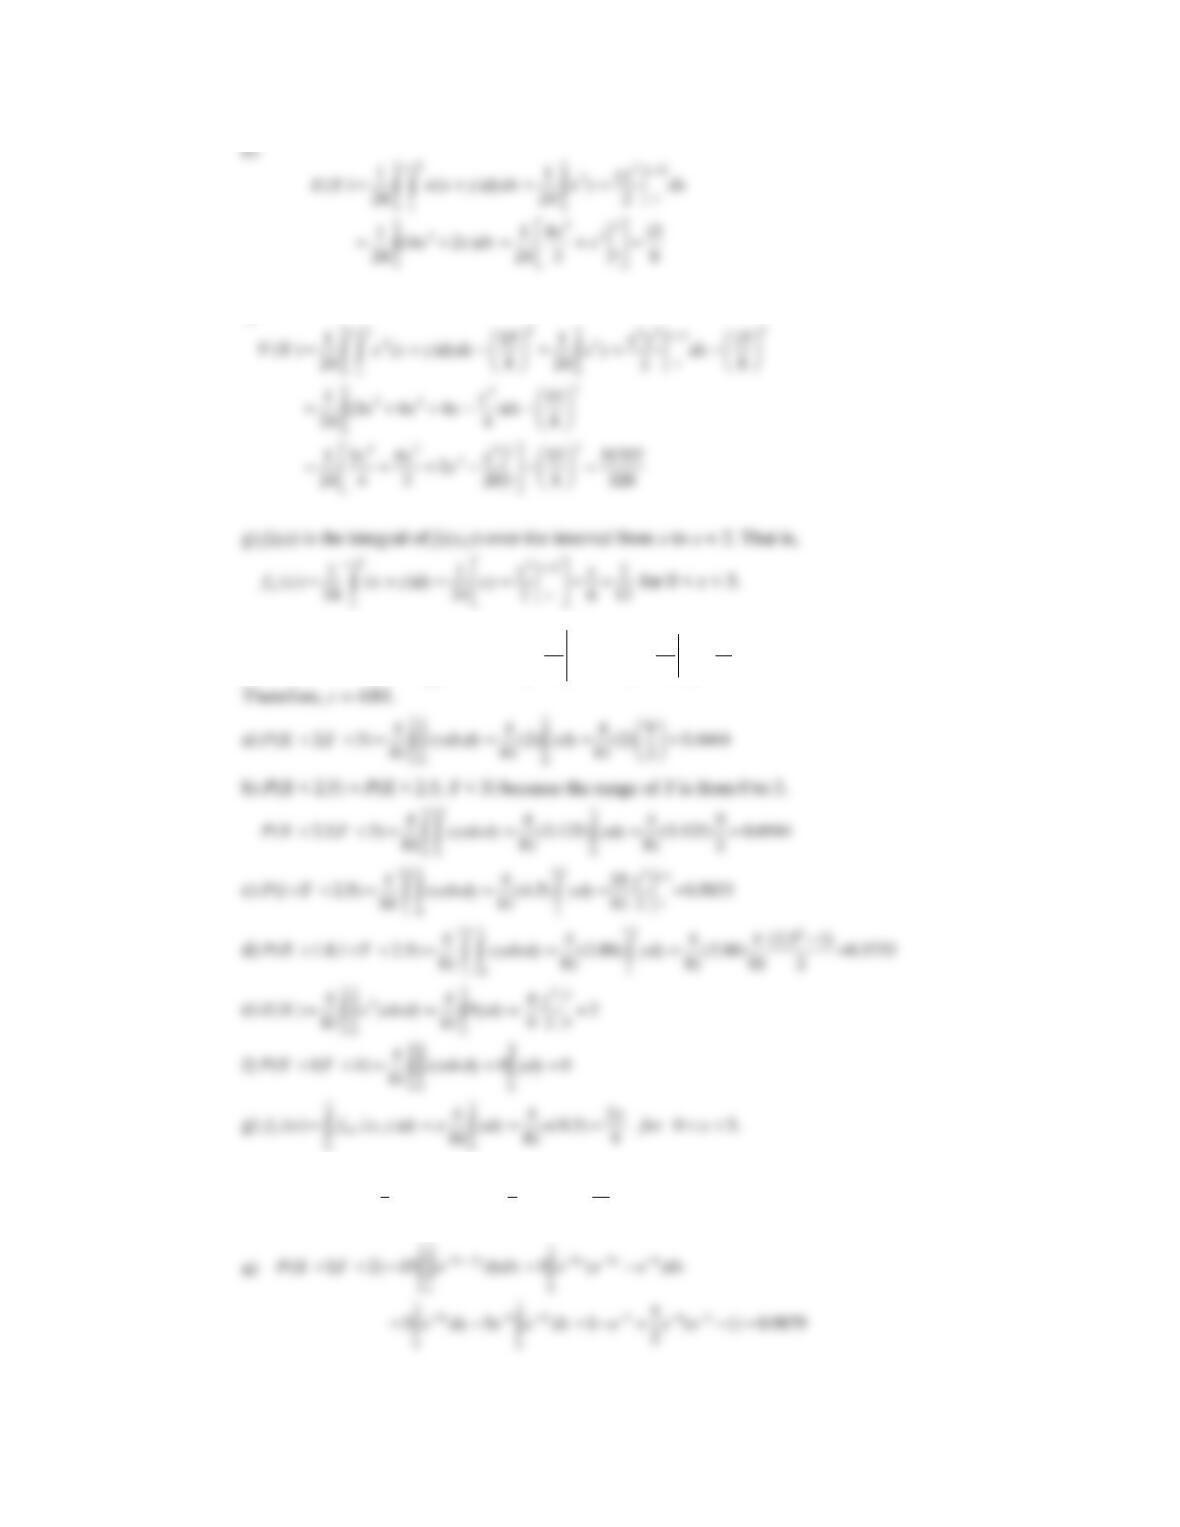
b) P(1 < X < 2) equals the integral of
( , )
XY
f x y
over the following region.
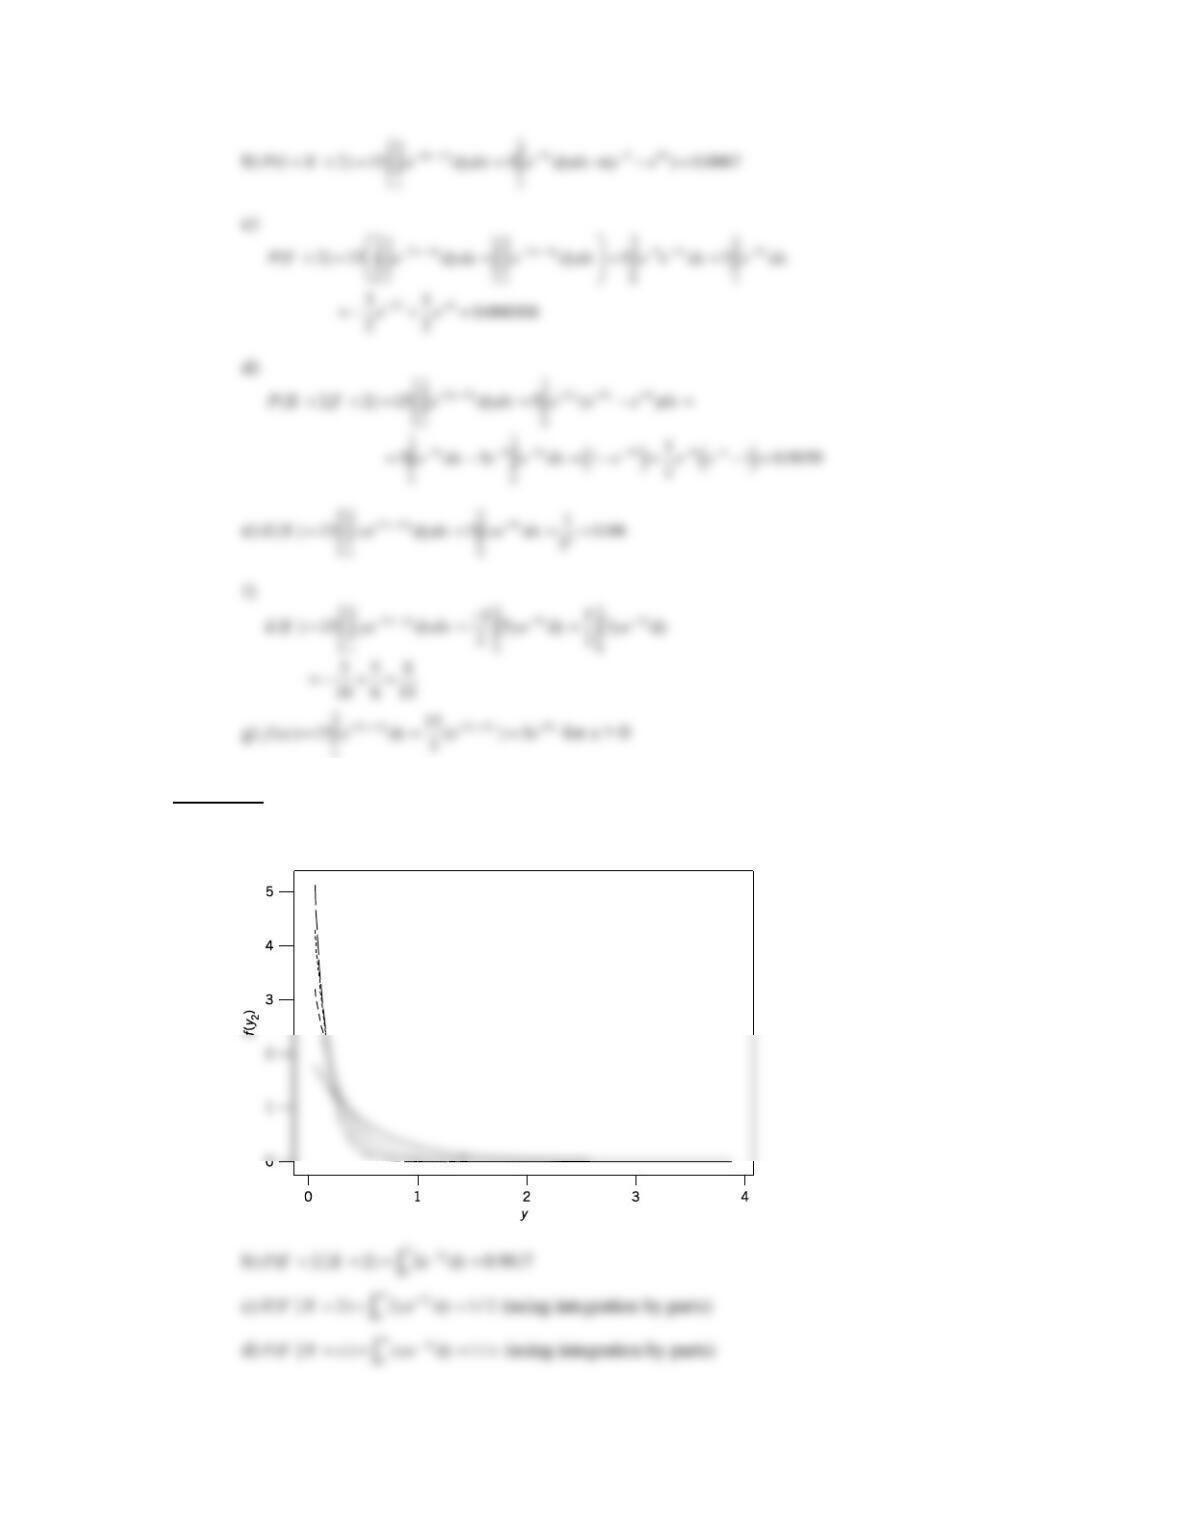
c) P(Y > 1) is the integral of fXY(x,y) over the following region.
d) P(X < 2, Y < 2) is the integral of fXY(x,y) over the following region.
Applied Statistics and Probability for Engineers, 7th edition 2017
5-6
f)
5.1.9 Determine c such that
= = =
3 3 3 22
33
00
0 0 0
81
4.5 .
2 2 4
xy
c xydxdy c y dy c c
5.1.10
− − − − −
= = =
2 3 2 3 5
0 0 0
1
()
3 3 15
x y x x x
x
cc
c e e dydx e e dx e dx c
c = 15
Applied Statistics and Probability for Engineers, 7th edition 2017
5-7
Section 5-2
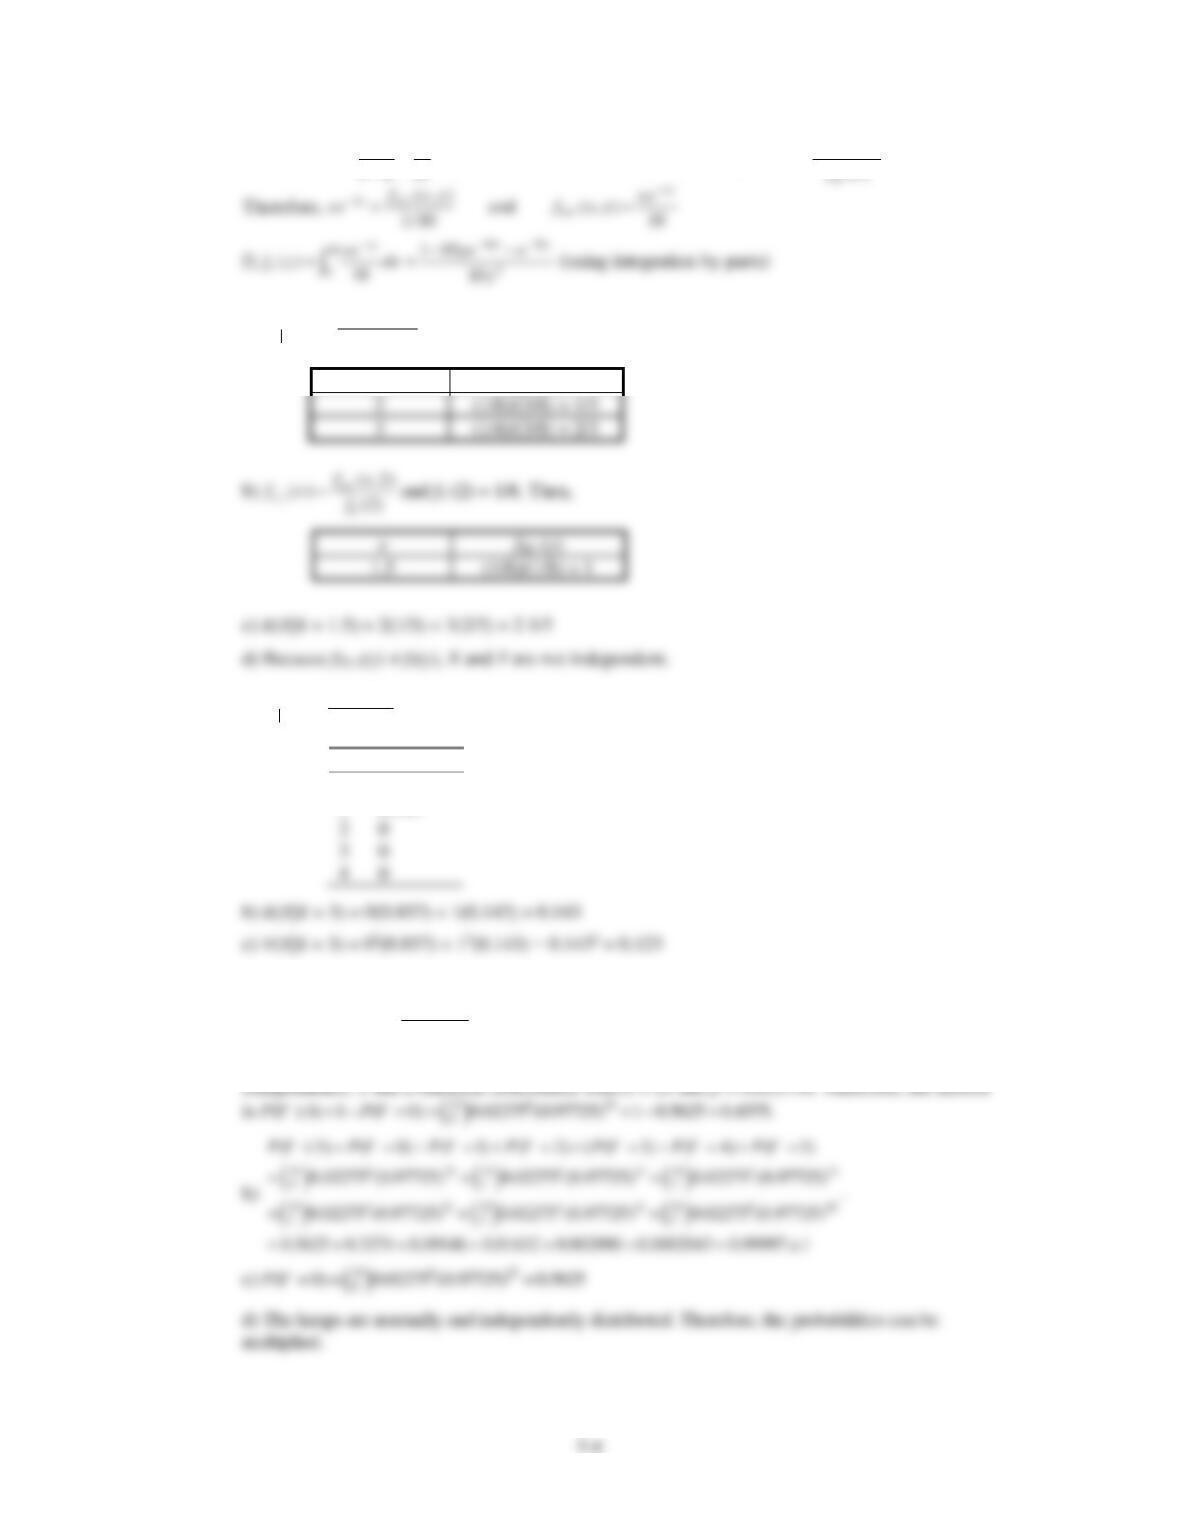
5.2.1 a) fY|X=x(y), for x = 2, 4, 6, 8
Applied Statistics and Probability for Engineers, 7th edition 2017
e) Use
= =
−
(0
)11
1
Xba
fx
, fY|X (x,y) = xe−xy, and the relationship
=
|
( , )
( , ) ()
XY
YX
f x y
f x y fx
5.2.2 a)
=
1.5
(1.5, )
() (1.5)
XY
Y
X
fy
fy f
and fX(1.5) = 3/8. Then,
y
fY|1.5 (y)
x
5.2.3 a)
=
3
(3, )
() (3)
XY
Y
X
fy
fy f
, fx(3) = 0.0725
y
fY|3(y)
0
0.857
1
0.143
2
0
3
0
4
0
5.2.4 a) Let X denote the grams of luminescent ink. Then,
−
= = − =
1.14 1.2
( 1.14) ( 2) 0.022750
0.3
P X P Z P Z
Let Y denote the number of bulbs in the sample of 25 that have less than 1.14 grams. Then, by
5-9
5.2.5 a) fY|x(y) = e−(y−x) ≥ 0 for all y > x.
e)
= =
2
|1
( 2 | 1) ( )
Y
P Y X f y dy
because x < y and x = 1. Therefore,
− − −
= = = −
2
( 1) 1
( 2 | 1) 1
y
P Y X e dy e
5.2.6
Y
X
0
50
75
0
0.9819
0.0122
0.0059
50
0.1766
0.7517
0.0717
75
0.0237
0.0933
Applied Statistics and Probability for Engineers, 7th edition 2017
5-10
5.2.7 X: Demand for MMR vaccine is normally distributed with mean 1.1 and standard
deviation 0.3.
Y: Demand for varicella vaccine is normally distributed with mean 0.55 and standard deviation
0.1.
a) P(X ≤ 1.2, Y ≤ 0.6) = P(X ≤ 1.2)P(Y ≤ 0.6) because X and Y are independent.
Applied Statistics and Probability for Engineers, 7th edition 2017
5-11
This is recognized as a bivariate normal distribution. From the formulas for the mean and variance
of a conditional normal distribution, we have
5.2.9 a)
==
|2
(2, )
( ) ( )
(2)
XY
Y
X
fy
f y f y
f
, fx(2) = 2.899 × 10⁻⁴
y
fY|1(y) = f(y)
0
8.1 × 10⁻¹¹
1
2
5.37 × 10⁻⁵
Applied Statistics and Probability for Engineers, 7th edition 2017
5-12
Section 5-3
5.3.1 a) fXYZ(x,y,z)
fXYZ(x,y,z)
Selects(X)
Updates(Y)
Inserts(Z)
0.43
23
11
12
b) PXY|Z=0
PXY|Z=0(x,y)
Selects(X)
Updates(Y)
Inserts(Z)
5.3.2. a) P(X = 2) = fXYZ(2,1,1) + fXYZ(2,1,2) + fXYZ(2,2,1) + fXYZ(2,2,2) = 0.5
0.44
0.04
Applied Statistics and Probability for Engineers, 7th edition 2017
5-13
5.3.4
+
22
4
0
4xy
cdzdydx
= the volume of a cylinder with a base of radius 2 and a height of 4 = (π22)4 =
16π. Therefore,
=1
16
c
a) P(X2 + Y2 < 2) equals the volume of a cylinder of radius
2
and a height of 4 (=8
) times c.
Therefore, the answer is
=
81 / 2
16 .
Applied Statistics and Probability for Engineers, 7th edition 2017
5-14
Section 5-4
5.4.1 E(X) = 1(3/8) + 2(1/2) + 4(1/8) = 15/8 = 1.875
5.4.2
==
+ = =
33
11
( ) 36 , 1 / 36
xy
c x y c c
5.4.3 Let X and Y denote the number of patients who improve or degrade, respectively, and let Z denote
the number of patients that remain the same. If X = 0, then Y can equal 0, 1, 2, 3, or 4. However, if
X = 4 then Y = 0. Consequently, the range of the joint distribution of X and Y is not rectangular.
Therefore, X and Y are not independent.
Var(X + Y) = Var(X) + Var(Y) + 2Cov(X,Y).
Therefore,
Applied Statistics and Probability for Engineers, 7th edition 2017
5-15
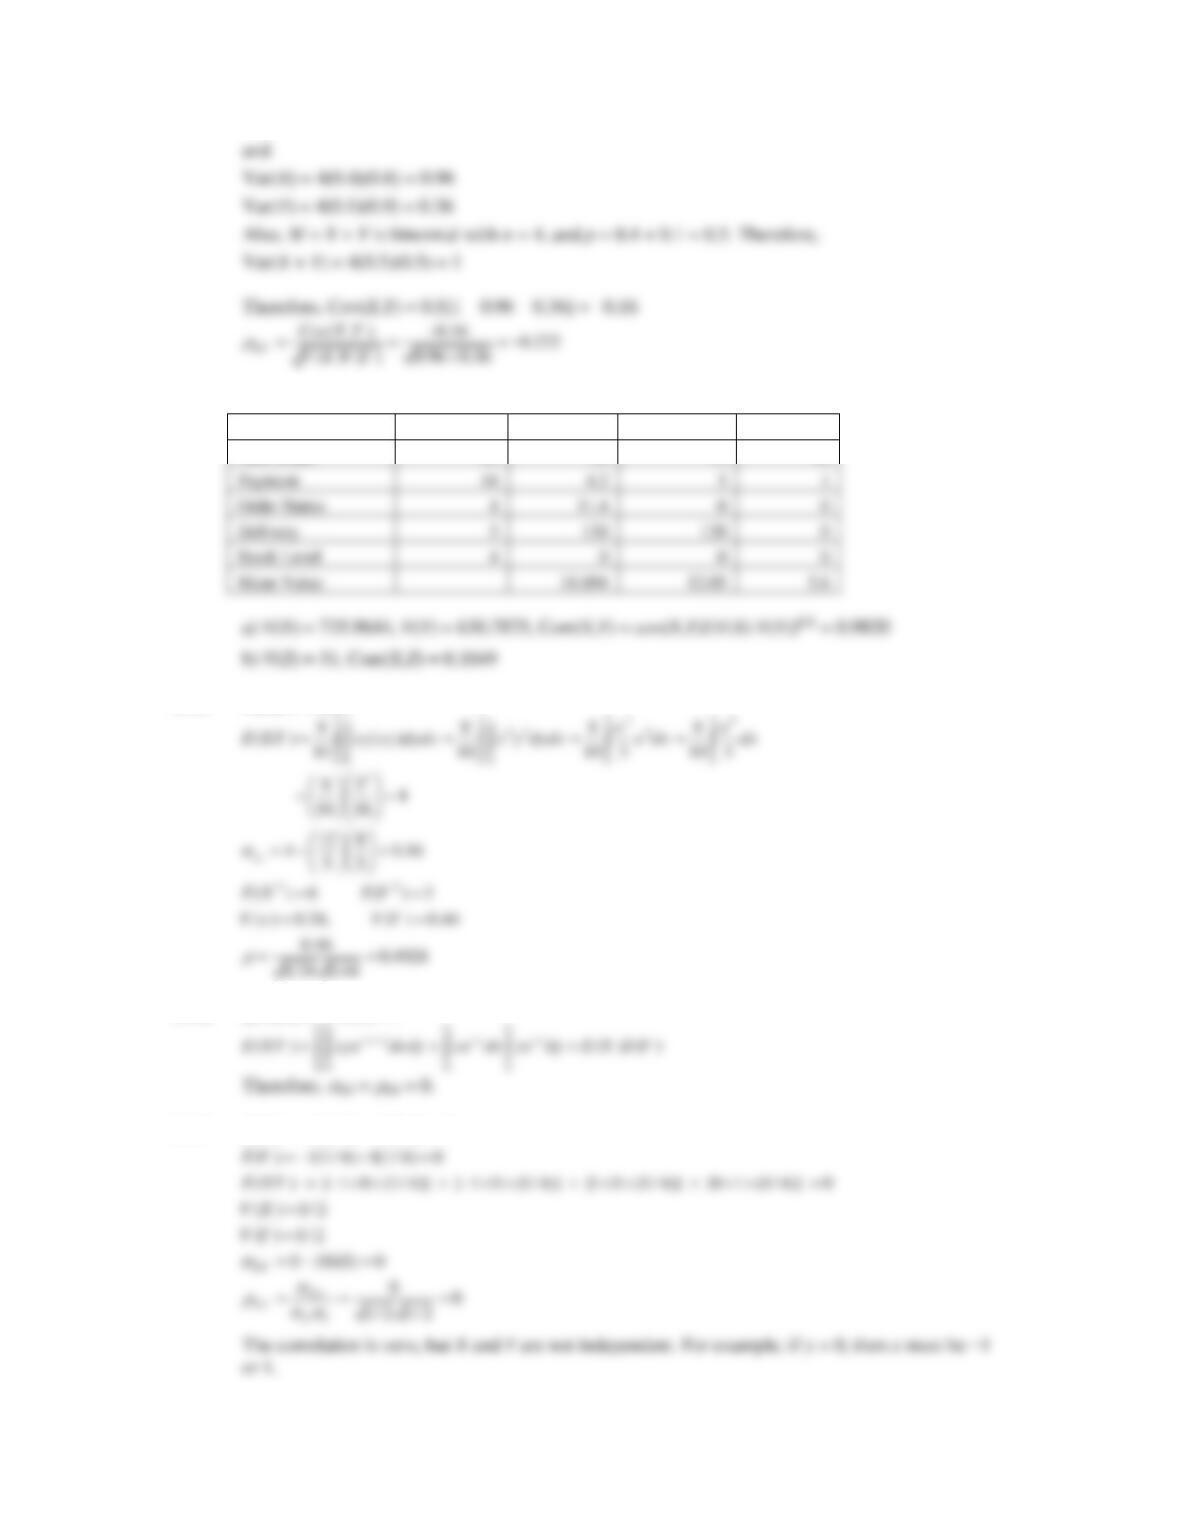
5.4.4
Transaction
Frequency
Selects(X)
Updates(Y)
Inserts(Z)
New Order
43
23
11
12
Stock Level
0
Mean Value
5.4.5 Here, c = 8/31
5.4.6 a) E(X) = 1 E(Y) = 1
5.4.7 E(X) = −1(1/4) + 1(1/4) = 0
Applied Statistics and Probability for Engineers, 7th edition 2017
5-16
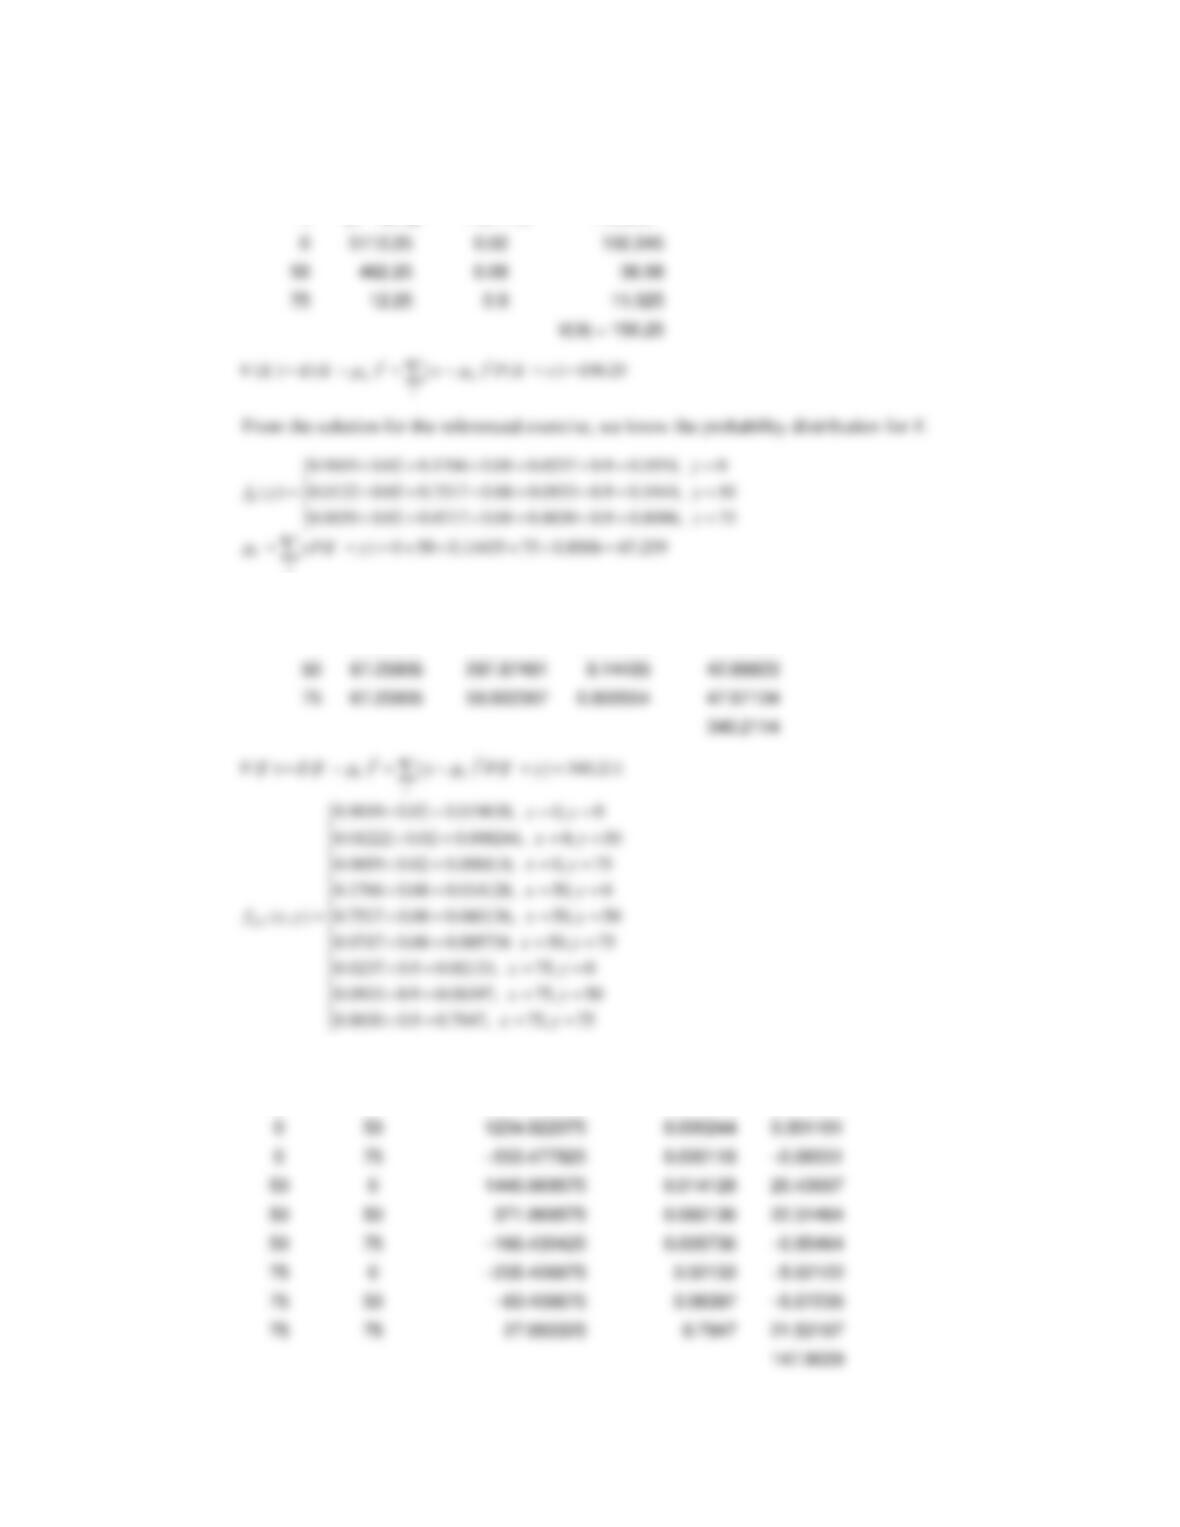
5.4.8
= = = + + =
( ) 0 50 0.08 75 0.9 71.5
X
x
xP X x
x
[x − E(X)]2
P(X = x)
Product
y
E(Y)
[y − E(Y)]2
P(Y = y)
P(Y = y)[y − E(Y)]2
0
67.25905
4523.7798
0.055096
249.2422
67.25905
297.87481
42.99823
67.25905
59.922307
0.800554
47.97104
340.2114
x
y
[x − E(X)][y − E(Y)]
P(X = x, Y = y)
Product
0
0
4809.022075
0.019638
94.43958
0
1234.022075
0.000244
0.301101
0
0.000118
0
1446.069575
0.014128
20.43007
0.060136
22.31464
0.005736
0
12.25
0.9
V(X) = 150.25
Applied Statistics and Probability for Engineers, 7th edition 2017
5-17
5.4.9
− − − − −
= = − + = − + − = + =
0 0 0
00
0 1 1
x x x x x
Xxe dx xe e dx x e
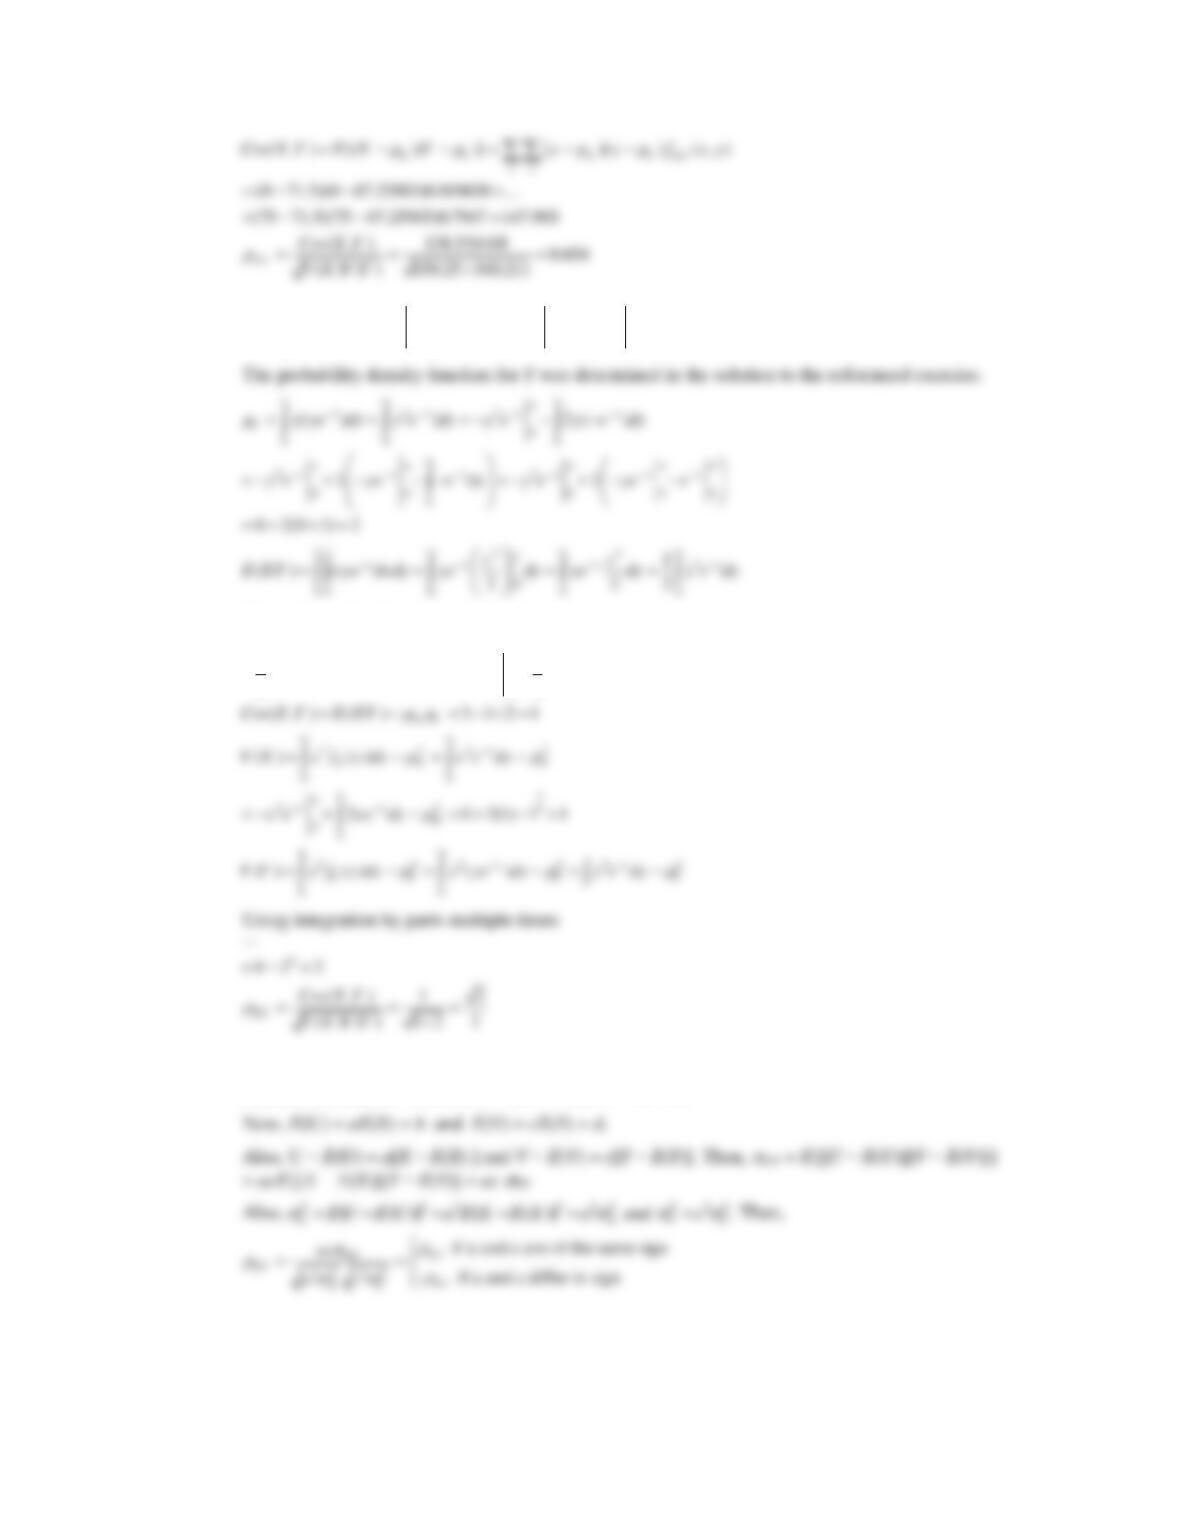
Using integration by parts multiple times
( )
( )
− − − −
= − − − − = − − =
32
0
…
11
3 6 6 0 ( 6) 3
22
y y y y
y e y e ye e
5.4.10 Suppose the correlation between X and Y is
. For constants a, b, c, and d, what is the correlation
between the random variables U = aX + b and V = cY + d?