CHAPTER 5
1. What is Design Dependent Parameters (DDP)? Use one of your favorite systems, give
three examples of DDPs for that system.
2. What is Technical Performance Measure (TPM)? Why TPM is important in systems
design? What is the relationship between DDP and TPM? Use one of the favorite systems,
give three examples of TPMs for that system.
The quantitative values for DDPs are called Technical performance measure. TPM are
3. Define reliability and list the major elements for systems reliability.
4. Define failure rate. Estimate the failure rate for the following system component:
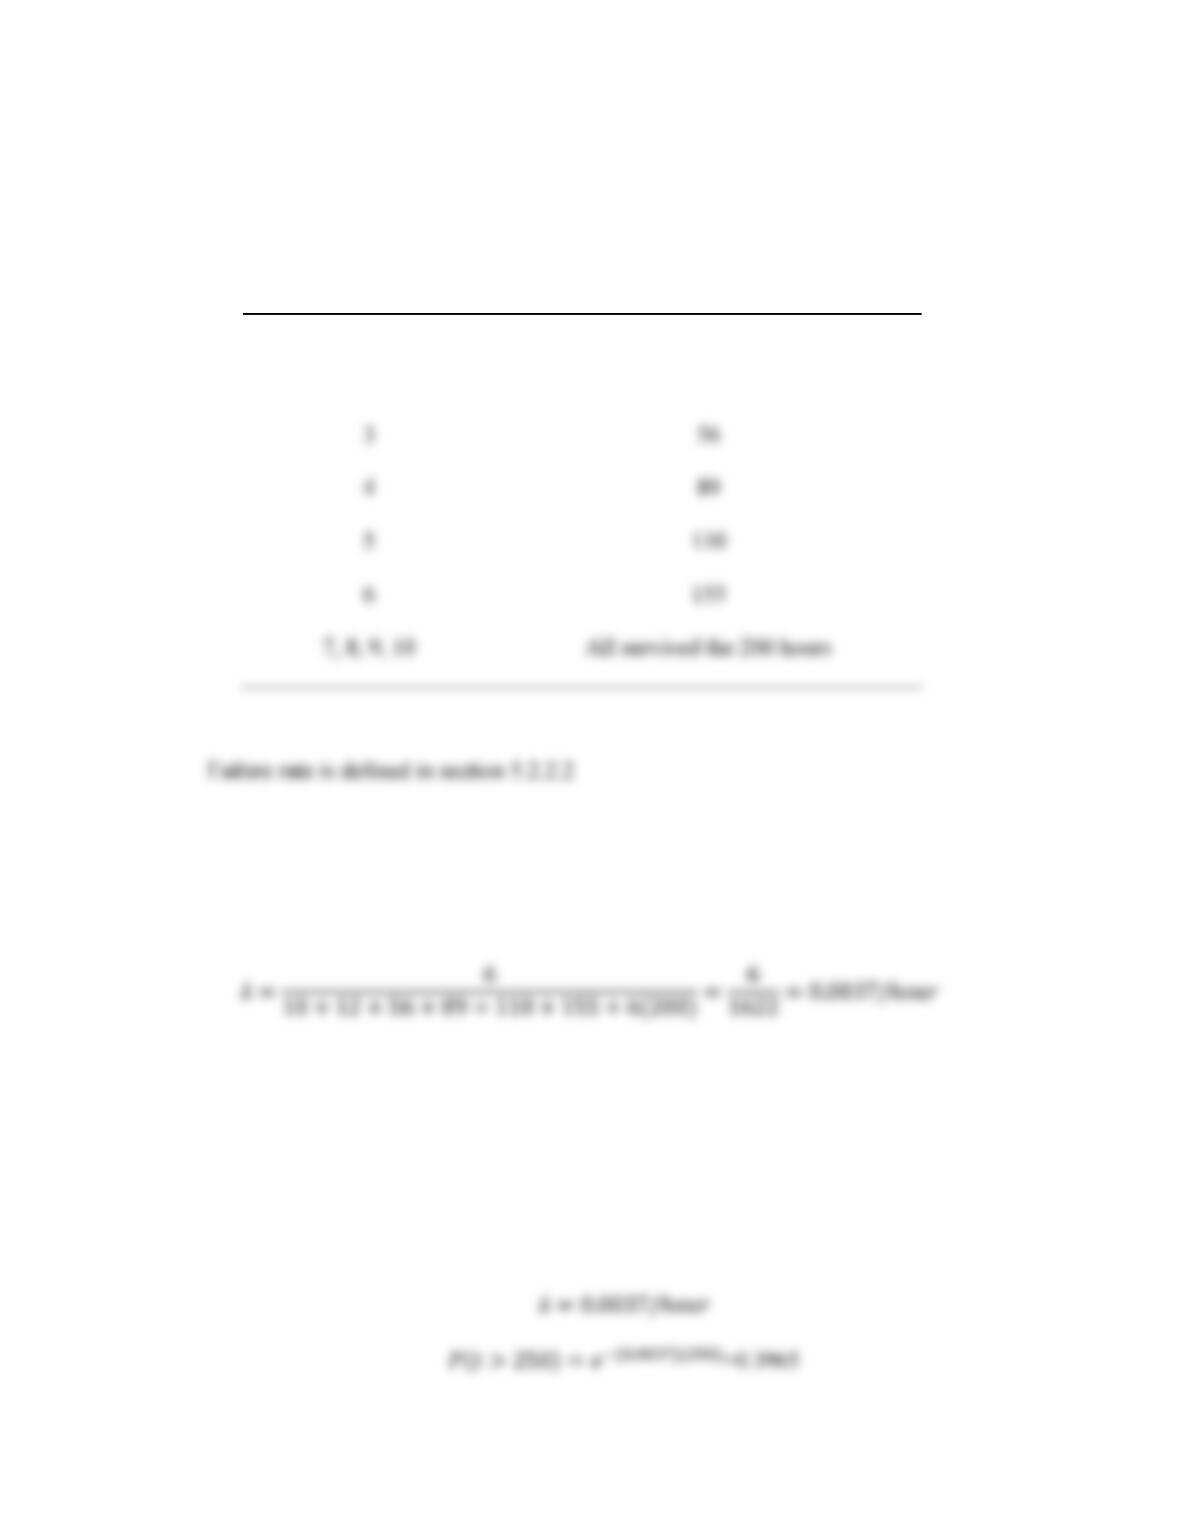
Suppose we tested 10 components for a reliability test for 200 hours simultaneously,
during the test, 6 failures occurred, as shown in the following table.
Components No. Failure Occurrence Time ( in hours)
1 10
2 12
Using equation (5.16) the failure rate is estimated as
5. Refer to question No.4, what the probability that a component will work for at least 250
hours without any failure if the failure is distributed exponentially?
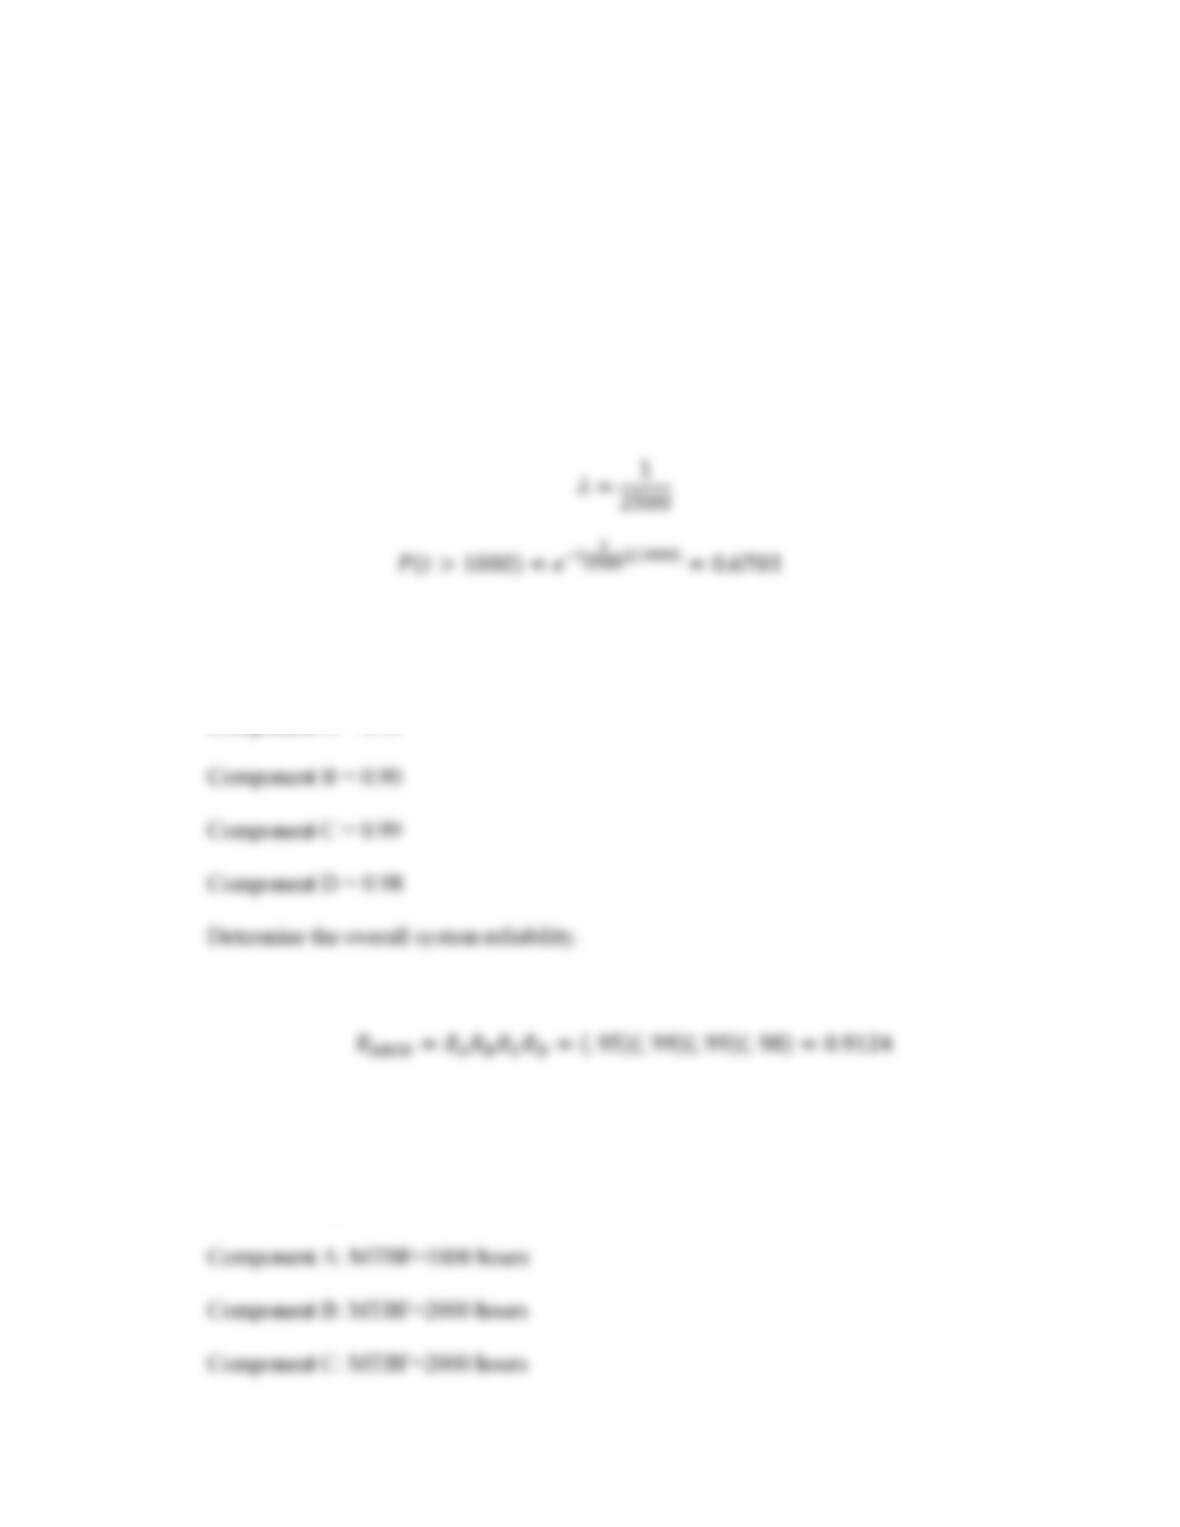
6. A system has a MTBF of 2500 hours. It has survived 1000 hours without any failure,
what is the probability that this system will survive another 1000 hours without any
failure if failure is distributed exponentially?
One thing to remember that the probability of surviving another 1000 hours is totally
independent to the previous 1000 hours for exponential failures. So
7. A system consists of four components connected in a series structure, the individual
components reliabilities are
Component A = 0.95
8. A system ABCD consists of four components, connected in a series structure, the MTBF
for these components are
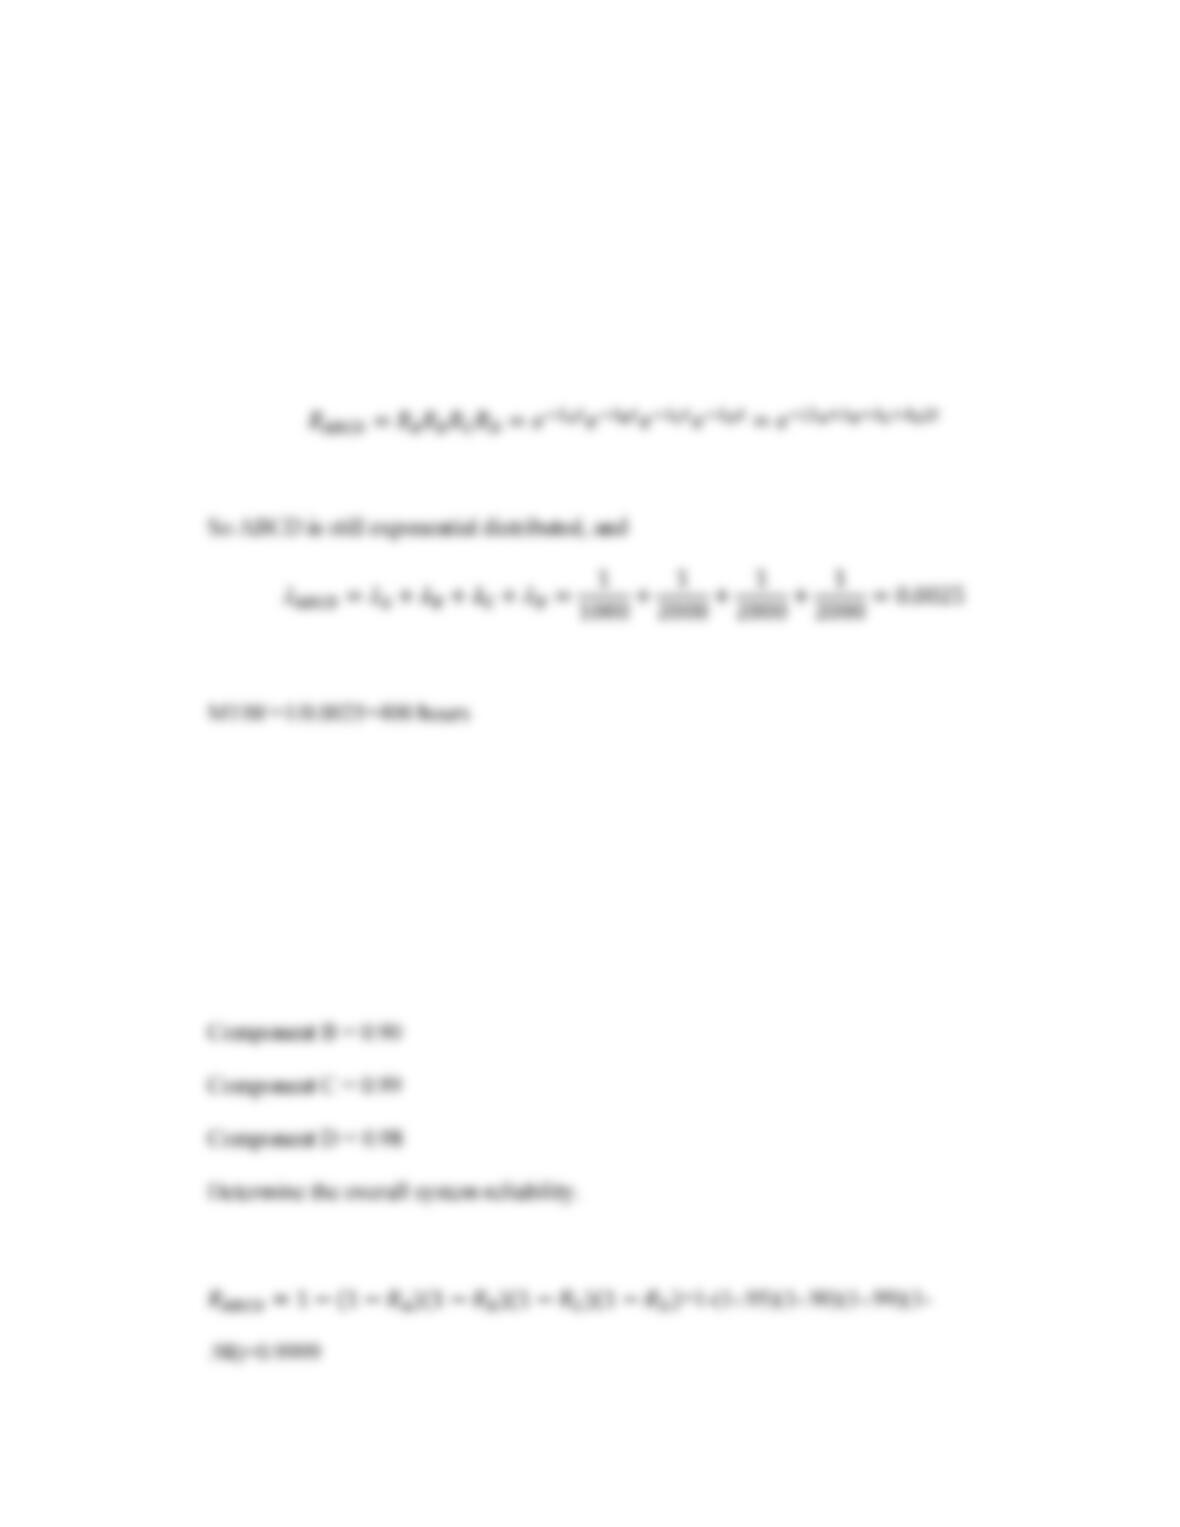
Component D: MTBF=2500 hours
Assuming all the failures are distributed exponentially independently, show that the
failure for system ABCD overall is also distributed exponentially. Estimate the MTBF for
system ABCD.
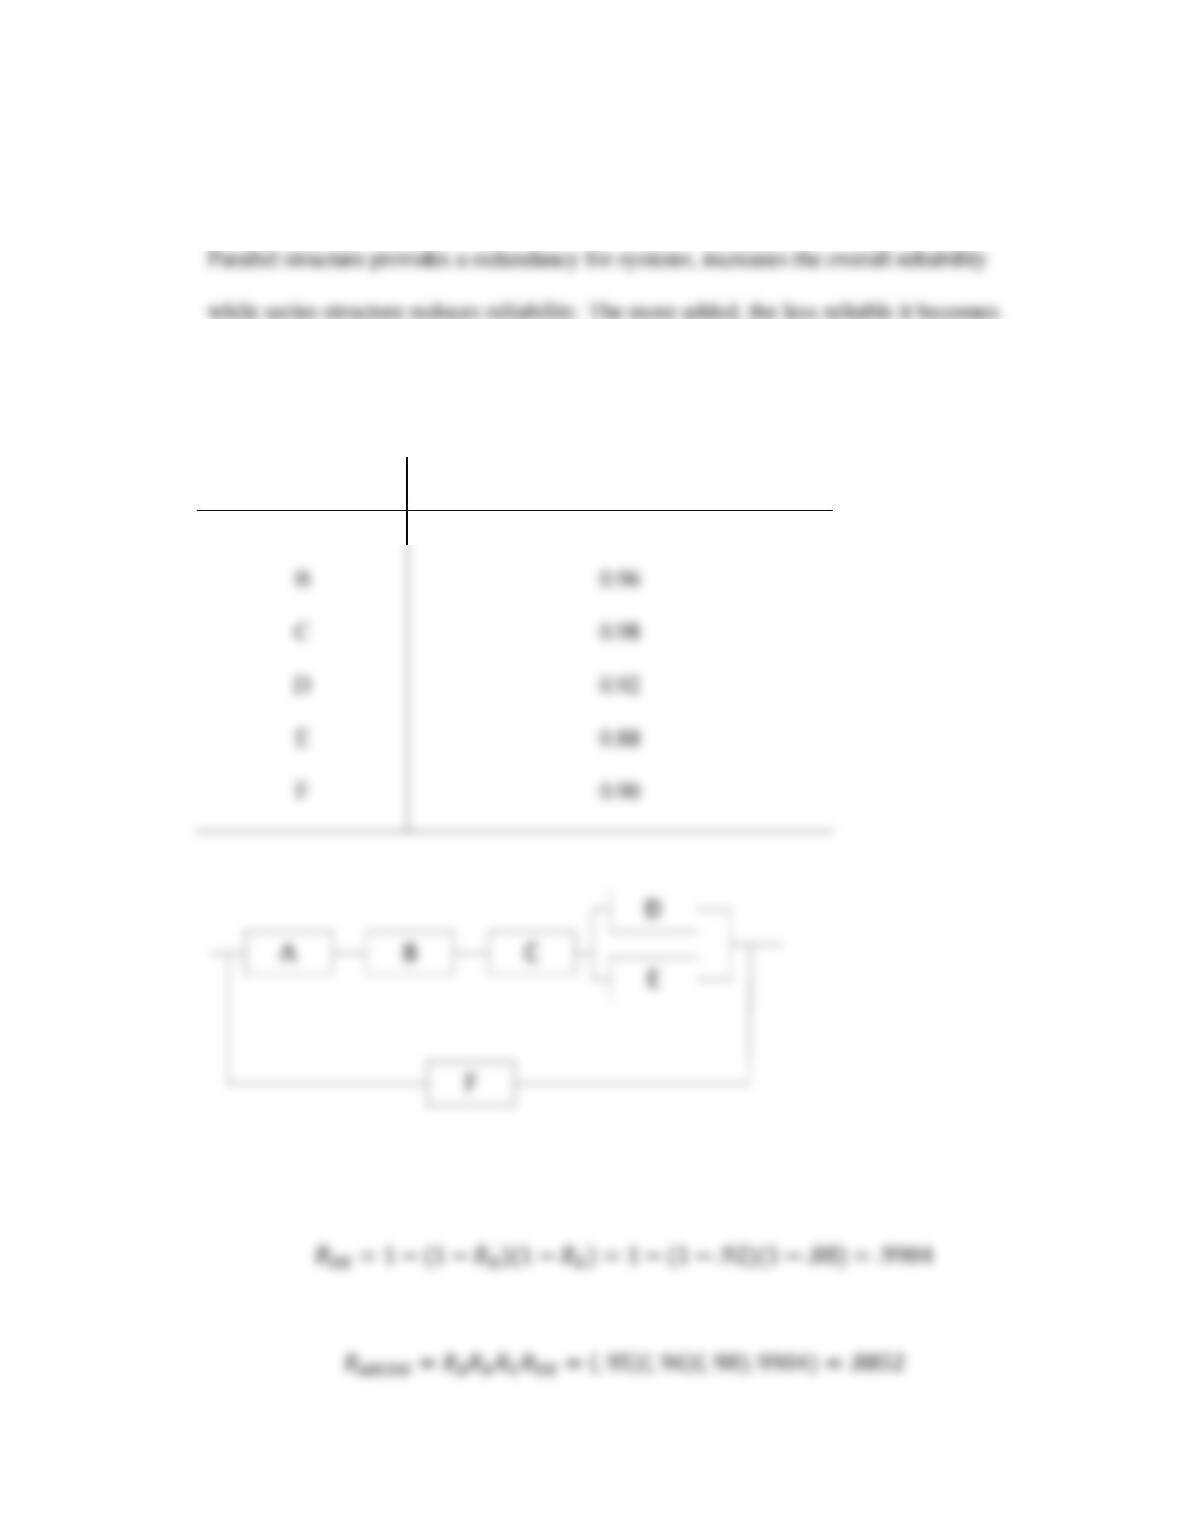
9. A system consists of four components connected in a parallel structure, the individual
components reliabilities are
Component A = 0.95
10. Compare the results between 8 and 10, what conclusion can you draw?
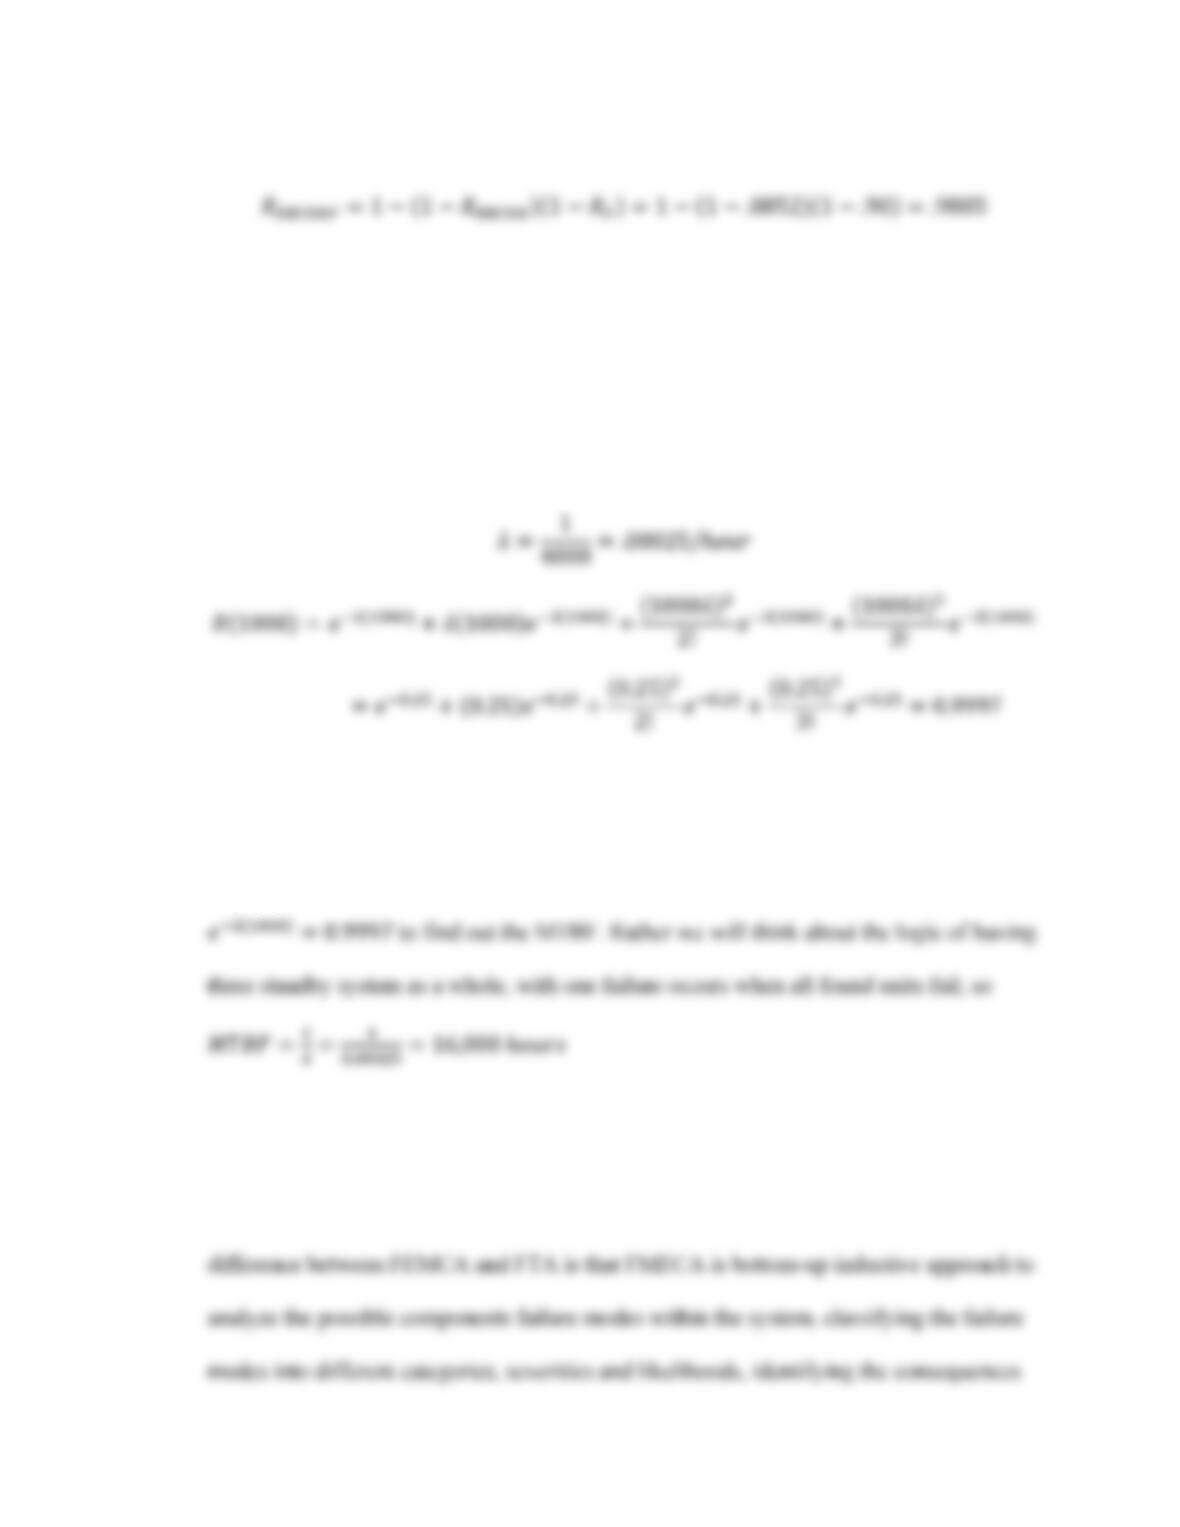
11. Estimate the reliability for the following system
Component Reliability
A 0.95
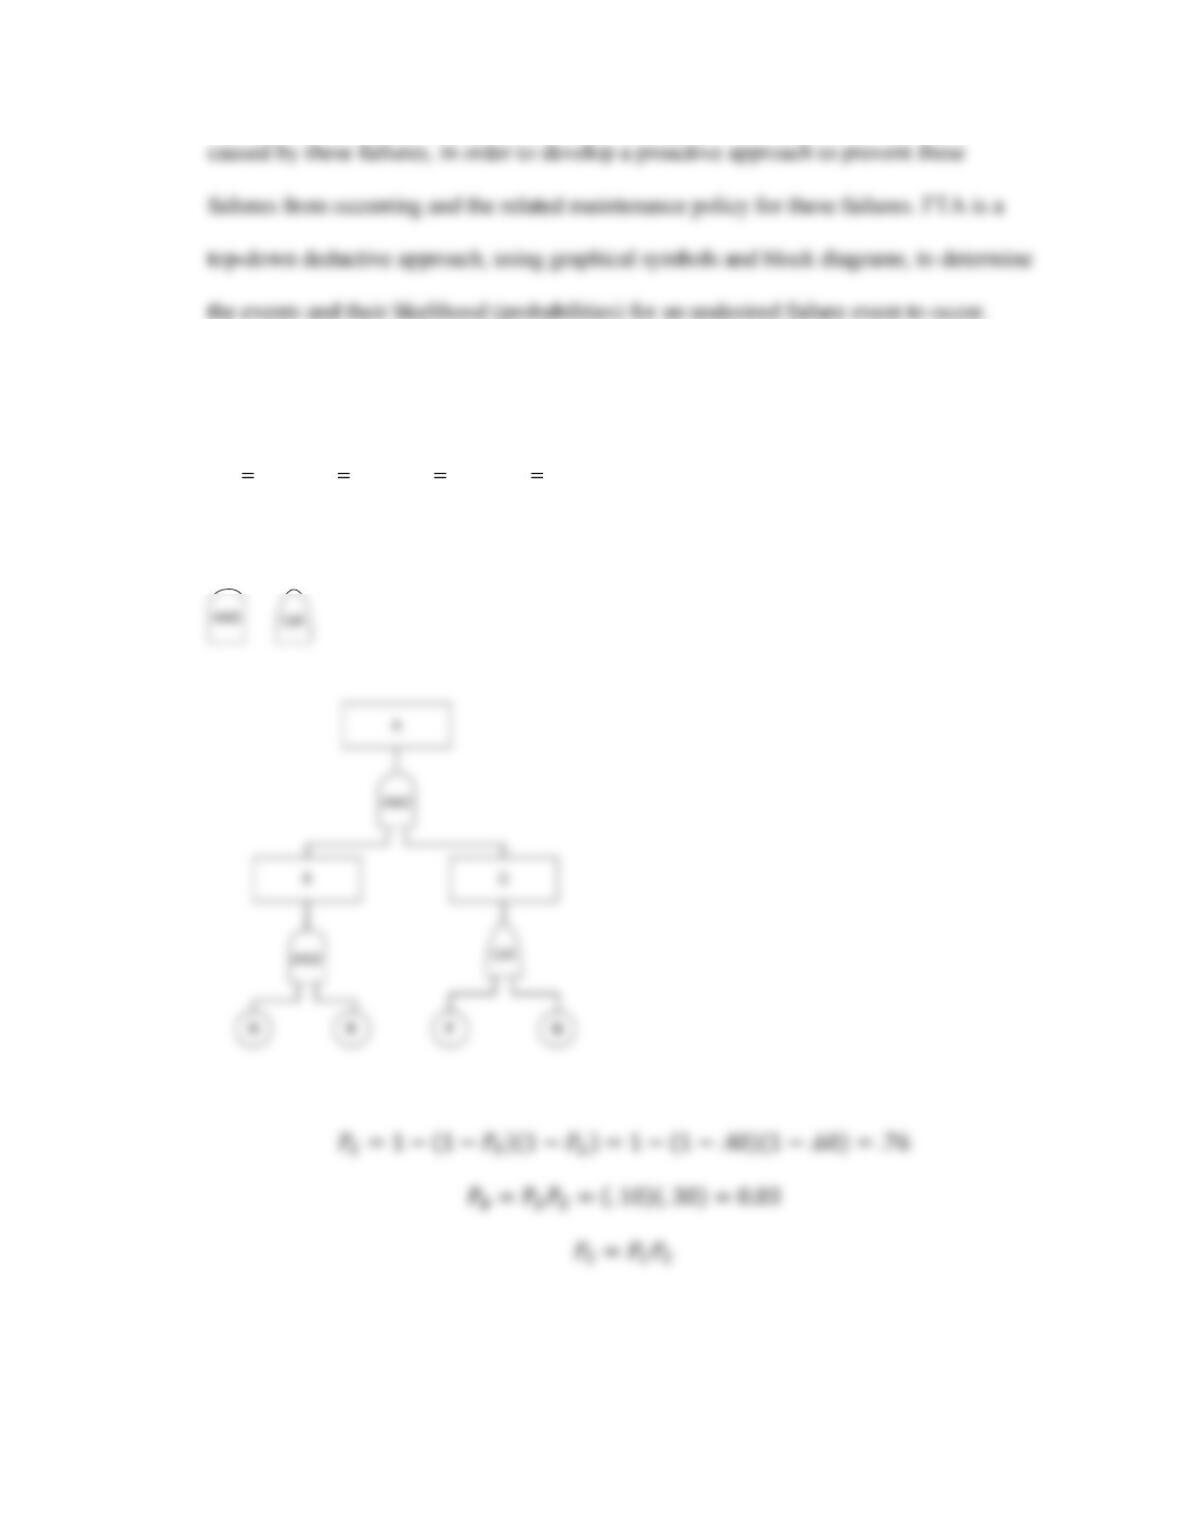
12. A system is running with three other identical parts in standby mode. Each part has a
MTBF of 4000 hours, distributed exponentially. Determine the system reliability for a
period of 1000 hours.
13. Estimated the MTBF for Question 13.
The standby system is no longer an exponential reliability system, so we can’t use
14. Define FMECA and FTA, what the differences between these two methods?
FEMCA and FTA definition can be found from the book, section 5.2.3. The main
15. The following shows a faulty tree of a system design, given that
10.0,40.0,30.0,10.0 GFED PPPP , what is A
P=?
16. Define System Maintainability. Explain the relationship between reliability and
maintainability.
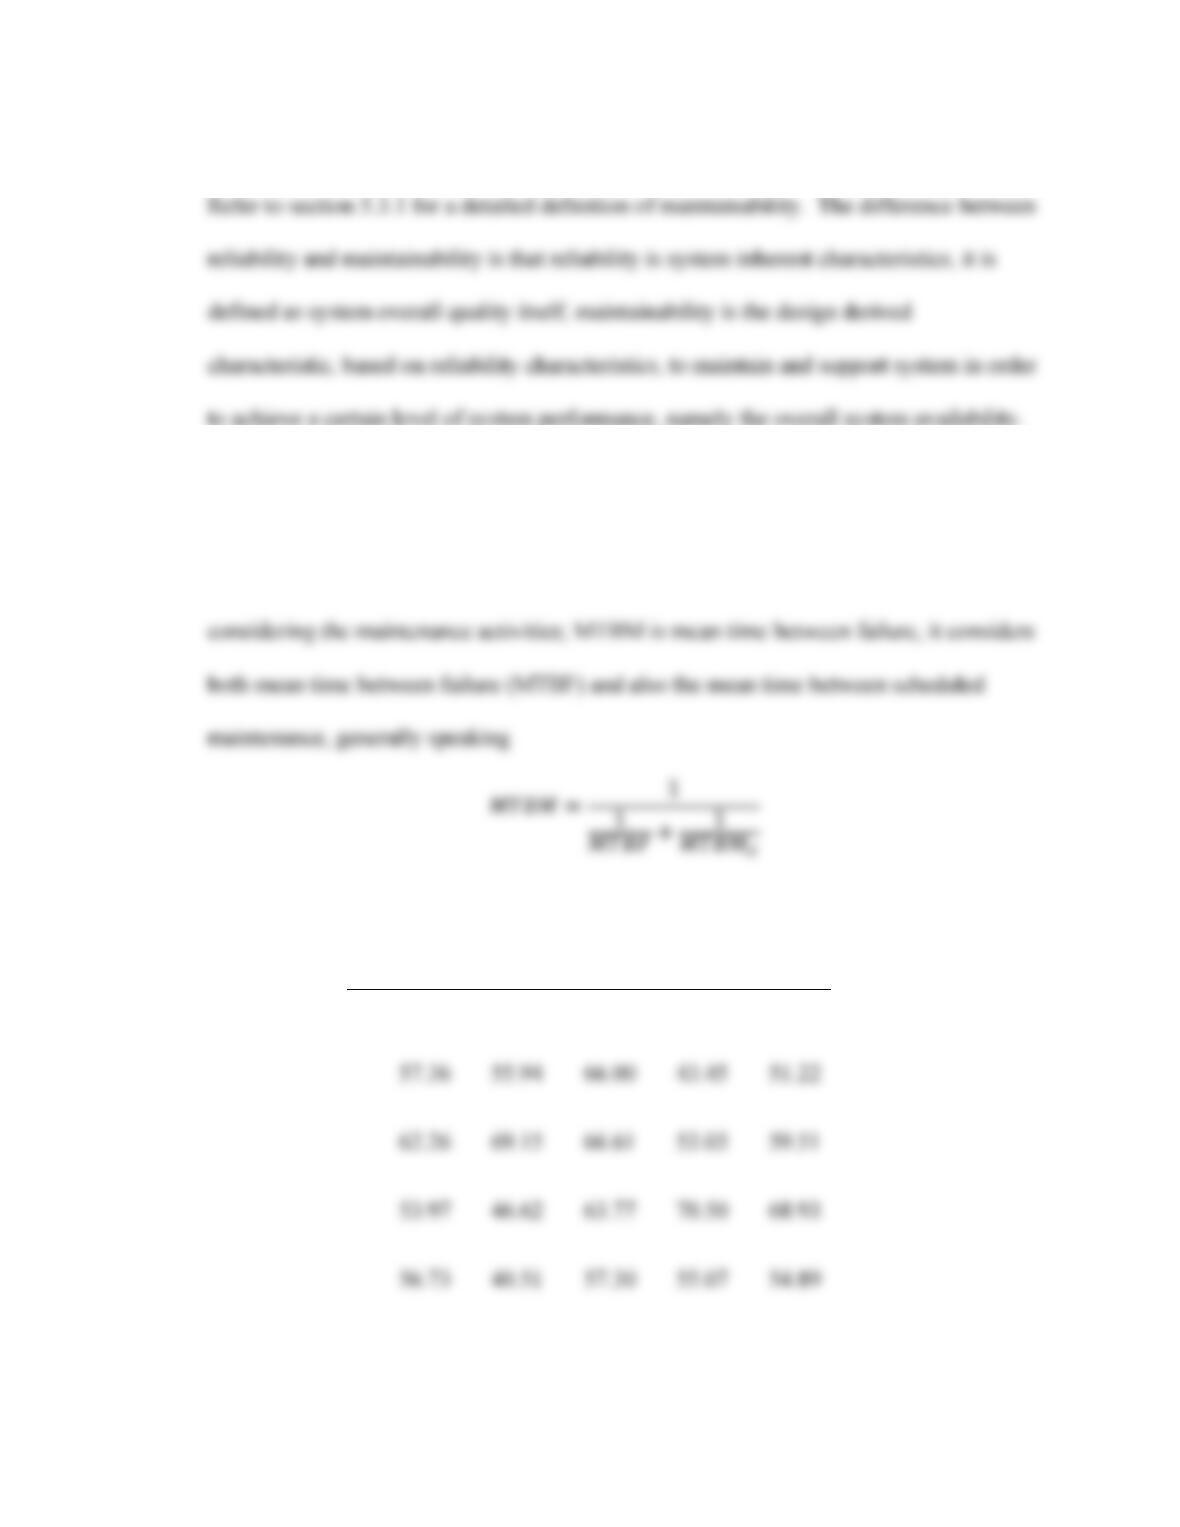
17. What the difference between MTBF and MTBM?
MTBF is mean time between failure, it is a measure of system reliability without
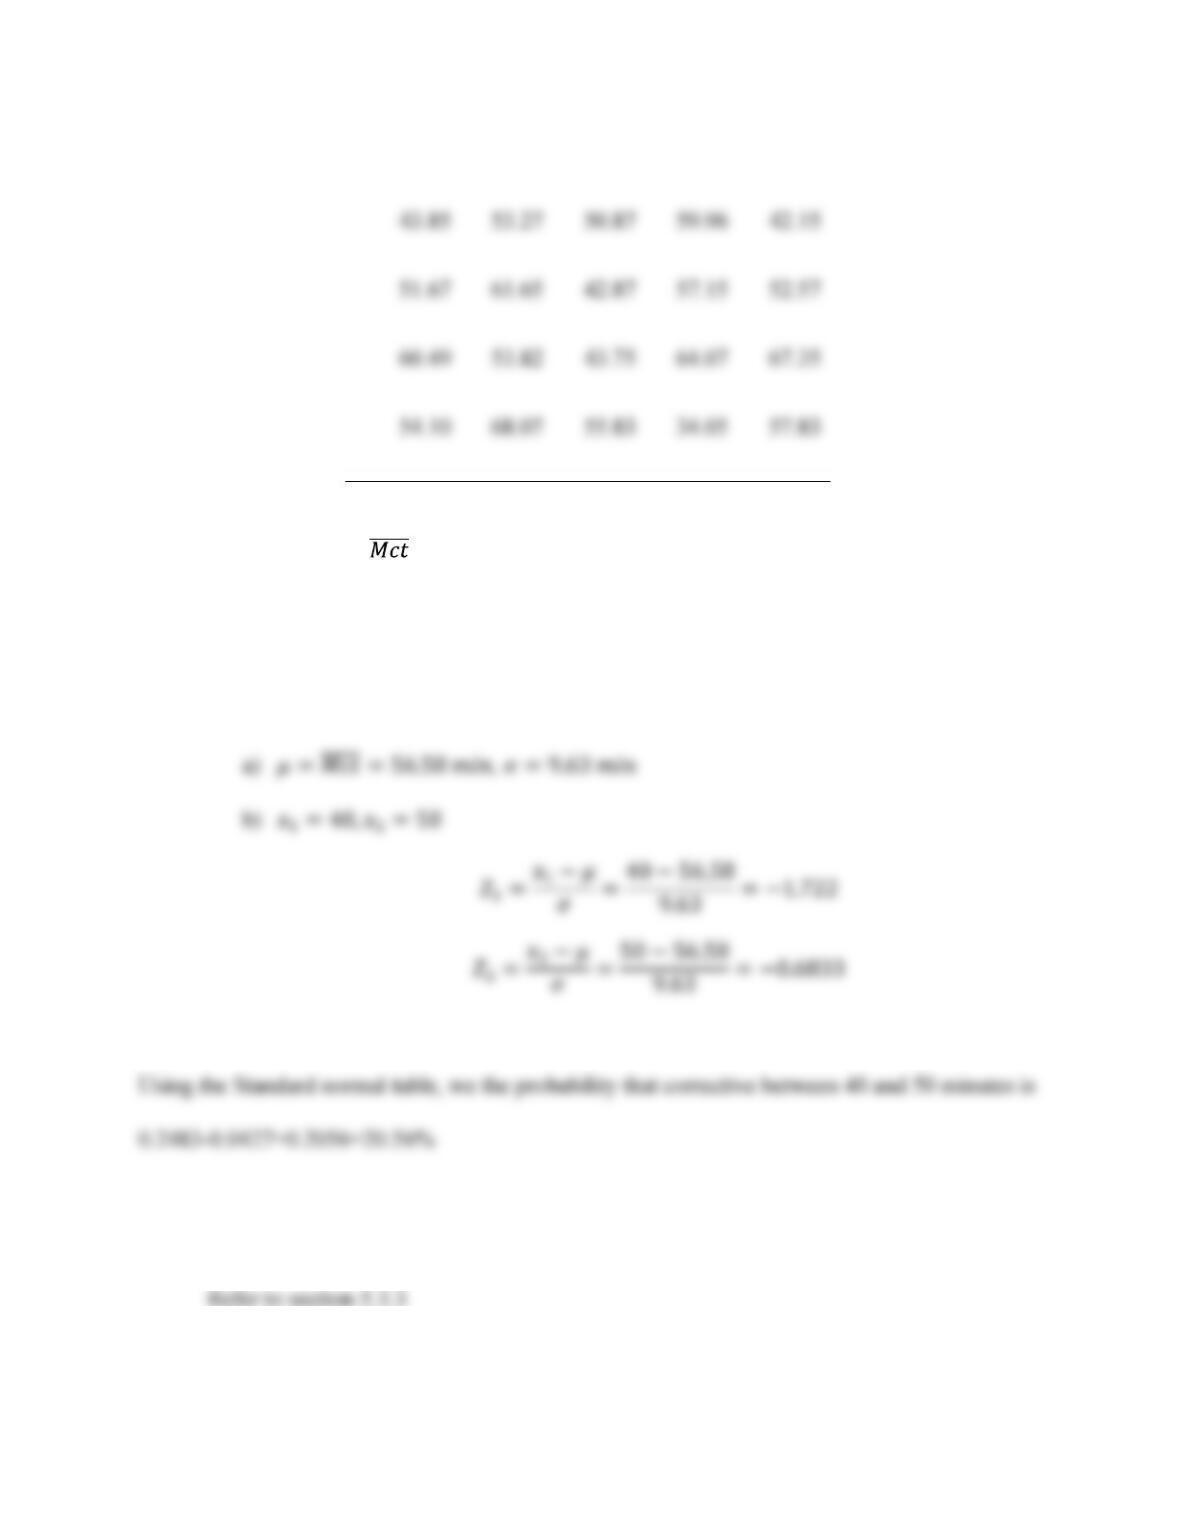
18. The following table illustrates a sample of maintenance task times observations
74.66 75.40 47.18 59.63 59.87
35.85 69.60 52.93 61.05 64.62
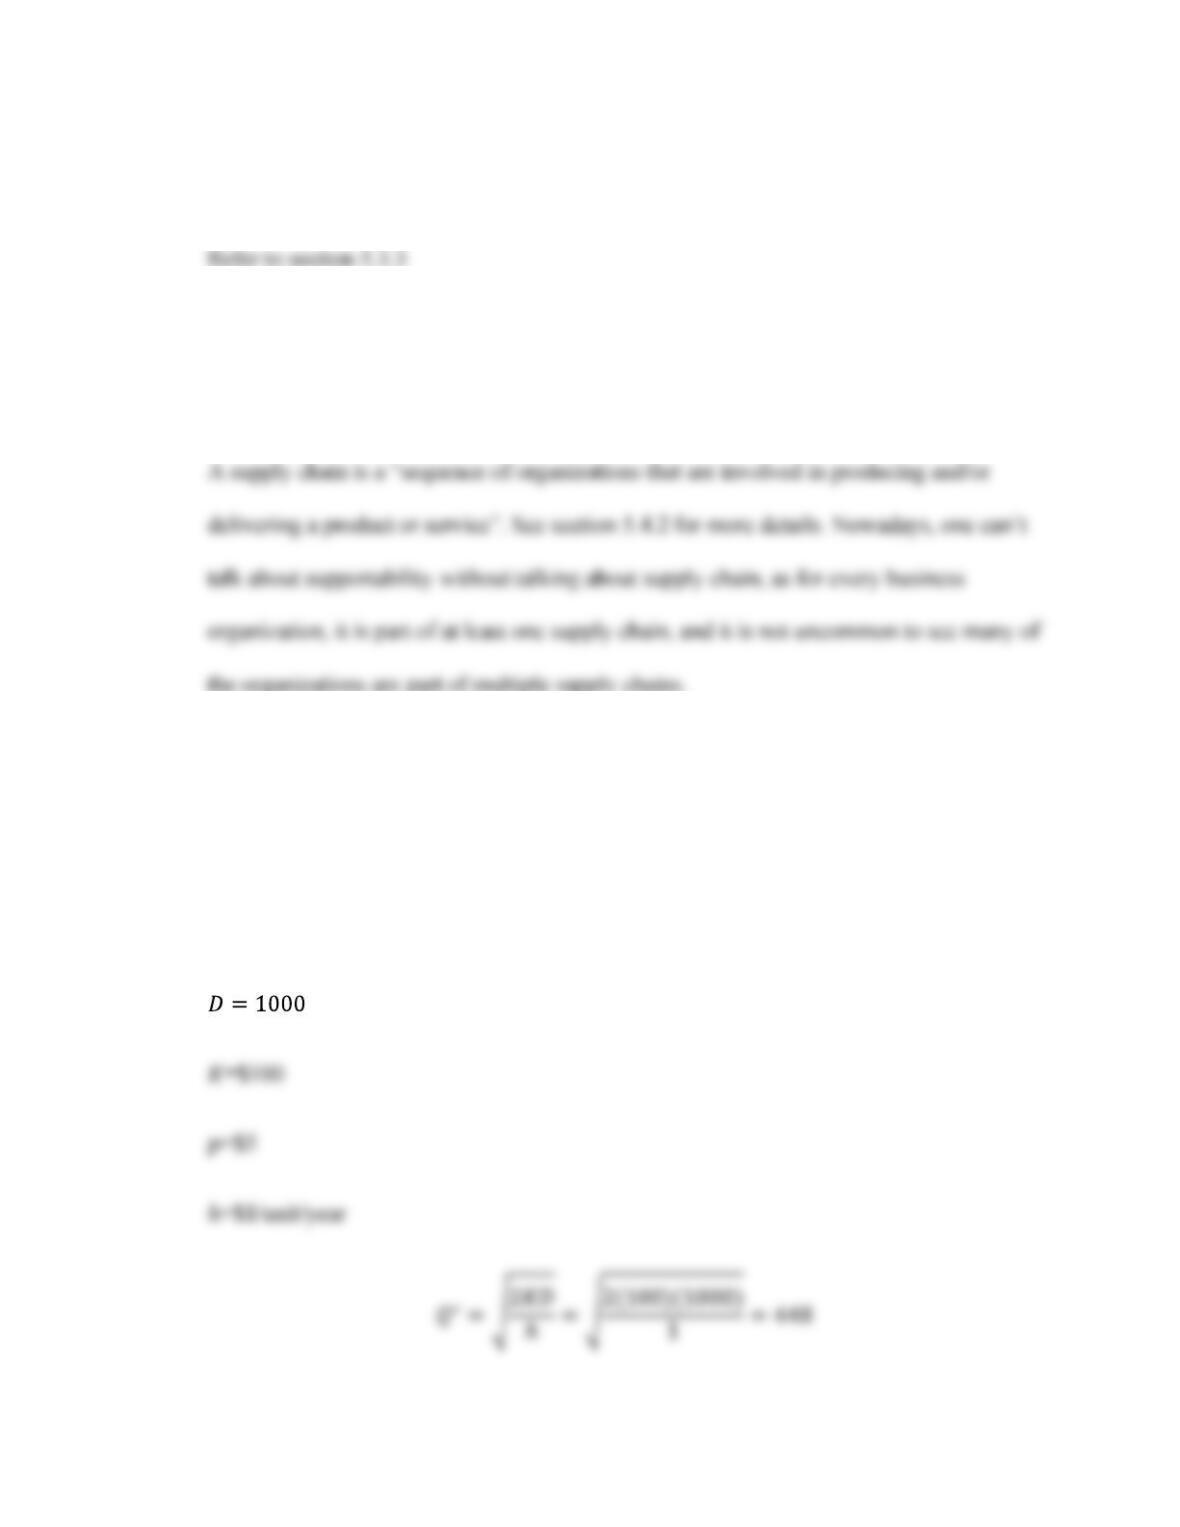
a) Calculate the and standard deviation for this sample
b) Find out the percentage of corrective time between 40 and 50 minutes by using the
standard normal table in Appendix C.
19. What the main activities involved for the design of maintainability?
20. In order to facilitate a good design for maintainability, what are the general guidelines
and principles for the part and personnel selection?
21. Define supply chain and what the main factors that are involved in supply chain
management? Why supply chain is important for design for supportability?
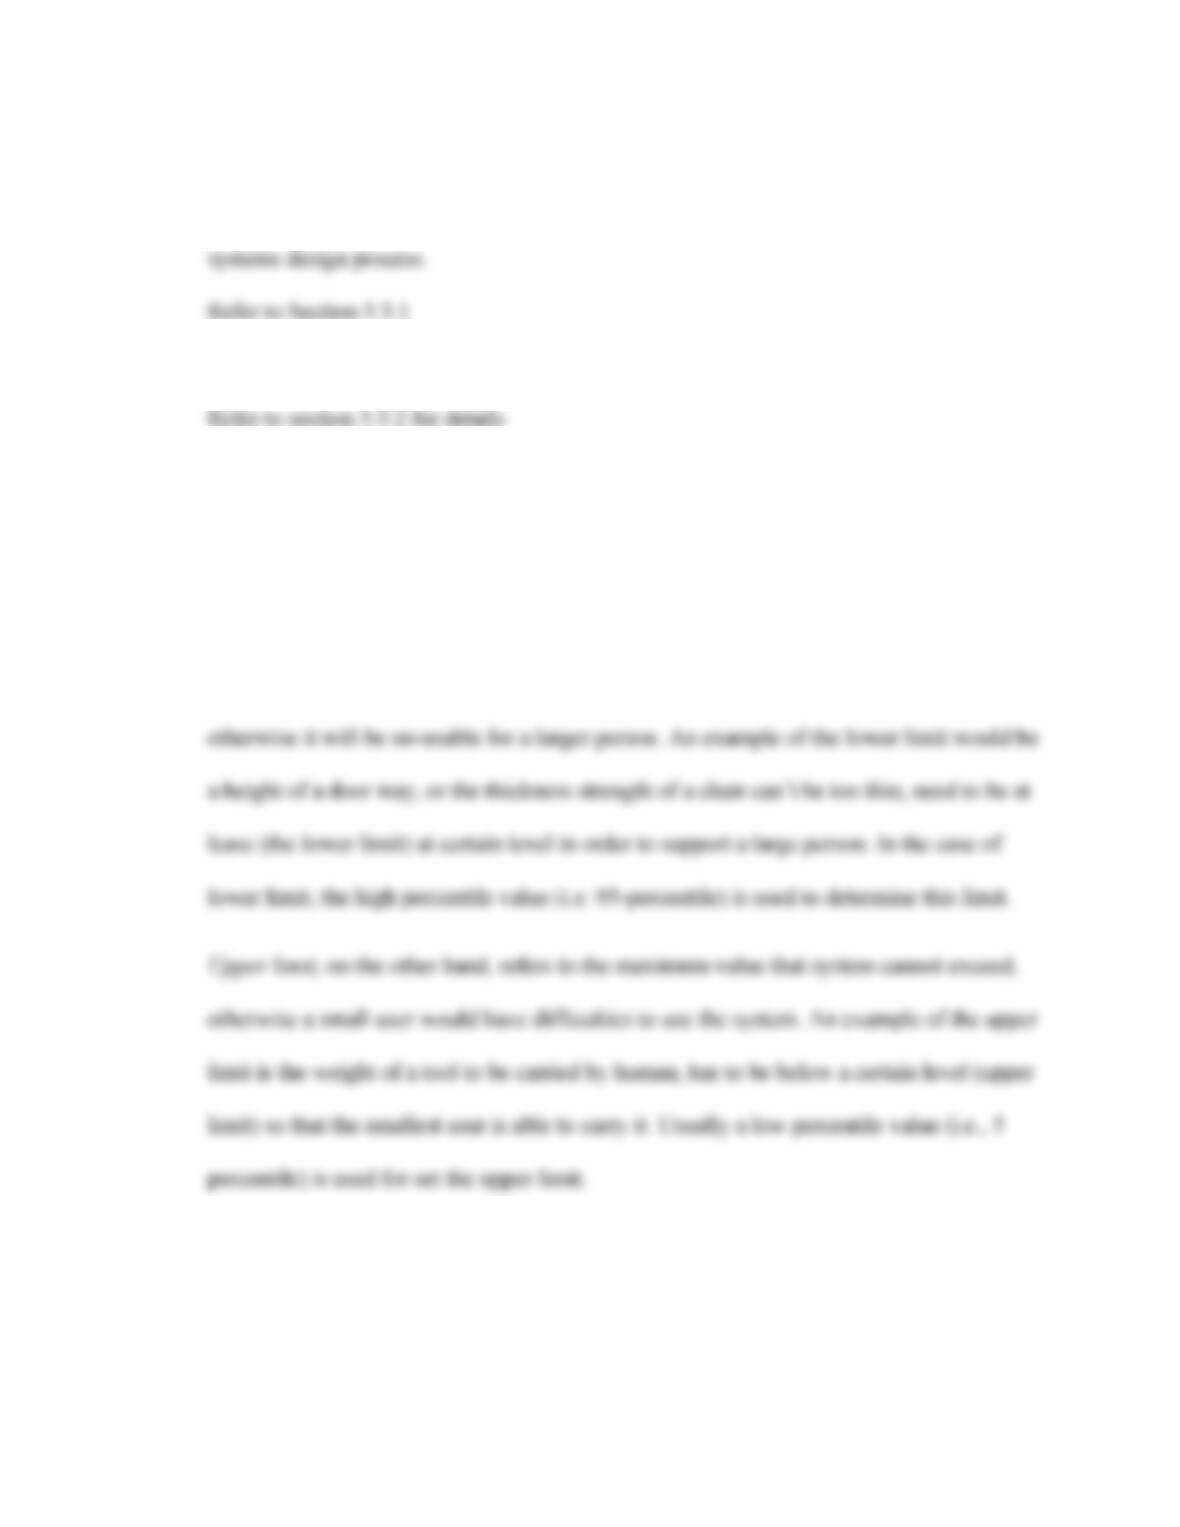
22. Determine the economic order quantity (EOQ) for spare parts, when the cost per units is
$5, the cost of setup the order, including all the fixed cost is $100, the cost to hold an
item is $1 per unit per year. It is estimated that the annual demand of the part is 1000.
,
23. Define Human Factors and briefly explain the role of Human Factors Engineering in the
24. What are the major factors for work system design?
25. Explain how anthropometry data is utilized in the design, what are the lower limit and
upper limit for anthropometry data? Give an example for each of the limit.
Refer to section 5.5.3. as stated in the text, Lower limit refers to the physical size of the
system, hot the human user per se. lower limit implies that the system cannot be smaller,
26. A certain design dimension has a mean value of 20 inches and standard deviation of 5
inches; find the 75 percentile value for this dimension using the standard Normal table in
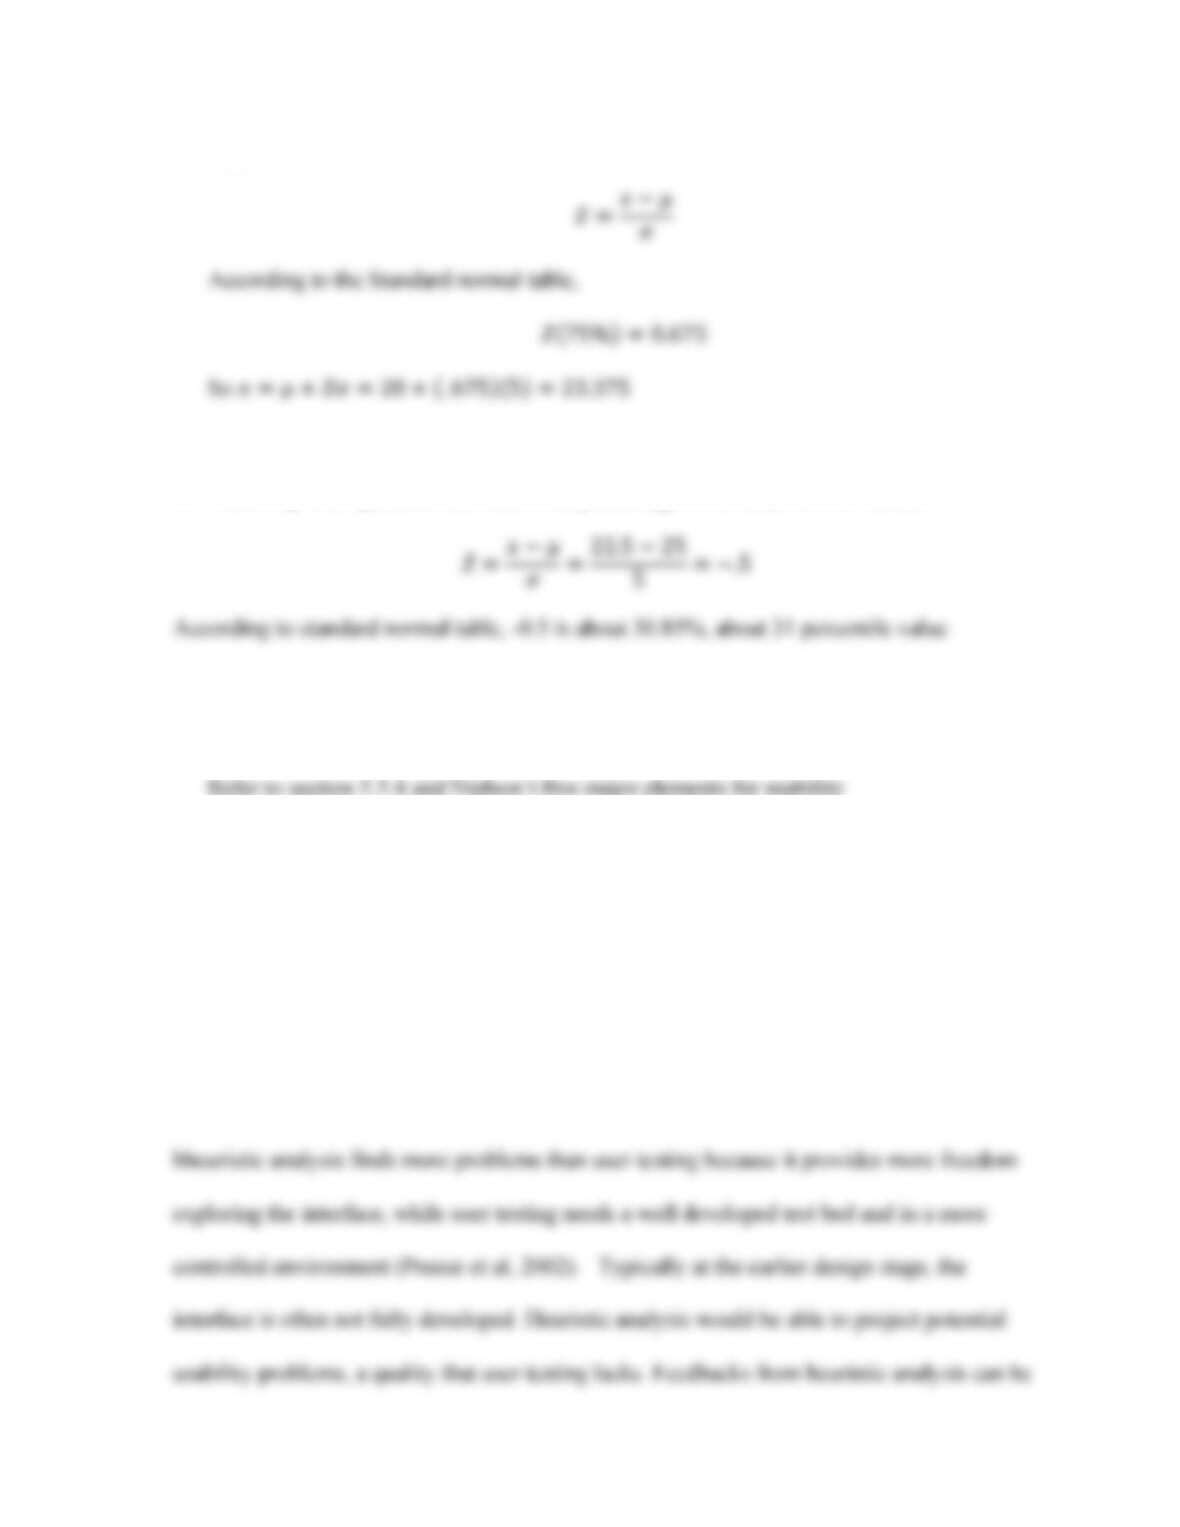
Appendix II.
27. Follow up with question 29, what is the percentage for a value of 22.5 inches?
28. What is usability engineering? And list the major elements for system usability.
29. Compare usability testing and heuristic evaluation, under what circumstances shall we
use what method to evaluate the usability of the system?
Refer to section 5.5.4 last paragraph. It is believed that the difference in nature of these two
techniques would make them appropriate for different testing purposes. Most of times,