CHAPTER 4
1. Define model. What are characteristics for a model?
A model is a representation of the real world system; it is a duplication of the real system in a
2. What are benefits of models? What are the possible limitations of a model?
As seen in the text: Using models in systems engineering can bring us many benefits. First,
models allow us to study the system concepts without directly interacting with systems
3. List all the models categories based on format, variables, scope and functions, give one
example of each.
These answers can be easily found from the text, section 4.2.1.
Based on format:
4. If you are a systems engineer, explain why do you want to use models in your design and
what are uniqueness of systems engineering models compared to other disciplines, say, a
psychological model?
Models provide researchers many benefits (see answers above). Complexity is one of
major challenges in the systems design, and the reason we use model is to simplify the
5. Define functions and describe the characteristics for systems functions.
See section 4.3.1.1 a system function is a meaningful action or activity that system will
perform to achieve certain objectives, obtain desired outputs in order to support the
6. Develop the functional models (functions and their architectures for the following
elevator system scenarios)
7. Download CORE from vitechcorp.com, and use CORE to develop a FFBD for 6.
8. From 7, pick one function, conduct the resources management analysis for this function,
9. Based on your experiences and observations with elevators, develop a Hierarchical Task
10. What are the differences between task analysis and cognitive task analysis (CTA)?
As seen from the text, Cognitive task analysis is an extension of the traditional HTA,
11. Describe how traceability is ensured between system design baselines (i.e., Type A, to B
to C, D, and E)?
System engineering design is requirement driven, systems requirements determine the
rationale for the design and in turn defines the design parameters for the system. System
12. A manufacturing company is producing one part for a major automobile customer in five
locations throughout a county. Raw materials will be distributed to these five locations
from a centralized warehouse within the county. The weekly quantities to be delivered to
these five locations are assumed to be same. The following table shows the coordinates
for the five locations. Using center of gravity method to determine the coordinates for the
location of the warehouse. Draw the five locations and warehouse on a graph paper.
Location x y
L1 2 3
13. A grocery supplier is trying to determine the location for its new distribution center
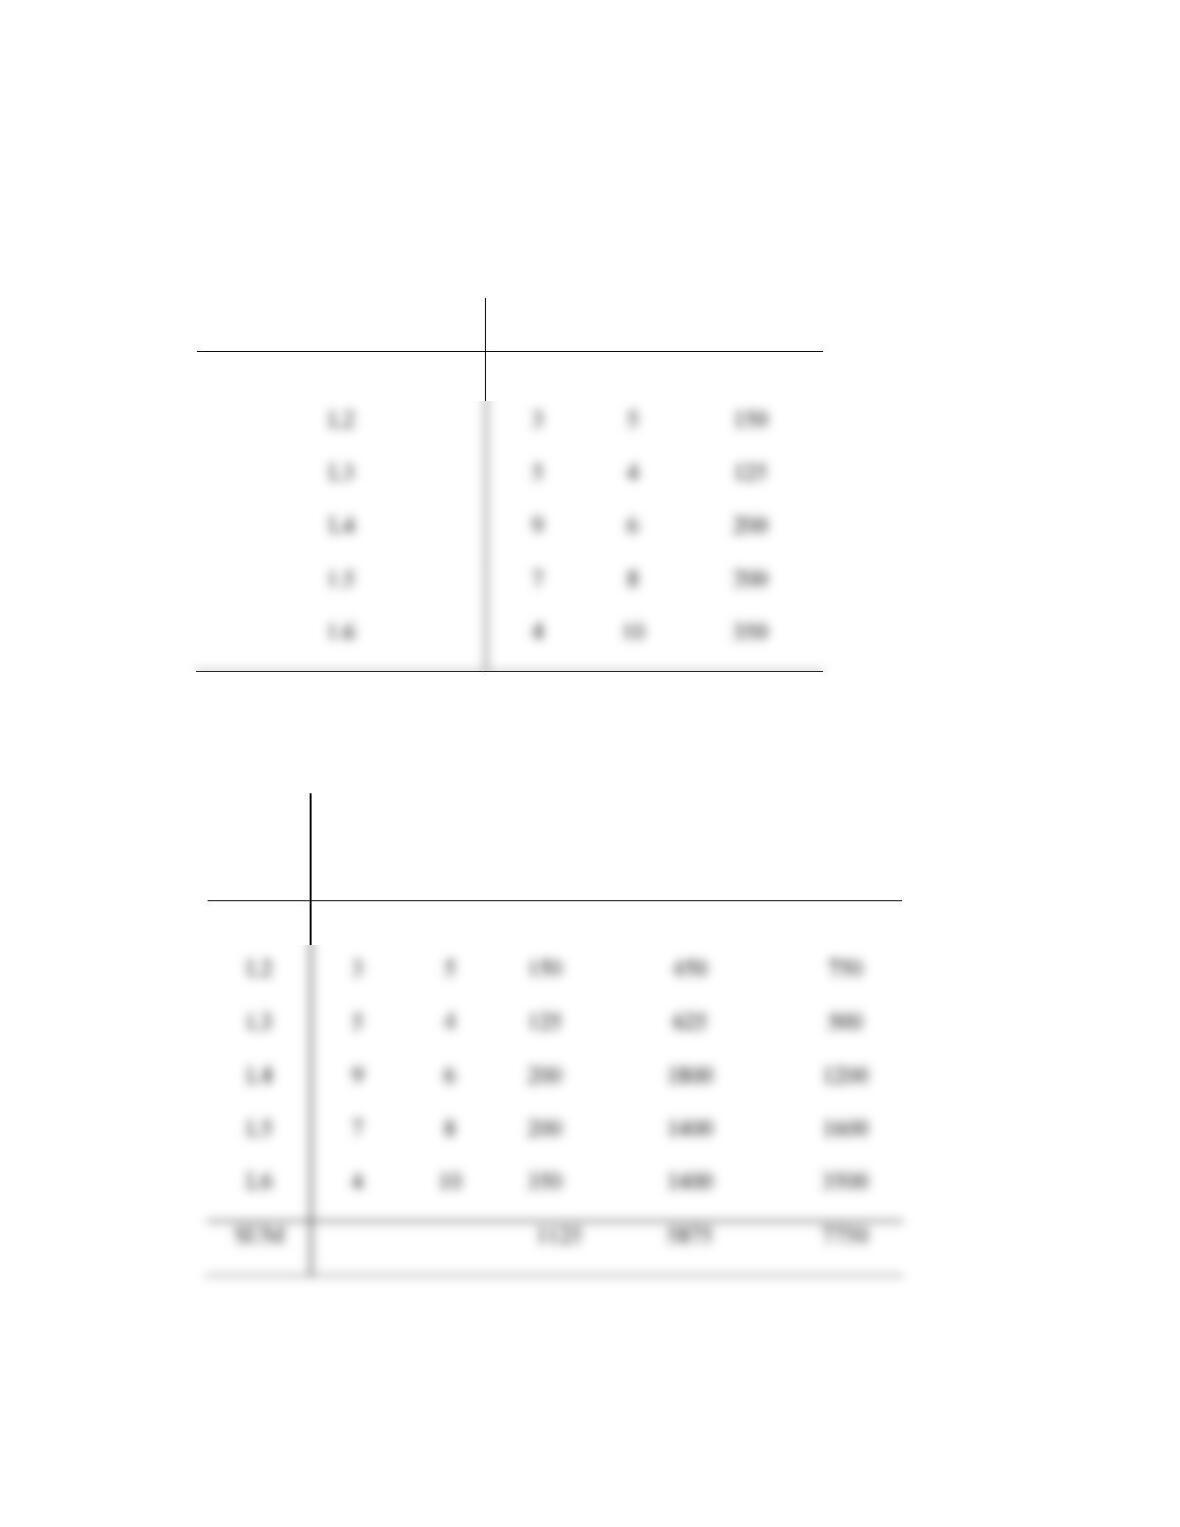
within the area. The coordinates and daily shipping amount (in lbs) from the center to the
six stores is listed in the following table. Determine the coordinates for this new center
using weighted average center of gravity method
Location x y Amount (lbs)
L1 2 2 100
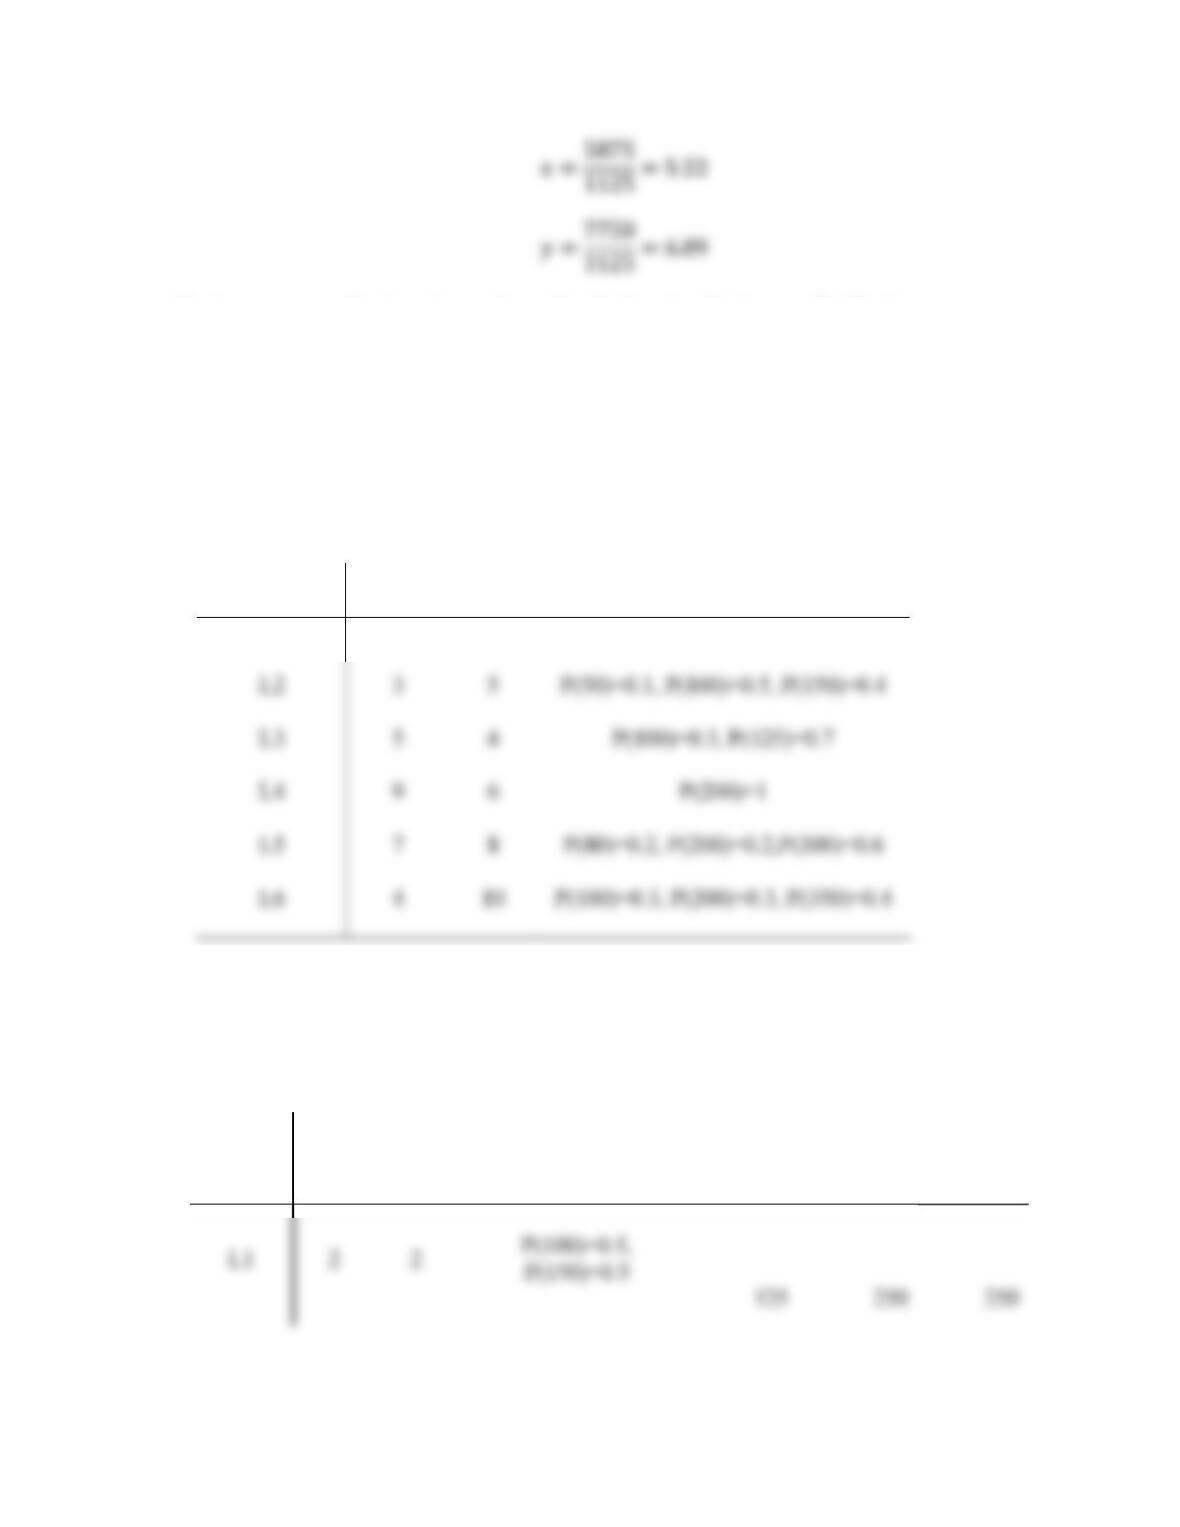
This problem is easier to use spreadsheet to solve
Location x y
Amount
(lbs)
Weighthed X
Weighted
Y
L1 2 2 100 200 200
Coordinate
14. A grocery supplier is trying to determine the location for its new distribution center
within the area. Shipping to the nearby five stores are be a random variable. The
coordinates and daily shipping amount (in lbs) and probability distribution from the
center to the six stores is listed in the following table. Determine the coordinates for this
new center using weighted average center of gravity method.
Location x y Amount (lbs) and Probabilities
L1 2 2 P(100)=0.5, P(150)=0.5
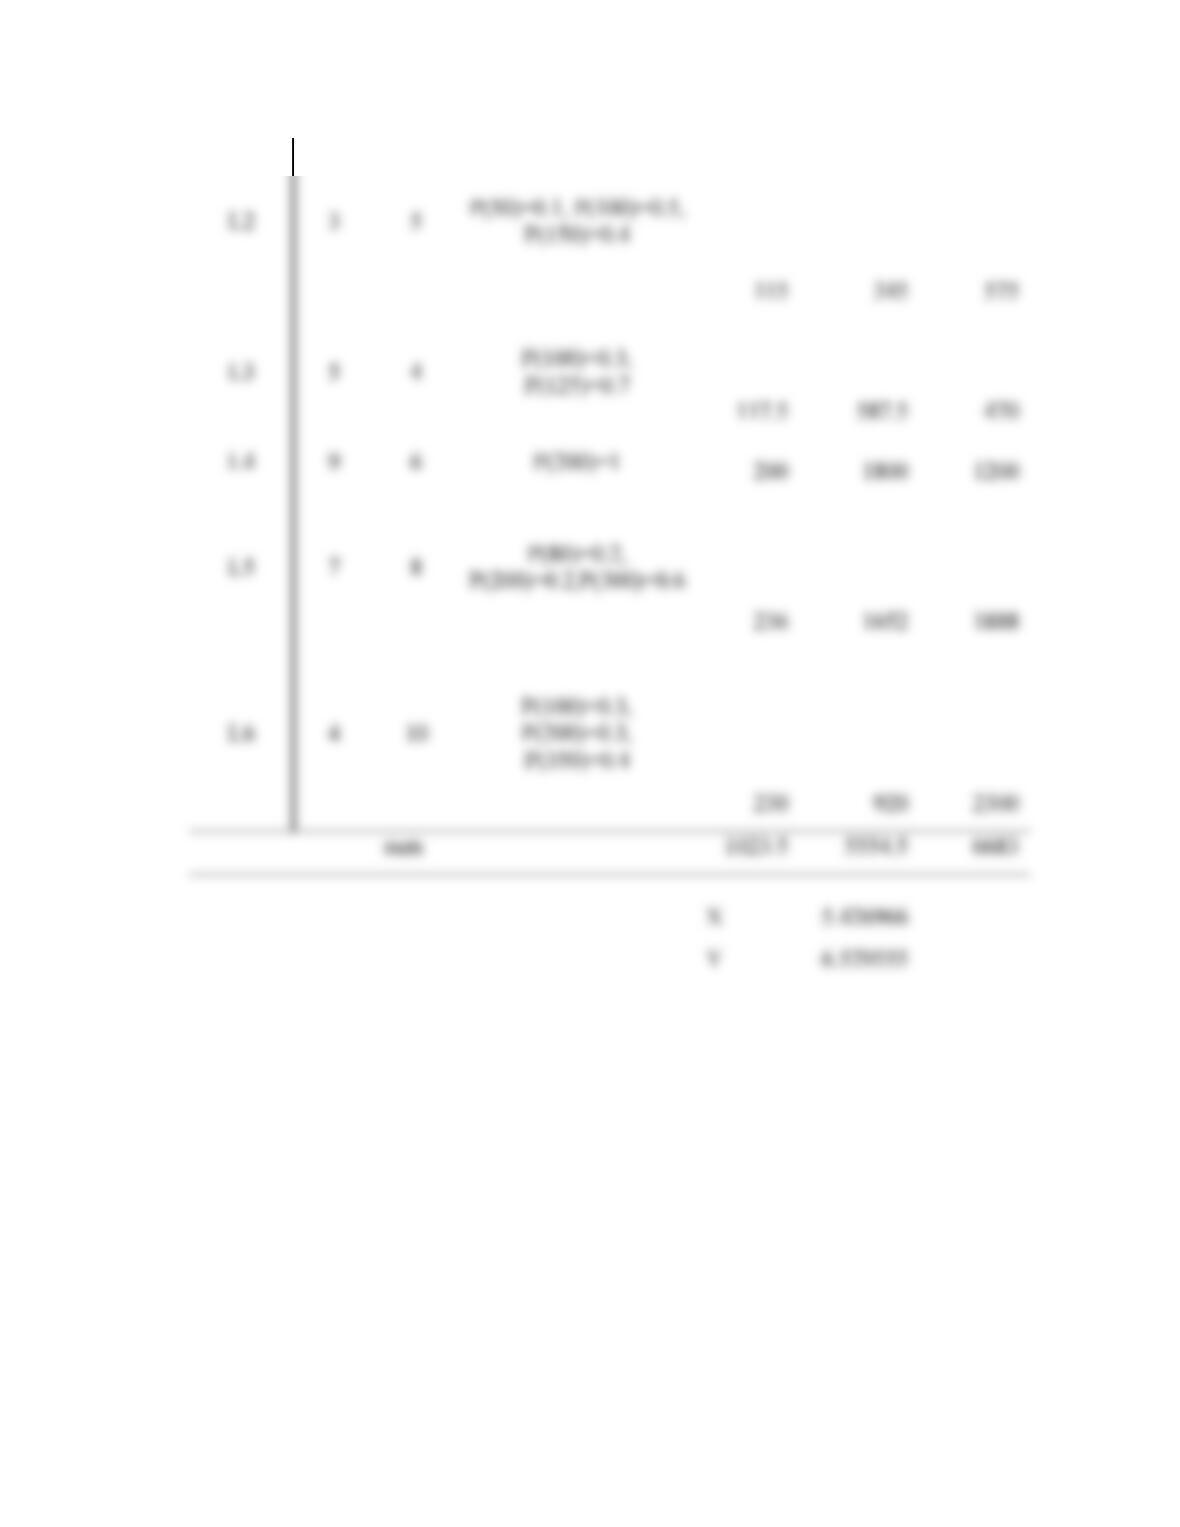
First calculated the expected the pounds for each location, and use the similar approach
as in 14 to solve for the coordinate.
Location x y Amount (lbs) and
Probabilities
expected
value
X
weighted
Y
Weighted
15. Shown below is a relationship matrix for five departments, conduct a graph based link
analysis to maximize the total adjacent importance score.
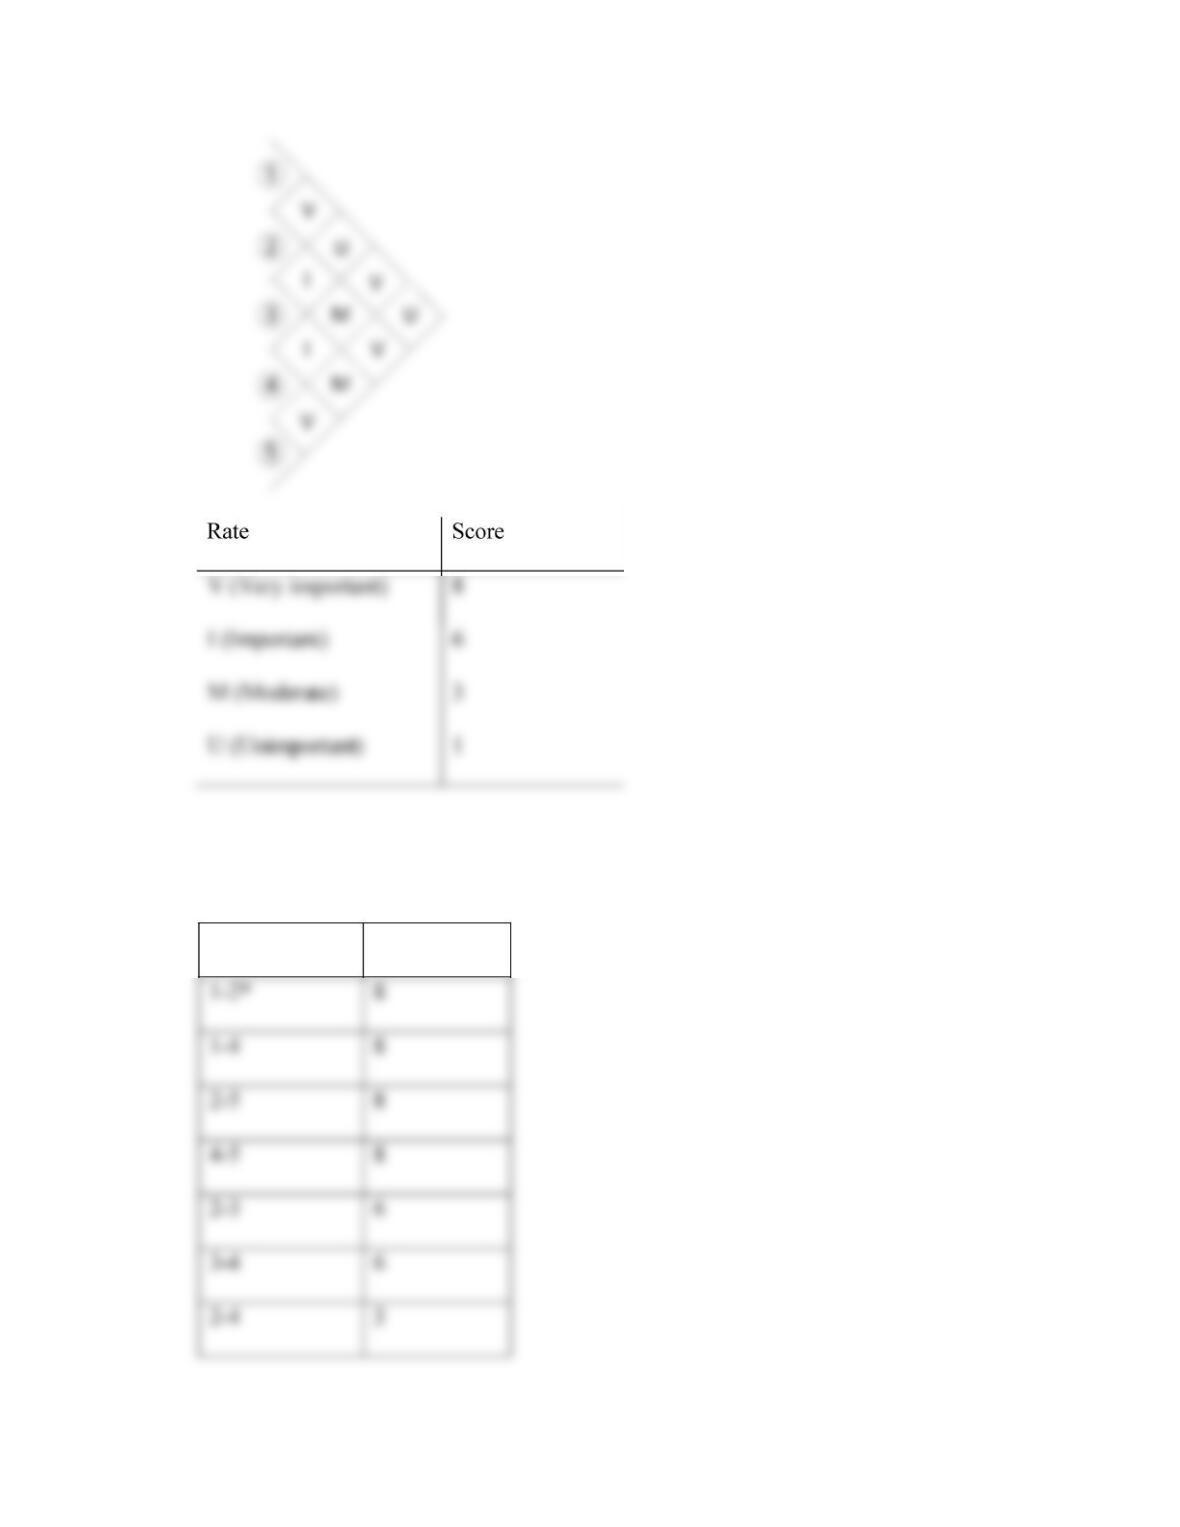
Rate Score
Solution: step 1: list all the links on a descending order
Link Score
3-5 3
Step 2: Choose 1-2 to enter the graph
The remaining station
1 2 sum
3 1 6 7
Step 3
1 2 4 sum
Step 4
Faces Sum of the link length total
1-2-5 1+6+3 10
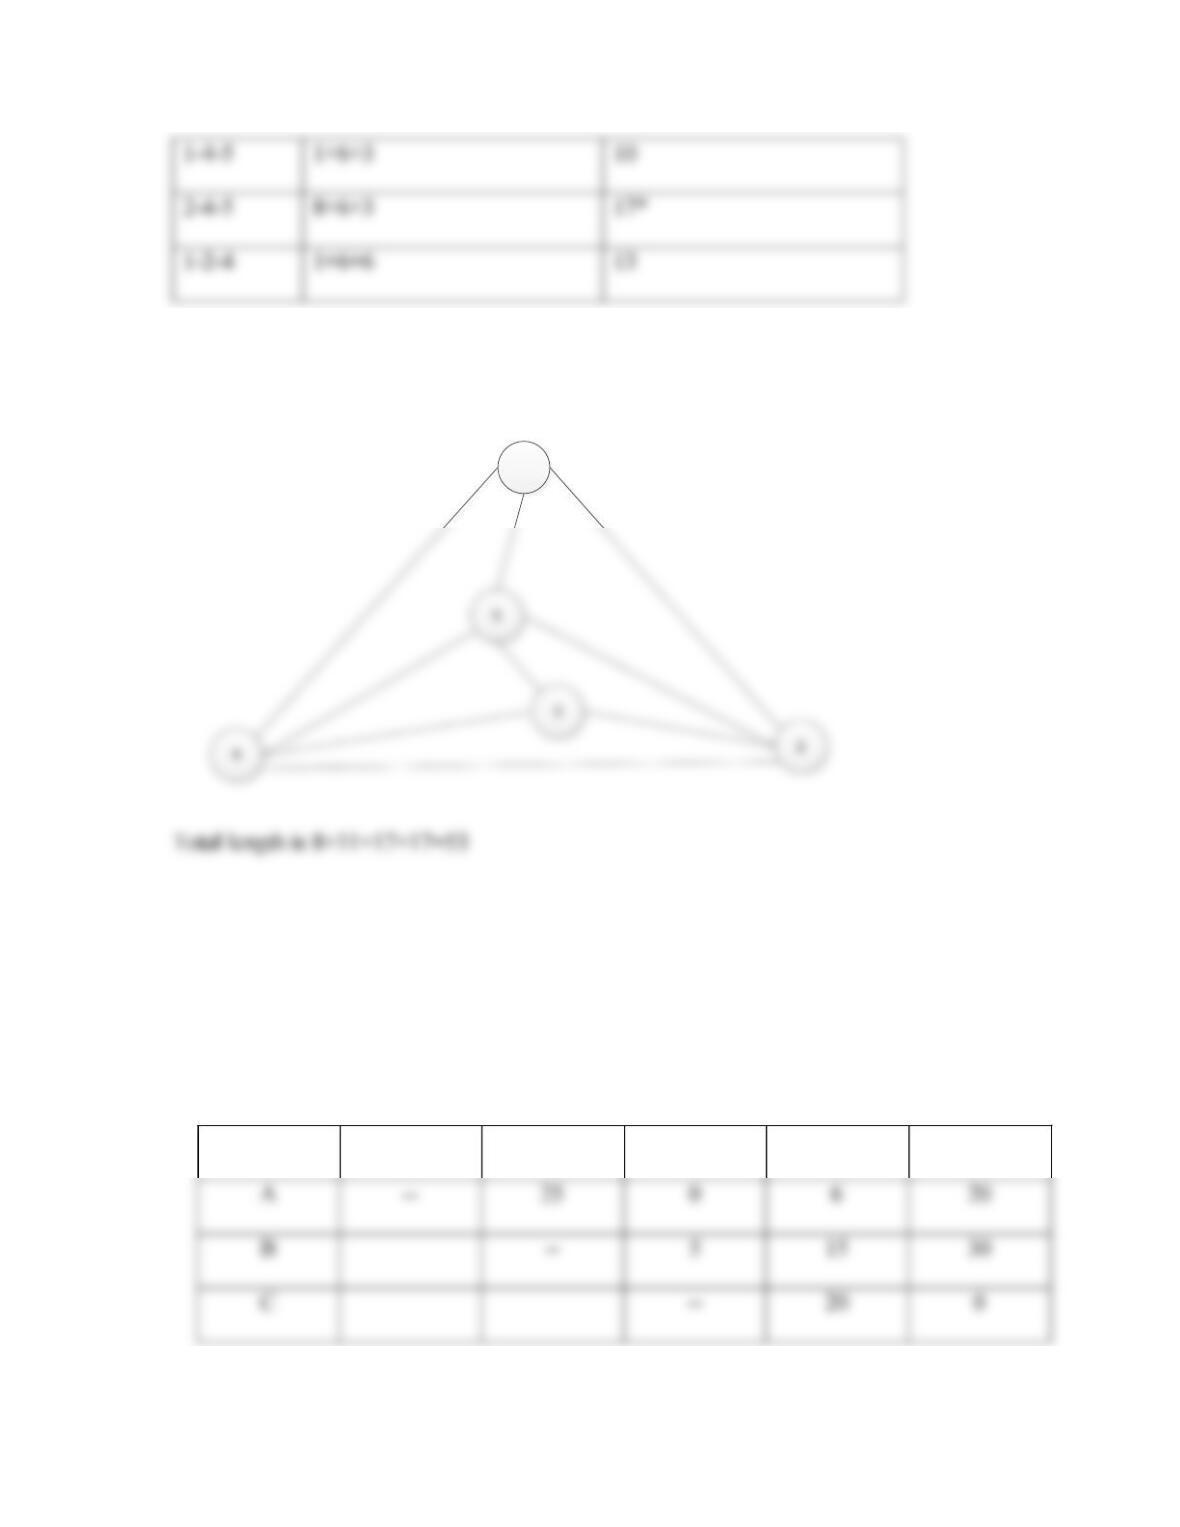
The final chart is
1
16. Consider the layout for a five department design (size are ignored). The material flow is
given in the following table.
A B C D E
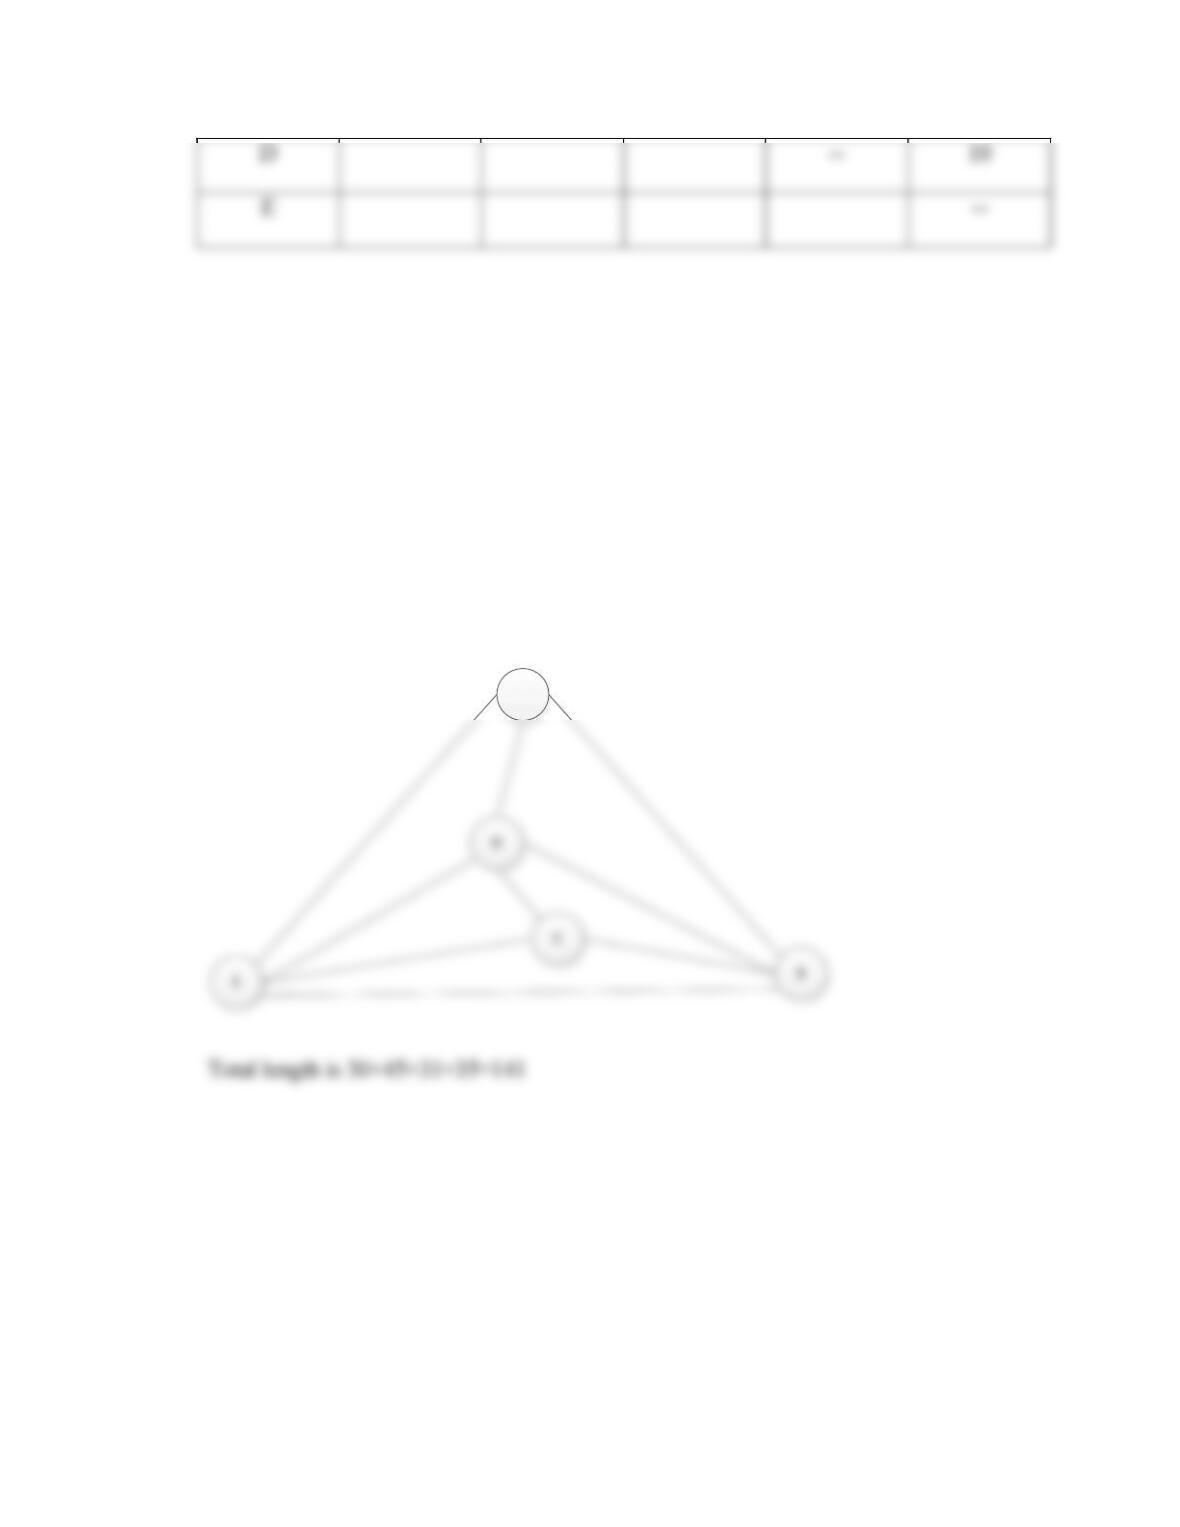
a) Develop the final adjacent graph using the graph based link analysis
procedure to maximize the total adjacent flow; what is the final total flow
amount?
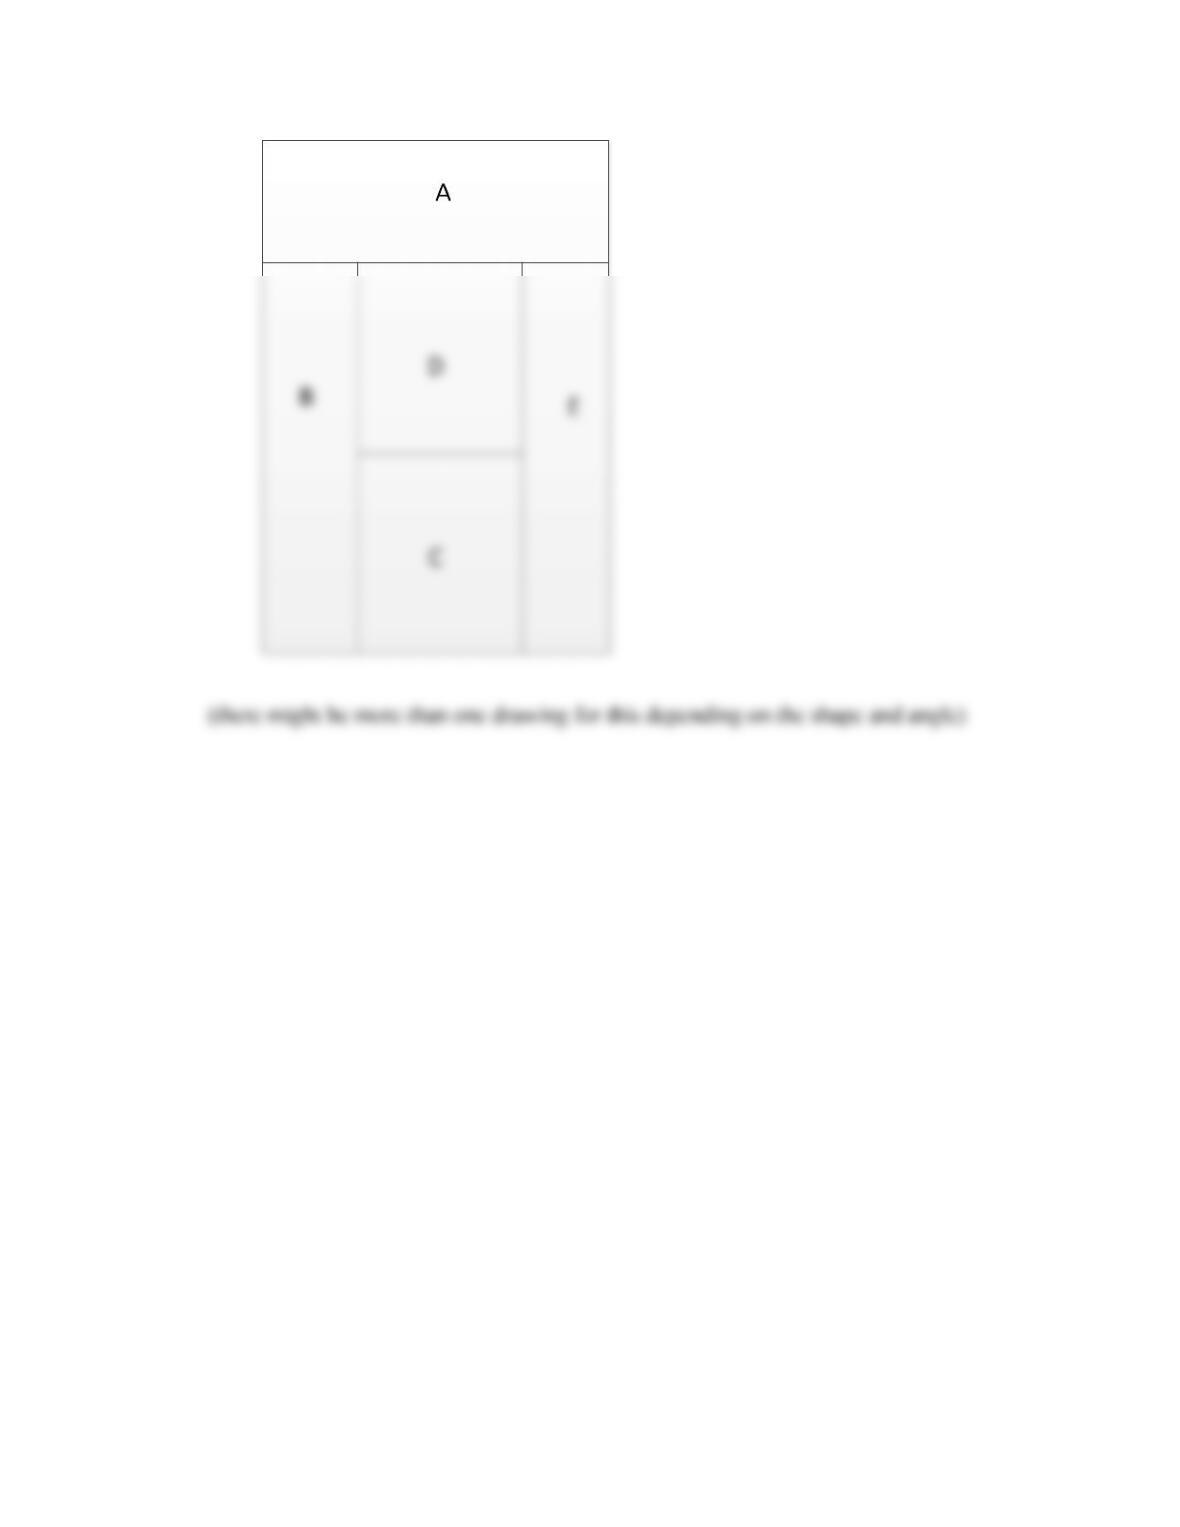
b) Fit the layout of the five departments from a) in a rectangle shaped block.
A
b)