Chapter 2
Fundamentals of the Mechanical
Behavior of Materials
Questions
2.1 Can you calculate the percent elongation of ma-
terials based only on the information given in
Fig. 2.6? Explain.
on p. 37 only the necking strain (true and engi-
elongation of the specimen; also, note that the
2.2 Explain if it is possible for the curves in Fig. 2.4
to reach 0% elongation as the gage length is in-
creased further.
will decrease, but the total elongation will not
approach zero.
2.3 Explain why the difference between engineering
increases. Is this phenomenon true for both ten-
sile and compressive strains? Explain.
p. 35. This is true for both tensile and com-
2.4 Using the same scale for stress, we note that the
During a compression test, the cross-sectional
area of the specimen increases as the specimen
requires a higher capacity testing machine than
the other? Explain.
The compression test requires a higher capacity
© 2008 Pearson Education, Inc., Upper Saddle River, NJ. All rights reserved.
This material is protected by Copyright and written permission should be obtained from the publisher prior to any prohibited
reproduction, storage in a retrieval system, or transmission in any form or by any means, electronic, mechanical, photocopying, recording, or
likewise. For information regarding permission(s), write to:
Rights and Permissions Department, Pearson Education, Inc., Upper Saddle River, NJ 07458.
2.6 Explain how the modulus of resilience of a ma-
2.7 If you pull and break a tension-test specimen
rapidly, where would the temperature be the
highest? Explain why.
the energy dissipated per unit volume in plastic
deformation, is highest.
2.8 Comment on the temperature distribution if the
specimen in Question 2.7 is pulled very slowly.
2.9 In a tension test, the area under the true-stress-
the area under the load-elongation curve rep-
resents the work done on the specimen. If you
the same as the area under the true-stress-true-
strain curve? Explain. Will your answer be the
same for any value of strain? Explain.
2.10 The note at the bottom of Table 2.5 states that
as temperature increases, Cdecreases and m
strength of the material. The value of min-
creases with temperature because the material
becomes more strain-rate sensitive, due to the
2.11 You are given the Kand nvalues of two dif-
ferent materials. Is this information sufficient
to determine which material is tougher? If not,
what additional information do you need, and
why?
thus usually negligible with respect to the rest
2.12 Modify the curves in Fig. 2.7 to indicate the
effects of temperature. Explain the reasons for
Fig. 2.10 on p. 42.
2.13 Using a specific example, show why the defor-
mation rate, say in m/s, and the true strain rate
© 2008 Pearson Education, Inc., Upper Saddle River, NJ. All rights reserved.
This material is protected by Copyright and written permission should be obtained from the publisher prior to any prohibited
reproduction, storage in a retrieval system, or transmission in any form or by any means, electronic, mechanical, photocopying, recording, or
likewise. For information regarding permission(s), write to:
Rights and Permissions Department, Pearson Education, Inc., Upper Saddle River, NJ 07458.
2.14 It has been stated that the higher the value of
m, the more diffuse the neck is, and likewise,
strain hardening. However, the strain rate in
the necking region is also higher than in the rest
on p. 45). As expected, the elongation after
necking (postuniform elongation) also increases
2.15 Explain why materials with high mvalues (such
as hot glass and silly putty) when stretched
2.16 Assume that you are running four-point bend-
ing tests on a number of identical specimens of
the same length and cross-section, but with in-
creasing distance between the upper points of
loading (see Fig. 2.21b). What changes, if any,
would you expect in the test results? Explain.
distance increases.
2.17 Would Eq. (2.10) hold true in the elastic range?
2.18 Why have different types of hardness tests been
developed? How would you measure the hard-
ness of a very large object?
2.19 Which hardness tests and scales would you use
for very thin strips of material, such as alu-
minum foil? Why?
microhardness test such as Knoop or Vickers
and scale for a particular application.
Hardness tests mainly have three differences:
(a) type of indenter,
© 2008 Pearson Education, Inc., Upper Saddle River, NJ. All rights reserved.
This material is protected by Copyright and written permission should be obtained from the publisher prior to any prohibited
reproduction, storage in a retrieval system, or transmission in any form or by any means, electronic, mechanical, photocopying, recording, or
likewise. For information regarding permission(s), write to:
Rights and Permissions Department, Pearson Education, Inc., Upper Saddle River, NJ 07458.
2.21 In a Brinell hardness test, the resulting impres-
explanations for this phenomenon.
2.21 Referring to Fig. 2.22 on p. 52, note that the
material for indenters are either steel, tungsten
carbide, or diamond. Why isn’t diamond used
for all of the tests?
it would not, for example, be practical to make
and use a 10-mm diamond indenter because the
2.22 What effect, if any, does friction have in a hard-
ness test? Explain.
as thermoplastic components.
2.24 Referring to the two impact tests shown in
Fig. 2.31, explain how different the results
as stress raisers. Thus, cracks would not propa-
gate as they would when under tensile stresses.
Consequently, the specimens would basically
2.25 If you remove layer ad from the part shown in
Fig. 2.30d, such as by machining or grinding,
compression, tension, compression, and tension
springs.)
© 2008 Pearson Education, Inc., Upper Saddle River, NJ. All rights reserved.
This material is protected by Copyright and written permission should be obtained from the publisher prior to any prohibited
reproduction, storage in a retrieval system, or transmission in any form or by any means, electronic, mechanical, photocopying, recording, or
likewise. For information regarding permission(s), write to:
Rights and Permissions Department, Pearson Education, Inc., Upper Saddle River, NJ 07458.
2.26 Is it possible to completely remove residual
stresses in a piece of material by the technique
described in Fig. 2.32 if the material is elastic,
linearly strain hardening? Explain.
2.27 Referring to Fig. 2.32, would it be possible to
eliminate residual stresses by compression in-
stead of tension? Assume that the piece of ma-
2.28 List and explain the desirable mechanical prop-
erties for the following: (1) elevator cable, (2)
bandage, (3) shoe sole, (4) fish hook, (5) au-
dergo yielding as the load is increased.
These requirements thus call for a mate-
and outer surface resistant to environmen-
tal effects.
for comfort, with a high resilience. It
should be tough so that it absorbs shock
and should have high friction and wear re-
sistance.
(e) Automotive piston: This product must
have high strength at elevated tempera-
tures, high physical and thermal shock re-
erates at high temperatures (depending on
its location in the turbine); thus it should
should have high ductility to allow it to be
deformed without fracture, and also have
the split parts are free from any stresses. (Hint:
Force these parts back to the shape they were
in before they were cut.)
cross section, have a residual stress distribu-
tion of tension-compression-tension. Using the
Fig. 2.31b would have a similar residual stress
distribution prior to cutting.
2.30 It is possible to calculate the work of plastic
deformation by measuring the temperature rise
© 2008 Pearson Education, Inc., Upper Saddle River, NJ. All rights reserved.
This material is protected by Copyright and written permission should be obtained from the publisher prior to any prohibited
reproduction, storage in a retrieval system, or transmission in any form or by any means, electronic, mechanical, photocopying, recording, or
likewise. For information regarding permission(s), write to:
Rights and Permissions Department, Pearson Education, Inc., Upper Saddle River, NJ 07458.
ature by one degree. Consequently, the calcu-
specimen changes when the specimen is sub-
terms are positive, the product of these terms is
negative and, hence, there will be a decrease in
volume (This can also be deduced intuitively.)
For case (b), it will be noted that the volume
will increase.
2.32 We know that it is relatively easy to subject
a specimen to hydrostatic compression, such as
by using a chamber filled with a liquid. Devise a
means whereby the specimen (say, in the shape
of a cube or a thin round disk) can be subjected
to hydrostatic tension, or one approaching this
state of stress. (Note that a thin-walled, inter-
nally pressurized spherical shell is not a correct
answer, because it is subjected only to a state
of plane stress.)
Two possible answers are the following:
(a) A solid cube made of a soft metal has all its
six faces brazed to long square bars (of the
same cross section as the specimen); the
bars are made of a stronger metal. The six
arms are then subjected to equal tension
forces, thus subjecting the cube to equal
tensile stresses.
2.33 Referring to Fig. 2.19, make sketches of the
tube is externally pressurized. Assume that the
2.34 A penny-shaped piece of soft metal is brazed
to the ends of two flat, round steel rods of the
same diameter as the piece. The assembly is
then subjected to uniaxial tension. What is the
state of stress to which the soft metal is sub-
jected? Explain.
The penny-shaped soft metal piece will tend
to contract radially due to the Poisson’s ratio;
however, the solid rods to which it attached will
prevent this from happening. Consequently, the
state of stress will tend to approach that of hy-
drostatic tension.
2.35 A circular disk of soft metal is being com-
pressed between two flat, hardened circular
steel punches having the same diameter as the
disk. Assume that the disk material is perfectly
plastic and that there is no friction or any tem-
perature effects. Explain the change, if any, in
the magnitude of the punch force as the disk is
being compressed plastically to, say, a fraction
of its original thickness.
Note that as it is compressed plastically, the
disk will expand radially, because of volume
constancy. An approximately donut-shaped
© 2008 Pearson Education, Inc., Upper Saddle River, NJ. All rights reserved.
This material is protected by Copyright and written permission should be obtained from the publisher prior to any prohibited
reproduction, storage in a retrieval system, or transmission in any form or by any means, electronic, mechanical, photocopying, recording, or
likewise. For information regarding permission(s), write to:
Rights and Permissions Department, Pearson Education, Inc., Upper Saddle River, NJ 07458.
stress state σ1,σ2,σ3, where σ1> σ2> σ3.
Explain what happens if σ1is increased.
2.37 What is the dilatation of a material with a Pois-
son’s ratio of 0.5? Is it possible for a material to
have a Poisson’s ratio of 0.7? Give a rationale
It can be seen from Eq. (2.47) on p. 69 that the
(2.47) would then predict contraction under a
2.38 Can a material have a negative Poisson’s ratio?
Explain.
2.39 As clearly as possible, define plane stress and
plane strain.
Plane stress is the situation where the stresses
in one of the direction on an element are zero;
plane strain is the situation where the strains
in one of the direction are zero.
is less than this threshold, then one must ei-
ther rely on nontraditional hardness tests, or
2.41 List the advantages and limitations of the
stress-strain relationships given in Fig. 2.7.
possible. Two possible answers are: (1) there
and (2) some materials may be better suited for
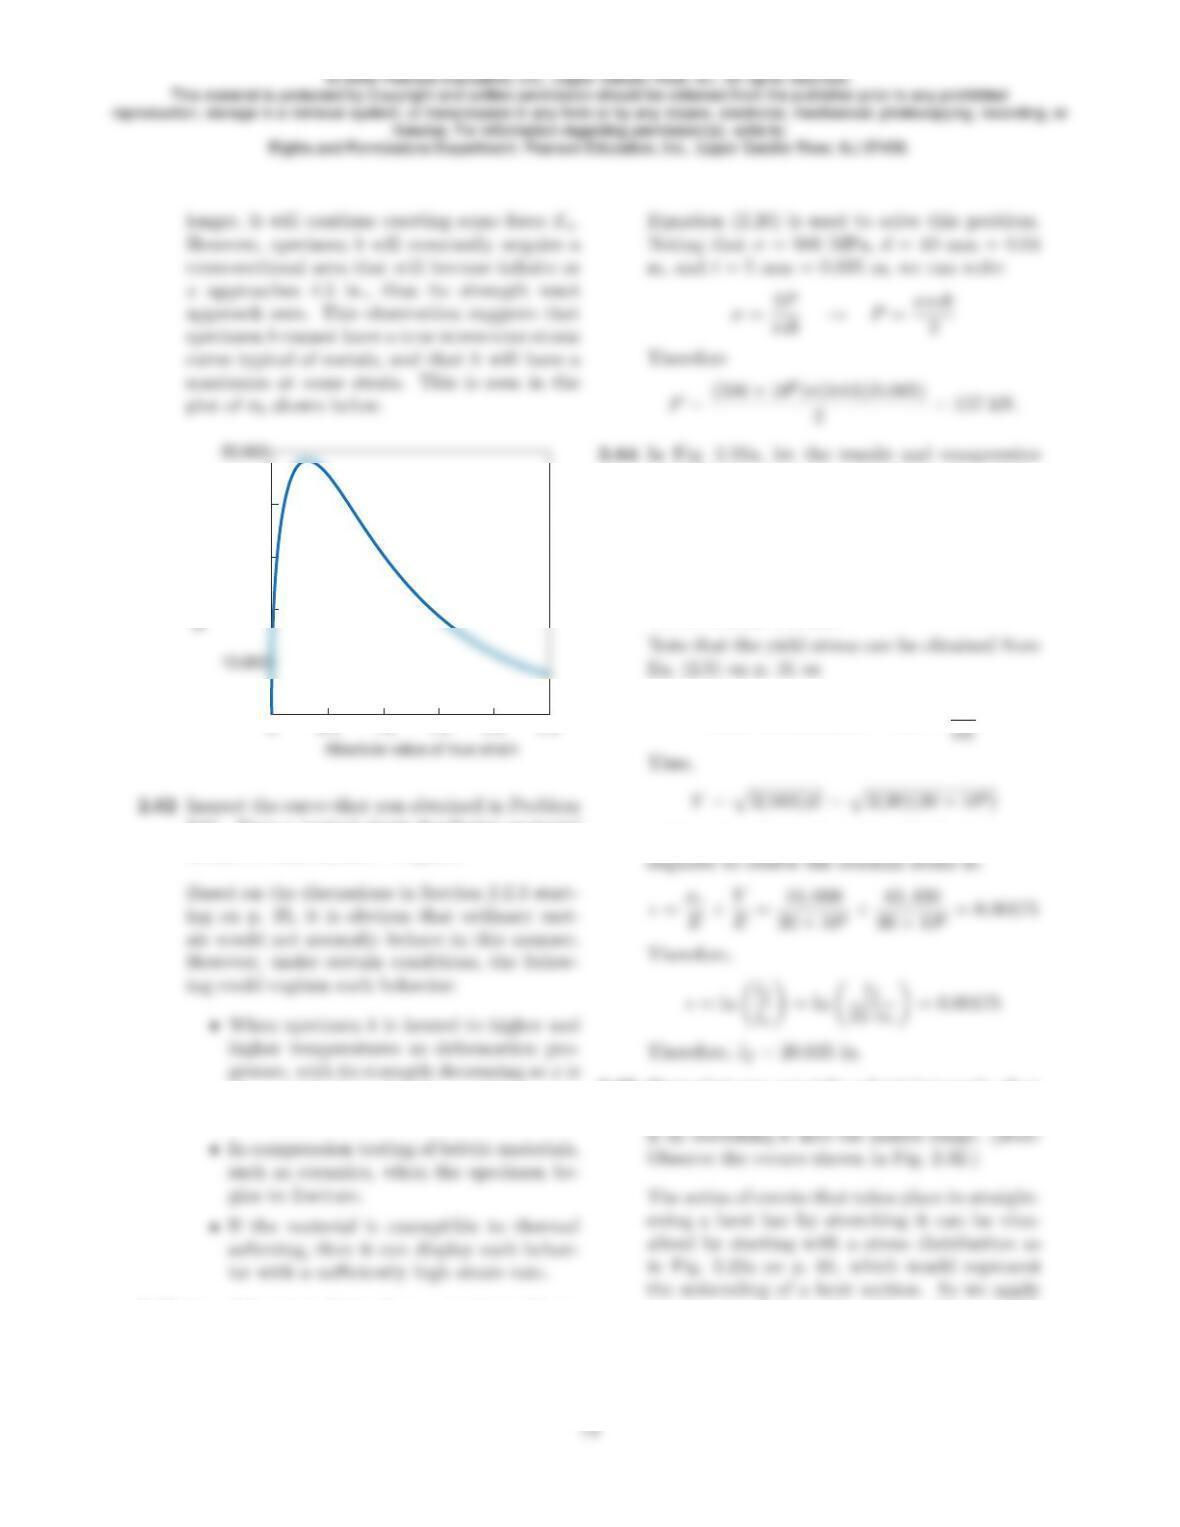
2.42 Plot the data in Table 2.1 on a bar chart, show-
ing the range of values, and comment on the
results.
By the student. An example of a bar chart for
the elastic modulus is shown below.
© 2008 Pearson Education, Inc., Upper Saddle River, NJ. All rights reserved.
This material is protected by Copyright and written permission should be obtained from the publisher prior to any prohibited
reproduction, storage in a retrieval system, or transmission in any form or by any means, electronic, mechanical, photocopying, recording, or
likewise. For information regarding permission(s), write to:
Rights and Permissions Department, Pearson Education, Inc., Upper Saddle River, NJ 07458.
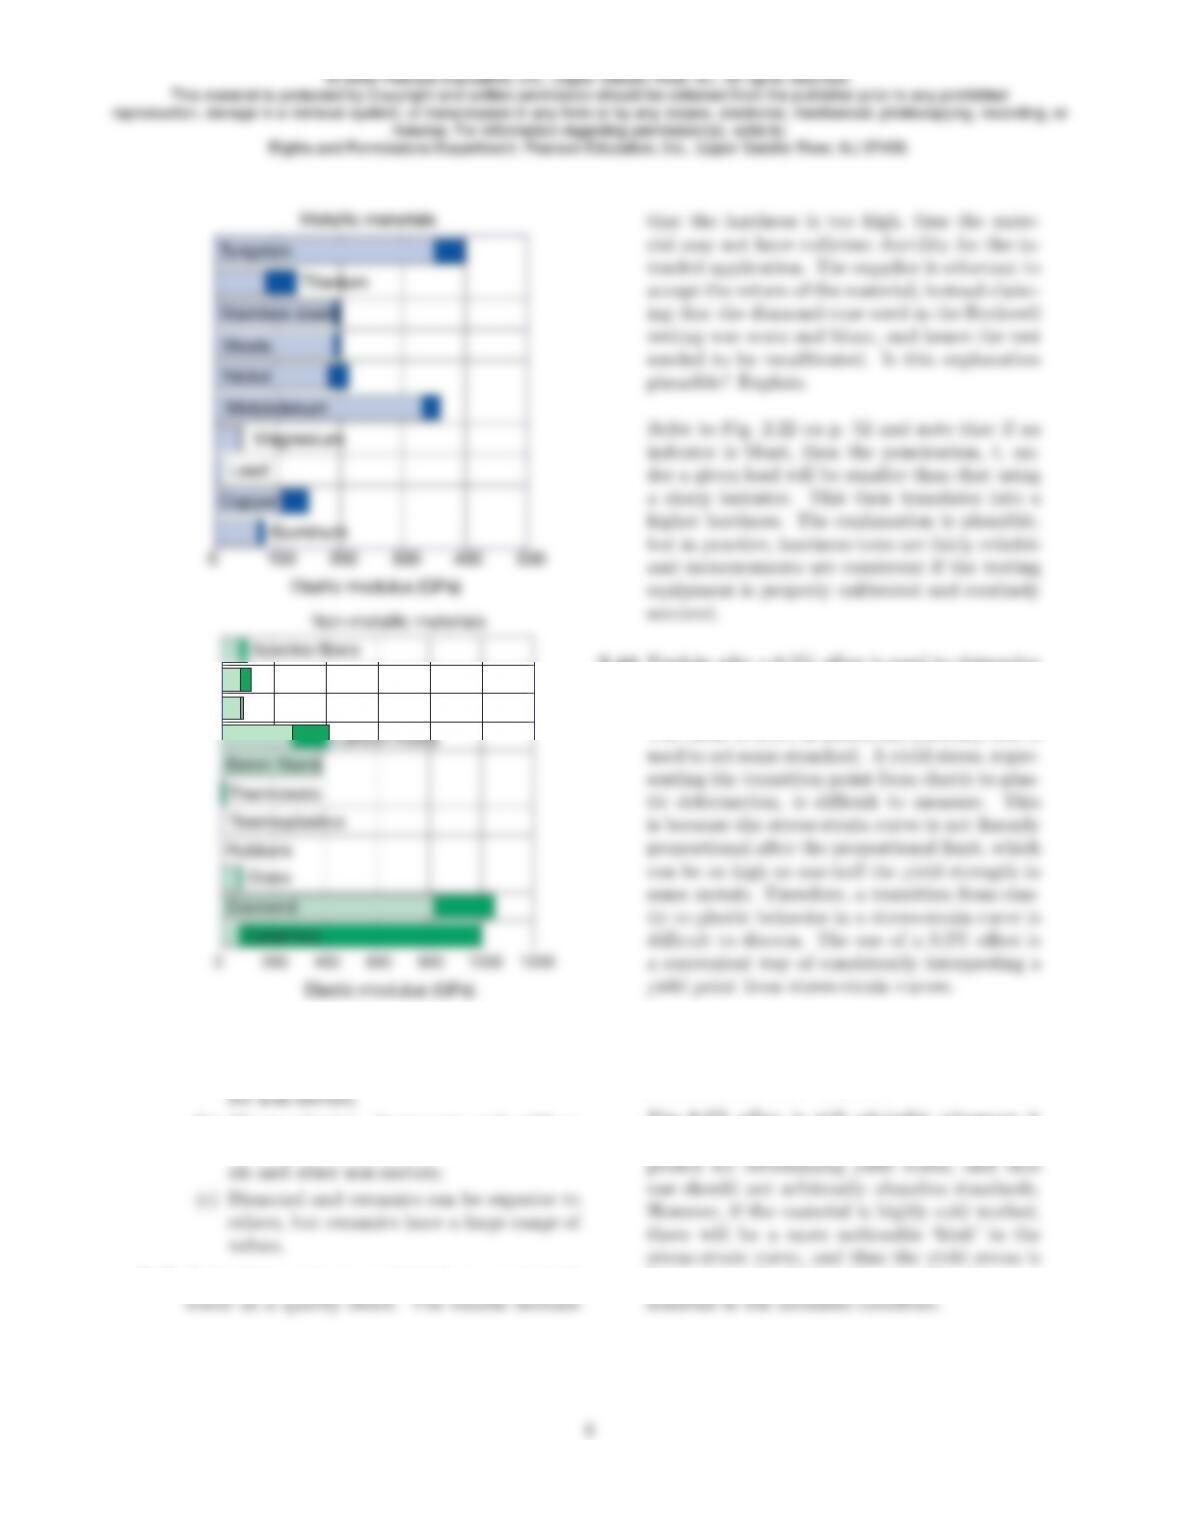
0 100 200 300 400 500
Aluminum
Copper
Lead
Magnesium
Molybdenum
Nickel
Steels
Stainless steels
Titanium
Tungsten
Elastic modulus (GPa)
Metallic materials
Carbon fibers
Glass fibers
Kevlar fibers
Spectra fibers
Non-metallic materials
Typical comments regarding such a chart are:
(a) There is a smaller range for metals than
(b) Thermoplastics, thermosets and rubbers
are orders of magnitude lower than met-
2.43 A hardness test is conducted on as-received
that the hardness is too high, thus the mate-
rial may not have sufficient ductility for the in-
tended application. The supplier is reluctant to
accept the return of the material, instead claim-
ing that the diamond cone used in the Rockwell
testing was worn and blunt, and hence the test
needed to be recalibrated. Is this explanation
plausible? Explain.
Refer to Fig. 2.22 on p. 52 and note that if an
indenter is blunt, then the penetration, t, un-
der a given load will be smaller than that using
a sharp indenter. This then translates into a
higher hardness. The explanation is plausible,
but in practice, hardness tests are fairly reliable
and measurements are consistent if the testing
equipment is properly calibrated and routinely
serviced.
2.44 Explain why a 0.2% offset is used to determine
the yield strength in a tension test.
The value of 0.2% is somewhat arbitrary and is
2.45 Referring to Question 2.44, would the off-
set method be necessary for a highly-strained-
hardened material? Explain.
The 0.2% offset is still advisable whenever it
can be used, because it is a standardized ap-
far more easily discernable than for the same
© 2008 Pearson Education, Inc., Upper Saddle River, NJ. All rights reserved.
This material is protected by Copyright and written permission should be obtained from the publisher prior to any prohibited
reproduction, storage in a retrieval system, or transmission in any form or by any means, electronic, mechanical, photocopying, recording, or
likewise. For information regarding permission(s), write to:
Rights and Permissions Department, Pearson Education, Inc., Upper Saddle River, NJ 07458.
2.46 A strip of metal is originally 1.5 m long. It is
stretched in three steps: first to a length of 1.75
m, then to 2.0 m, and finally to 3.0 m. Show
ǫ= ln l
1.75= 0.1335
Therefore the true strains are additive. Us-
e2= 0.1429, and e3= 0.5. The sum of these
strains is e1+e2+e3= 0.8096. The engineering
lo
1.5=1.5
1.5= 1
Note that this is not equal to the sum of the
2.47 A paper clip is made of wire 1.20-mm in di-
ameter. If the original material from which the
Assuming volume constancy, we may write
lf
=do
=15
= 156.25 ≈156
ed=1.2−15
15 =−0.92
The longitudinal true strain is given by
ǫd= ln 1.20
2.48 A material has the following properties: UTS =
Let us first note that the true UTS of this ma-
n= 0.25, we can write
= (50,000)(1.28) = 64,200 psi
© 2008 Pearson Education, Inc., Upper Saddle River, NJ. All rights reserved.
This material is protected by Copyright and written permission should be obtained from the publisher prior to any prohibited
reproduction, storage in a retrieval system, or transmission in any form or by any means, electronic, mechanical, photocopying, recording, or
likewise. For information regarding permission(s), write to:
Rights and Permissions Department, Pearson Education, Inc., Upper Saddle River, NJ 07458.
70-30 brass.
From Fig. 2.6 on p. 37, the true stress for an-
2.50 Calculate the ultimate tensile strength (engi-
neering) of a material whose strength coefficient
n= 0.20. Following the same procedure as in
Example 2.1, we find the true ultimate tensile
2.51 A cable is made of four parallel strands of dif-
ferent materials, all behaving according to the
equation σ=Kǫn, where n= 0.3 The materi-
Material B: K= 600 MPa, Ao= 2.5 mm2;
Material C: K= 300 MPa, Ao= 3 mm2;
Material D: K= 760 MPa, Ao= 2 mm2;
(b) Explain how you would arrive at an an-
swer if the nvalues of the three strands
were different from each other.
AD= (2)e−0.3= 1.48 mm2
+(209)(2.22) + (530)(1.48)
= 3650 N
2.52 Using only Fig. 2.6, calculate the maximum
load in tension testing of a 304 stainless-steel
round specimen with an original diameter of 0.5
in.
0.196 in2. Since n= 0.1, we follow a procedure
Ao
=e0.1= 1.1
© 2008 Pearson Education, Inc., Upper Saddle River, NJ. All rights reserved.
This material is protected by Copyright and written permission should be obtained from the publisher prior to any prohibited
reproduction, storage in a retrieval system, or transmission in any form or by any means, electronic, mechanical, photocopying, recording, or
likewise. For information regarding permission(s), write to:
Rights and Permissions Department, Pearson Education, Inc., Upper Saddle River, NJ 07458.
Thus
1.1= 100,000 psi
2.53 Using the data given in Table 2.1, calculate the
values of the shear modulus Gfor the metals
listed in the table.
The important equation is Eq. (2.24) on p. 49
2.55 A cylindrical specimen made of a brittle mate-
It is found that fracture takes place at an angle
will be zero. The third principal stress acting
on this specimen is normal to the specimen and
its magnitude is
σ3=30,000
© 2008 Pearson Education, Inc., Upper Saddle River, NJ. All rights reserved.
This material is protected by Copyright and written permission should be obtained from the publisher prior to any prohibited
reproduction, storage in a retrieval system, or transmission in any form or by any means, electronic, mechanical, photocopying, recording, or
likewise. For information regarding permission(s), write to:
Rights and Permissions Department, Pearson Education, Inc., Upper Saddle River, NJ 07458.
the values given in the text; this is due to the
2.57 Calculate the work done in frictionless compres-
(2) annealed copper, (3) annealed 304 stainless
steel, and (4) 70-30 brass, annealed.
The work done is calculated from Eq. (2.62) on
Eq. (2.60). For example, for 1100-O aluminum,
where Kis 180 MPa and nis 0.20, uis calcu-
100,000 psi Assuming that a tensile-test spec-
maximum load and the necking strain for this
UTStrue = (100,000)(0.17)0.17 = 74,000 psi.
The cross-sectional area at the onset of necking
2.59 A tensile-test specimen is made of a material
represented by the equation σ=K(ǫ+n)n.
© 2008 Pearson Education, Inc., Upper Saddle River, NJ. All rights reserved.
This material is protected by Copyright and written permission should be obtained from the publisher prior to any prohibited
reproduction, storage in a retrieval system, or transmission in any form or by any means, electronic, mechanical, photocopying, recording, or
likewise. For information regarding permission(s), write to:
Rights and Permissions Department, Pearson Education, Inc., Upper Saddle River, NJ 07458.
ameter but different heights. Assume that both
specimens are compressed (frictionless) by the
and from volume constancy,
and
hsf
=Dso
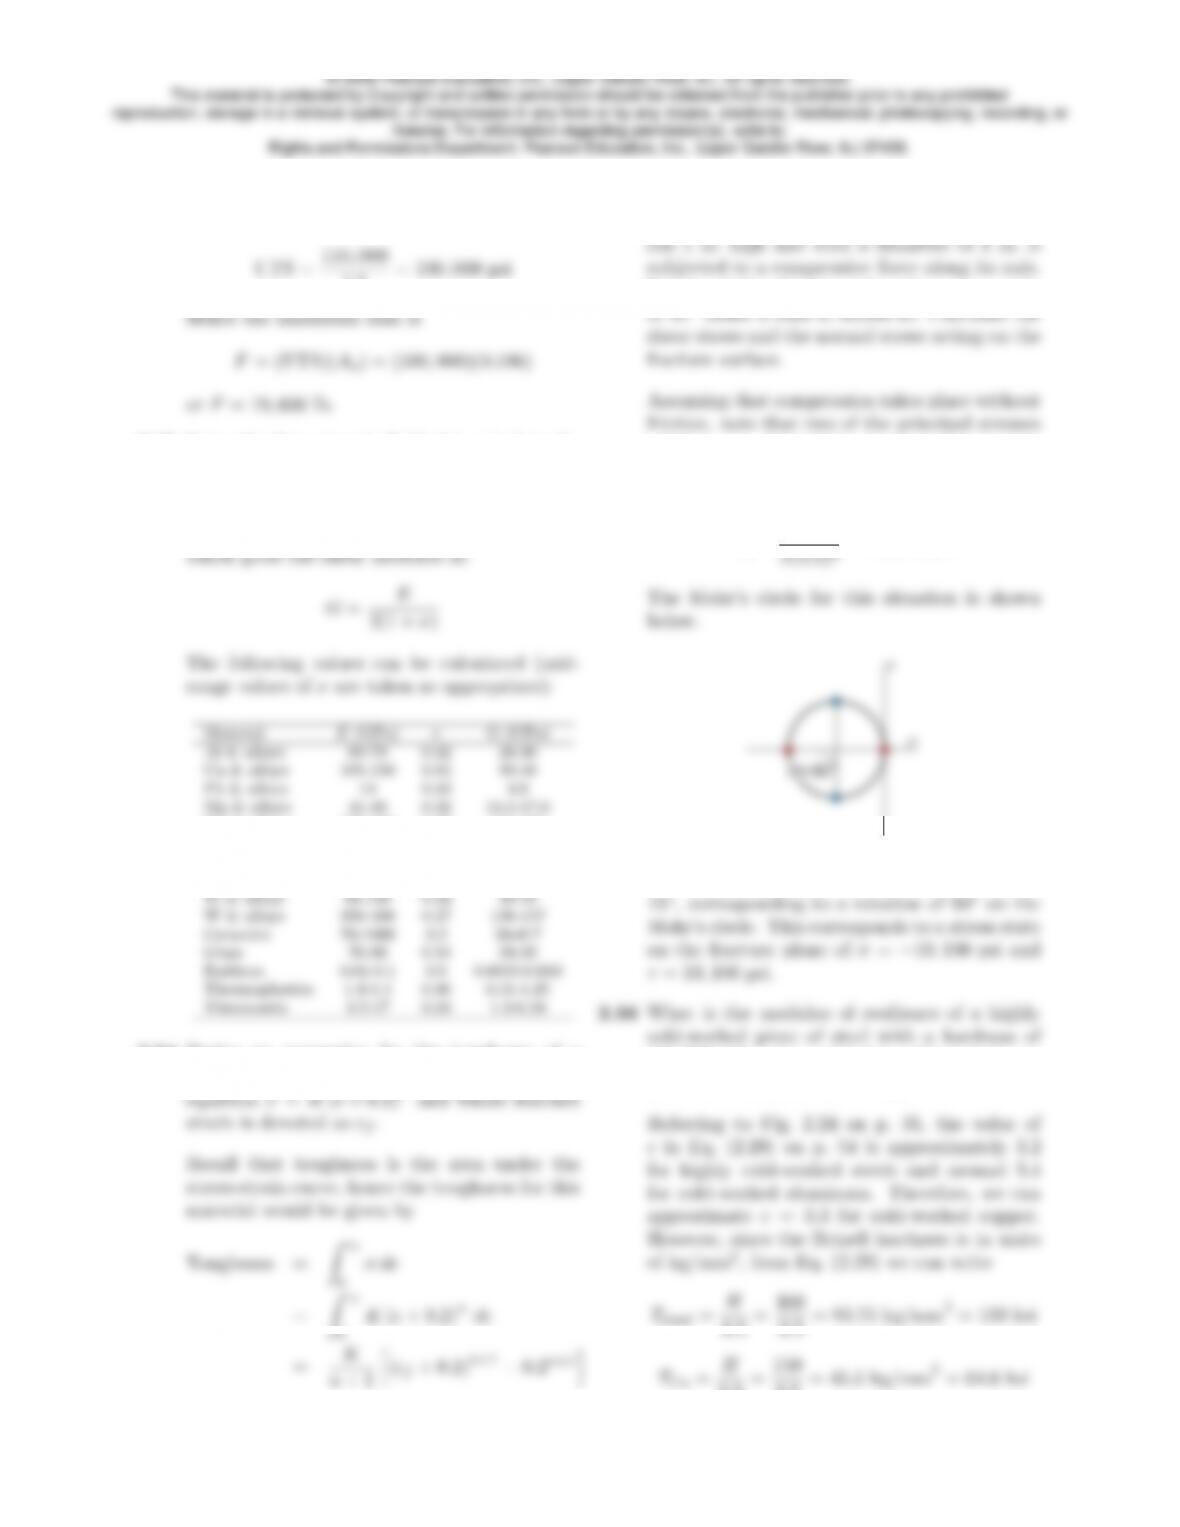
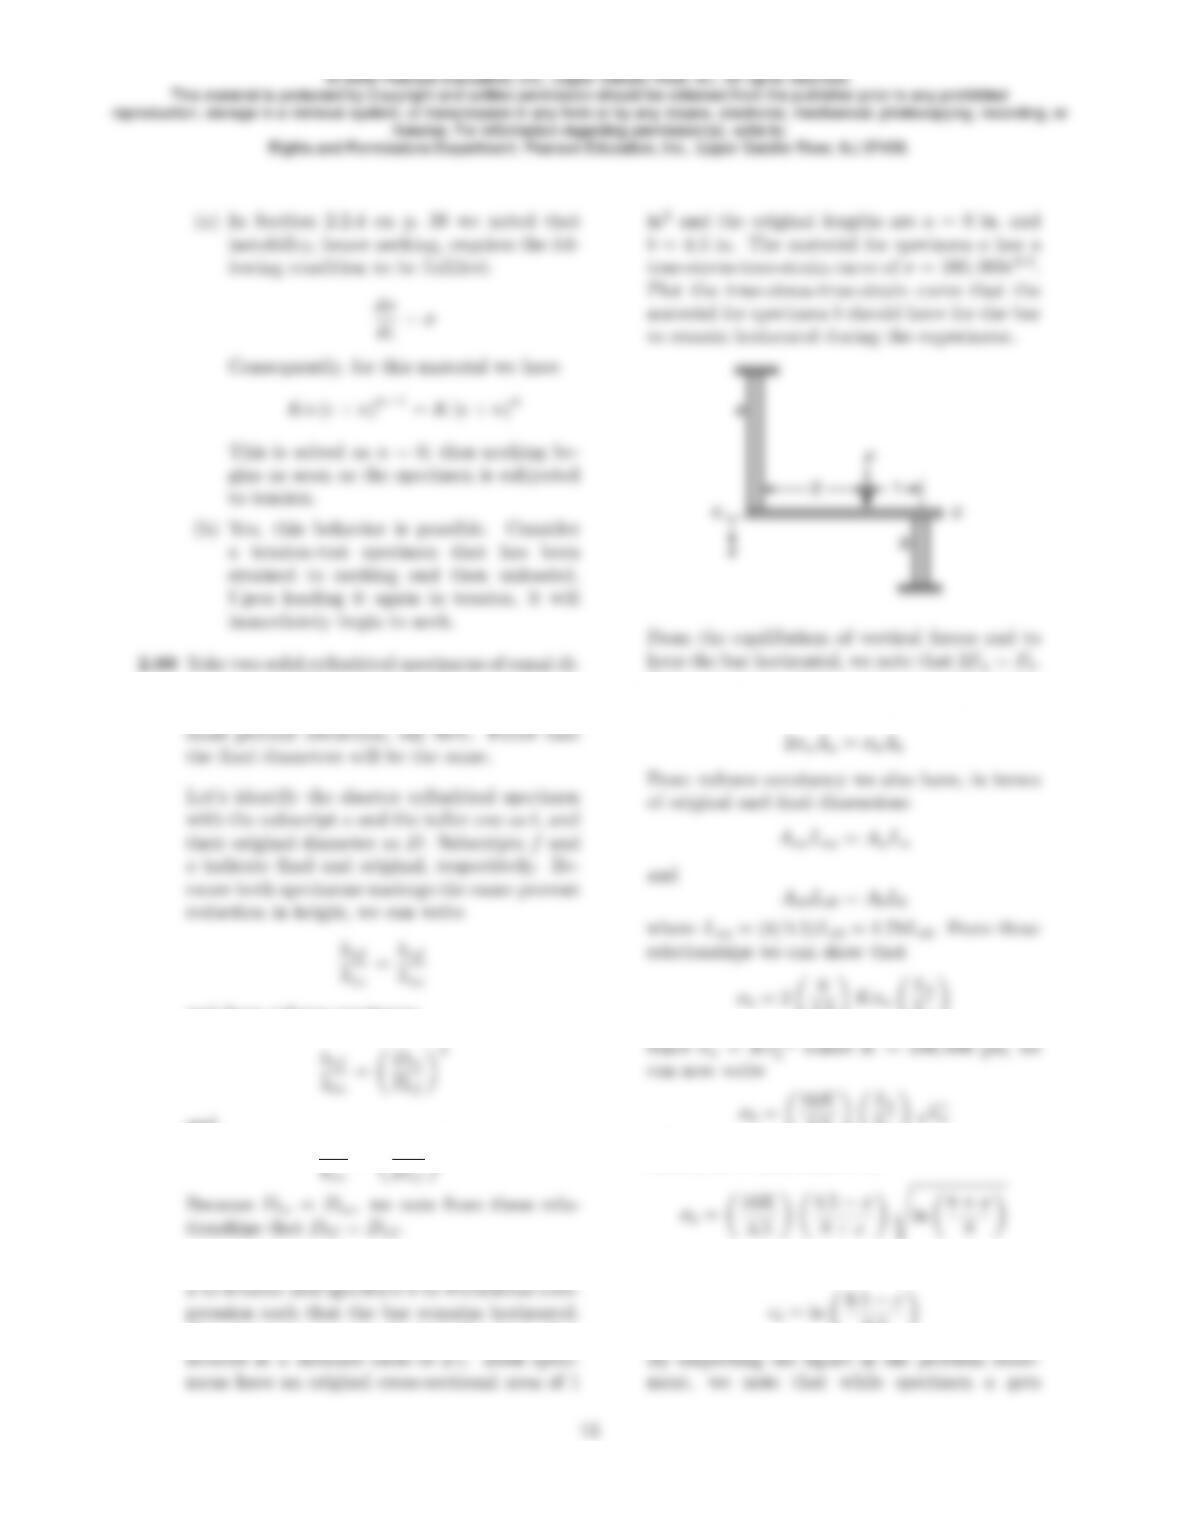
2.61 A horizontal rigid bar c–cis subjecting specimen
(See the accompanying figure.) The force Fis
Hence, in terms of true stresses and instanta-
neous areas, we have
4.5KσaLb
La
4.5Lb
La√ǫa
Hence, for a deflection of x,
The true strain in specimen b is given by
4.5
© 2008 Pearson Education, Inc., Upper Saddle River, NJ. All rights reserved.
This material is protected by Copyright and written permission should be obtained from the publisher prior to any prohibited
reproduction, storage in a retrieval system, or transmission in any form or by any means, electronic, mechanical, photocopying, recording, or
likewise. For information regarding permission(s), write to:
Rights and Permissions Department, Pearson Education, Inc., Upper Saddle River, NJ 07458.
2.63 In a disk test performed on a specimen 40-mm
in diameter and 5 m thick, the specimen frac-
tures at a stress of 500 MPa. What was the
load on the disk at fracture?
tension, we algebraically add a uniform tensile
stress to this stress distribution. Note that the
change in the stresses is the same as that de-
picted in Fig. 2.32d, namely, the tensile stress
© 2008 Pearson Education, Inc., Upper Saddle River, NJ. All rights reserved.
This material is protected by Copyright and written permission should be obtained from the publisher prior to any prohibited
reproduction, storage in a retrieval system, or transmission in any form or by any means, electronic, mechanical, photocopying, recording, or
likewise. For information regarding permission(s), write to:
Rights and Permissions Department, Pearson Education, Inc., Upper Saddle River, NJ 07458.