𝑃(𝐿𝐶𝐿<𝑋̄⟨𝑈𝐶𝐿|𝜇=45)=𝑃(𝐿𝐶𝐿−𝜇
𝜎𝑋
̄<𝑍<𝑈𝐶𝐿−𝜇
𝜎𝑋
̄)
( 44) ( )
LCL UCL
P LCL X UCL P Z
−−
= =
Reserve Problems Chapter 15 Section 7 Problem 3
Consider an
X
control chart with
7.443UCL =
,
5.125LCL =
, and
3n=
. Suppose that the
mean shifts to 5.49.
(a) What is the probability that this shift will be detected on the next sample?
(b) What is the ARL after the shift?
SOLUTION
(a)
(b)
Reserve Problems Chapter 15 Section 7 Problem 4
Consider an
X
control chart with
24.802UCL =
,
23.792LCL =
, and 𝑛=2
3n=
. Suppose that
the mean shifts to 24.23.
(a) What is the probability that this shift will be detected on the next sample?
(b) What is the ARL after the shift?
SOLUTION
(a)
(b)
Reserve Problems Chapter 15 Section 8 Problem 1
A process has a target of μ0 = 100 and a standard deviation of σ = 4. Samples of size n = 1 are
taken every two hours. Use following table:
Shift in Mean (multiple of
x
)
h = 4
h = 5
0
168
465
0.25
74.2
139
0.5
26.6
38
0.75
13.3
17
1
8.38
10.4
1.5
4.75
5.75
2
3.34
4.01
2.5
2.62
3.11
3
2.19
2.57
4
1.71
2.01
(a) Suppose that the process mean shifts to 𝜇=94
102
=
. How many hours of production
occur before the process shift is detected by a CUSUM with
5h=
and
1
2
k=
?
(b) It is important to detect the shift defined in part (a) more quickly. A proposal to reduce the
sampling frequency to 0.5 hour is made. How does this affect the CUSUM control procedure?
Suppose that the 0.5 hour sampling interval in part (b) is adopted.
(c) How often do false alarms occurs with this new sampling interval?
How often did they occur with the old interval of two hours?
(d) A proposal is made to increase the sample size to n = 4 and retain the two-hour sampling
interval.
SOLUTION
(a)
Reserve Problems Chapter 15 Section 8 Problem 2
Heart rate (in counts/minute) is measured every 30 minutes. The results of 20 consecutive
measurements are as follows:
Sample
Heart
Rate
1
68
2
71
3
67
4
69
5
71
6
70
7
69
8
67
9
70
10
70
11
79
12
79
13
78
14
78
15
78
16
79
17
79
18
82
19
82
20
81
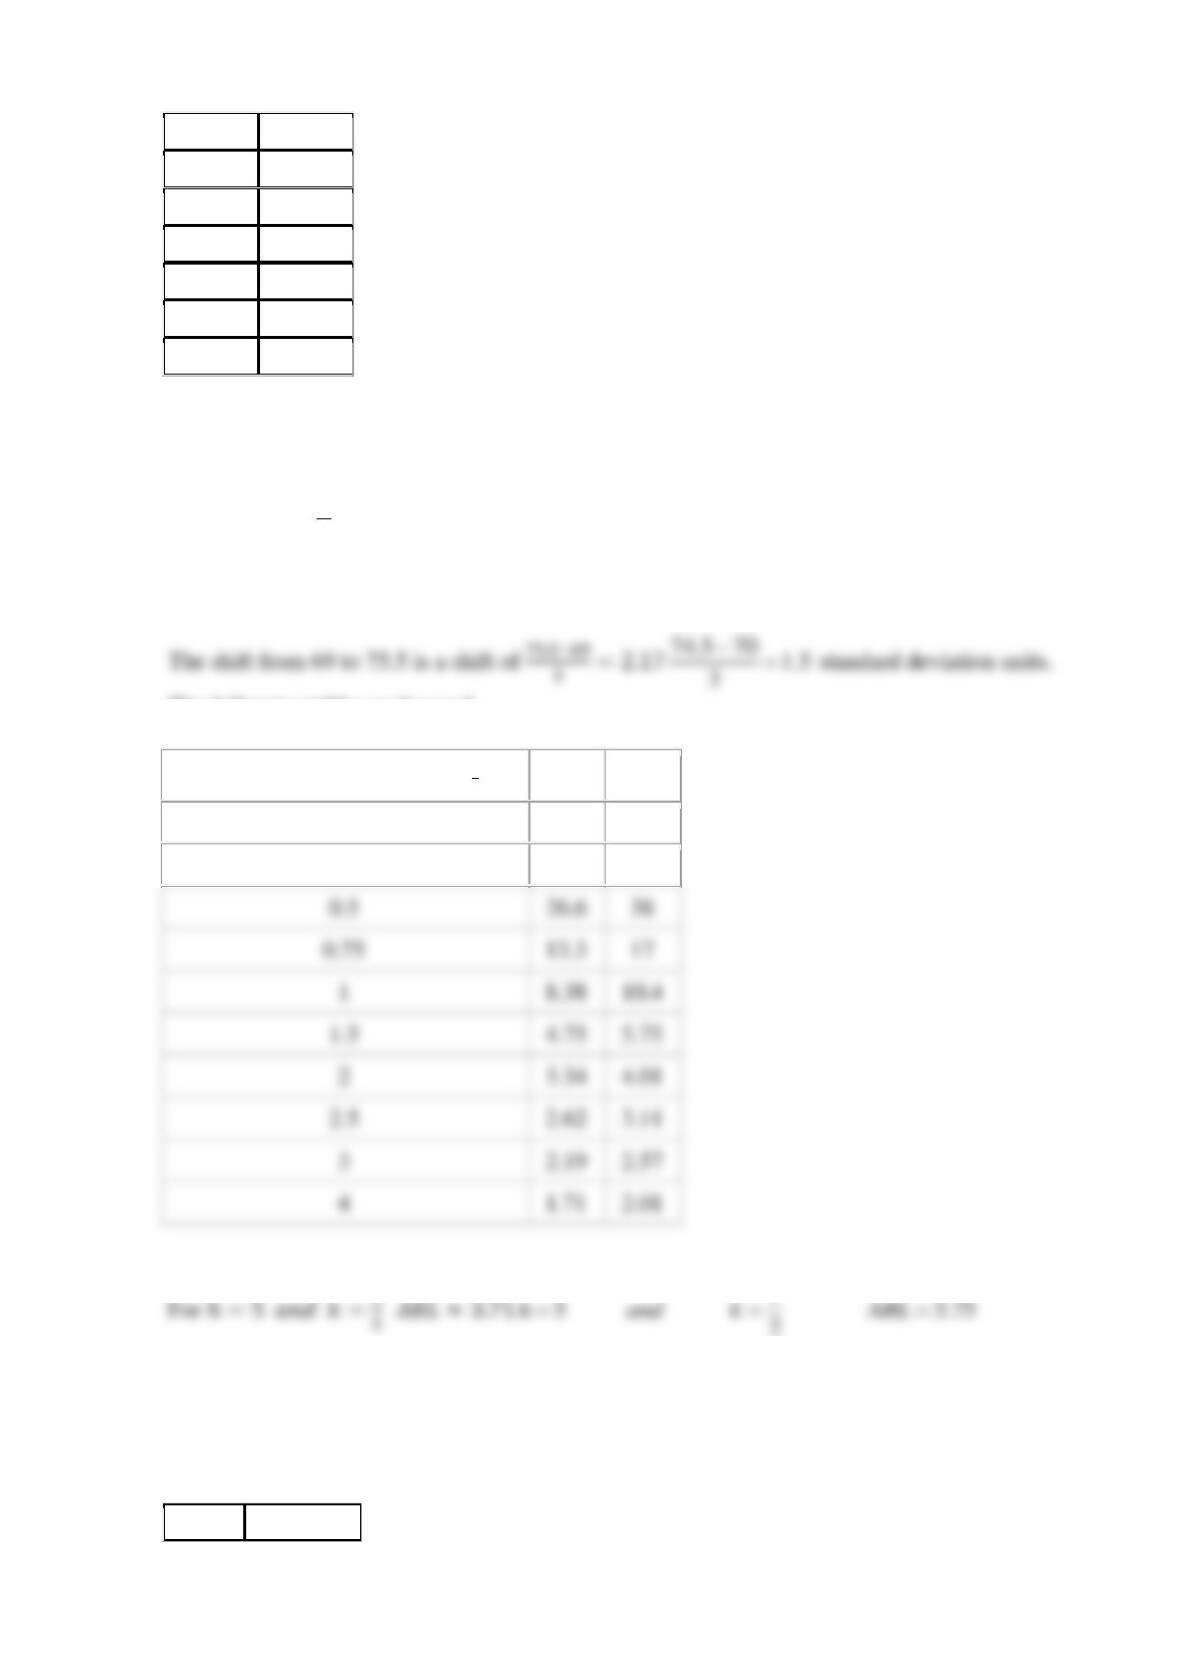
Suppose that the standard deviation of the heart rate is 𝜎=2.6
3
=
and the target value is 69.
How many samples on average would be required to detect a shift of the mean heart rate to 75.5?
Use
5h=
,
1
2
k=
.
SOLUTION
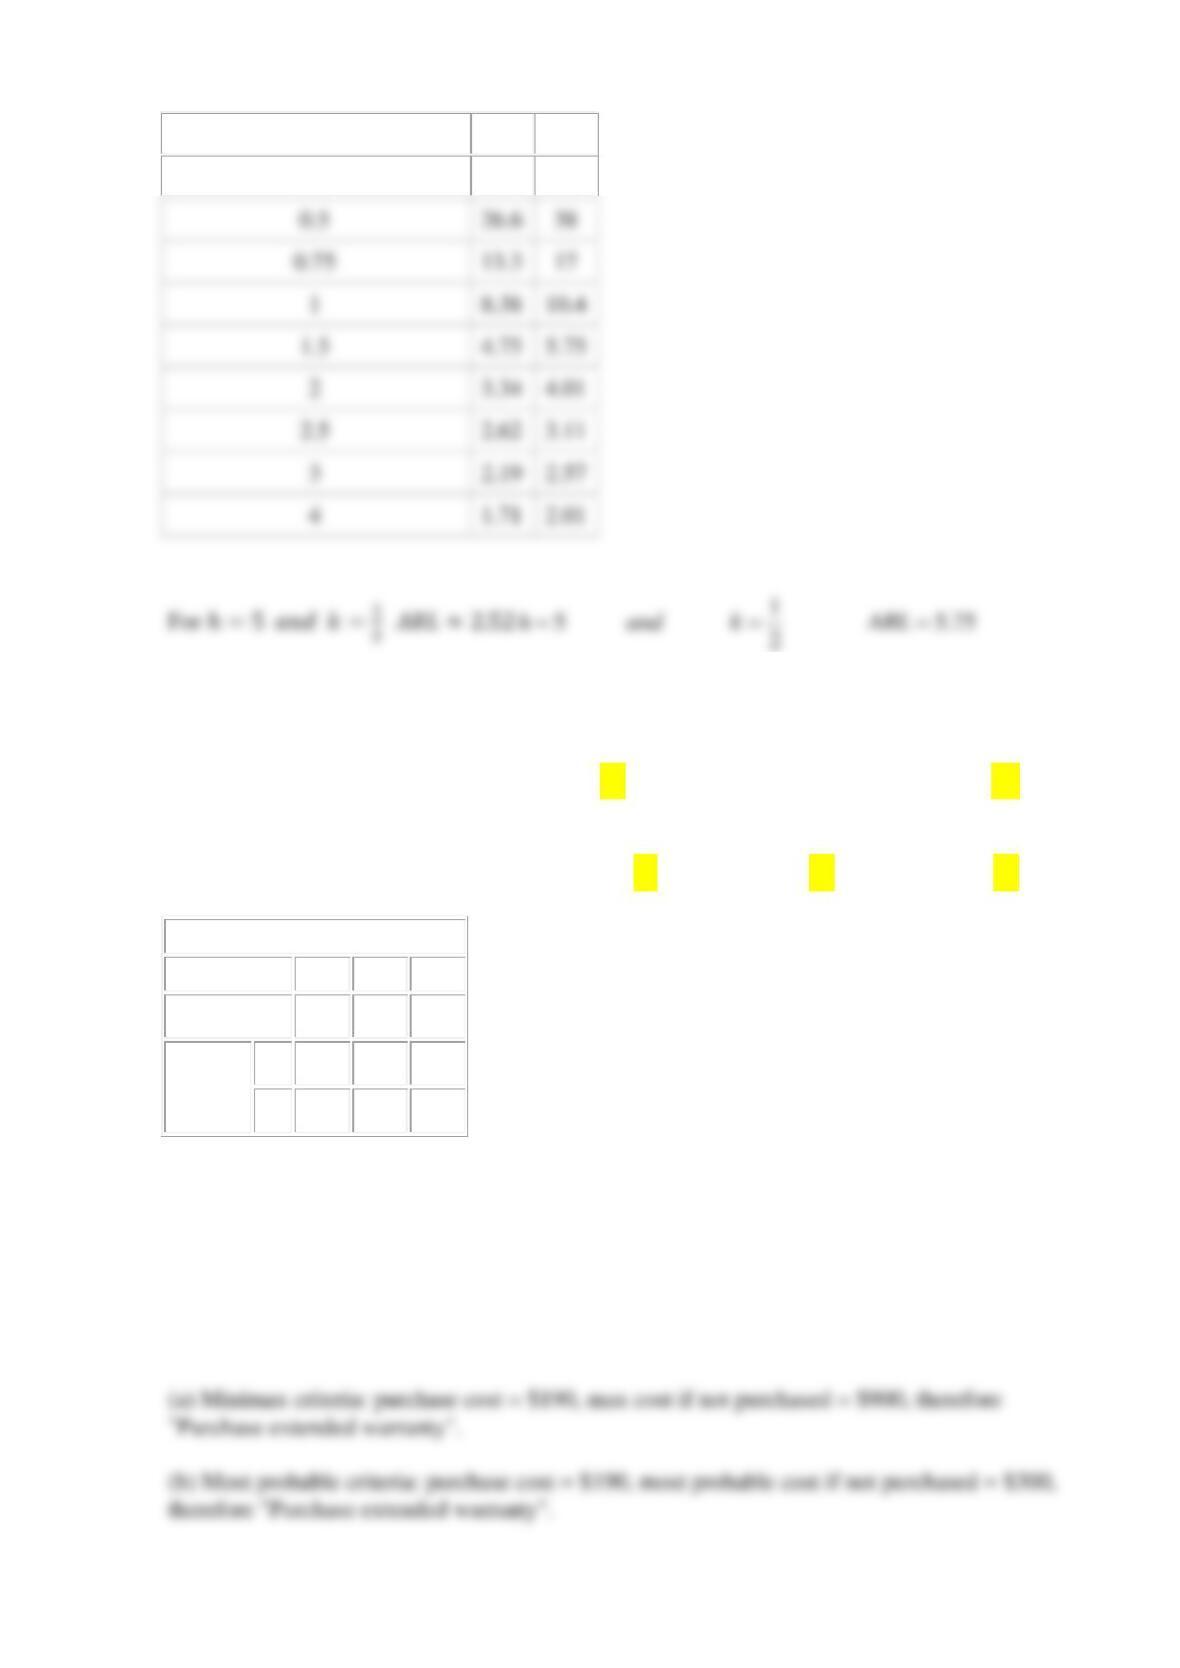
The following table can be used.
Shift in Mean (multiple of
x
)
h = 4
h = 5
0
168
465
0.25
74.2
139
26.6
0.75
13.3
8.38
10.4
4.75
5.75
3.34
4.01
2.62
3.11
2.19
2.57
1.71
2.01
Reserve Problems Chapter 15 Section 8 Problem 3
The number of influenza patients (in thousands) visiting hospitals weekly is shown in the
following table.
Sample
Number
of Patients
1
162.27
2
157.47
3
157.065
4
160.45
5
157.993
6
162.27
7
160.652
8
159.09
9
157.442
10
160.78
11
159.138
12
161.08
13
159.989
14
159.09
15
162.699
16
163.89
17
164.247
18
162.7
19
164.859
20
163.65
21
165.99
22
163.22
23
164.338
24
164.83
Suppose that the standard deviation of the heart rate is 𝜎=3.7
3
=
and the target value is
159.3.
How many samples on average would be required to detect a shift of the mean to 168.55?
Use
5h=
,
1
2
k=
.
SOLUTION
0
168
465
0.25
74.2
139
Reserve Problems Chapter 15 Section 10 Problem 1
For deciding whether to purchase an extended warranty on a vehicle, use the following model.
The actions are purchase extended warranty (
1
a
), do not purchase extended warranty (
2
a
).
Assume that one of three states corresponding to a major, minor, or no repair can occur during
the warranty period. The states are major repair (
1
s
), minor repair (
2
s
), and no repair (
3
s
).
Decision Evaluation Table
Probabilities
0.1
0.5
0.4
States
1
s
2
s
3
s
Actions
1
a
$190
$190
$190
2
a
$900
$300
$0
Determine the decision selected based on the minimax, most probable, and expected cost criteria.
(a) Minimax criteria:
(b) Most probable criteria:
(c) Expected cost:
SOLUTION
26.6
0.75
13.3
1
8.38
10.4
4.75
5.75
2
3.34
4.01
2.62
3.11
3
2.19
2.57
4
1.71
2.01
Reserve Problems Chapter 15 Section 10 Problem 2
For deciding whether to purchase an extended warranty on a vehicle, use the following model.
The actions are purchase extended warranty (
1
a
), do not purchase extended warranty (
2
a
).
Assume that one of three states corresponding to a major, minor, or no repair can occur during
the warranty period. The states are major repair (
1
s
), minor repair (
2
s
), and no repair (
3
s
).
Decision Evaluation Table
Probabilities
0.3
0.35
0.35
States
1
s
2
s
3
s
Actions
1
a
$200
$200
$200
2
a
$1200
$300
$0
Determine the decision selected based on the minimax, most probable, and expected cost criteria.
(a) Minimax criteria:
(b) Most probable criteria:
(c) Expected cost:
SOLUTION
(a) Minimax criteria: purchase cost = $200, max cost if not purchased = $1200, therefore
Reserve Problems Chapter 15 Section 10 Problem 3
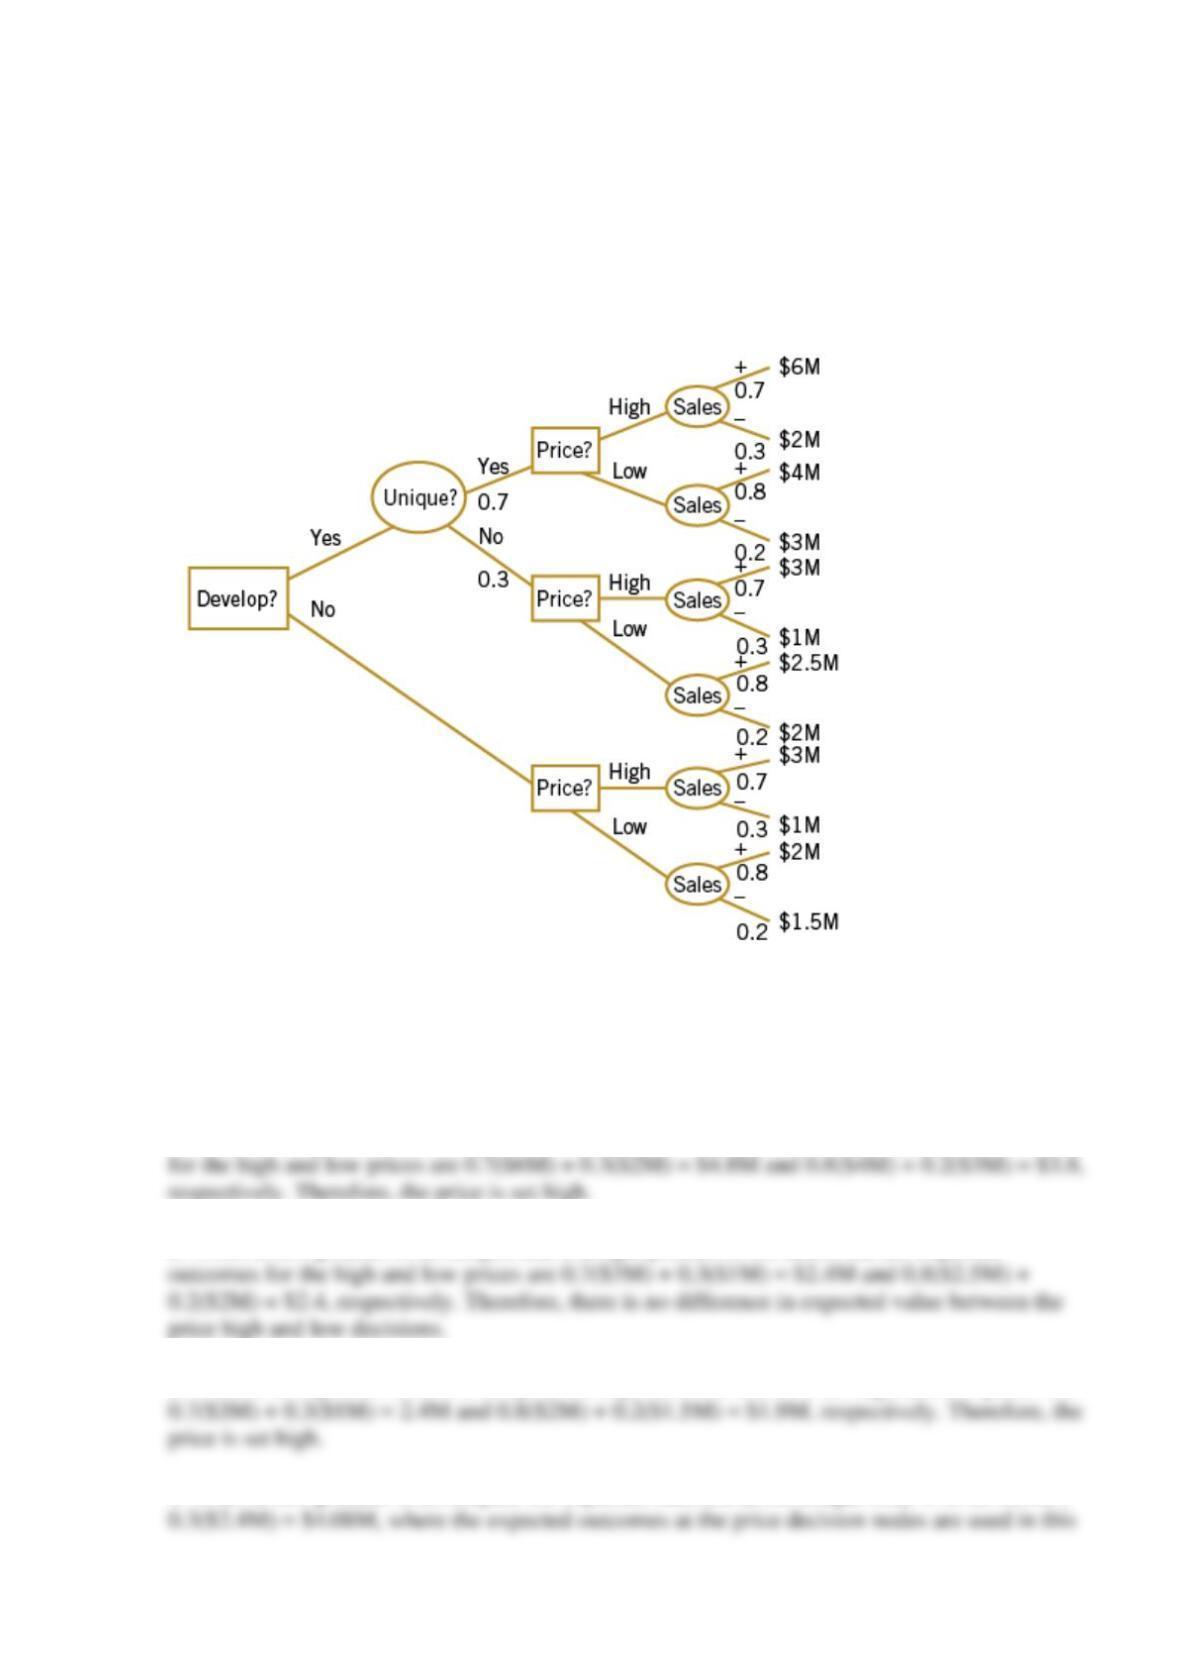
The first decision is whether to develop a new product or contract with a supplier. This is
indicated by the box labeled Develop? If a new product is developed, it may be unique, but it
may be more typical of what is currently available on the market. This is indicated by the circle
labeled Unique? For either a new product or a contracted one, the price needs to be set. Here the
decision is indicated by Price? boxes. The choices are either high or low. Finally, the market
conditions when the product is available may be favorable or unfavorable to sales as indicated by
the circle labeled Sales. Favorable and unfavorable markets are indicated by the arcs labeled +
and –, respectively.
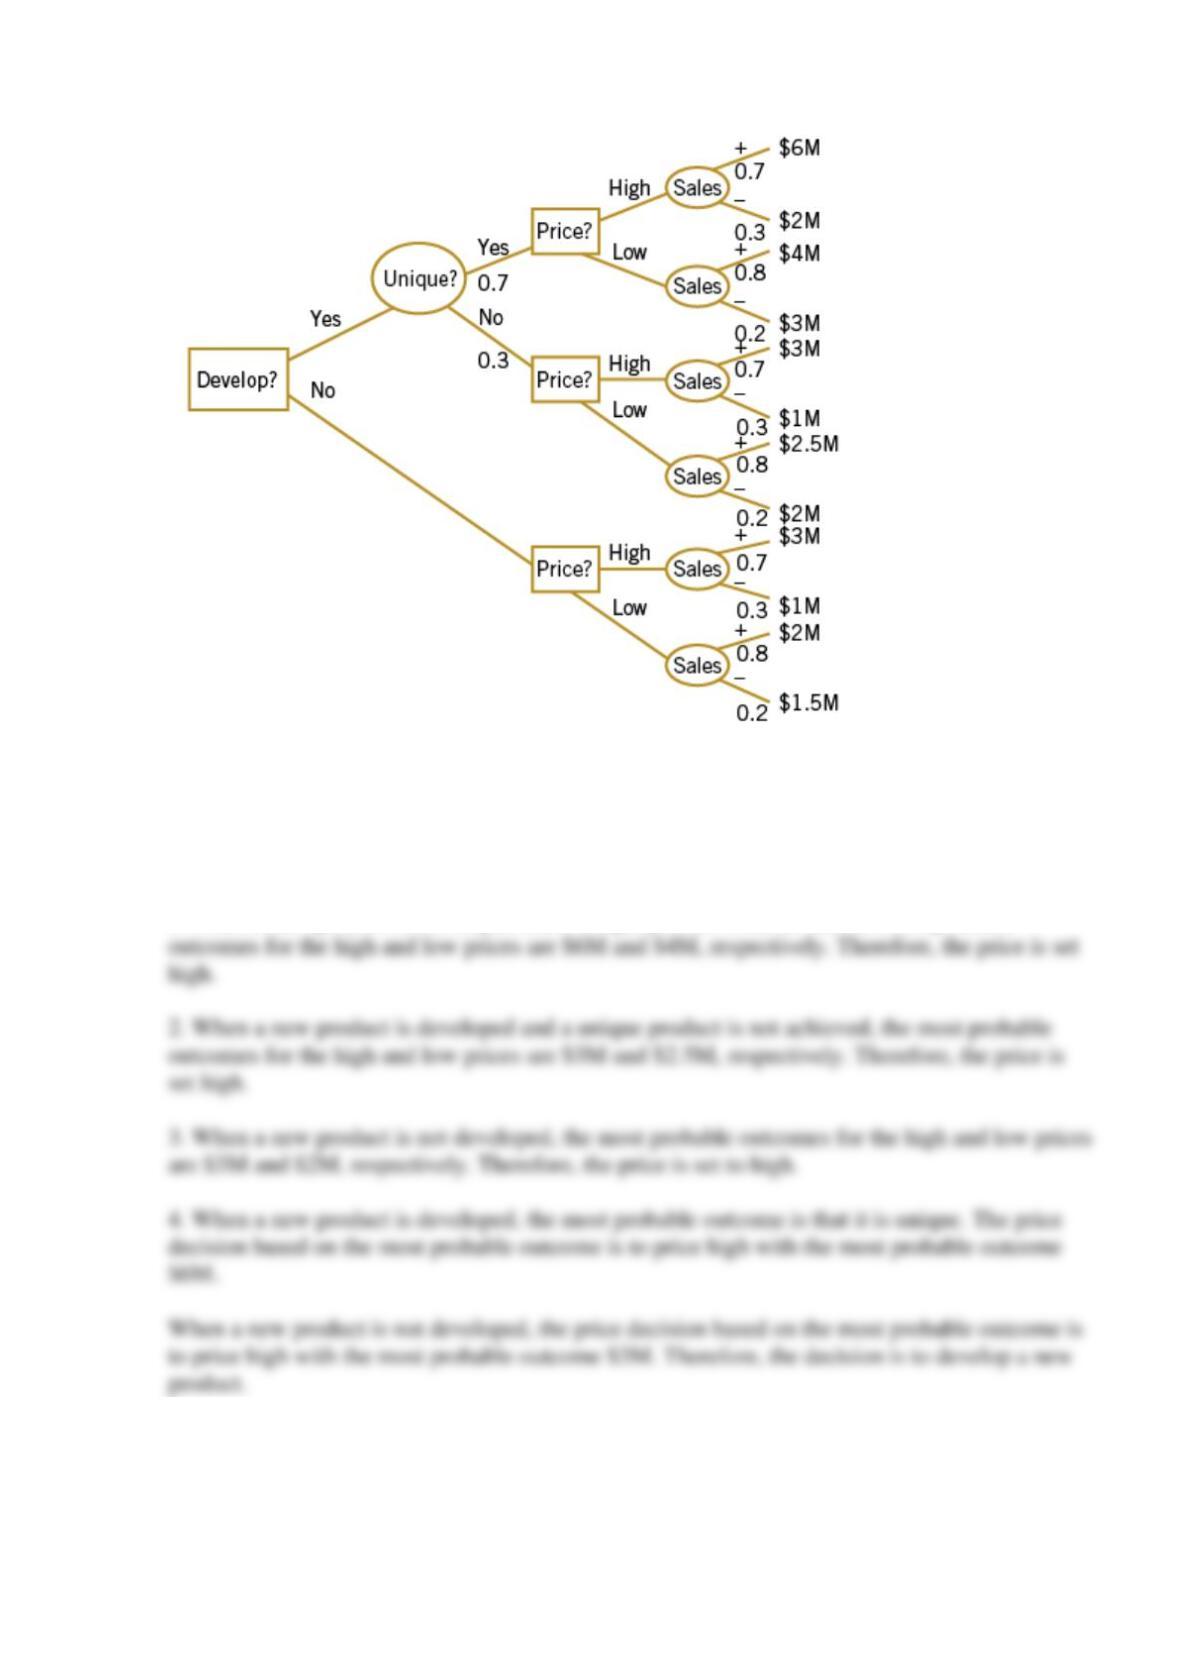
Analyze this problem based on the expected profit criterion and determine the actions that are
selected at each decision node.
SOLUTION
Decisions:
1. When a new product is developed and a unique product is achieved, the most probable
Reserve Problems Chapter 15 Section 10 Problem 4
The first decision is whether to develop a new product or contract with a supplier. This is
indicated by the box labeled Develop? If a new product is developed, it may be unique, but it
may be more typical of what is currently available on the market. This is indicated by the circle
labeled Unique? For either a new product or a contracted one, the price needs to be set. Here the
decision is indicated by Price? boxes. The choices are either high or low. Finally, the market
conditions when the product is available may be favorable or unfavorable to sales as indicated by
the circle labeled Sales. Favorable and unfavorable markets are indicated by the arcs labeled +
and –, respectively.
Analyze this problem based on the most probable criterion and determine the actions that are
selected at each decision node.
SOLUTION
Decisions:
1. When a new product is developed and a unique product is achieved, the expected outcomes
2. When a new product is developed and a unique product is not achieved, the expected
3. When a new product is not developed, the expected outcomes for the high and low prices are
4. When a new product is developed, the expected outcome at the unique node is 0.7($4.8M) +
Reserve Supplemental Exercises Chapter 15 Problem 1
Cover cases for a personal computer are manufactured by injection molding. Samples of 4 cases
are taken from the process periodically, and the number of defects is noted. Twenty-five samples
follow:
Sample
No.
of Defects
1
3
2
2
3
0
4
1
5
4
6
3
7
2
8
4
9
1
10
0
11
2
12
3
13
2
14
8
15
0
16
2
17
4
18
3
19
5
20
0
21
2
22
1
23
9
24
3
25
2
(a) Using all the data, find trial control limits for a U chart for the process.
(b) Suppose that instead of samples of 4 cases, the sample size was 11. Repeat part (a).
(c) Explain how the change of the sample size responds to the control limits.
SOLUTION
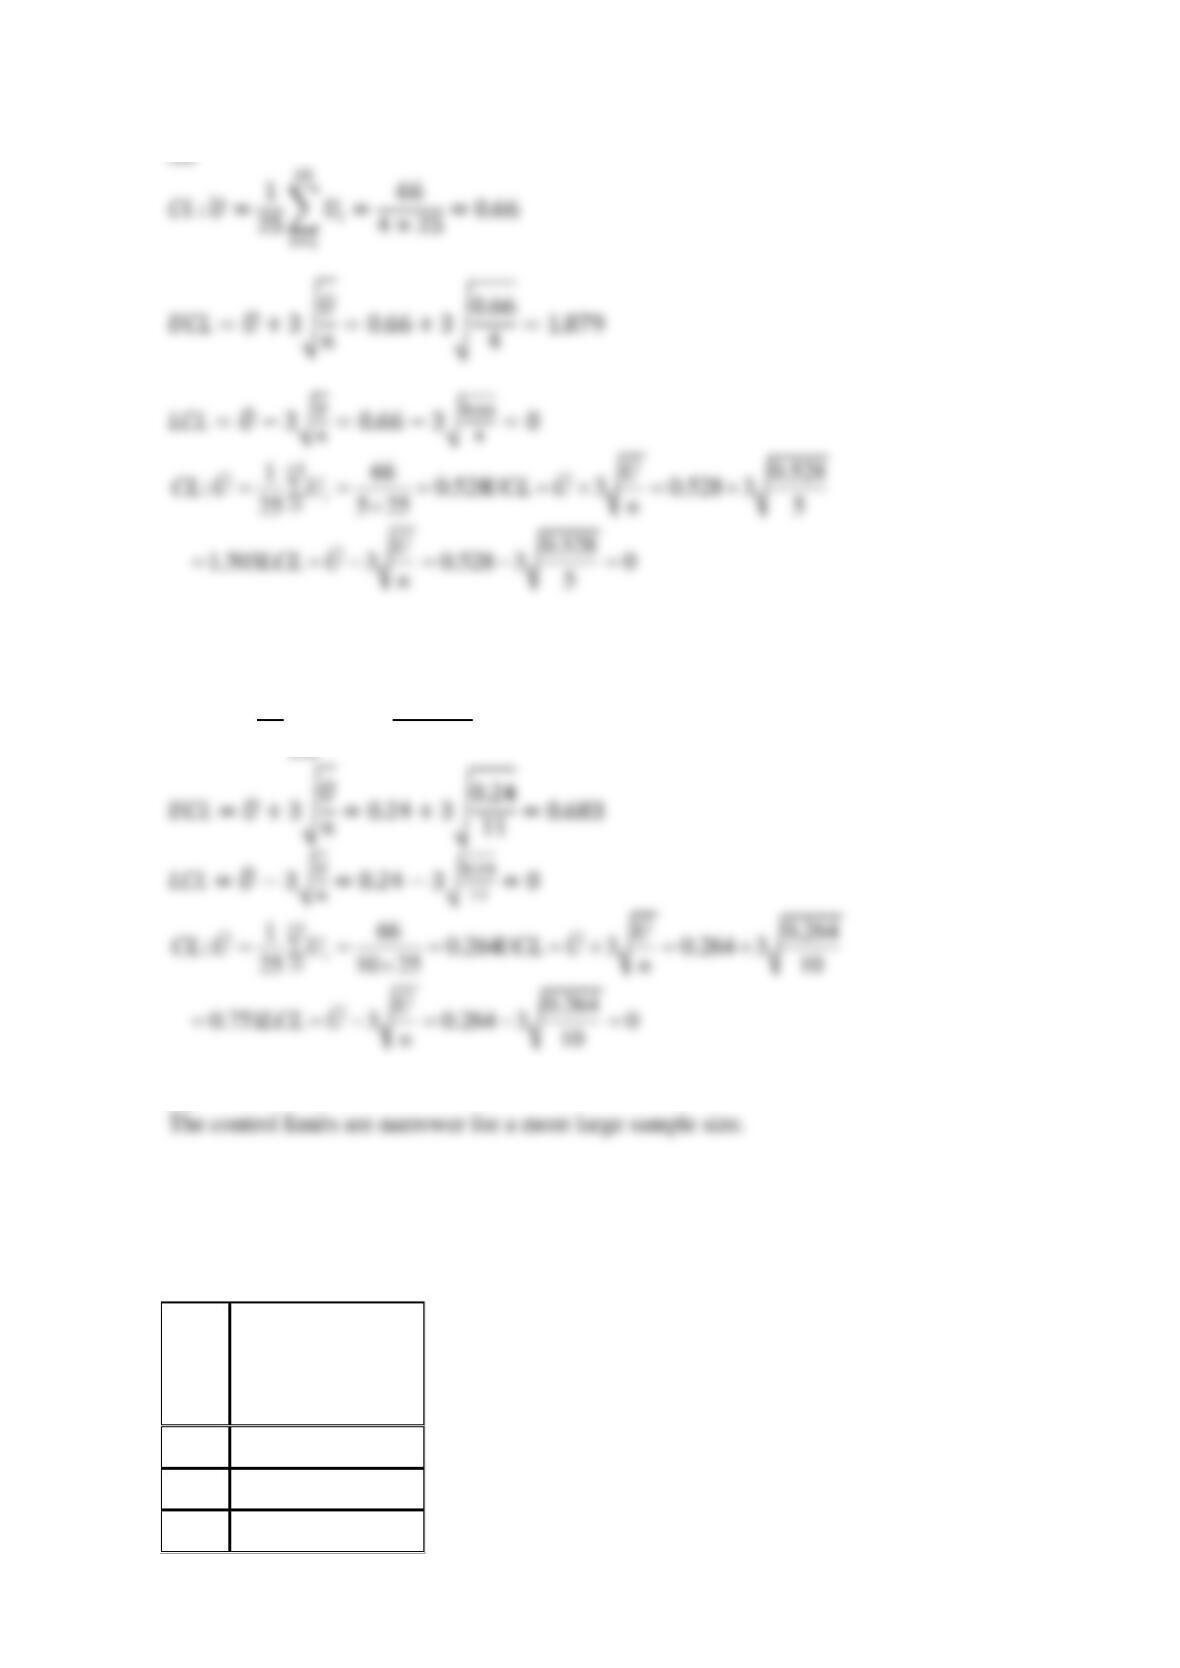
(a)
(b)
𝐶𝐿:𝑈
̄=1
25∑𝑈𝑖
25
11×25=0.24
(c)
Reserve Supplemental Exercises Chapter 15 Problem 2
The following data from the U.S. Department of Energy Web site (www.eia.doe.gov) reported
the total U.S. renewable energy consumption by year (trillion BTU) from 1973 to 2004.
Table
Total
Renewable Energy
Consumption
(Trillion BTU)
1973
4433.121
1974
4769.395
1975
4723.494

1976
4767.792
1977
4249.002
1978
5038.938
1979
5166.379
1980
5494.42
1981
5470.574
1982
5985.352
1983
6487.898
1984
6430.646
1985
6032.728
1986
6131.542
1989
6294.209
1990
6132.572
1991
6158.087
1992
5907.147
1993
6155.959
1994
6064.779
1995
6669.261
1996
7136.799
1997
7075.152
1998
6560.632
1999
6598.63
2000
6158.232
2001
5328.335
2002
5835.339
Construct an EWMA control chart with λ=0.4 and L=3.
SOLUTION
1n=

Reserve Supplemental Exercises Chapter 15 Problem 3
In a semiconductor manufacturing process, CVD metal thickness was measured on 30 wafers
obtained over approximately two weeks. Data are shown in the following table.
Wafer
x
1
16.8
2
14.9
3
18.3
4
16.5
5
17.1
6
17.4
7
15.9
8
14.4
9
15
10
15.7
11
17.1
12
15.9
13
16.4
14
15.8
15
15.4
16
15.4
17
14.3
18
16.1
19
15.8
20
15.9
21
15.2
22
16.7
23
15.2
24
14.7
25
17.9
26
14.8
27
17
28
16.2
29
15.6
30
16.3
Set up a CUSUM scheme for this process assuming that
16
=
is the process target.
Determine the estimate of
, decision interval and reference value. Use
5h=
and
1
2
k=
.
SOLUTION
Reserve Supplemental Exercises Chapter 15 Problem 4
The viscosity of a chemical intermediate is measured every hour. Twenty samples each of size n
= 1 are in the following table.
Sample
Viscosity
1
495
2
491
3
501
4
501
5
512
6
540
7
492
8
504
9
542
10
508
11
493
12
507
13
503
14
475
15
497
16
499
17
468
18
486
19
511
20
487
Set up a CUSUM control chart for this process using
0500
=
as the process target.
Determine the estimate of
, decision interval and reference value. Use ℎ=4
5h=
and
1
2
k=
.
SOLUTION
Reserve Supplemental Exercises Chapter 15 Problem 5
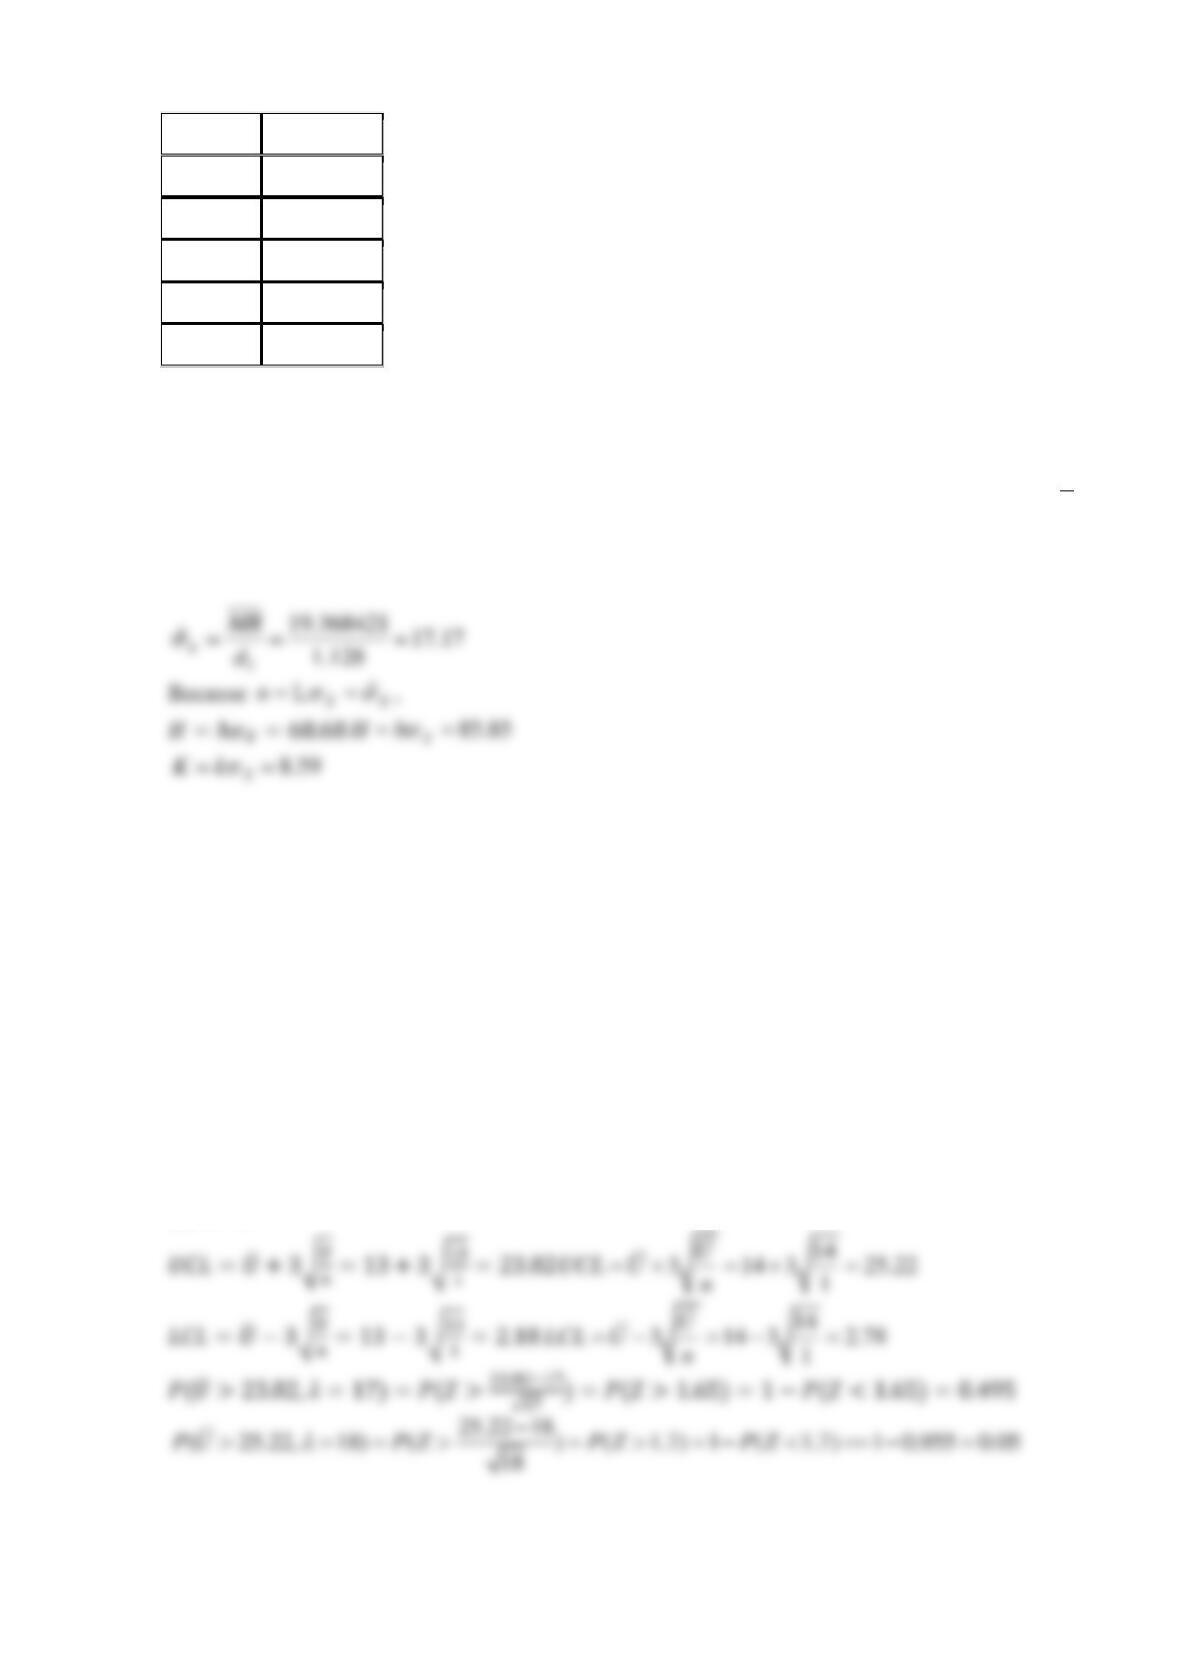
Suppose that the average number of defects in a unit is known to be 13. If the mean number of
defects in a unit shifts to 17, what is the probability that it is detected by a U chart on the first
sample following the shift
(Use a normal approximation for U)
(a) If the sample size is n = 1?
(b) If the sample size is n = 5?
SOLUTION
(a)
1n=