CHAPTER 15 RESERVE PROBLEMS
The following problems have been reserved for your use in assignments and testing and do not
appear in student versions of the text.
Reserve Problems Chapter 15 Section 3 Problem 1
Control charts are to be constructed for samples of size
5n=
, and
x
and
r
are computed for
each of 20 preliminary samples as follows:
∑
20
𝑖=1𝑥̄𝑖=1540
1
20
1620
i
i
x
=
=
∑
20
𝑖=1𝑟𝑖=141.5
1
20
160.6
i
i
r
=
=
(a) Assuming the process is in control, estimate the process mean and standard deviation.
(b) Calculate the trial control limits for the
X
chart. Calculate the trial control limits for the R
chart.
SOLUTION
(a)
(b)
X
Chart:
Reserve Problems Chapter 15 Section 3 Problem 2
An R control chart with 3-sigma control limits and subgroup size n = 4 has UCL = 39.710.
Estimate the process standard deviation.
SOLUTION
Reserve Problems Chapter 15 Section 3 Problem 3
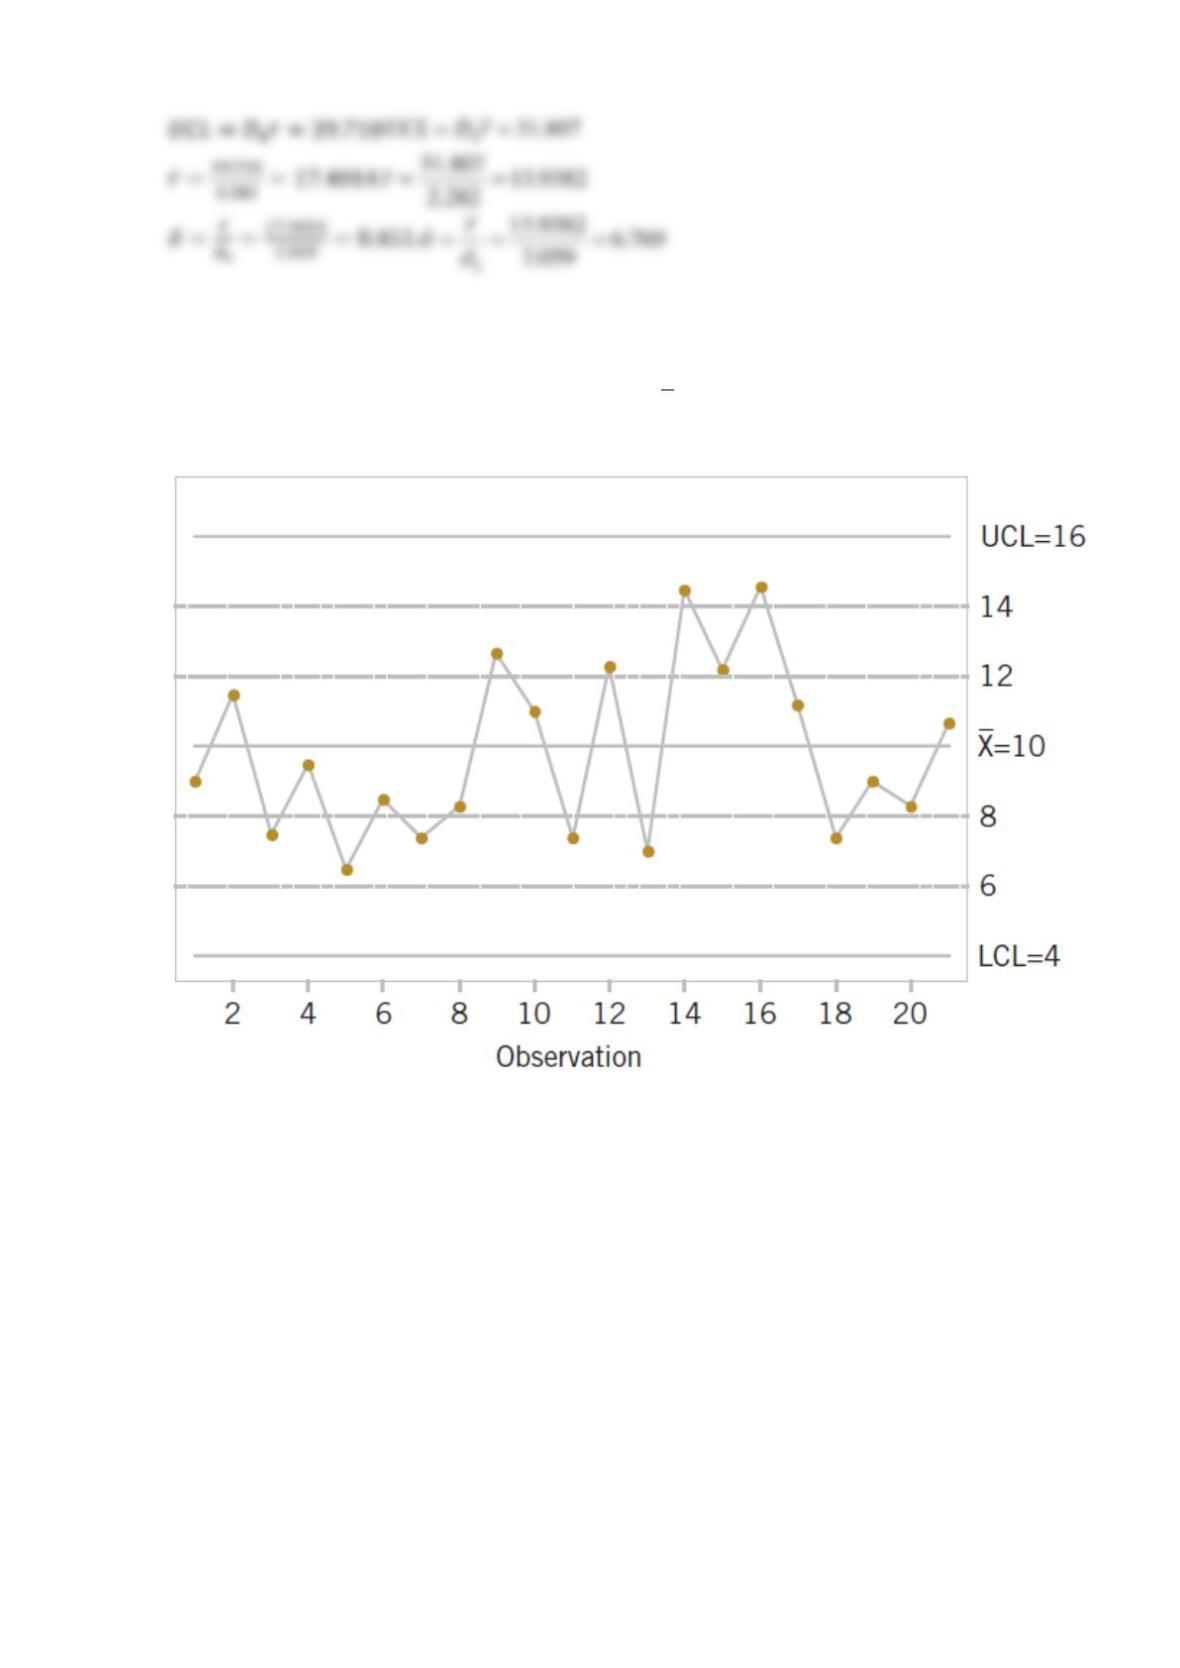
Apply the Western Electric Rules to the following
X
control chart. The warning limits are
shown as dotted lines.
Describe any rule violations.
Determine the ordinal numbers of observations that violated the rule:
1. One point plots outside 3-sigma control limits.
Determine the ordinal numbers of observations that violated the rule:
2. Two of three consecutive points plot beyond a 2-sigma limit.
Determine the ordinal numbers of observations that violated the rule:
3. Four of five consecutive points plot at a distance of 1 sigma or beyond from the center line.
Determine the ordinal numbers of observations that violated the rule:
4. Eight consecutive points plot on one side of the center line.
SOLUTION
Determine the ordinal numbers of observations that violated the rule:
1. One point plots outside 3-sigma control limits.
There are no observations, that violate this rule.
Determine the ordinal numbers of observations that violated the rule:
2. Two of three consecutive points plot beyond a 2-sigma limit.
Reserve Problems Chapter 15 Section 3 Problem 4
The following data were considered in Quality Engineering [“An SPC Case Study on Stabilizing
Syringe Lengths” (1999–2000, Vol. 12(1))]. The syringe length is measured during a
pharmaceutical manufacturing process. The following table provides data (in inches) for 20
samples each of size 5.
Sample
x1
x2
x3
x4
x5
1
4.96
4.946
4.95
4.956
4.958
2
4.958
4.927
4.935
4.94
4.95
3
4.971
4.929
4.965
4.952
4.938
4
4.94
4.982
4.97
4.953
4.96
5
4.964
4.95
4.953
4.962
4.956
6
4.969
4.951
4.955
4.966
4.954
7
4.96
4.944
4.957
4.948
4.951
8
4.969
4.949
4.963
4.952
4.962
9
4.984
4.928
4.96
4.943
4.955
10
4.97
4.934
4.961
4.94
4.965
11
4.975
4.959
4.962
4.971
4.968
12
4.945
4.977
4.95
4.969
4.954
13
4.976
4.964
4.97
4.968
4.972
14
4.97
4.954
4.964
4.959
4.968
15
4.982
4.962
4.968
4.975
4.963
16
4.961
4.943
4.95
4.949
4.957
17
4.98
4.97
4.975
4.978
4.977
18
4.975
4.968
4.971
4.969
4.972
19
4.977
4.966
4.969
4.973
4.97
20
4.975
4.967
4.969
4.972
4.972
Calculate the sample standard deviation of all 100 measurements.
Compare the result to the estimate of σ obtained from your revised
X
and R charts. Explain any
differences.
SOLUTION
0. 27
ˆ01
=
The sample standard deviation is 0.0127. It is larger than the estimate 0.0094 obtained from the
revised
X
and R chart, because the mean of the process has been shifted in the original data.
Out-of-control samples:
Reserve Problems Chapter 15 Section 4 Problem 1
Control charts are to be constructed for individuals and moving ranges, and 25 preliminary
observations provide the following data:
(a) Assuming the process is in control, estimate the process mean and standard deviation.
(b) Calculate the trial control limits for the individual range charts. Calculate the trial control
limits moving range charts.
SOLUTION
(a)
(b)
Reserve Problems Chapter 15 Section 4 Problem 2
Consider the Web traffic data given in table below.
Sample
1
x
2
x
3
x
4
x
5
x
1
4.960
4.946
4.950
4.956
4.958
2
4.958
4.927
4.935
4.940
4.950
3
4.971
4.929
4.965
4.952
4.938
4
4.940
4.982
4.970
4.953
4.960
5
4.964
4.950
4.953
4.962
4.956
6
4.969
4.951
4.955
4.966
4.954
7
4.960
4.944
4.957
4.948
4.951
8
4.969
4.949
4.963
4.952
4.962
9
4.984
4.928
4.960
4.943
4.955
10
4.970
4.934
4.961
4.940
4.965
11
4.975
4.959
4.962
4.971
4.968
12
4.945
4.977
4.950
4.969
4.954
13
4.976
4.964
4.970
4.968
4.972
14
4.970
4.954
4.964
4.959
4.968
15
4.982
4.962
4.968
4.975
4.963
16
4.961
4.943
4.950
4.949
4.957
17
4.980
4.970
4.975
4.978
4.977
18
4.975
4.968
4.971
4.969
4.972
19
4.977
4.966
4.969
4.973
4.970
20
4.975
4.967
4.969
4.972
4.972
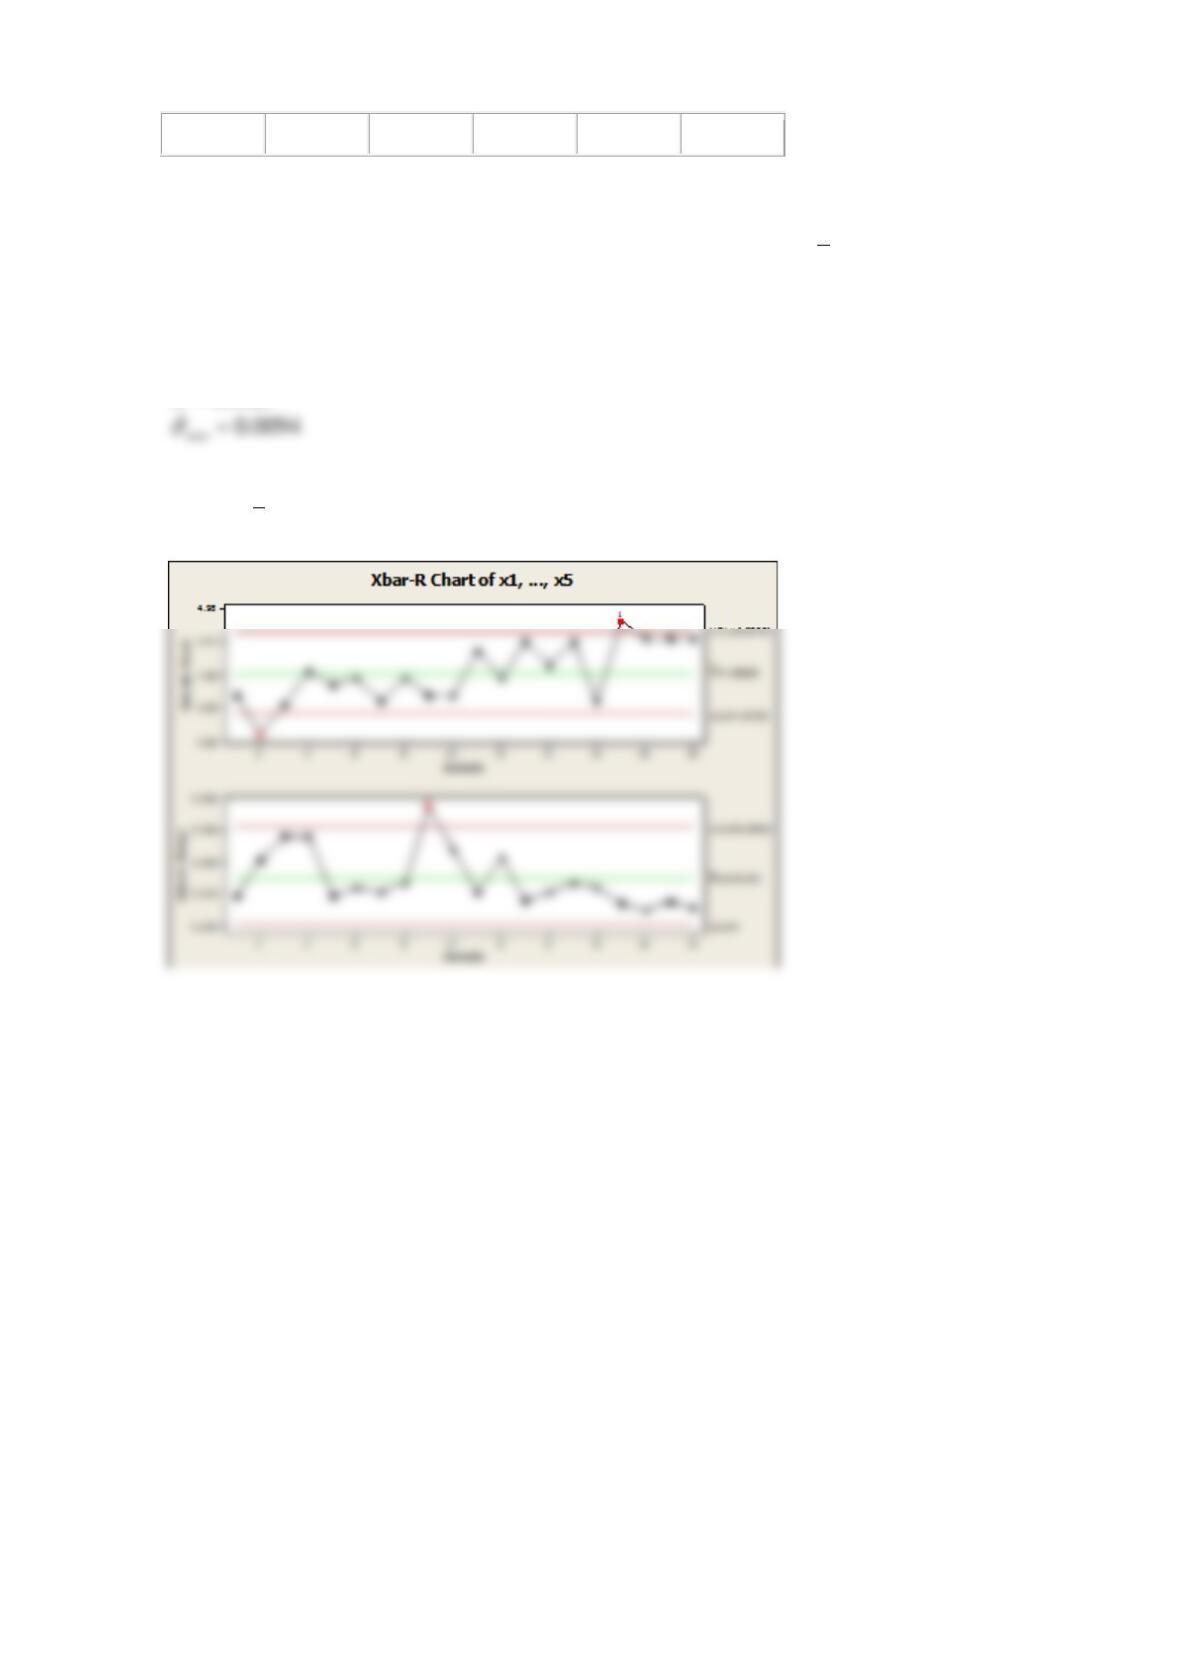
(a) Use only the data from variable
1
x
to construct individuals and moving range charts.
(b) Compare the estimates of
ˆ
and
ˆ
obtained from the charts in part (a) to those from the
X
and R charts.
Estimates from charts in (a).
Estimates from the
X
and R charts:
(c) Compare the control limits for the individuals chart to the
X
chart.
Control limits for the
X
chart.
SOLUTION
(a)
Individuals control chart:
(b)
X
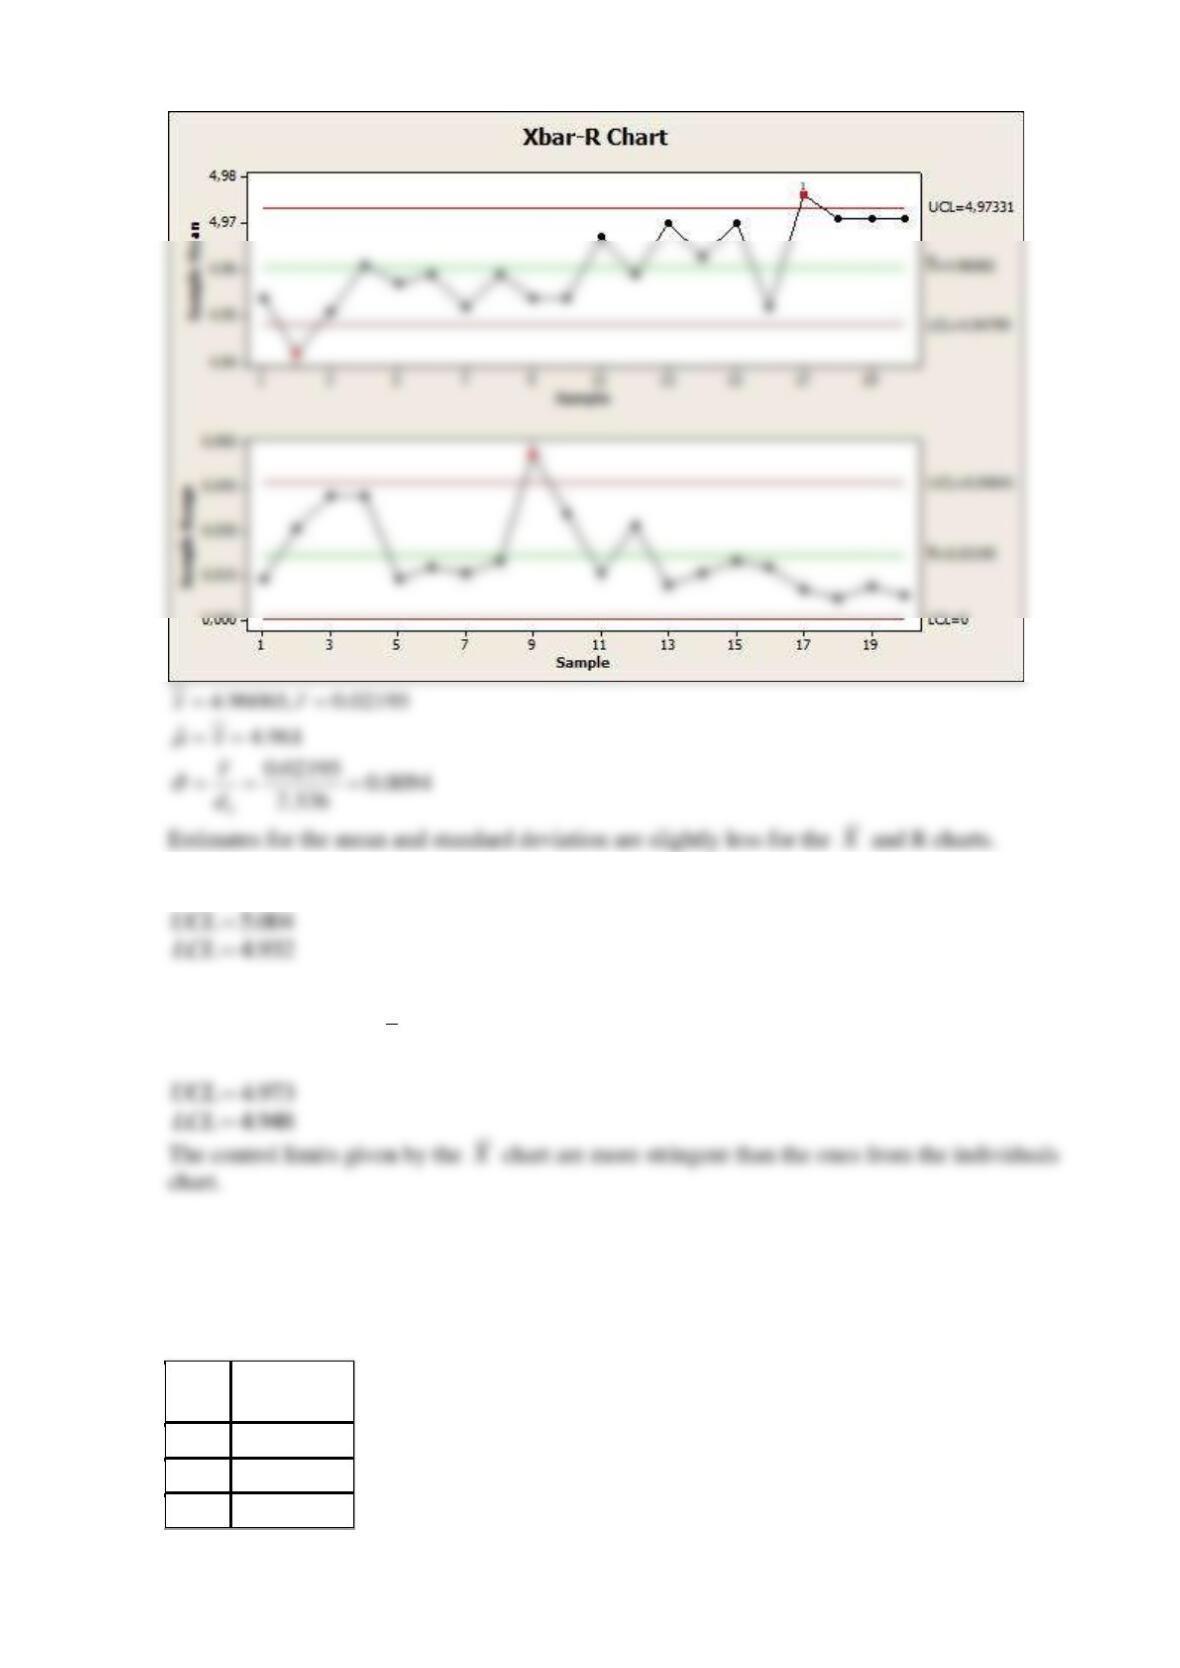
(c)
Control limits for the individuals chart:
Control limits for the
X
chart:
Reserve Problems Chapter 15 Section 4 Problem 3
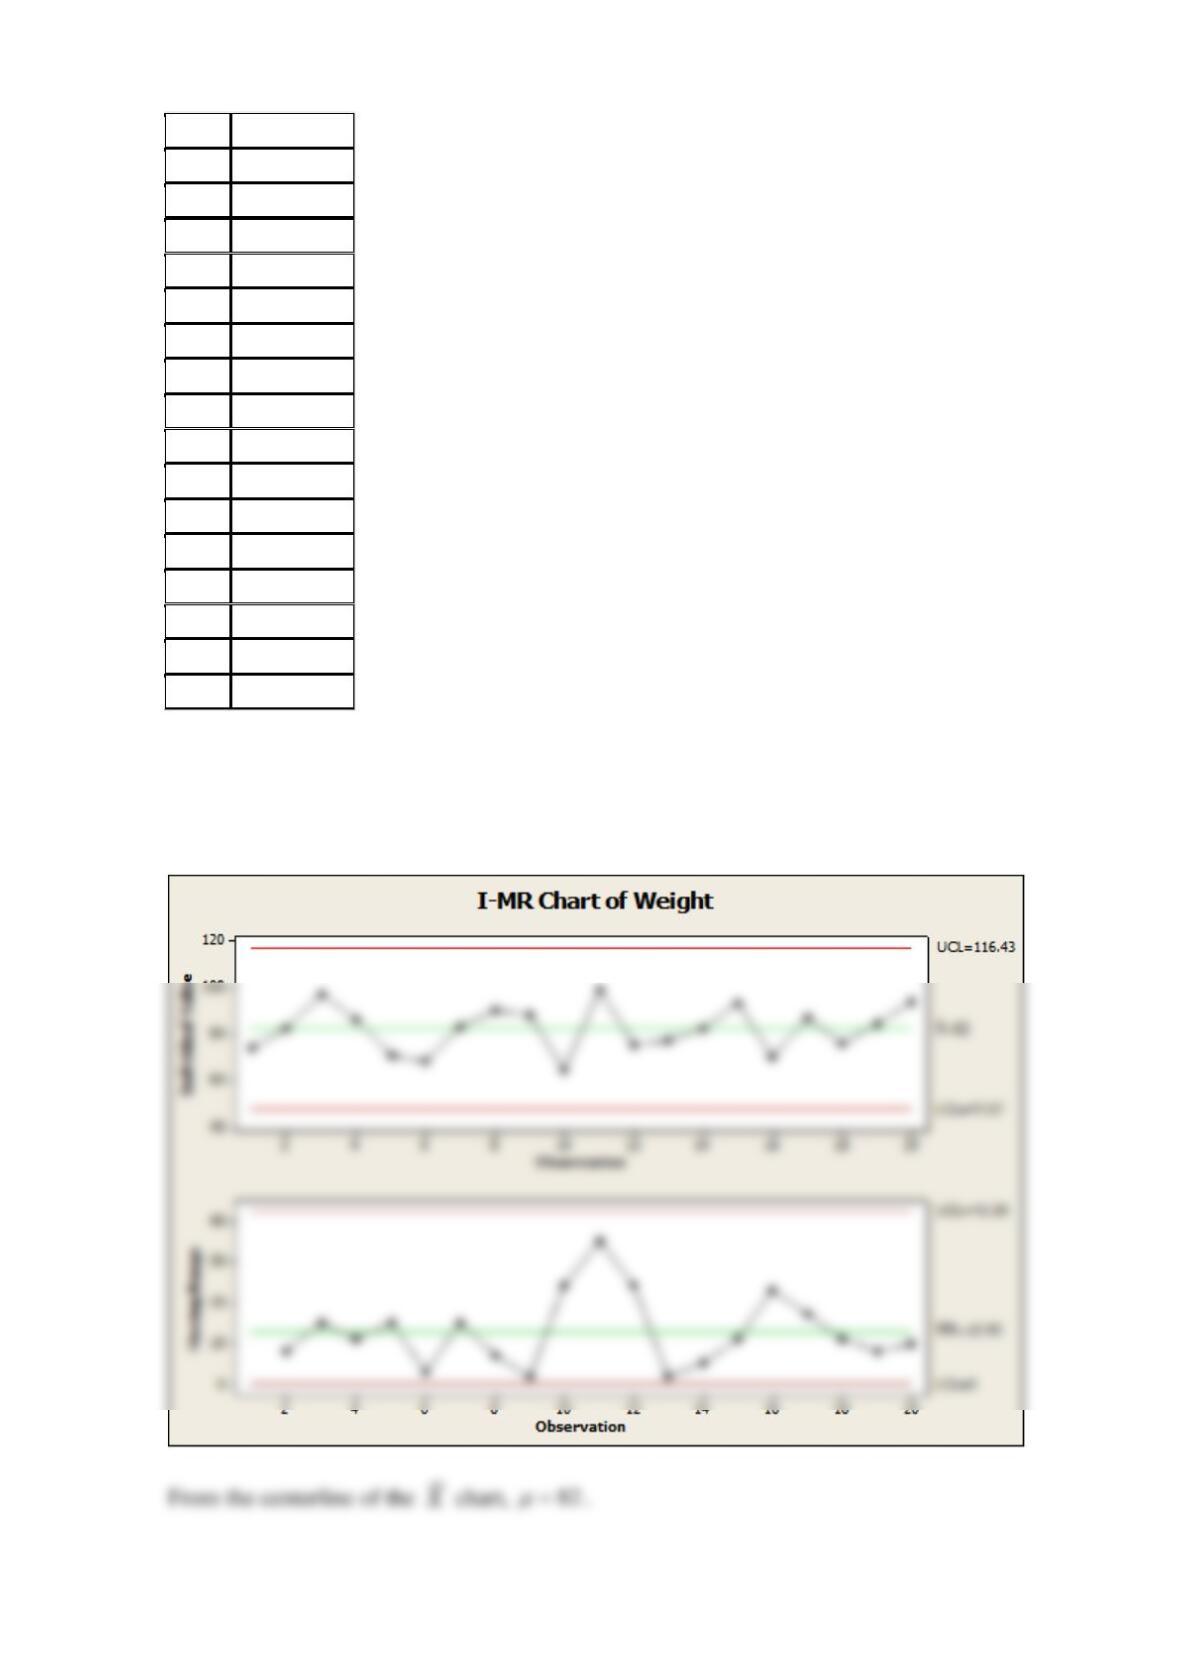
The production manager of a soap manufacturing company wants to monitor the weights of the
bars produced on the line. Twenty bars are taken during a stable period of the process.
The weights of the bars are shown in the following table.
Bar
Weight
(g)
1
74
2
82
3
97
4
86
5
71
6
68
7
83
8
90
9
88
10
64
11
99
12
75
13
77
14
82
15
93
16
70
17
87
18
76
19
84
20
94
Estimate the process mean and standard deviation for the in-control process.
SOLUTION
Reserve Problems Chapter 15 Section 5 Problem 1
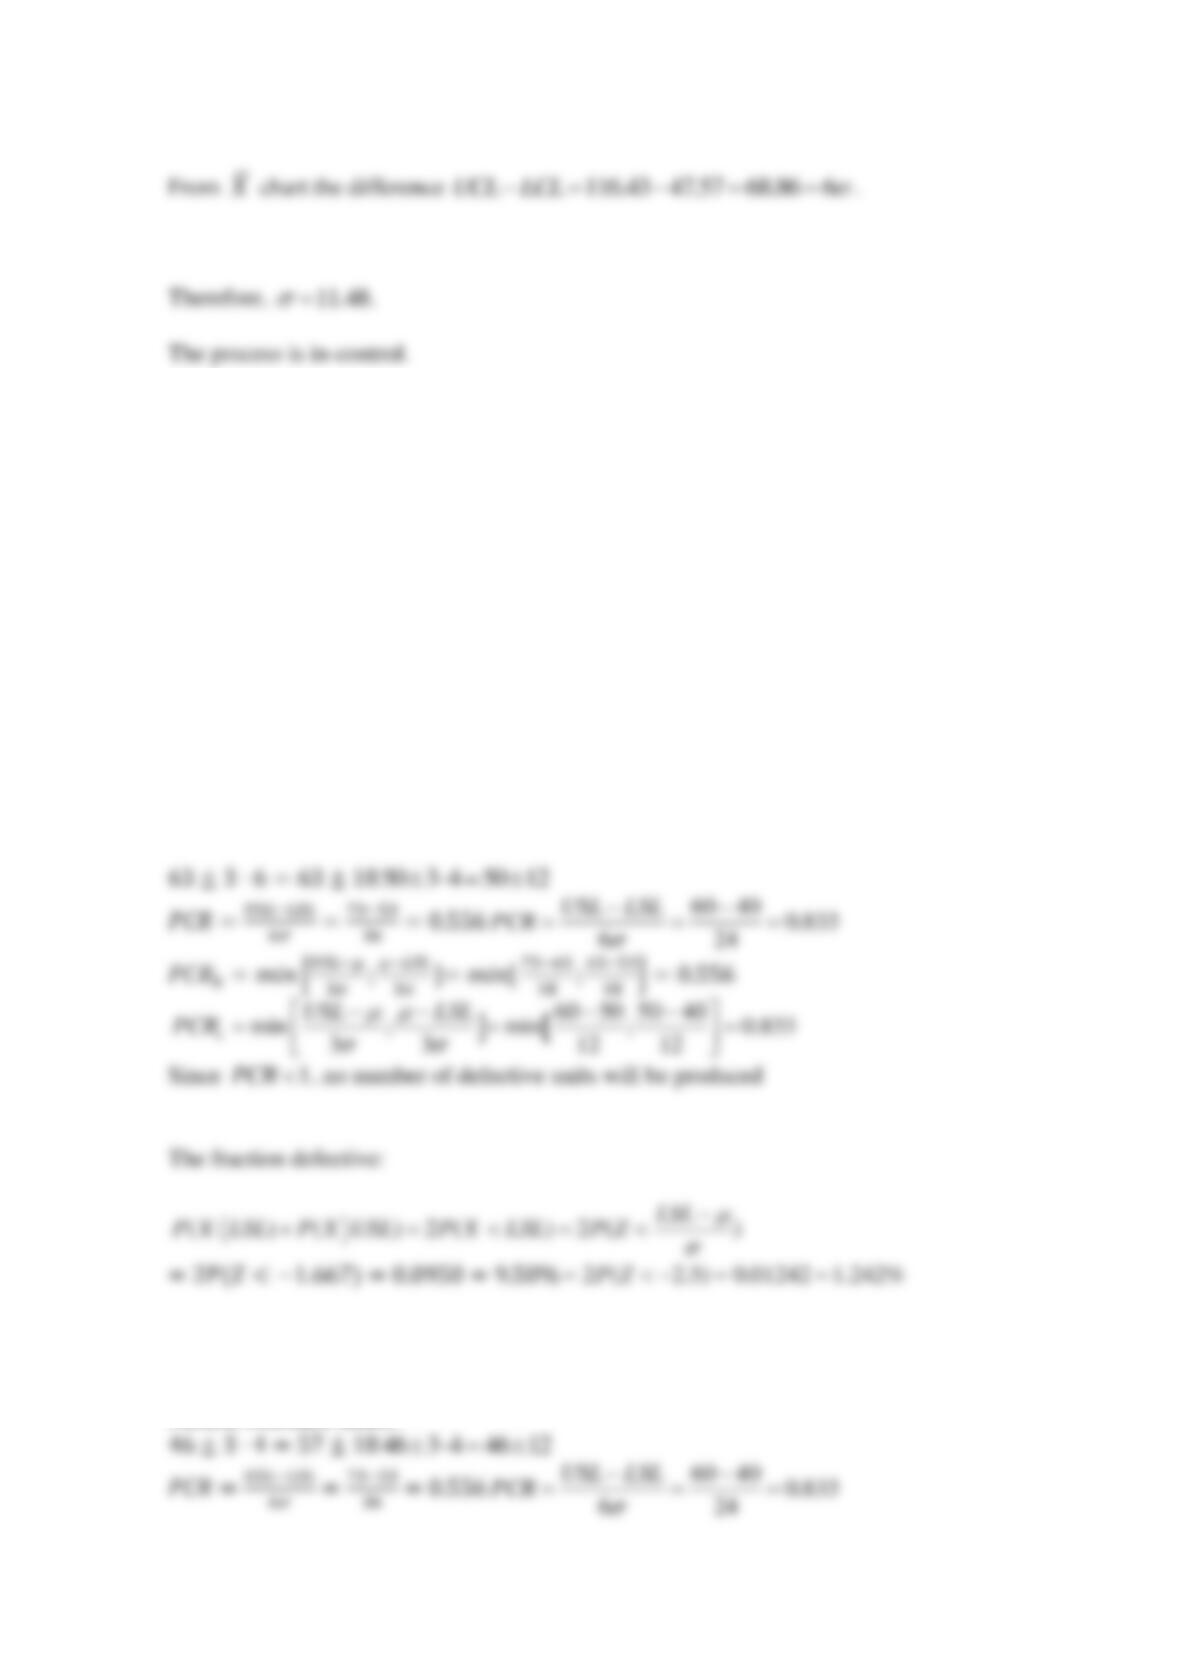
Suppose that a quality characteristic is normally distributed with specifications at 63±10
50 10
and the process standard deviation is 6.
(a) Suppose that the process mean is 63. What are the natural tolerance limits? What is the
fraction defective? Calculate PCR and PCRk and interpret these ratios.
(b) Suppose that the process mean is 57. What are the natural tolerance limits? What is the
fraction defective? Calculate PCR and PCRk and interpret these ratios.
SOLUTION
(a)
Natural tolerance limits:
(b)
Natural tolerance limits:
The fraction defective:
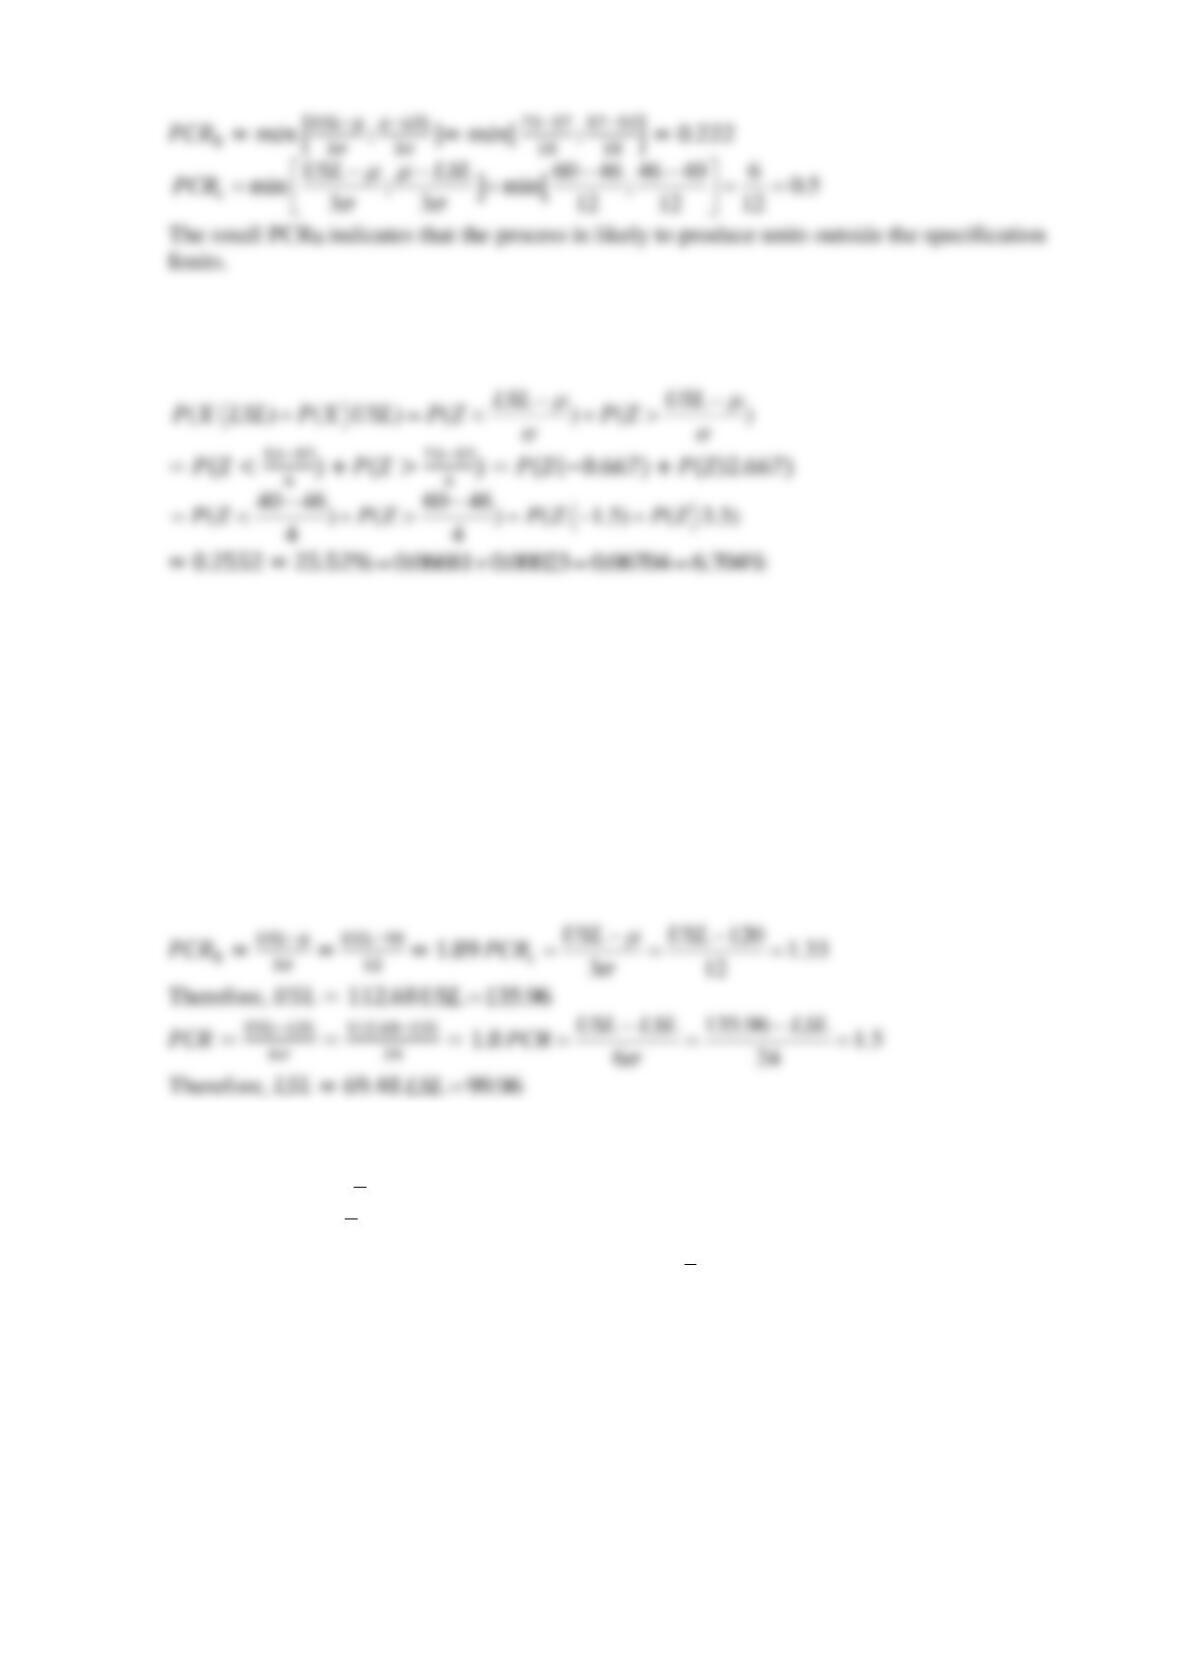
Reserve Problems Chapter 15 Section 5 Problem 2
Suppose that a process has 𝑃𝐶𝑅 = 1.8
1.5PCR =
and 𝑃𝐶𝑅𝑘=1.89
1.33
k
PCR =
with 𝜇 = 90
120
=
and
4
=
and the upper specification limit is nearest to the mean. Calculate the
specification limits.
SOLUTION
Since the upper specification limit is nearest to the mean
Reserve Problems Chapter 15 Section 5 Problem 3
Control charts for
X
and R are to be set up for an important quality characteristic. The sample
size is
5n=
, and
x
and r are computed for each of 𝑚 = 38
35m=
preliminary samples. The
summary data are ∑𝑥𝑖
38
𝑖=1 =8474,∑𝑟𝑖
38
𝑖=1 =1303,
11
35 35
7805, 1200,
ii
ii
xr
==
= =
.
Suppose that the quality characteristic is normally distributed with specification at 220 ± 40.
What is the fallout level? Estimate PCR and PCRk.
SOLUTION
Reserve Problems Chapter 15 Section 5 Problem 4
An extrusion die is used to produce aluminum rods. The diameter of the rods is a critical quality
characteristic. The following table shows
x
and r values for 20 samples of five rods each.
Specifications on the rods are 0.5035 ± 0.0010 inch. The values given are the last three digits of
the measurement; that is 34.2 is read 0.50342.
Sample
x
r
1
34.1
4
2
31.6
4
3
31.8
4
4
33.4
5
5
35.0
4
6
32.1
2
7
32.6
7
8
33.8
9
9
34.8
10
10
38.6
4
11
35.4
8
12
34.0
6
13
36.0
4
14
37.2
7
15
35.2
3
16
33.4
10
17
35.0
4
18
34.4
7
19
33.9
8
20
34.0
4
(a) Estimate PCR and PCRk.
(b) What percentage of defectives is being produced by this process?
SOLUTION
Reserve Problems Chapter 15 Section 5 Problem 5
The pull strength of a wire-bonded lead for an integrated circuit is monitored. The following
table provides data for 20 samples each of size three.
(a) Estimate the fallout level if the specifications are 16 ± 5.
(b) Estimate PCR and interpret this ratio.
Sample Number
x1
x2
x3
1
15.5
15.6
15.2
2
15.5
17.1
15.3
3
16.1
16.1
13.5
4
13.5
12.5
10.2
5
18.3
16.1
17.0
6
19.2
17.2
19.4
7
14.1
12.4
11.7
8
15.6
13.3
13.6
9
13.9
14.9
15.5
10
18.7
21.2
20.1
11
15.3
13.1
13.7
12
16.6
18.0
18.0
13
17.0
15.2
18.1
14
16.3
16.5
17.7
15
8.4
7.7
8.4
16
11.1
13.8
11.9
17
16.5
17.1
18.5
18
18.0
14.1
15.9
19
17.8
17.3
12.0
20
11.5
10.8
11.2
SOLUTION
Reserve Problems Chapter 15 Section 5 Problem 6
The following data were considered in Quality Engineering [“An SPC Case Study on Stabilizing
Syringe Lengths” (1999–2000, Vol. 12(1))]. The syringe length is measured during a
pharmaceutical manufacturing process. The following table provides data (in inches) for 20
samples each of size 5.
Suppose that the specifications are set at 4.90 and 5.00.
Sample
x1
x2
x3
x4
x5
1
4.96
4.946
4.95
4.956
4.958
2
4.958
4.927
4.935
4.94
4.95
3
4.971
4.929
4.965
4.952
4.938
4
4.94
4.982
4.97
4.953
4.96
5
4.964
4.95
4.953
4.962
4.956
6
4.969
4.951
4.955
4.966
4.954
7
4.96
4.944
4.957
4.948
4.951
8
4.969
4.949
4.963
4.952
4.962
9
4.984
4.928
4.96
4.943
4.955
10
4.97
4.934
4.961
4.94
4.965
11
4.975
4.959
4.962
4.971
4.968
12
4.945
4.977
4.95
4.969
4.954
13
4.976
4.964
4.97
4.968
4.972
14
4.97
4.954
4.964
4.959
4.968
15
4.982
4.962
4.968
4.975
4.963
16
4.961
4.943
4.95
4.949
4.957
17
4.98
4.97
4.975
4.978
4.977
18
4.975
4.968
4.971
4.969
4.972
19
4.977
4.966
4.969
4.973
4.97
20
4.975
4.967
4.969
4.972
4.972
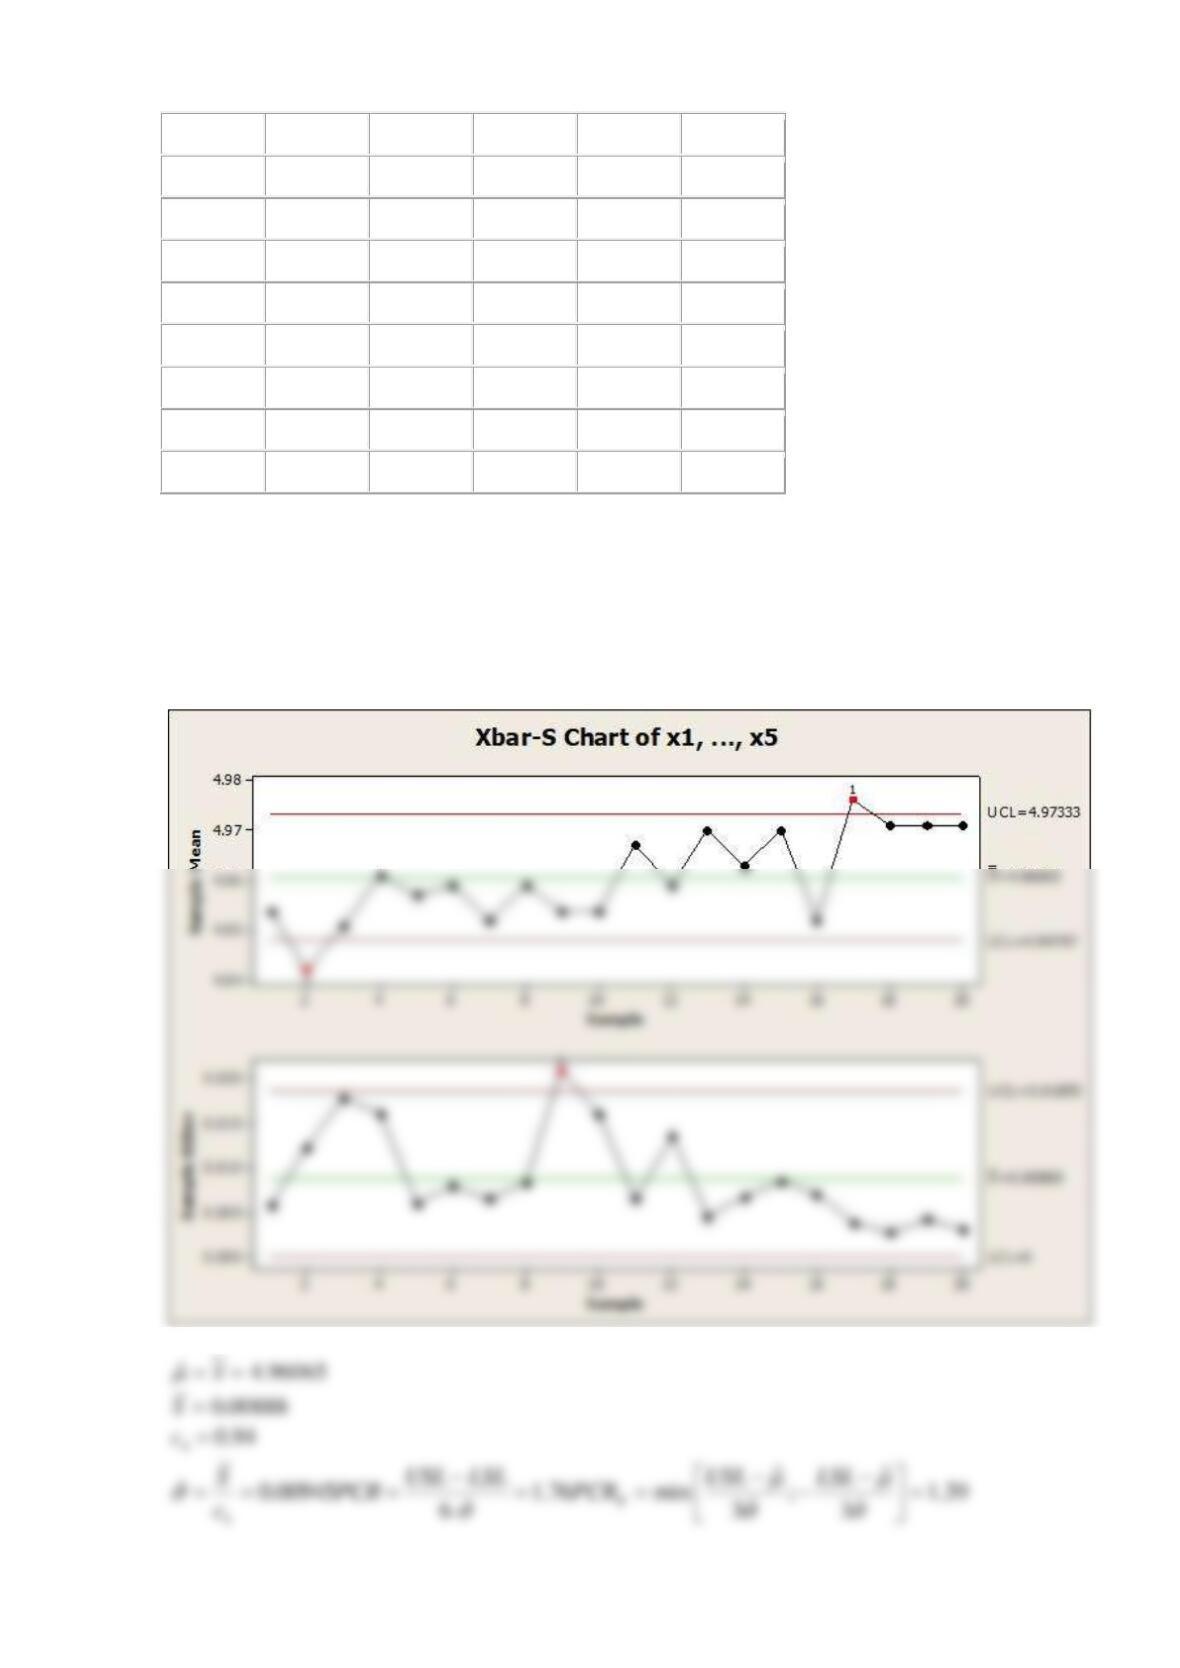
(a) Estimate the process standard deviation from S Chart.
(b) Calculate PCR and PCRk for the process.
SOLUTION
Reserve Problems Chapter 15 Section 5 Problem 7
Twenty successive hardness measurements are made on a metal alloy, and the data are shown in
the following table.
Suppose that the specifications are 45 to 60.
Observation
Number
Hardness
1
51
2
52
3
54
4
55
5
55
6
51
7
52
8
50
9
51
10
56
11
51
12
57
13
58
14
50
15
53
16
52
17
54
18
50
19
56
20
53
(a) Estimate the process standard deviation.
(b) Calculate PCR and PCRk for the process.
SOLUTION
Reserve Problems Chapter 15 Section 5 Problem 8
Suppose that a quality characteristic is normally distributed with specifications at 135 ±17.
Natural tolerance limits for the process are 135 ± 15.
(a) Calculate the process standard deviation.
(b) Calculate PCR and PCRk of the process.
(c) Calculate the percentage of the specification width used by the process.
(d) What fallout level (fraction defective) is produced?
SOLUTION
(a)
(b)
(c)
The process width = 15 and the specification width = 17. The percentage of the specification
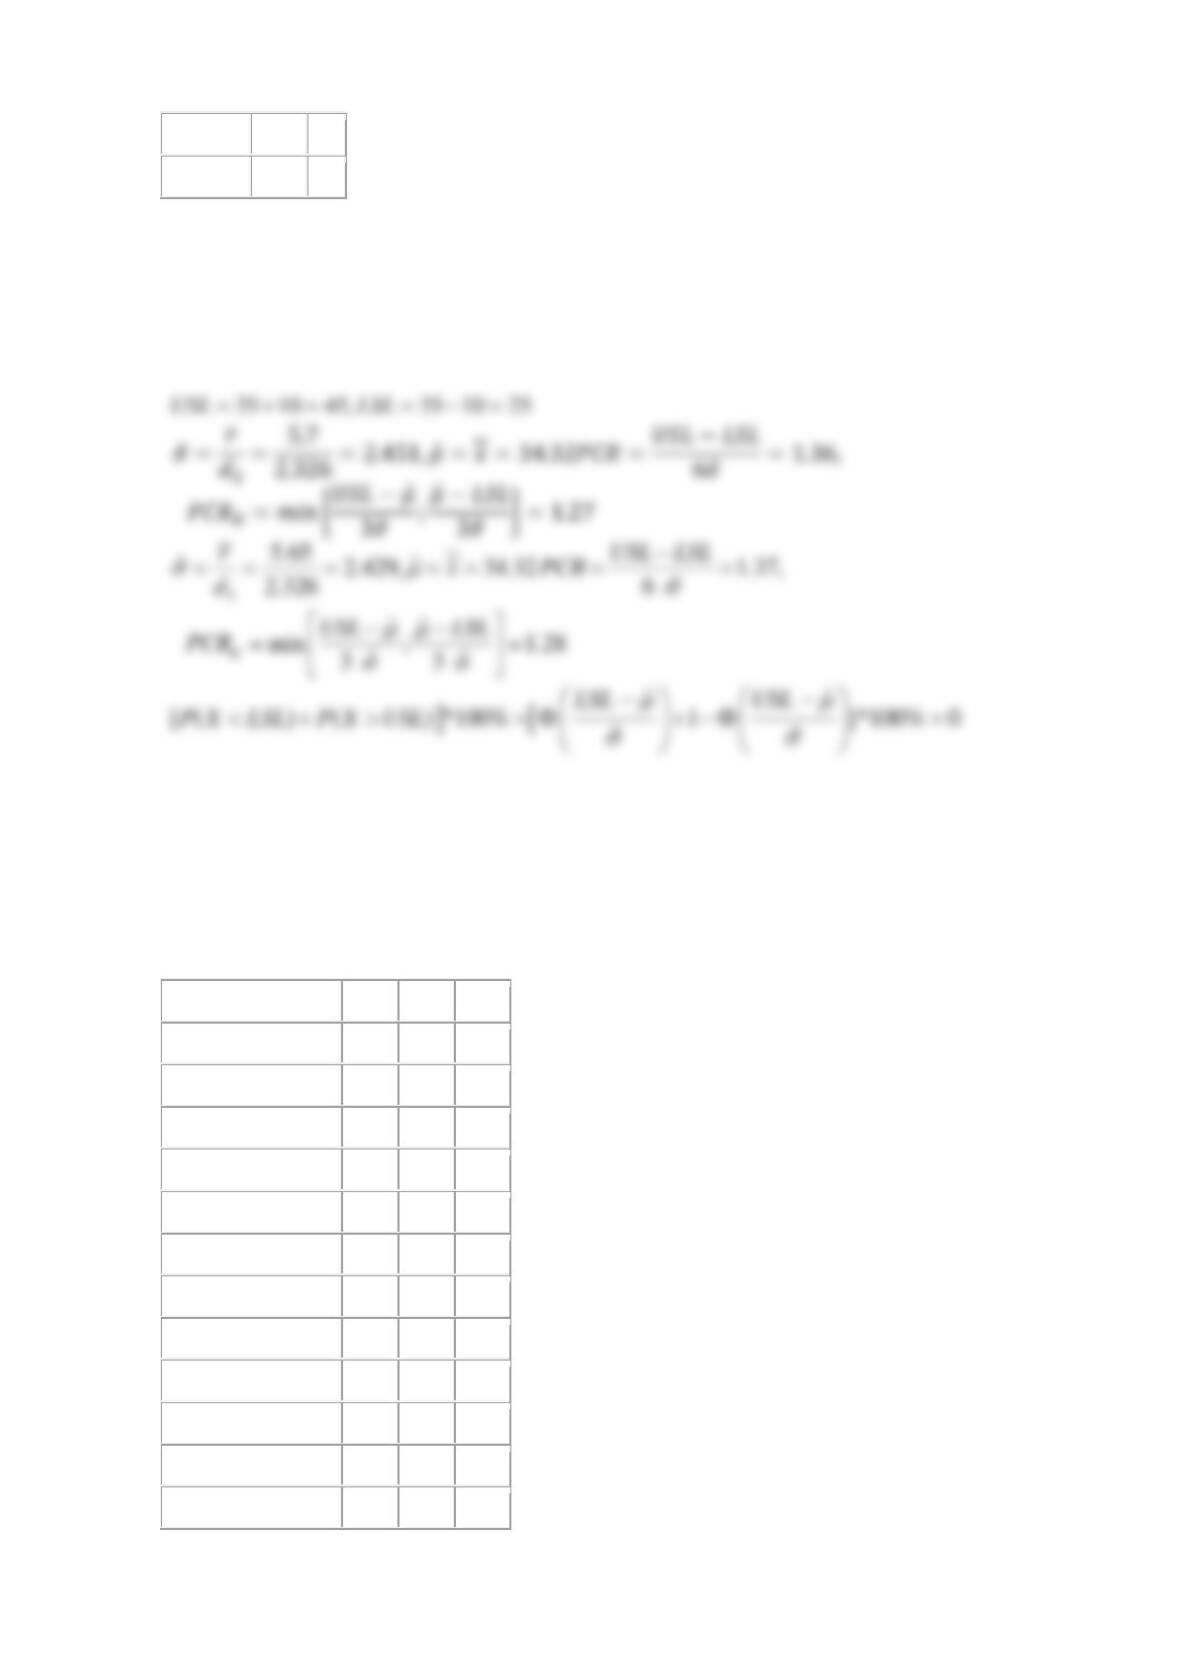
Reserve Problems Chapter 15 Section 5 Problem 9
An
X
control chart with 3-sigma control limits and subgroup size n = 4 has control limits UCL
= 27.7 and LCL = 22.9. The process specification limits are (24, 32).
(a) Estimate the process standard deviation.
(b) Calculate PCR and PCRk for the process.
SOLUTION
(a)
Reserve Problems Chapter 15 Section 5 Problem 10
An
X
control chart with 3-sigma control limits and subgroup size n = 4 has control limits UCL
= 1.7494 and LCL = 1.67056. The process specification limits are (1.64, 1.84).
(a) Estimate the process standard deviation.
(b) Calculate PCR and PCRk for the process.
SOLUTION
(a)
Reserve Problems Chapter 15 Section 6 Problem 1
A P chart is to be constructed, and 27 preliminary samples each of size 50 contain a total of 360
defective units. Calculate 3-sigma control limits for this P chart.
SOLUTION
𝑚 = 27
25m=
,
50n=
, ∑𝐷𝑖
27
𝑖=1 =360
1
25
400
i
i
D
=
=
Reserve Problems Chapter 15 Section 6 Problem 2
A U chart is to be constructed, and 24 preliminary samples each of size 4 contain a total of 134
defects. Calculate 3-sigma control limits for this U chart.
SOLUTION
𝑚 = 24
25m=
, 𝑛 = 4
5n=
, ∑𝐷𝑖
24
𝑖=1 =134
1
25
125
i
i
D
=
=
Reserve Problems Chapter 15 Section 6 Problem 3
In a semiconductor manufacturing company, samples of 200 wafers are tested for defectives in
the lot. See the number of defectives in 20 such samples in the following table.
Sample
No. of
Defectives
1
44
2
63
3
40
4
35
5
29
6
43
7
40
8
38
9
74
10
66
11
65
12
74
13
43
14
50
15
60
16
38
17
36
18
65
19
41
20
95
(a) Set up a P chart for this process.
(b) Suppose that instead of samples of size 200, we have samples of size 100. Set up a P chart for
this process.
SOLUTION
(a)
(b)
Don’t omit the out-of-control points.
Reserve Problems Chapter 15 Section 7 Problem 1
Consider a 3-sigma
X
control chart for a process with 𝜇 = 98
100
=
and 𝜎 =7
6
=
.
Suppose that the ARL after a mean shift to 104 should be less than or equal to 10. What is the
minimum subgroup size needed?
SOLUTION
110ARL p
=
,
0.1p
Reserve Problems Chapter 15 Section 7 Problem 2
Consider a 3-sigma
X
control chart for a process with 𝜇 = 41
40
=
and
5
=
. Suppose that
the ARL after a mean shift to 45 in the next sample should be at least 0,9. What is the minimum
subgroup size needed?
SOLUTION
0.9p
𝑃(𝐿𝐶𝐿 < 𝑋
̄⟨𝑈𝐶𝐿|𝜇 = 45) ≤ 0.1
( 44) 0.1P LCL X UCL
=