Reserve Supplemental Exercises Chapter 15 Problem 6
An EWMA chart with
0.5
=
and
3.07L=
is to be used to monitor a process. Suppose that the
process mean is
010
=
and
2
=
. Consider the following table:
Shift in Mean
(multiple of
X
)
0.5
=
3.07L=
0.1
=
2.81L=
0
500
500
0.25
255
106
0.5
88.8
31.3
0.75
35.9
15.9
1
17.5
10.3
1.5
6.53
6.09
2
3.63
4.36
3
1.93
2.87
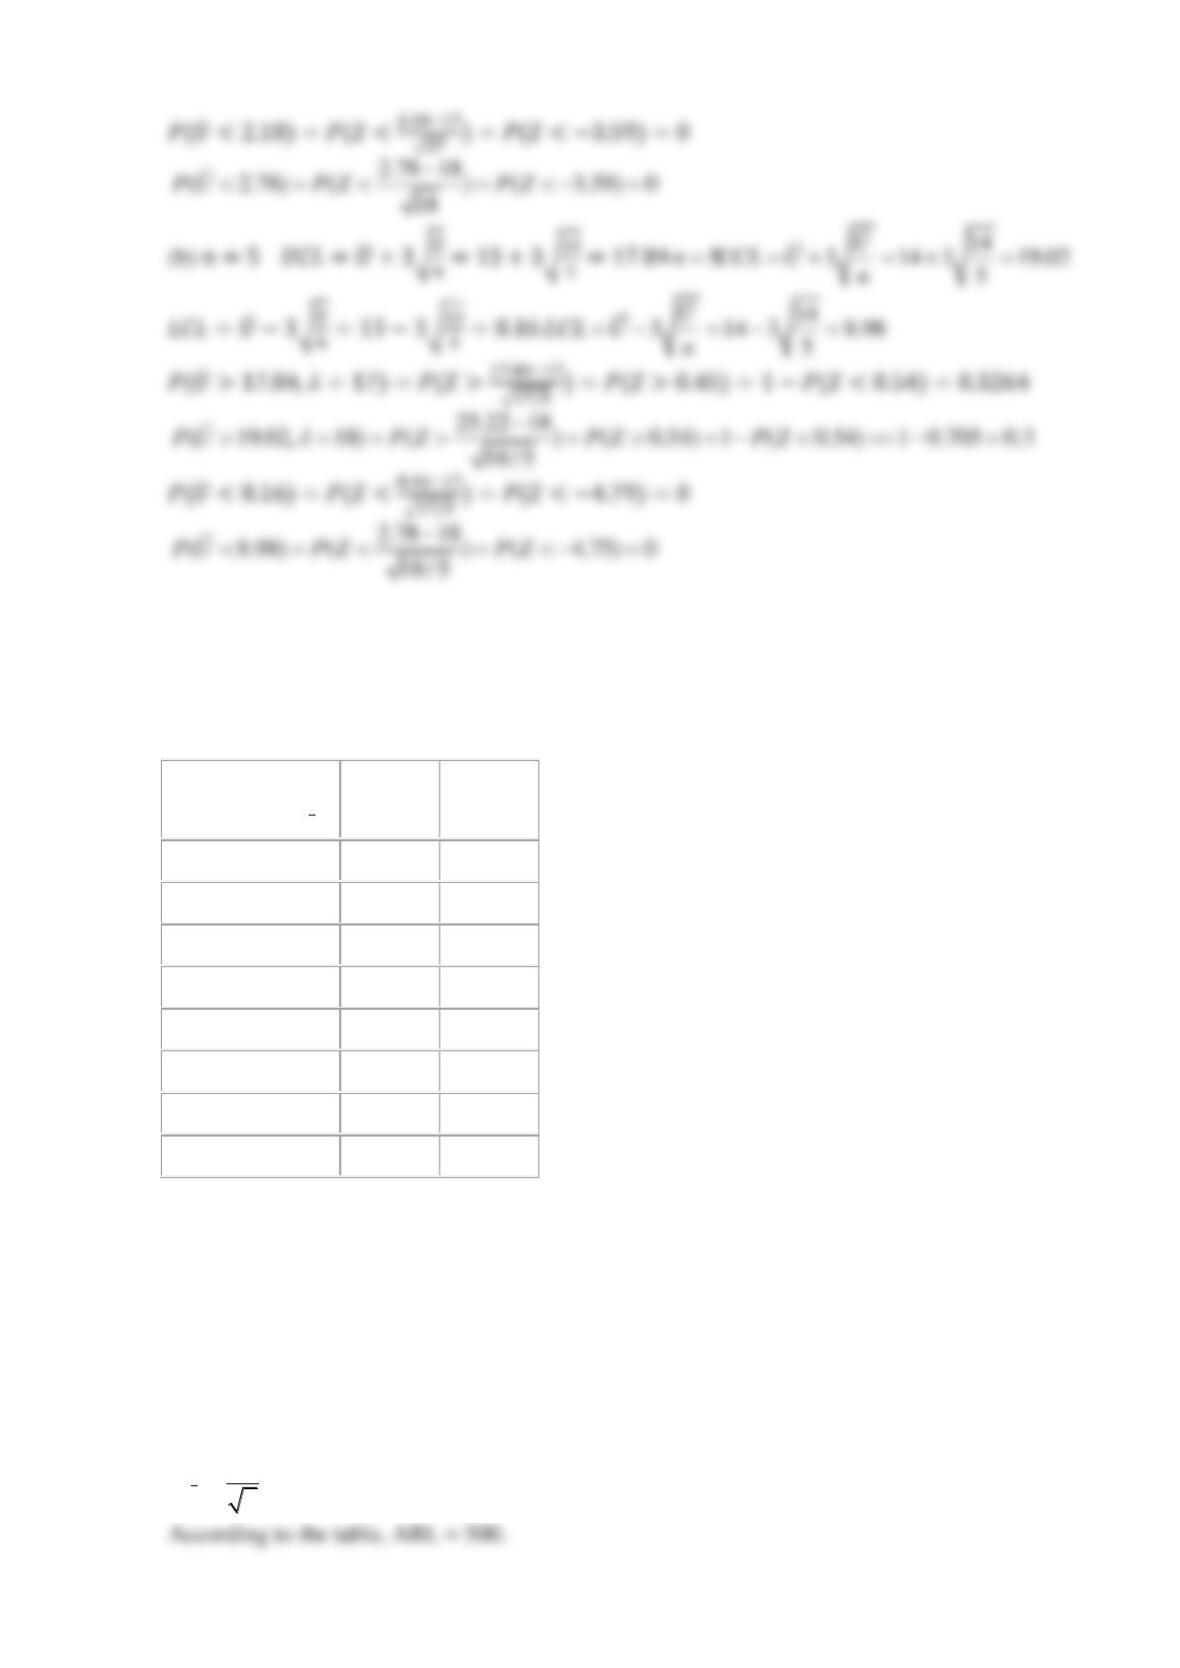
(a) Assume that n = 1. What is the ARL without any shift in the process mean?
What is the ARL to detect a shift to μ = 12?
(b) Assume that n = 4. What is the ARL without any shift in the process mean?
What is the ARL to detect a shift to μ = 12?
SOLUTION
(a)
2
Xn
==
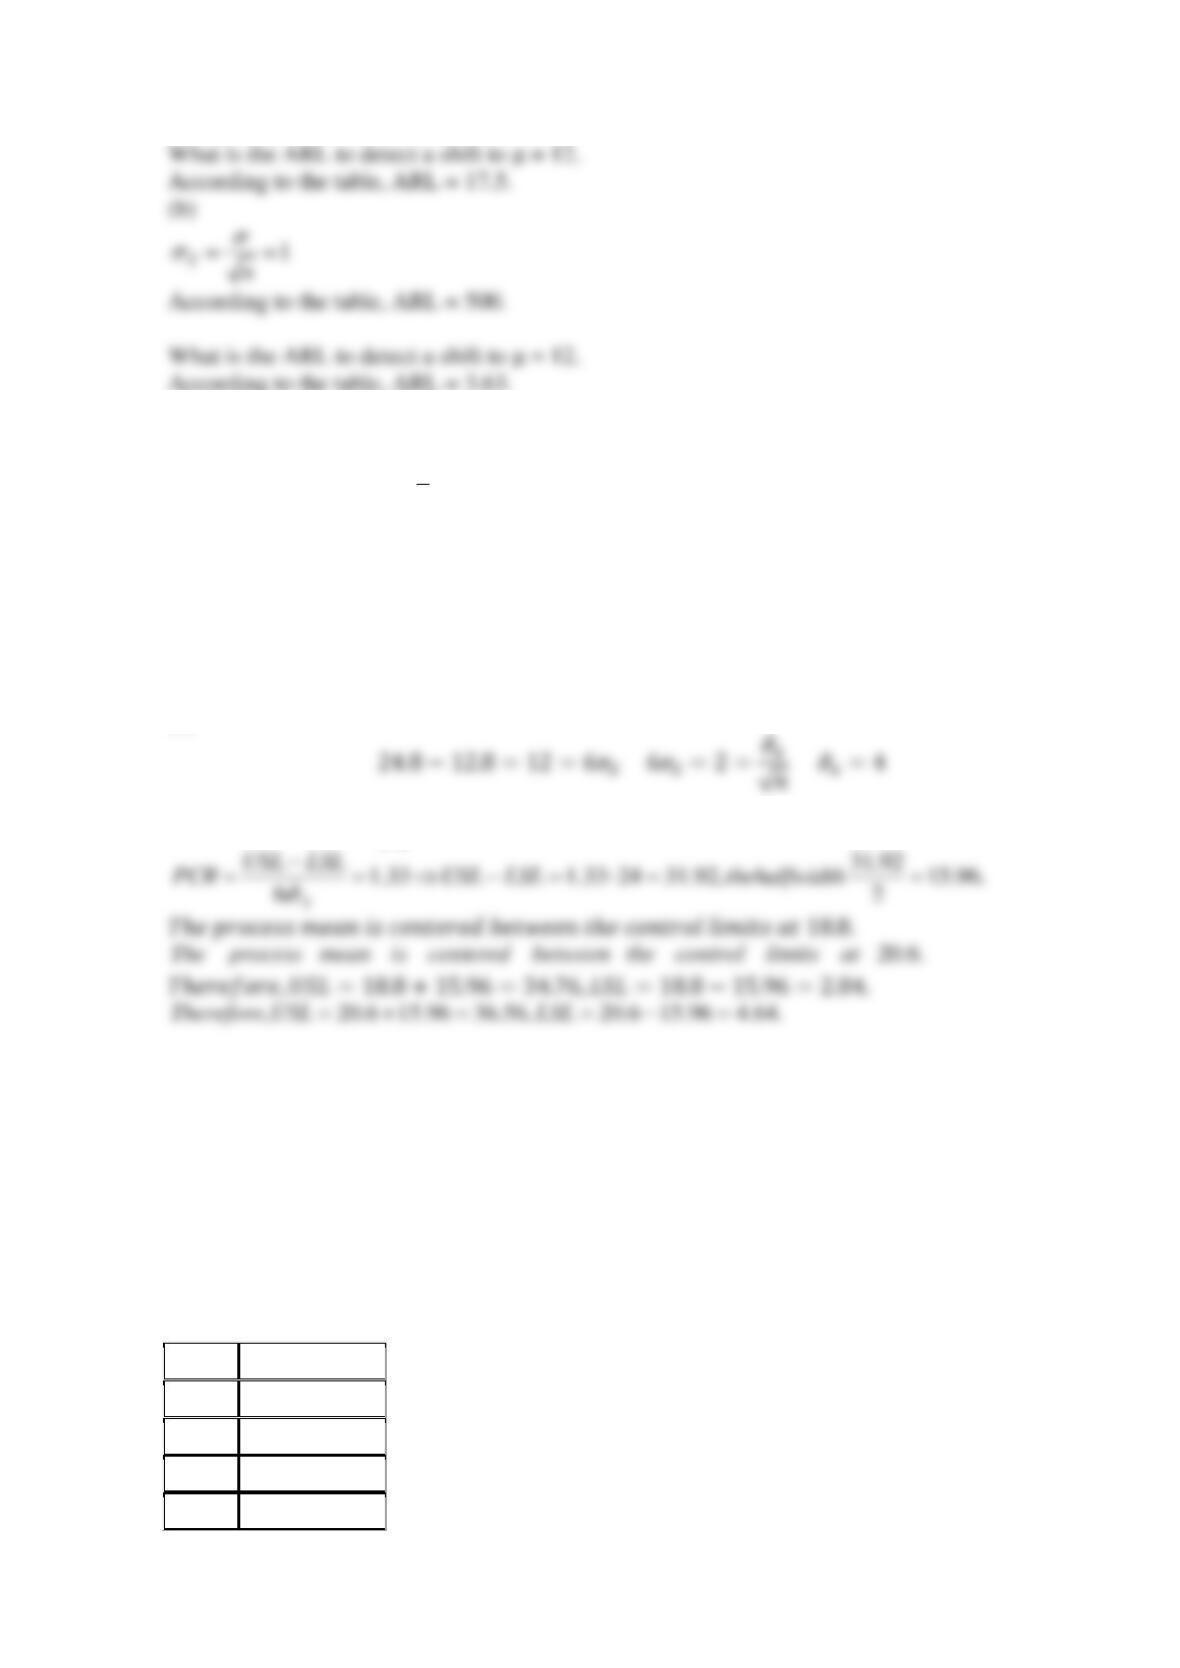
Reserve Supplemental Exercises Chapter 15 Problem 7
The control limits for an
X
chart with n = 4 are 12.8 and 24.8, and the PCR for a measurement
is 1.33.
(a) Estimate the process standard deviation
.
(b) Calculate the specification limits. Assume that they are centered around the process mean.
SOLUTION
(a)
(b)
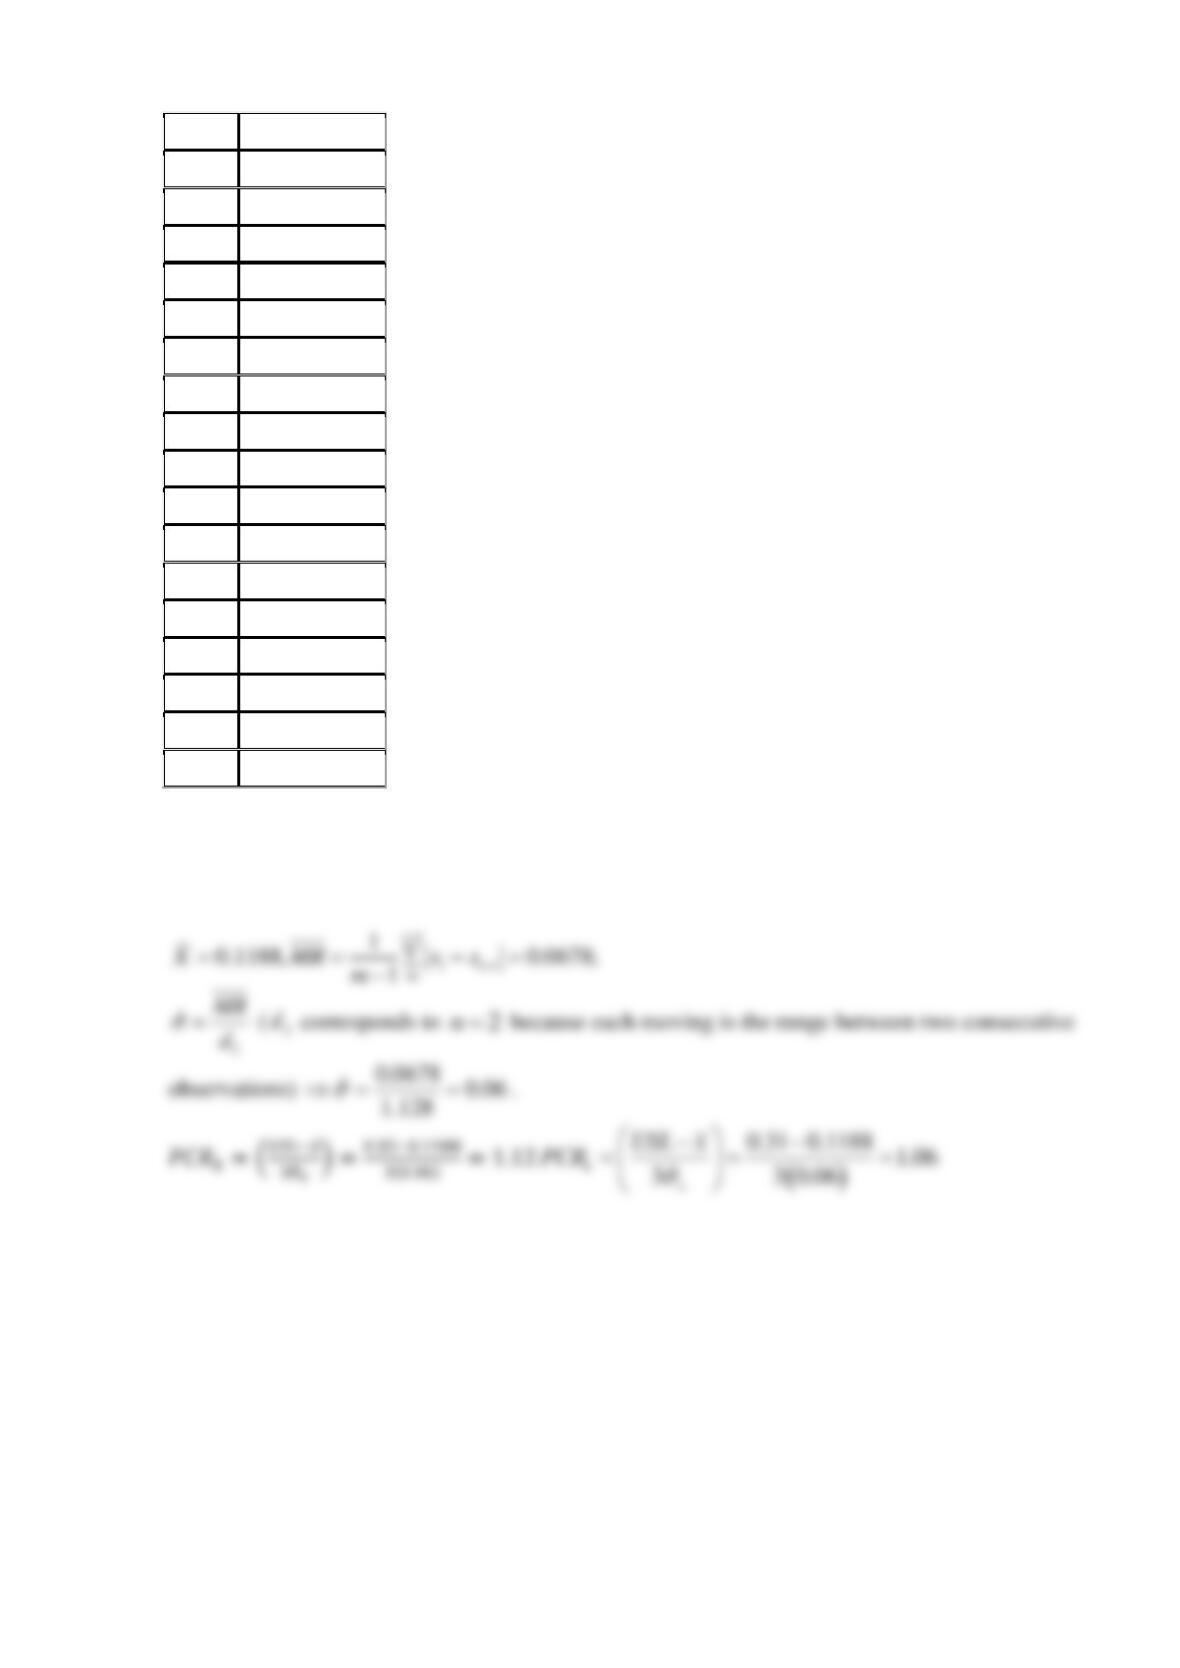
Reserve Supplemental Exercises Chapter 15 Problem 8
An article in Journal of the Operational Research Society [“A Quality Control Approach for
Monitoring Inventory Stock Levels,” (1993, pp. 1115–1127)] reported on a control chart to
monitor the accuracy of an inventory management system. Inventory accuracy at time t, AC(t), is
defined as the difference between the recorded and actual inventory (in absolute value) divided
by the recorded inventory. Consequently, AC(t) ranges between 0 and 1 with lower values better.
Extracted data are shown in the following table. Because lower values are better, only the USL =
0.32 is specified. Use the revised control chart to calculate
k
PCR
.
t
AC(t)
1
0.19
2
0.05
3
0.095
4
0.055
5
0.09
6
0.2
7
0.03
8
0.105
9
0.115
10
0.103
11
0.121
12
0.089
13
0,18
14
0.122
15
0.098
16
0.173
17
0.298
18
0.075
19
0.083
20
0.115
21
0.147
22
0.079
SOLUTION
Reserve Supplemental Exercises Chapter 15 Problem 9
For deciding whether to purchase an extended warranty on a vehicle, we use the following
model. The actions are
1
a=
purchase extended warranty
2
a=
do not purchase extended warranty
Assume that one of three states corresponding to a major, minor, or no repair can occur during
the warranty period. We obtain probability estimates for each state. The states and associated
probabilities are
1
s=
major repair, probability 0.1
2
s=
minor repair, probability 0.5
3
s=
no repair, probability 0.4
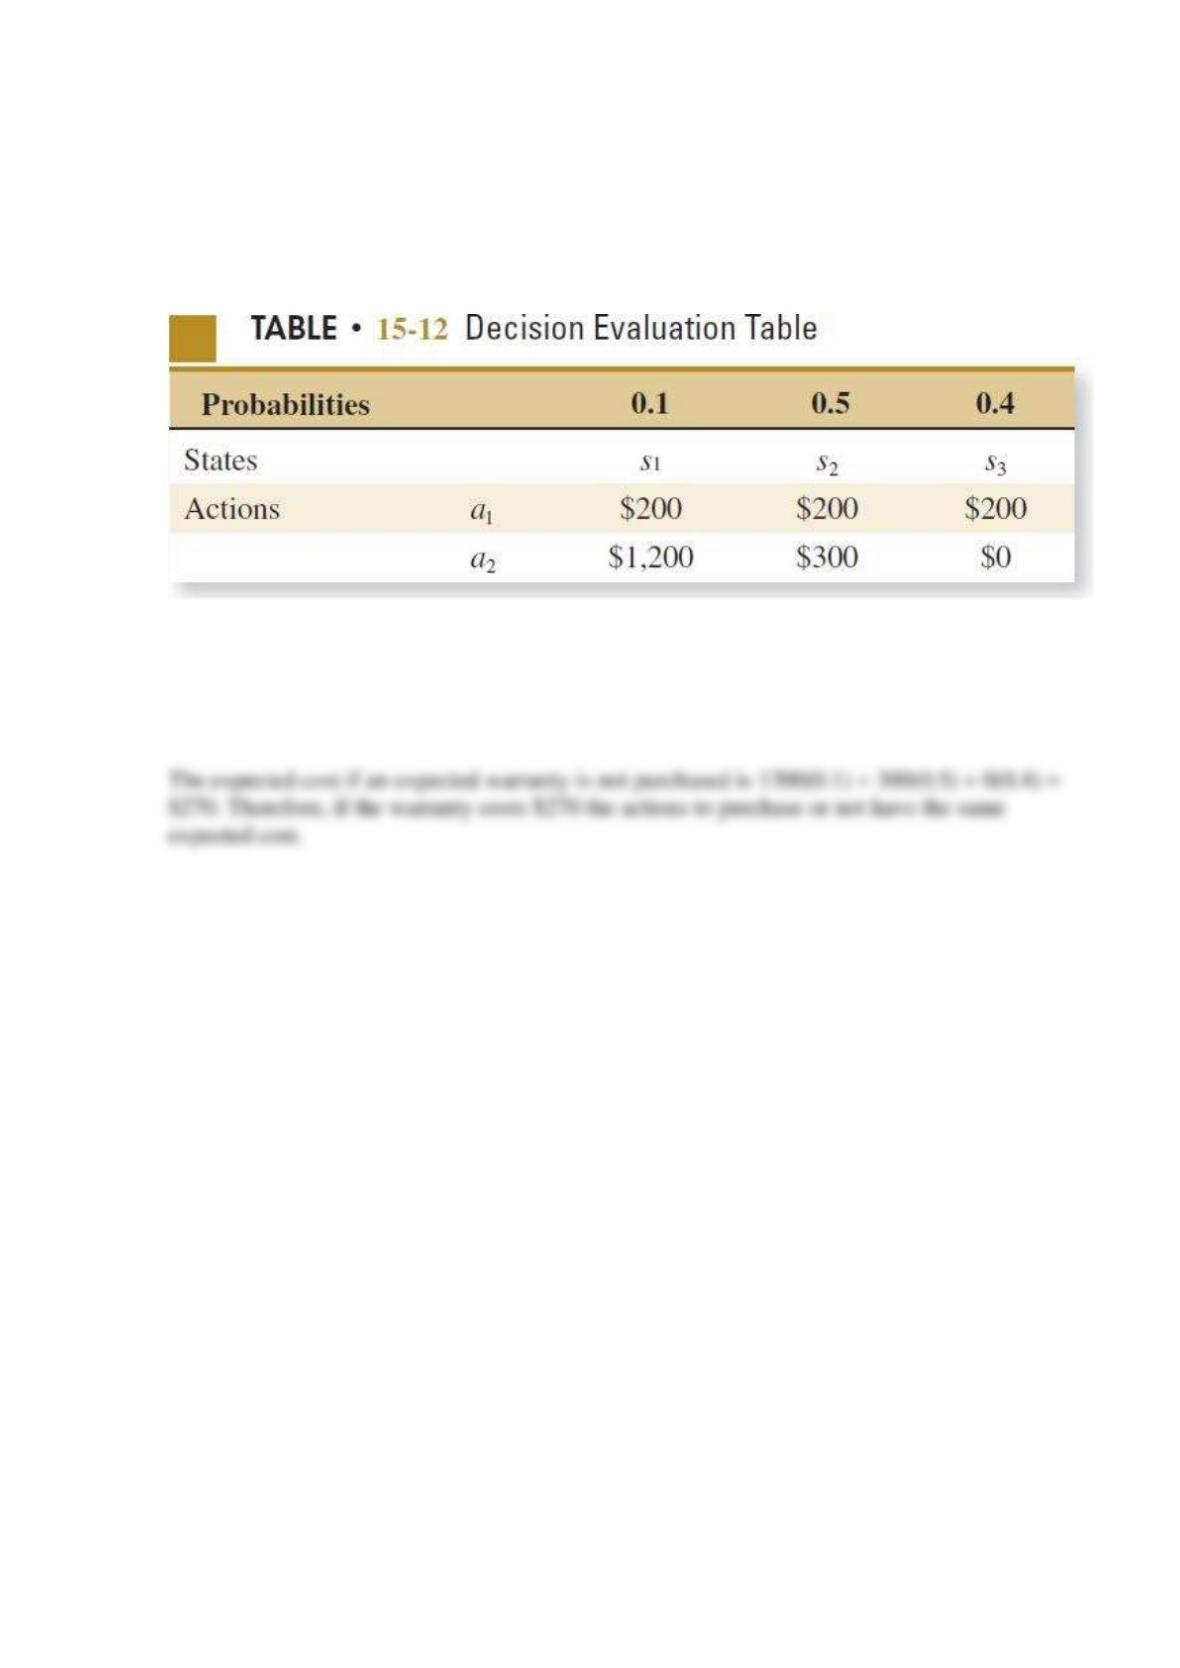
Finally, the costs
km
C
can be presented in a decision evaluation table in which each row is an
action and each column is a state. We assume that the extended warranty coverage costs $200.
Table 15-12 formally relates the cost of each action and possible future state.
Determine the cost of the extended warranty so that the expected costs of the actions to either
purchase the warranty or not are equal.
SOLUTION
Reserve Supplemental Exercises Chapter 15 Problem 10
The first decision is whether to develop a new product or contract with a supplier. This is
indicated by the box labeled Develop? If a new product is developed, it may be unique, but it
may be more typical of what is currently available on the market. This is indicated by the circle
labeled Unique? For either a new product or a contracted one, the price needs to be set. Here the
decision is indicated by Price? boxes. The choices are either high or low. Finally, the market
conditions when the product is available may be favorable or unfavorable to sales as indicated by
the circle labeled Sales. Favorable and unfavorable markets are indicated by the arcs labeled +
and –, respectively.
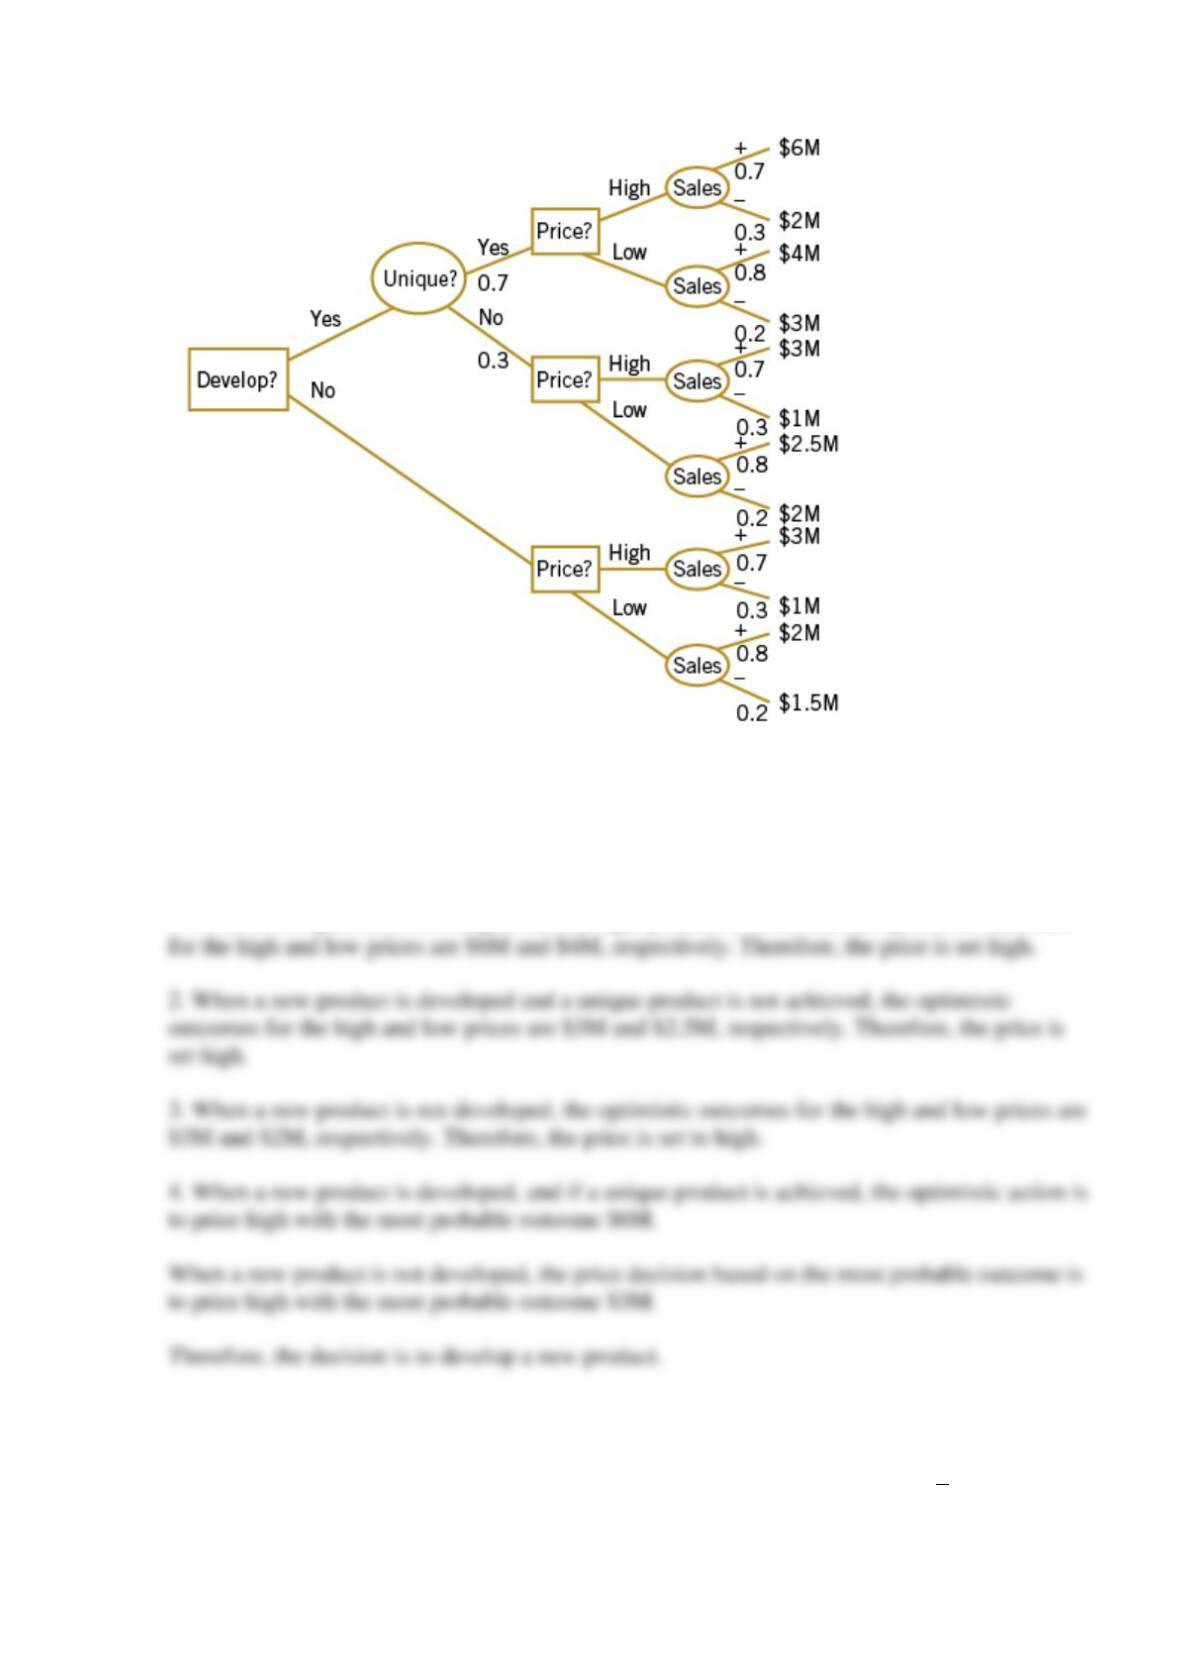
Analyze this problem based on the most probable criterion and determine the actions that are
selected at each decision node.
SOLUTION
Decisions:
1. When a new product is developed and a unique product is achieved, the optimistic outcomes
Reserve Supplemental Exercises Chapter 15 Problem 11
Suppose that a process is in control, and 3-sigma control limits are in use on an
X
chart. The
subgroup size is 3. Let the mean shift by 1.5σ.
(a) What is the probability that this shift remains undetected for three consecutive samples?
(b) What would its probability be if 2-sigma control limits were used?
SOLUTION
(a)
Let p denote the probability that a point plots outside of the control limits when the mean has
shifted from
0
to
01.5
+
. Then
(b)
Reserve Supplemental Exercises Chapter 15 Problem 12
Consider an
X
control chart with k-sigma control limits and subgroup size n. Develop a general
expression for the probability that a point plots outside the control limits when the process mean
has shifted by
units from the center line.
Let p denote the probability that a point plots outside of the control limits when the mean has
shifted by
.
SOLUTION
Reserve Supplemental Exercises Chapter 15 Problem 13
Suppose that an
X
chart is used to control a normally distributed process and that samples of
size n are taken every n hours and plotted on the chart, which has k-sigma limits.
(a) Find a general expression for the expected number of samples and time that is taken until a
false signal is generated.
(b) Suppose that the process mean shifts to an out-of-control state, say
10
=+
. Find an
expression for the expected number of samples that is taken until a false action is generated.
1
ARL p
=
, where
(c) Evaluate the in-control ARL for k = 3.
(d) Evaluate the out-of-control ARL for a shift of 3 sigma, given that n = 3.
SOLUTION
(a)
(b)
1
ARL p
=
where
(c)
(d)
Reserve Supplemental Exercises Chapter 15 Problem 14
Suppose that a P chart with center line at
p
with k-sigma control limits is used to control a
process. There is a critical fraction defective
c
p
that must be detected with probability 0.50 on
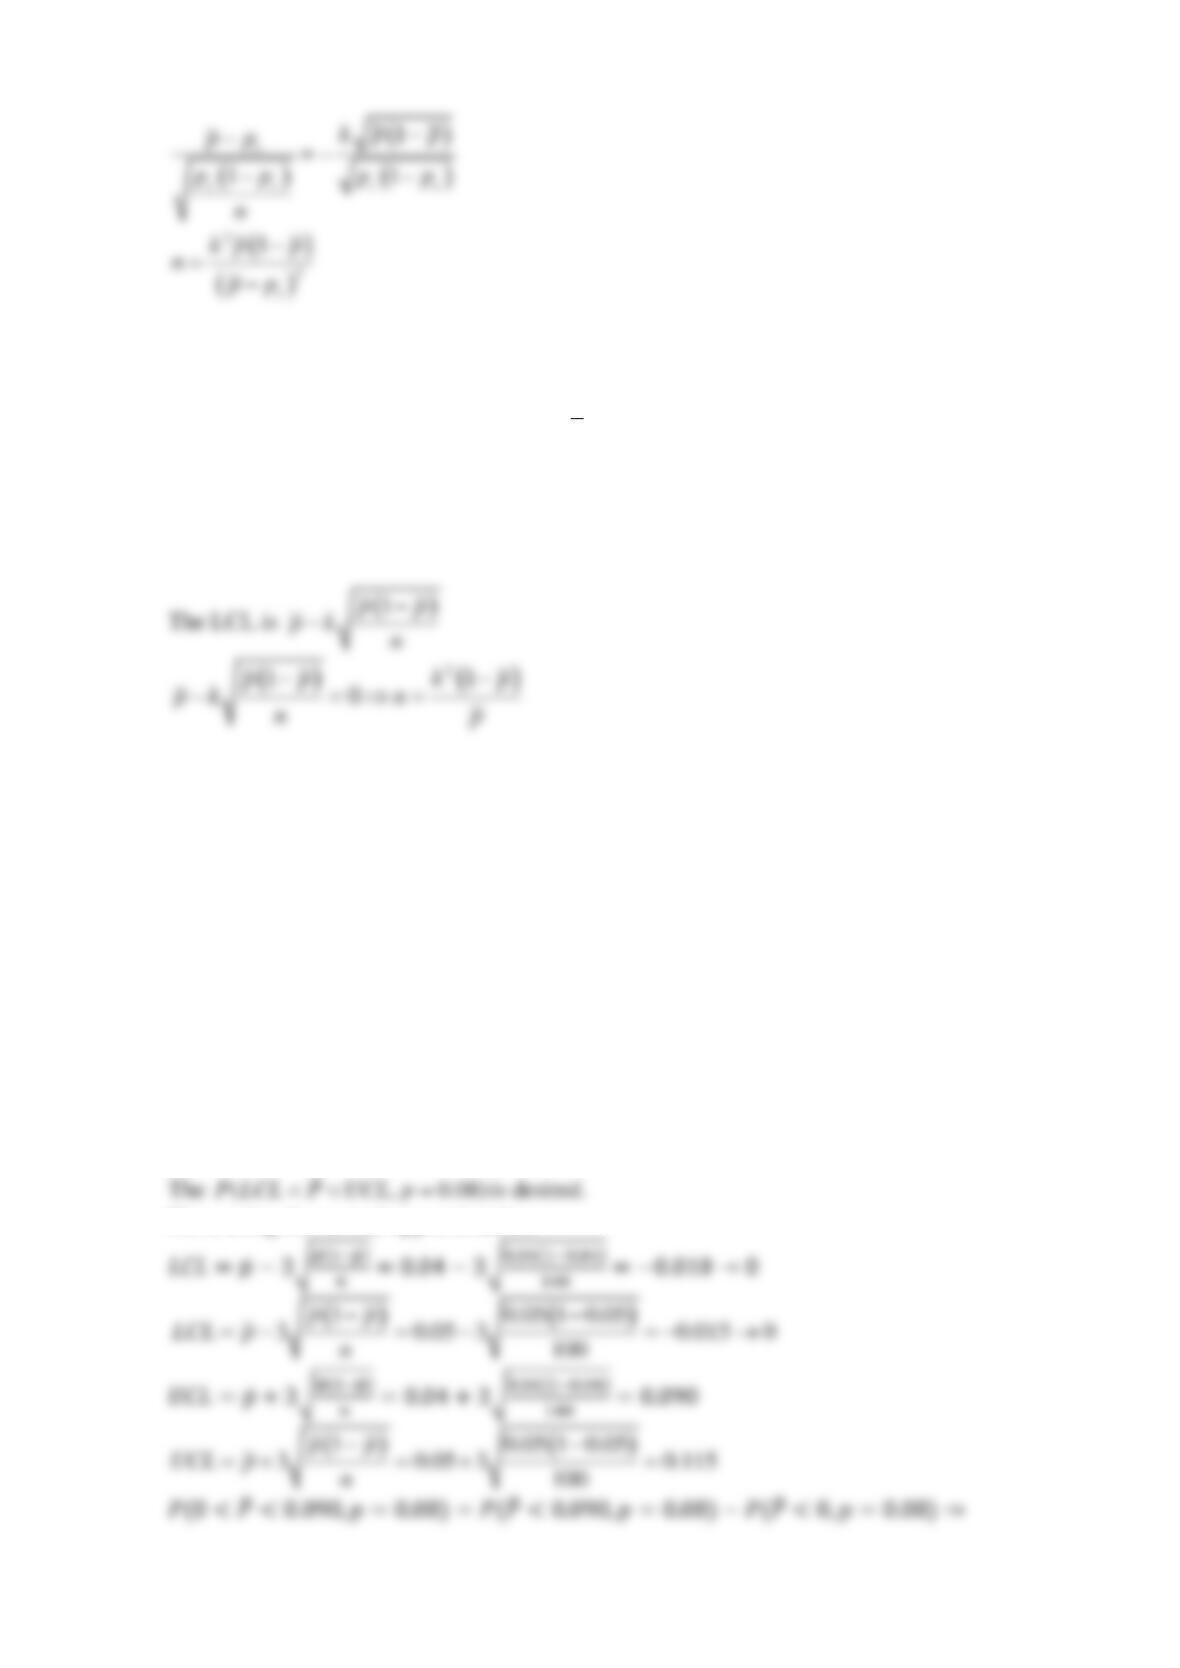
the first sample following the shift to this state. Derive a general formula for the sample size that
should be used on this chart.
SOLUTION
ˆ
0.5 ( , )
c
P LCL P UCL p p= = =
( )
( )
11
cc
p p p p
p k p p k p
Pp
nn
−−
− − + −
−
Reserve Supplemental Exercises Chapter 15 Problem 15
Suppose that a P chart with center line at
p
and k-sigma control limits is used to control a
process. What is the smallest sample size that can be used on this control chart to ensure that the
lower control limit is positive?
SOLUTION
Reserve Supplemental Exercises Chapter 15 Problem 16
A process is controlled by a P chart using samples of size 140. The center line on the chart is
0.04.
(a) What is the probability that the control chart detects a shift to 0.08 on the first sample
following the shift?
(b) What is the probability that the shift is detected by at least the third sample following the
shift?
SOLUTION
(a)
Now, using the normal approximation:
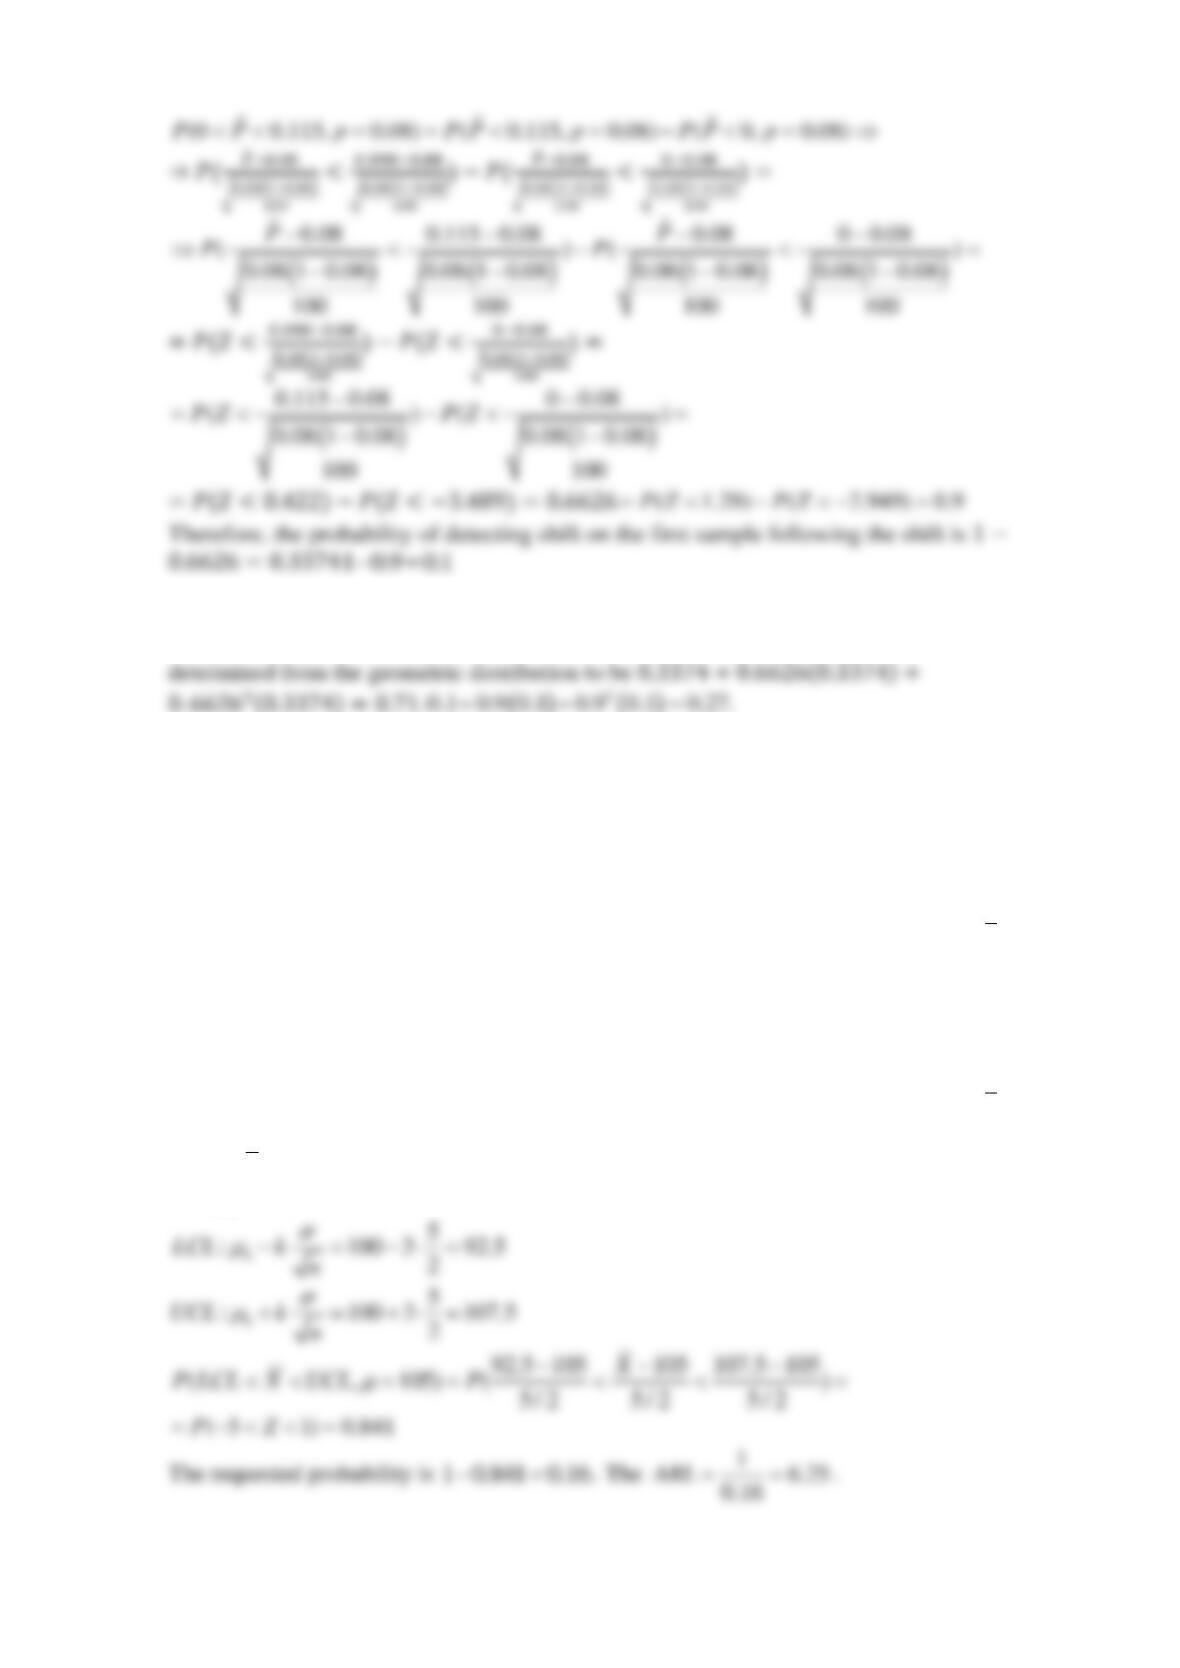
(b)
The probability of detecting a shift by at least the third sample following the shift can be
Reserve Supplemental Exercises Chapter 15 Problem 17
Consider a process whose specifications on a quality characteristic are 100 ± 15. You know that
the standard deviation of this normally distributed quality characteristic is 5. Where should you
center the process to minimize the fraction defective produced?
Now suppose that the mean shifts to 105, and you are using a sample size of 4 on an
X
chart.
(a) What is the probability that such a shift is detected on the first sample following the shift?
(b) What is the average number of samples until an out-of-control point occurs?
SOLUTION
Now suppose that the mean shifts to 105, and you are using a sample size of 4 on an
X
chart.
(a)
For an
X
chart:
0
: 100CL
=
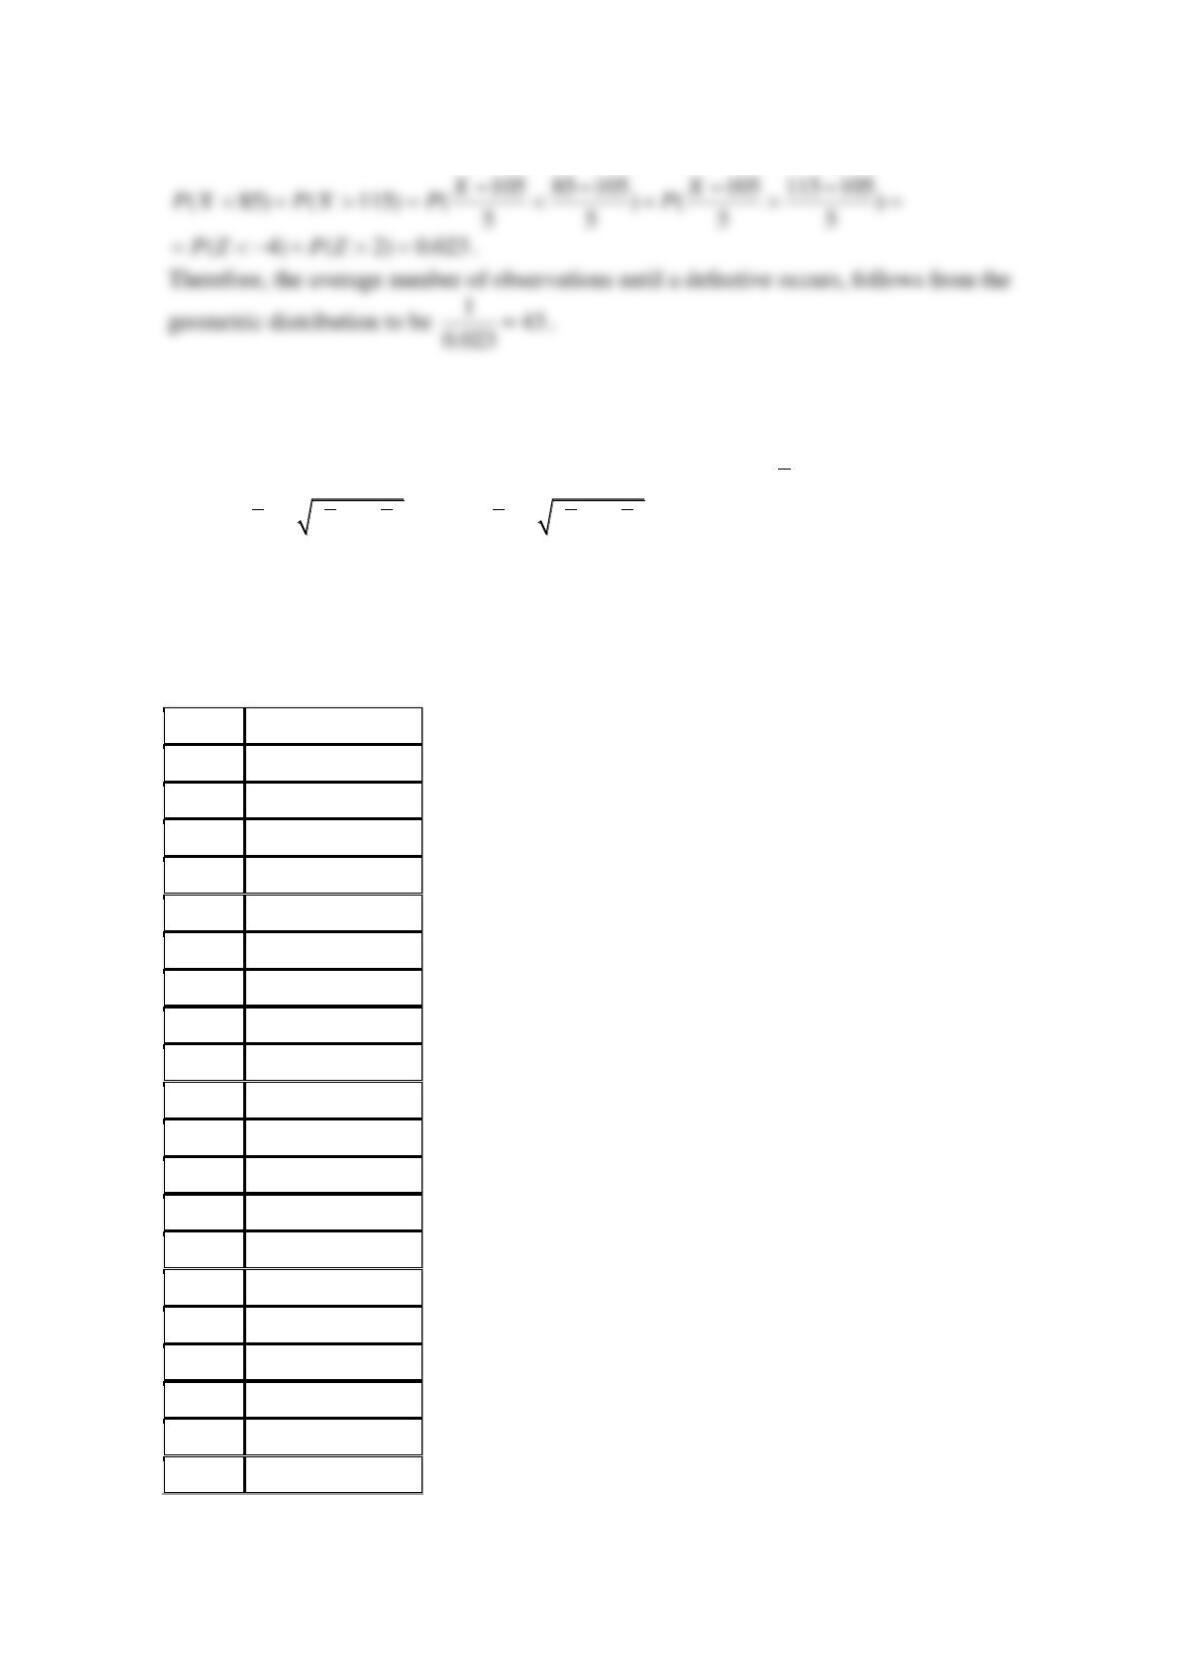
(b)
With
105
=
, the specifications at
100 15
and
5
=
, the probability of defective item is
Reserve Supplemental Exercises Chapter 15 Problem 18
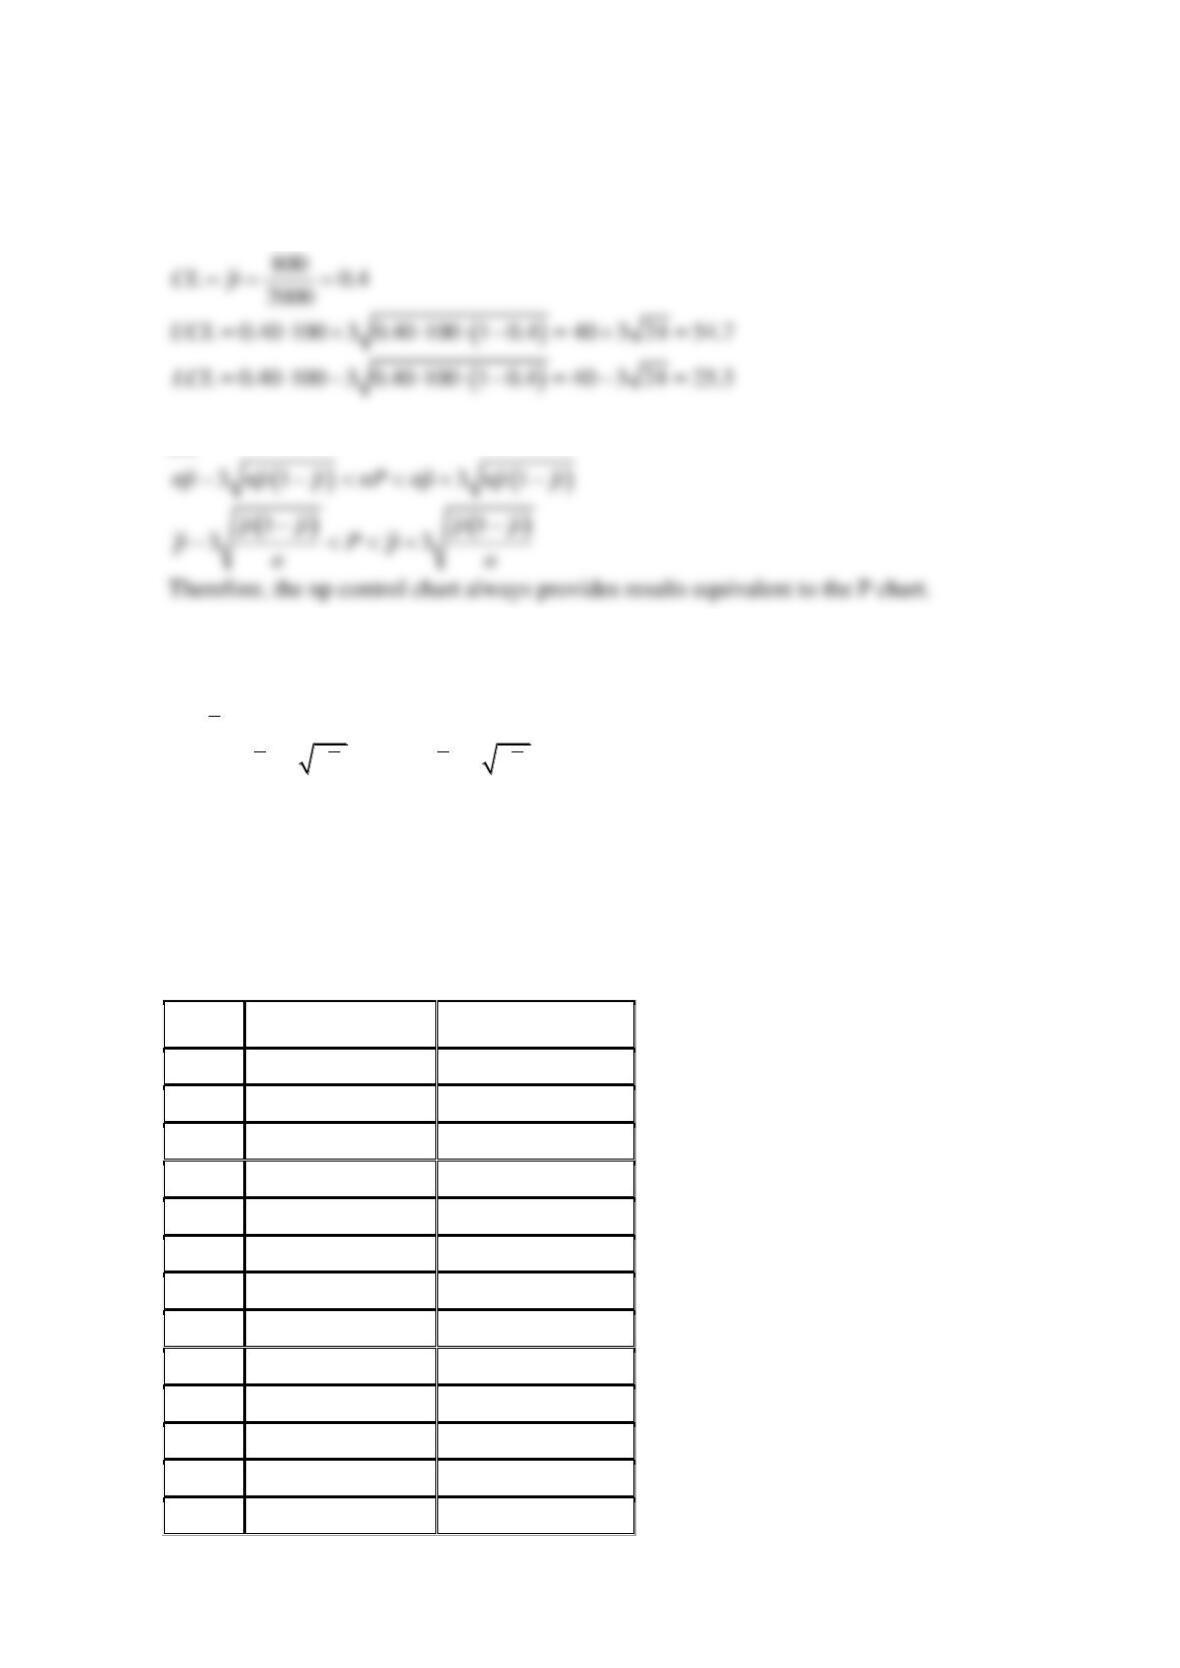
An alternative to the control chart for fraction defective is a control chart based on the number of
defectives or the NP control chart. The chart has center line at
np
, the control limits are
( ) ( )
3 1 ; 3 1UCL np np p LCL np np p= + − = − −
and the number of defectives for each sample is plotted on the chart.
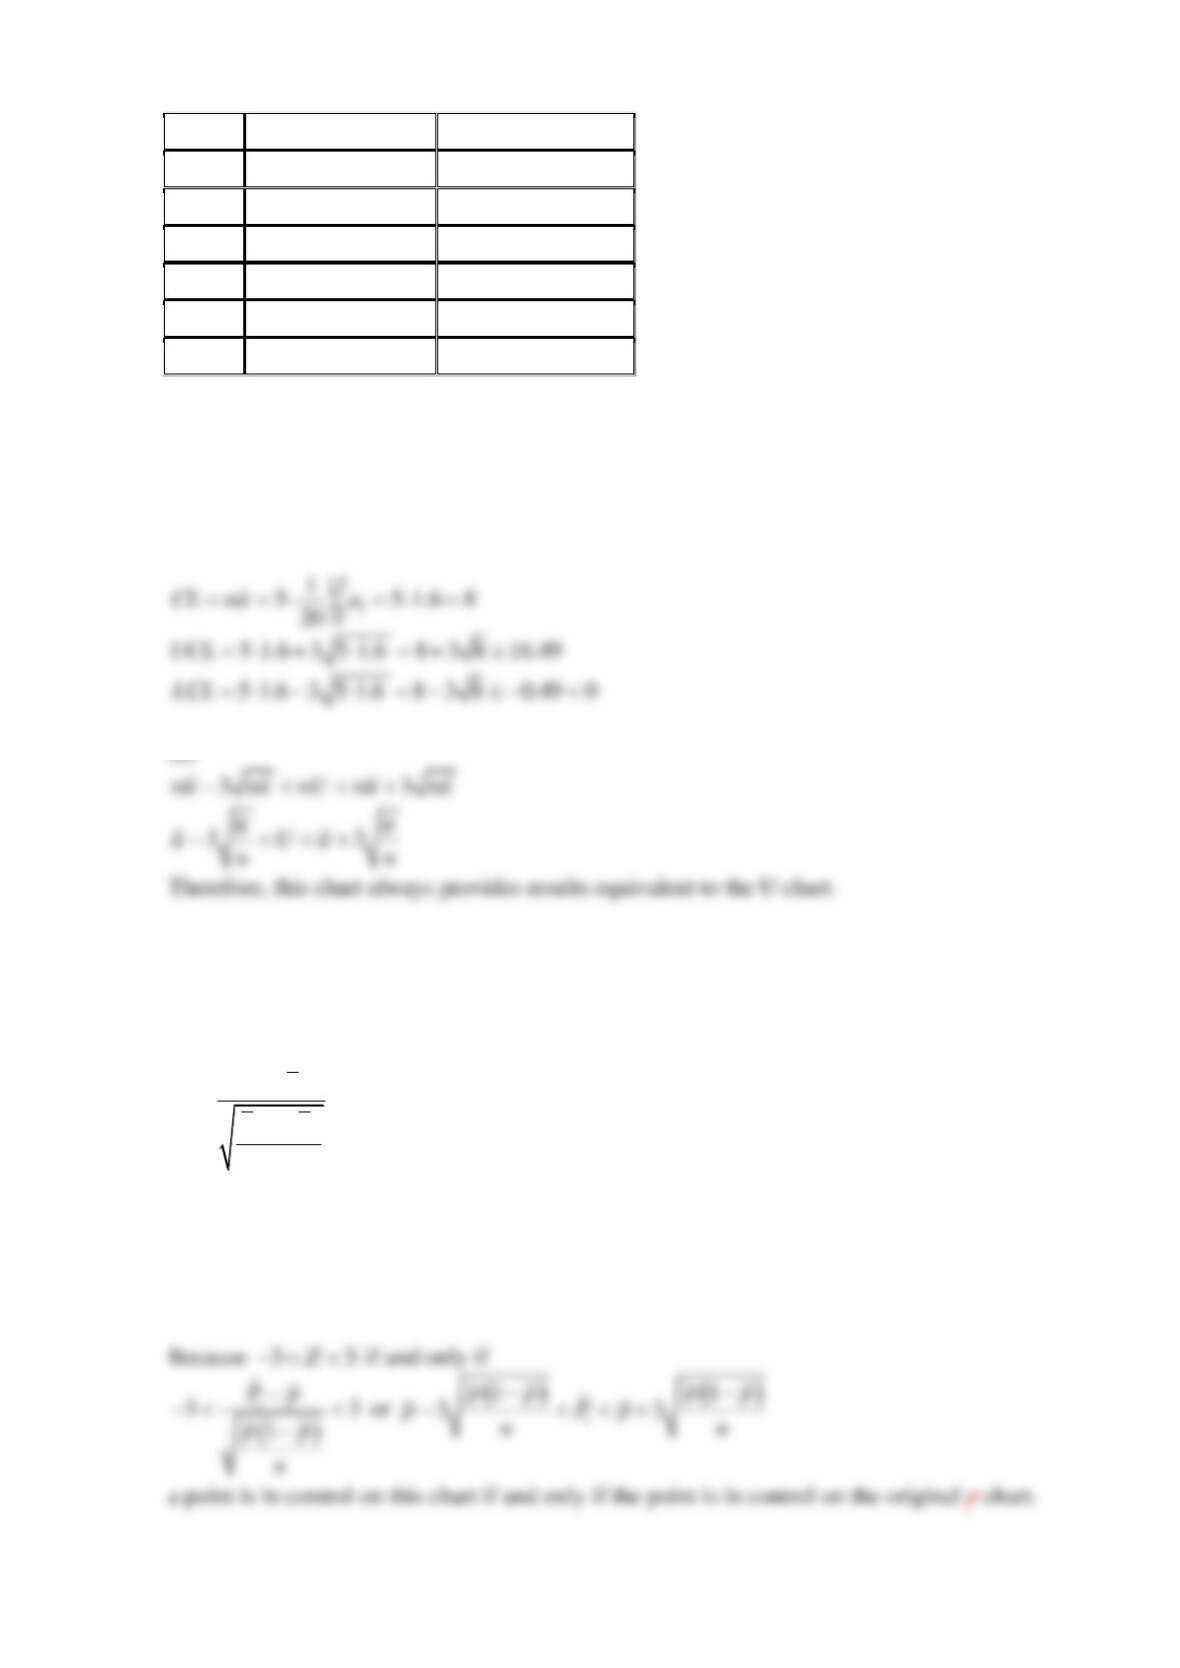
(a) Apply this control to the following data:
We have 20 preliminary samples, each of size 100; the number of defectives in each sample is
shown in following table
Sample
No. of Defectives
1
44
2
48
3
32
4
50
5
29
6
31
7
46
8
52
9
44
10
48
11
36
12
52
13
35
14
41
15
42
16
30
17
46
18
38
19
26
20
30
(b) Will this chart always provide results that are equivalent to the usual P chart?
SOLUTION
(a)
(b)
Reserve Supplemental Exercises Chapter 15 Problem 19
An alternative to the U chart is a chart based on the number of defects. The chart has center line
at
nu
, and the control limits are
3 ; 3UCL nu nu LCL nu nu= + = −
(a) Apply this chart to the following data:
Every hour, five boards are selected and inspected for process-control purposes. The number of
defects in each sample of five boards is noted. Results for 20 samples are shown in following
table
Sample
Number of Defects
Defeсts per Unit
i
u
1
6
1.2
2
4
0.8
3
8
1.6
4
10
2
5
9
1.8
6
12
2.4
7
16
3.2
8
2
0.4
9
3
0.6
10
10
2
11
9
1.8
12
15
3
13
8
1.6
14
10
2
15
8
1.6
16
2
0.4
17
7
1.4
18
1
0.2
19
7
1.4
20
13
2.6
(b) Will this chart always provide results that are equivalent to the U chart?
SOLUTION
(a)
Reserve Supplemental Exercises Chapter 15 Problem 20
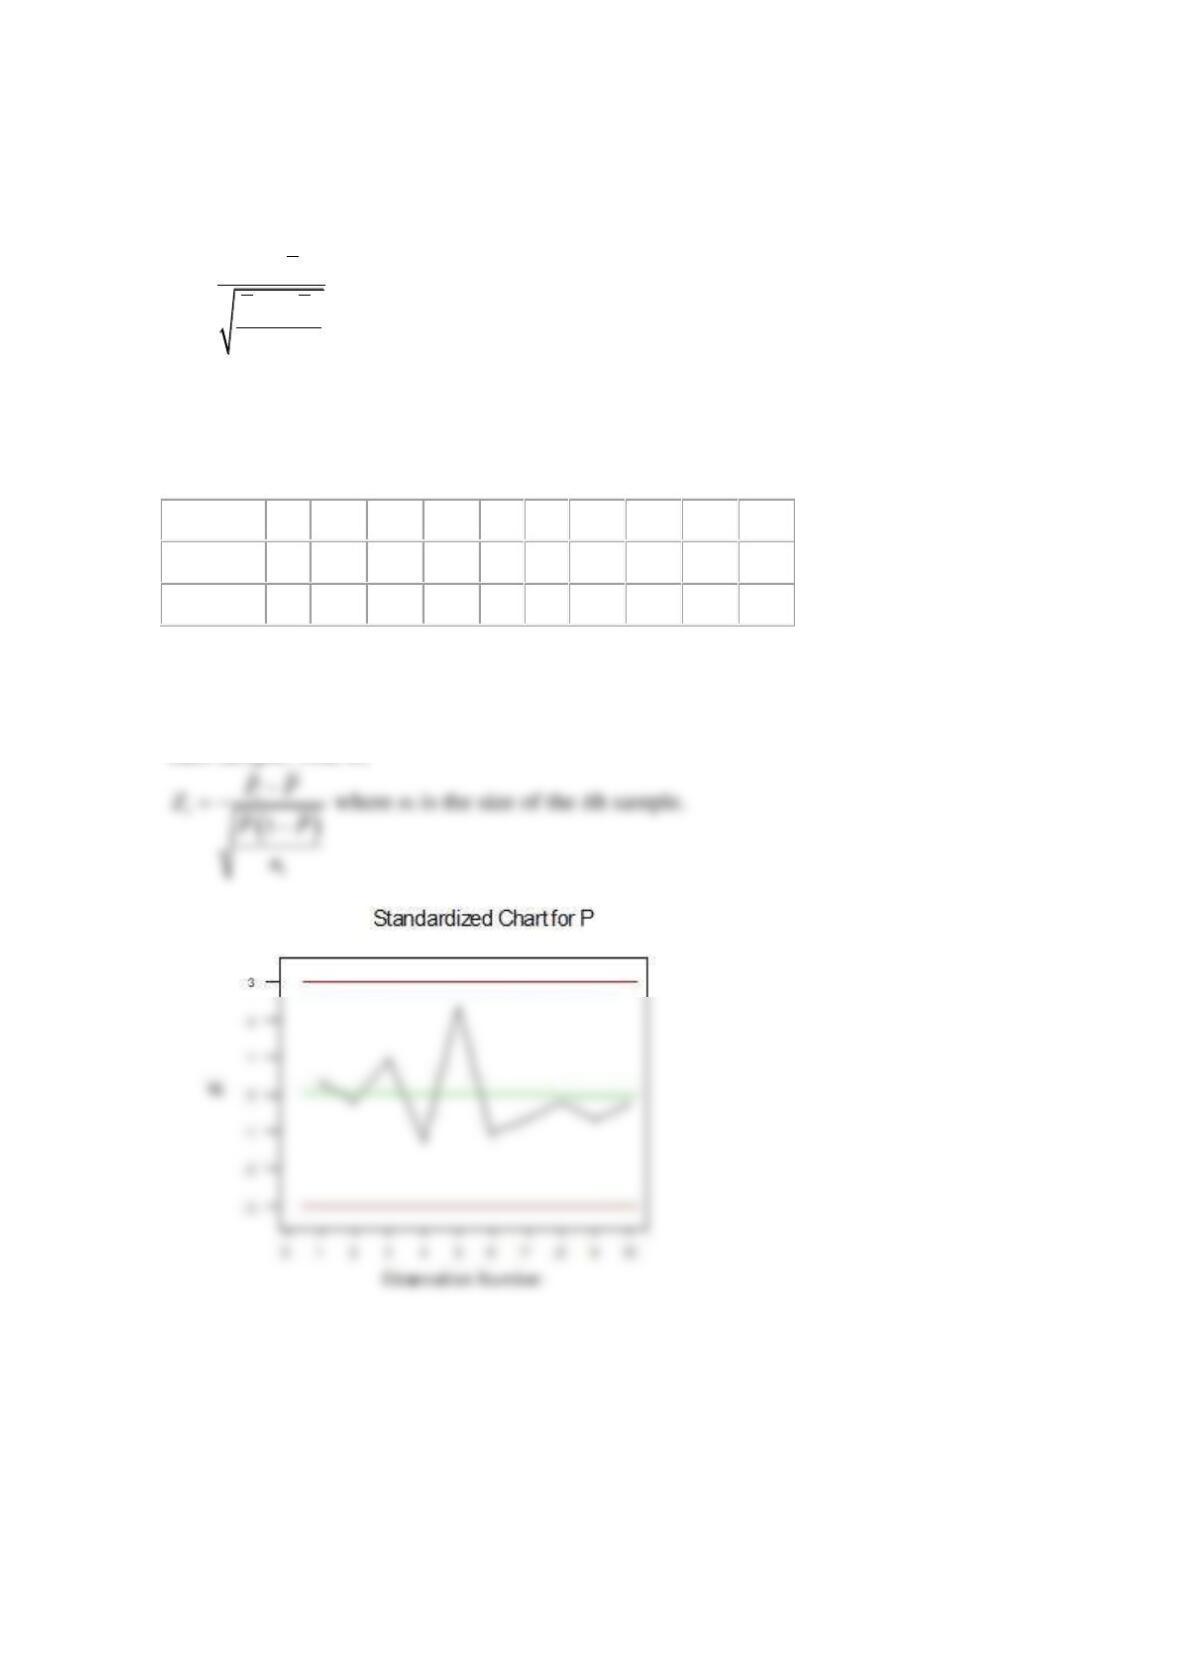
Standardized Control Chart. Consider the P chart with the usual 3-sigma control limits.
Suppose that we define a new variable
( )
ˆ
1
i
i
PP
Z
PP
n
−
=−
as the quantity to plot on a control chart. It is proposed that this new chart has a center line at 0
with the upper and lower control limits at
3
. Verify that this standardized control chart is
equivalent to the original P chart.
SOLUTION
Reserve Supplemental Exercises Chapter 15 Problem 21
Unequal Sample Sizes. Consider the P chart with the usual 3-sigma control limits. Suppose that
we define a new variable
( )
ˆ
1
i
i
PP
Z
PP
n
−
=−
as the quantity to plot on a control chart. It is proposed that this new chart has a center line at 0
with the upper and lower control limits at
3
.
One application of the standardized control chart introduced above is to allow unequal sample
sizes on the control chart. Provide details concerning how this procedure would be implemented
and illustrate using the following data:
Sample, i
1
2
3
4
5
6
7
8
9
10
ni
20
25
20
25
50
30
25
25
25
20
pi
0.2
0.16
0.25
0.08
0.3
0.1
0.12
0.16
0.12
0.15
SOLUTION
For unequal sample sizes, the p control chart can be used with the value of n equal to the size of
each sample. That is,