Reserve Problems Chapter 14 Section 6 Problem 1
An article in the Annals of Nuclear Energy (“Statistical Analysis of the Fort Calhoun Reactor
Coolant Pump System,” Vol. 24(3), 1997) considered the effect of five factors on a recirculating
pump motor power input (kW).
The factors were temperature settings at the sites: A = Upper guide bearing, B = Upper thrust
bearing, C = Lower thrust bearing, D = Lower guide bearing, E = Seal winding.
The levels were coded as A: -1 = 140, +1 = 160; B: -1 = 140, +1 = 160; C: -1 = 140, +1 = 160; D:
-1 = 140, +1 = 160; E: -1 = 140, +1 = 160.

A
B
C
D
E
Power
-1
-1
-1
-1
-1
2000
1
-1
-1
-1
-1
2039
-1
1
-1
-1
-1
1998
1
1
-1
-1
-1
1990
-1
-1
1
-1
-1
2008
1
-1
1
-1
-1
2364
-1
1
1
-1
-1
2163
1
1
1
-1
-1
2360
-1
-1
-1
1
-1
2013
1
-1
-1
1
-1
2013
-1
1
-1
1
-1
1959
1
1
-1
1
-1
1964
-1
-1
1
1
-1
2367
1
-1
1
1
-1
2310
-1
1
1
1
-1
2090
1
1
1
1
-1
2072
-1
-1
-1
-1
1
1993
1
-1
-1
-1
1
1998
-1
1
-1
-1
1
1959
1
1
-1
-1
1
2057
-1
-1
1
-1
1
2098
1
-1
1
-1
1
2364
-1
1
1
-1
1
2034
1
1
1
-1
1
2160
-1
-1
-1
1
1
1998
1
-1
-1
1
1
1997
-1
1
-1
1
1
2092
1
1
-1
1
1
2094
-1
-1
1
1
1
2044
1
-1
1
1
1
2212
-1
1
1
1
1
2010
1
1
1
1
1
2036
(a) Estimate the factor effects.
(b) Which effects appear important?
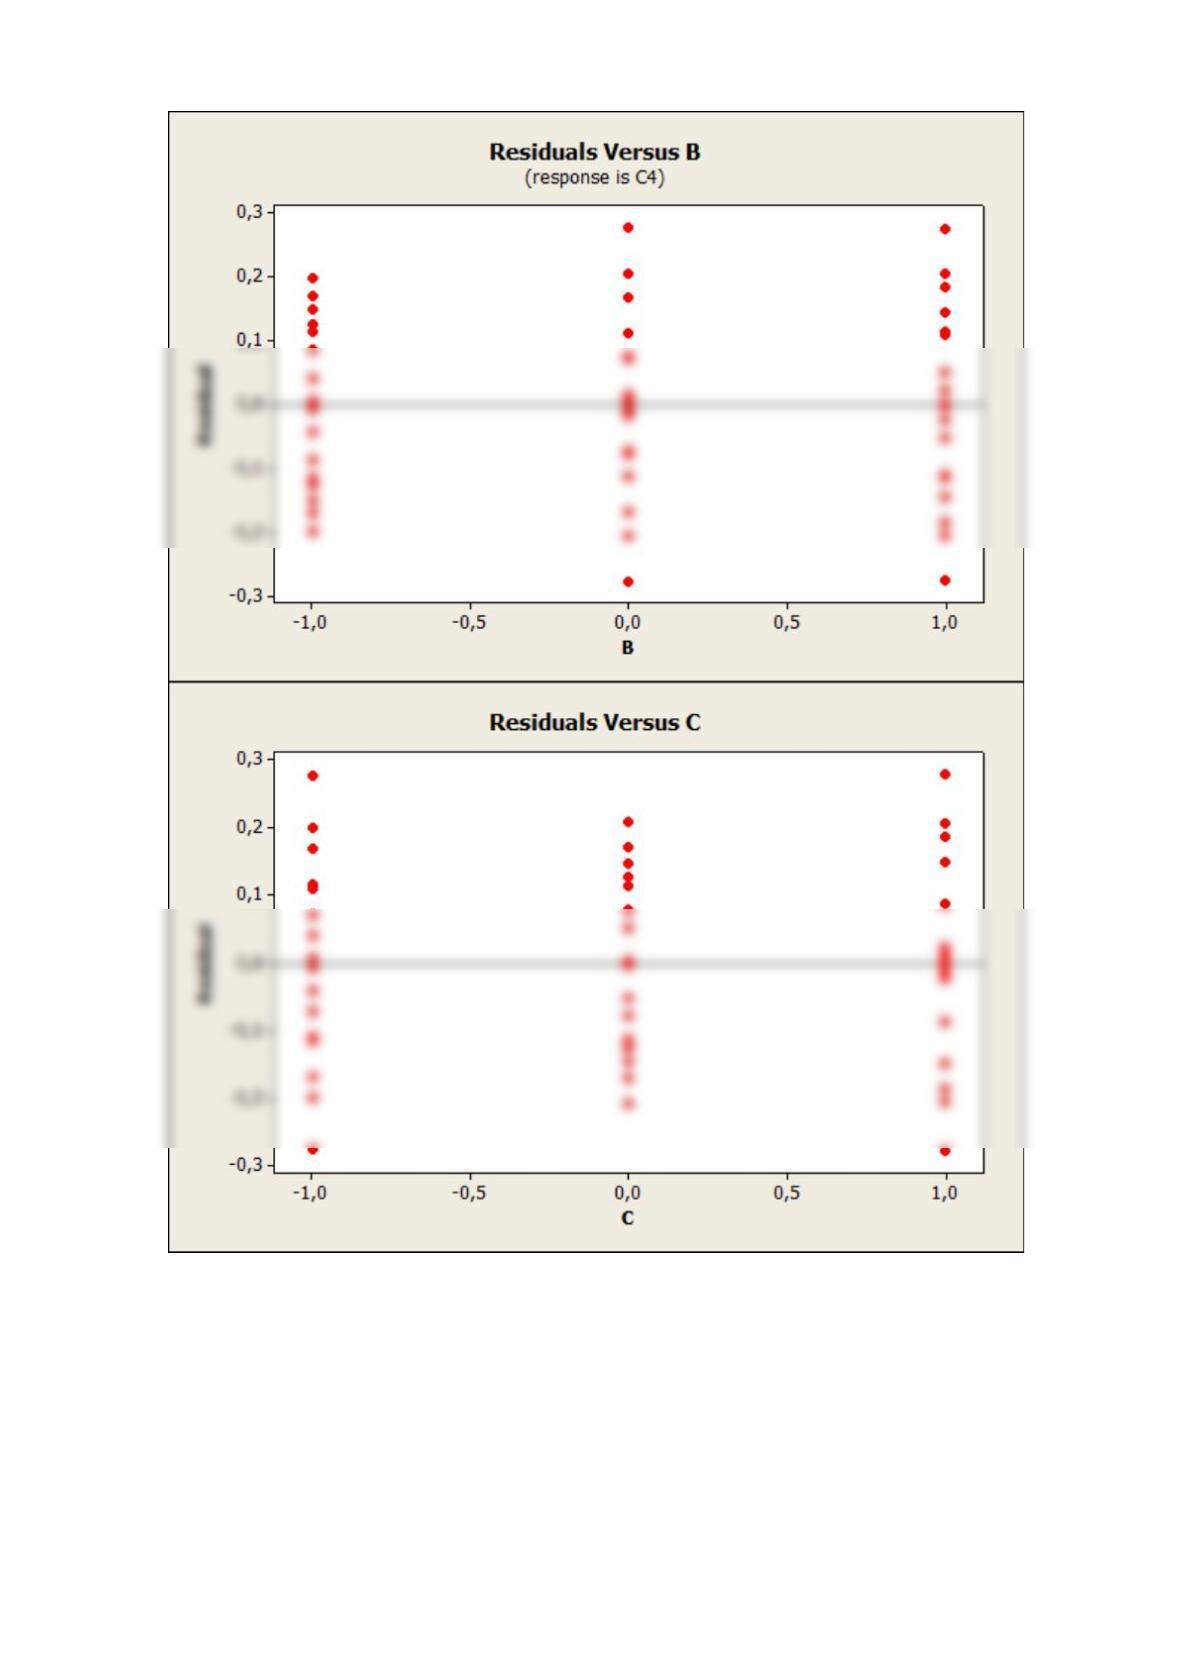
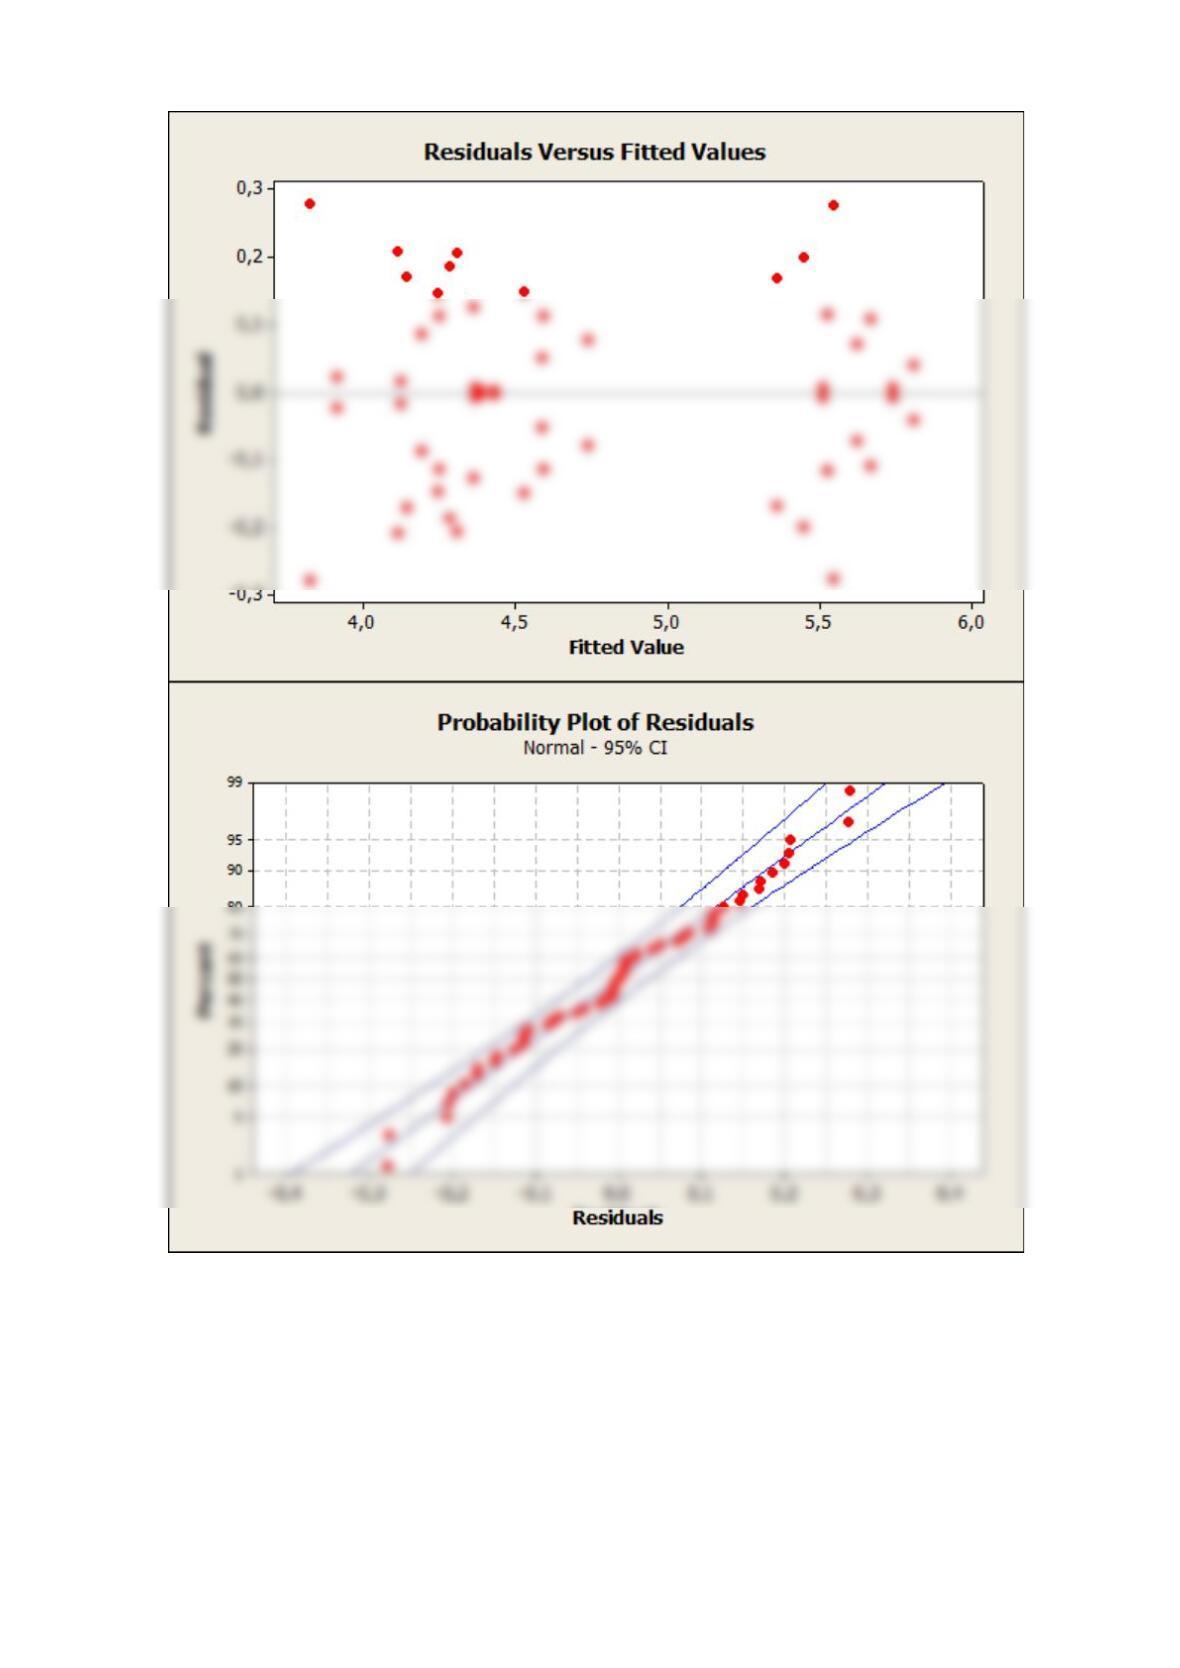
(c) Analyze the residuals from this experiment.
SOLUTION
(a)
Factor
Effect
A
75.25
B
-48.75
E
-35.25
A*B
-21.75
A*C
57.75
A*B*E
-1.5
A*C*E
2.5
A*D*E
22.12
B*C*D
-45.13
B*C*E
-30.25
B*D*E
58.88
C*D*E
-34.38
A*B*C*D
14.63
A*B*C*E
-18.75
A*B*D*E
-21.38
A*C*D*E
31.63
B*C*D*E
31.62
A*B*C*D*E
-3.62
(b)
A*D
-59.63
A*E
11
B*C
-56.5
B*D
-30.87
B*E
16
C*D
-31.63
C*E
-61.75
D*E
-2.87
A*B*C
-28.5
A*B*D
9.87
A*C*D
-43.63
(c)
Reserve Problems Chapter 14 Section 6 Problem 2

An article in the Fuel (“Optimization of Reactive Extraction of Castor Seed to Produce Biodiesel
Using Response Surface Methodology,” Vol. 2012) considered the effects of the following four
factors on FAME (fatty acid methyl esters) yield (%) of biodiesel.
A
B
C
D
FAME Yield
(%)
Catalyst Concentration
(%)
Methanol/Oil
Ratio
Mixing Intensity
(rpm)
Temperature
(C)
0.75
162.5
225
50
51.2
1.25
162.5
225
50
61
0.75
287.5
225
50
78.2
1.25
287.5
225
50
75.5
0.75
162.5
475
50
54
1.25
162.5
475
50
65.9
0.75
287.5
475
50
81.1
1.25
287.5
475
50
82.2
0.75
162.5
225
60
49.5
1.25
162.5
225
60
60
0.75
287.5
225
60
90.2
1.25
287.5
225
60
86
0.75
162.5
475
60
53.2
1.25
162.5
475
60
64.4
0.75
287.5
475
60
97.2
1.25
287.5
475
60
93
(a) Estimate the factor effects.
(b) Which effects appear important? Use a normal probability plot.
(c) How should the process variables B, C, D should be changed to increase yield?
SOLUTION
(a)
Term
Effect
Coef
Constant
71.412
A
4.175
2.087
B
28.025
14.012
C
4.925
2.463
D
5.550
2.775
A*B
-6.675
-3.337
A*C
0.825
0.413
A*D
-0.850
-0.425
B*C
0.975
0.487
A*B*D
-0.850
-0.425
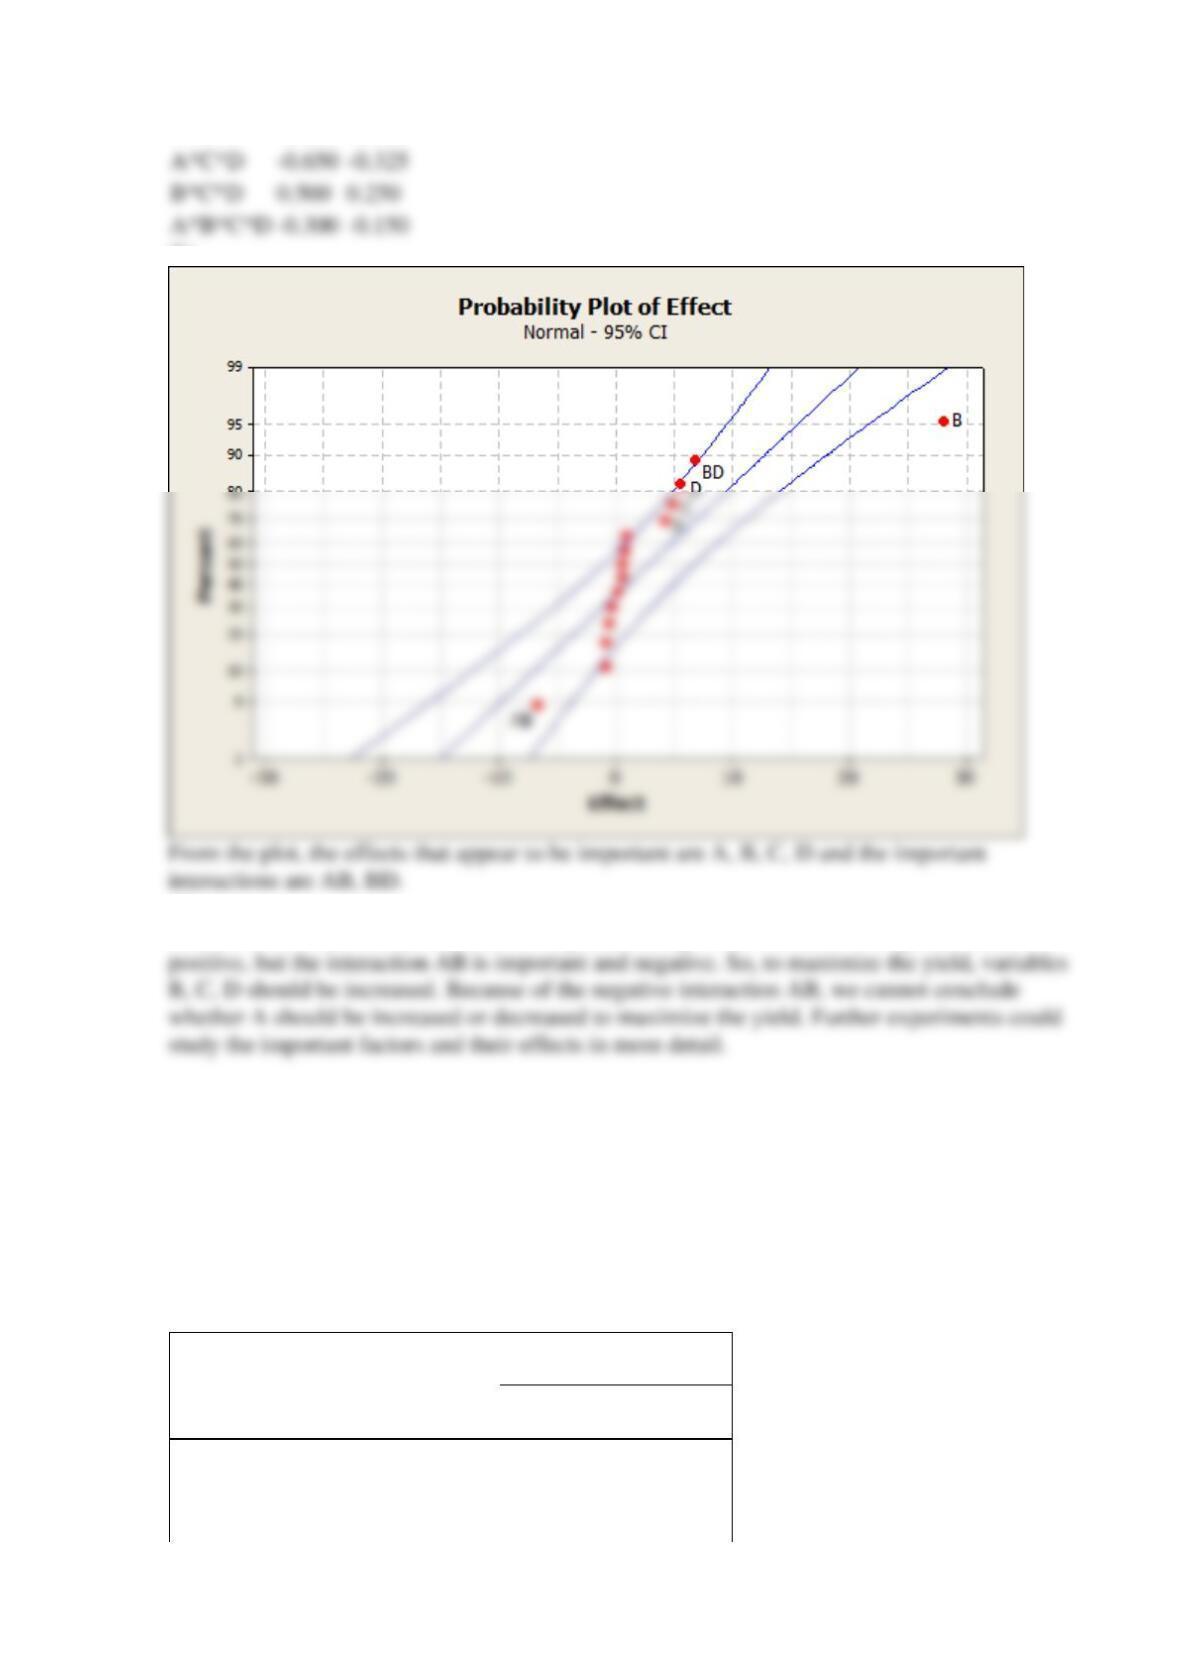
(b)
(c)
Effects B, C, D and interaction BD are important and positive. Effect A is important and
Reserve Problems Chapter 14 Section 6 Problem 3
A
4
2
factorial design was run in a chemical process. The design factors are A = time, B =
concentration, C = pressure, and D = temperature. The response variable is yield. The data
follow:
Yield
(pounds)
Factor levels
Run
A
B
C
D
–
+
1
–
–
–
–
12
A (hours)
2
3
2
+
–
–
–
18
B (%)
14
18
A*C*D
-0.650
-0.325
B*C*D
0.500
0.250
A*B*C*D
-0.300
-0.150

3
–
+
–
–
13
C (psi)
60
80
4
+
+
–
–
16
D (°C)
200
250
5
–
–
+
–
17
6
+
–
+
–
15
7
–
+
+
–
20
8
+
+
+
–
15
9
–
–
–
+
10
10
+
–
–
+
25
11
–
+
–
+
13
12
+
+
–
+
24
13
–
–
+
+
19
14
+
–
+
+
21
15
–
+
+
+
17
16
+
+
+
+
23
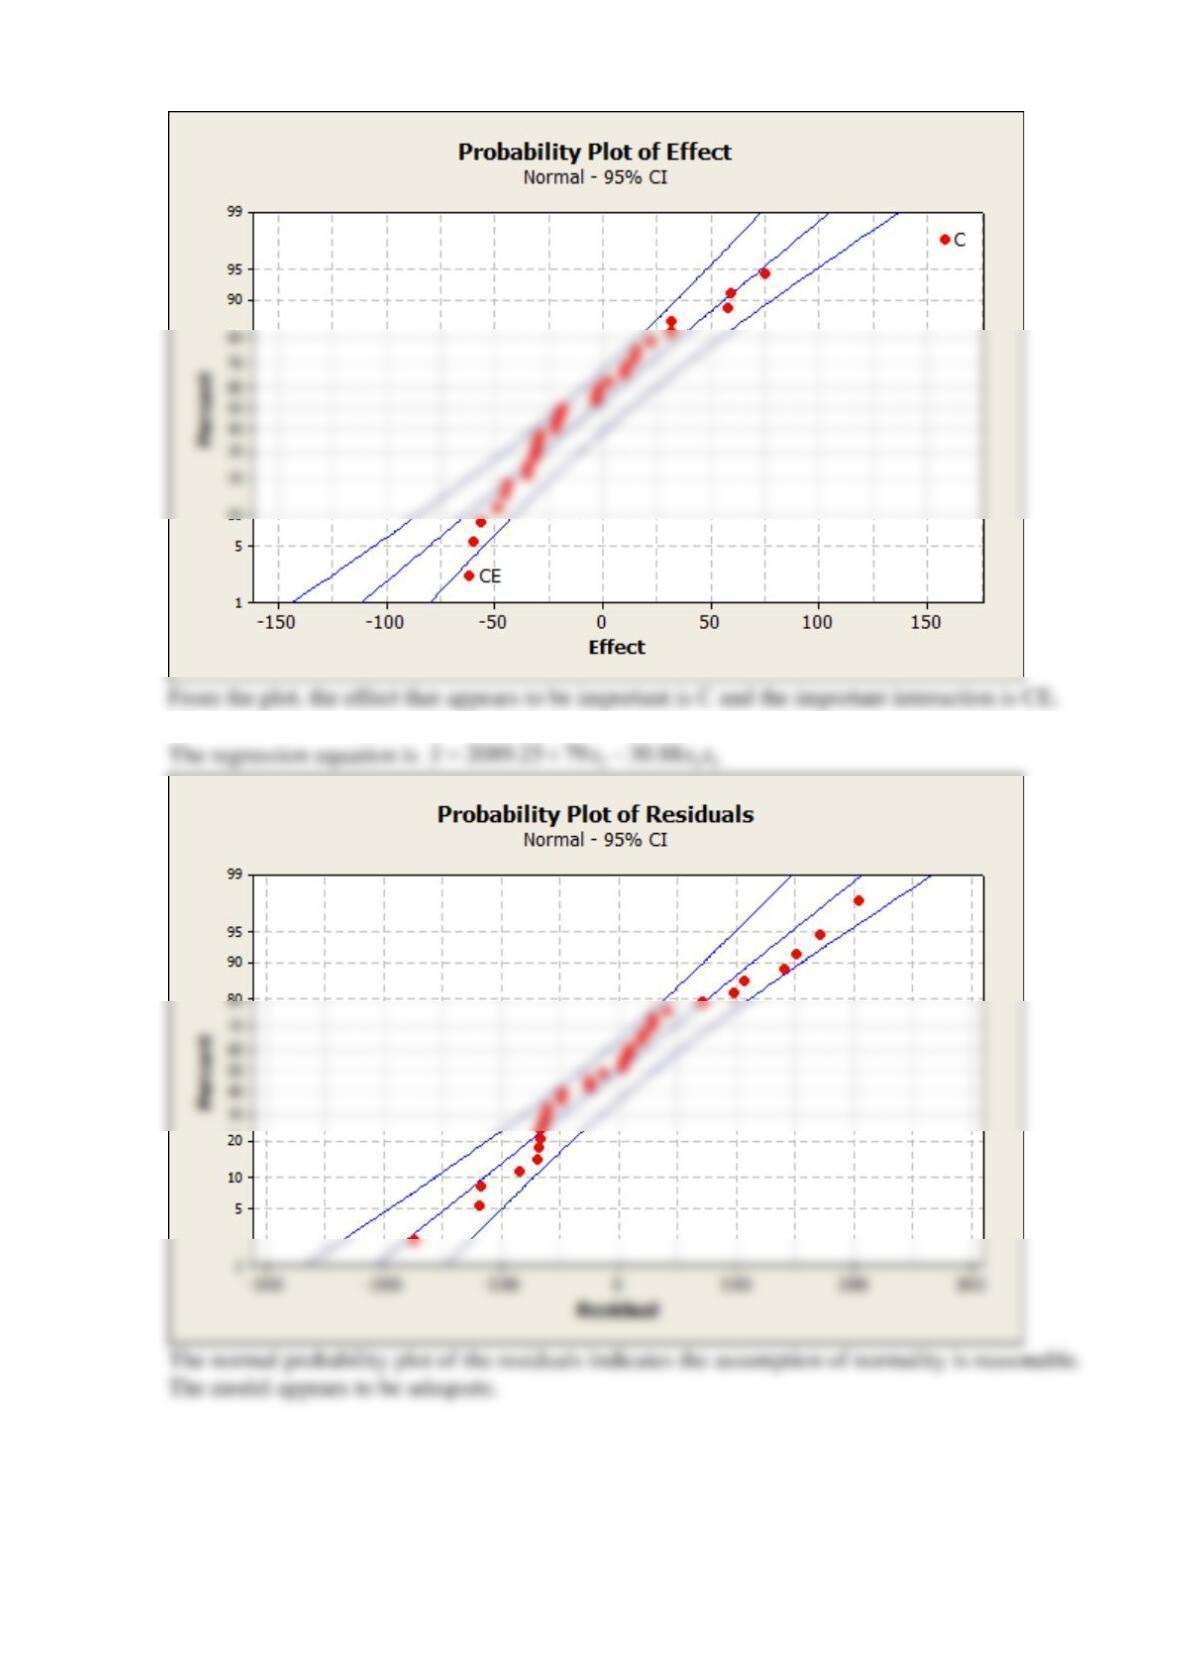
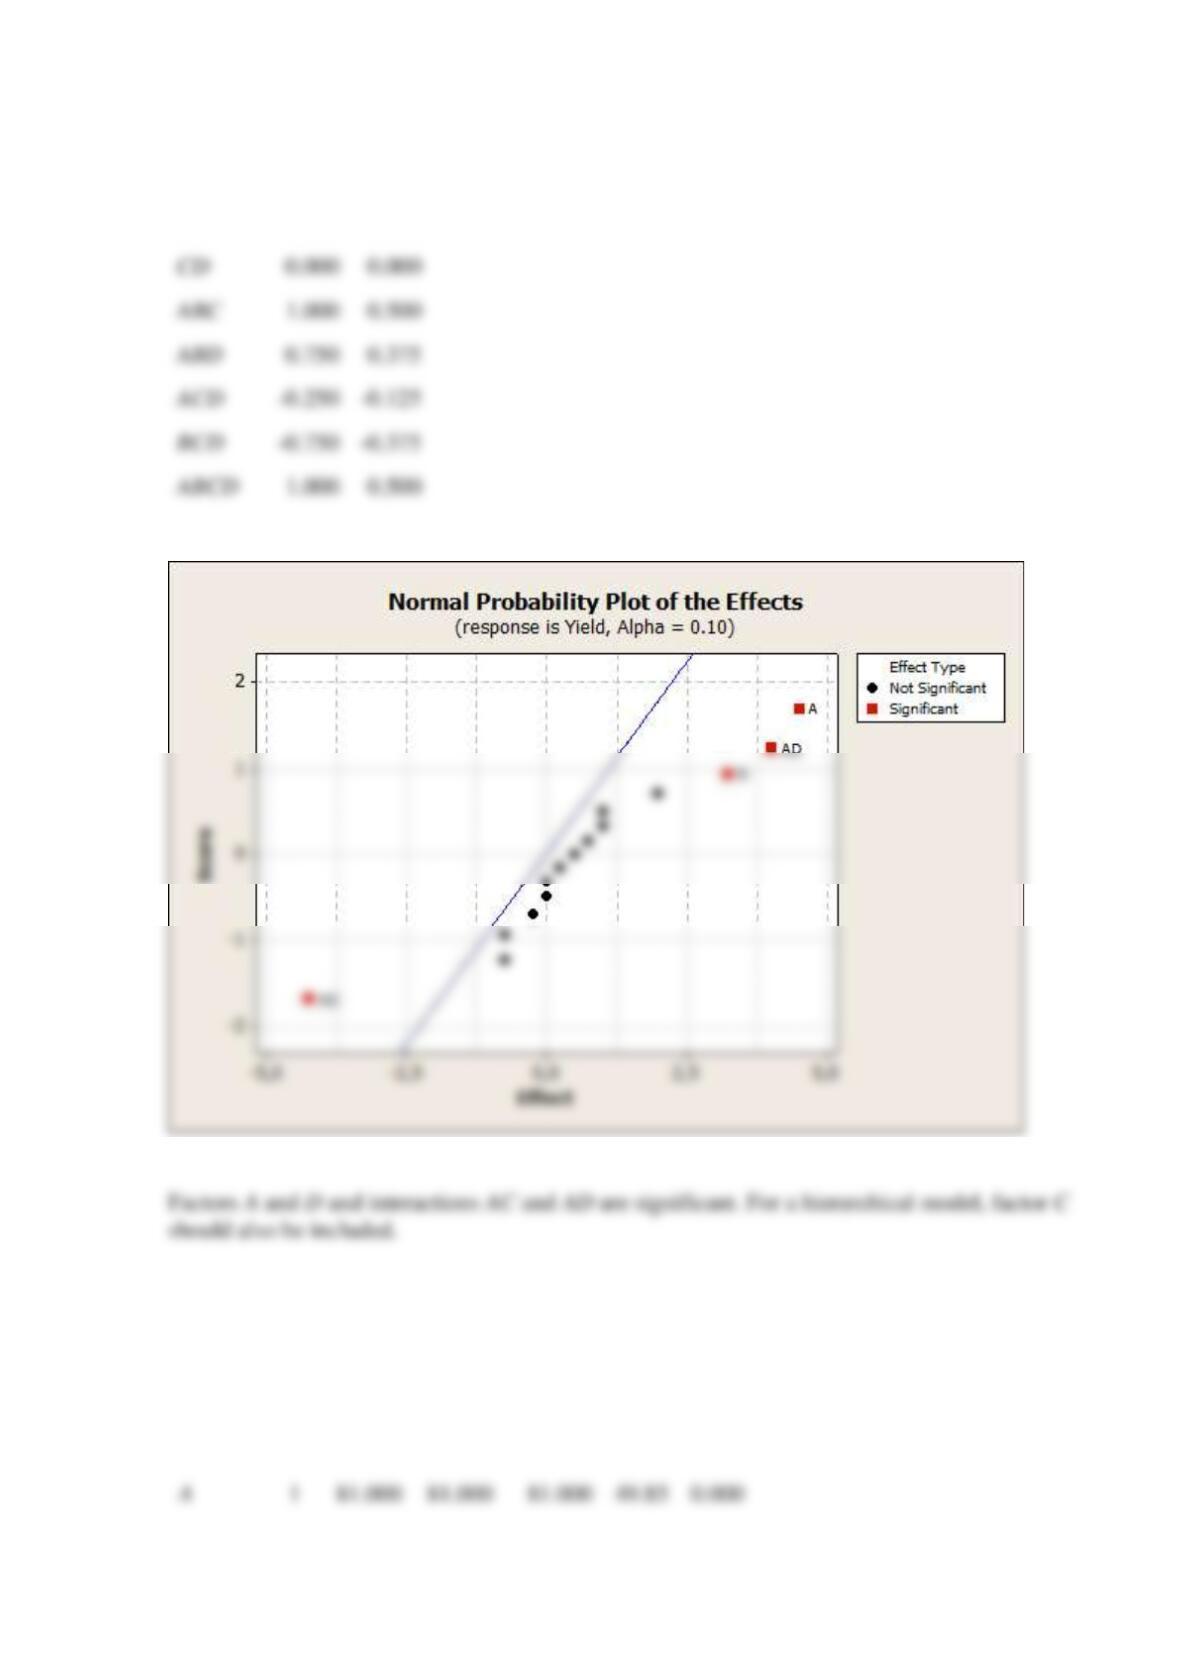
(a) Estimate the factor effects. Based on a normal probability plot of the effect estimates, identify
which factors and interactions are significant?
(b) Conduct an ANOVA, use the hierarchical model, which includes A, C, D factors and AC and
AD interactions. Which factors and interactions are significant at
0.05
=
?
(c) Find a regression model to predict yield in terms of the actual factor levels.
(d) Can this design be projected into a
3
2
design with two replicates?
SOLUTION
(a)
Term
Effect
Coef
Constant
17.375
A
4.500
2.250
B
0.500
0.250
C
2.000
1.000
D
3.250
1.625
-0.750
-0.375
AD
4.000
2.000
BC
0.250
0.125
BD
0.000
0.000
(b)
Analysis of Variance for yield, using Adjusted SS for Tests
Source
DF
Seq SS
Adj SS
Adj MS
F
P
ABC
1.000
0.500
ABD
0.750
0.375
-0.250
-0.125
-0.750
-0.375
1.000
0.500
C
1
16.000
16.000
16.000
9.85
0.011
D
1
42.250
42.250
42.250
26.00
0.000
(c)
The regression equation is
(d)
Reserve Problems Chapter 14 Section 6 Problem 4
A two-level factorial experiment in four factors was conducted by Chrysler and described in the
article “Sheet Molded Compound Process Improvement” by P. I. Hsieh and D. E. Goodwin
(Fourth Symposium on Taguchi Methods, American Supplier Institute, Dearborn, MI, 1986, pp.
13–21). The purpose was to reduce the number of defects in the finish of sheet-molded grill
opening panels. A portion of the experimental design, and the resulting number of defects,
i
y
observed on each run are shown in the following table. This is a single replicate of the
4
2
design.
Grill Defects Experiment
Run
A
B
C
D
y
y
1
–
–
–
–
56
7.48
2
+
–
–
–
17
4.12
3
–
+
–
–
2
1.41
4
+
+
–
–
4
2
1
72.250
72.250
72.250
44.46
0.000
1
64.000
64.000
64.000
39.38
0.000
16.250
16.250
291.750

5
–
–
+
–
3
1.73
6
+
–
+
–
4
2
7
–
+
+
–
50
7.07
8
+
+
+
–
2
1.41
9
–
–
–
+
1
1
10
+
–
–
+
0
0
11
–
+
–
+
3
1.73
12
+
+
–
+
12
3.46
13
–
–
+
+
3
1.73
14
+
–
+
+
4
2
15
–
+
+
+
0
0
16
+
+
+
+
0
0
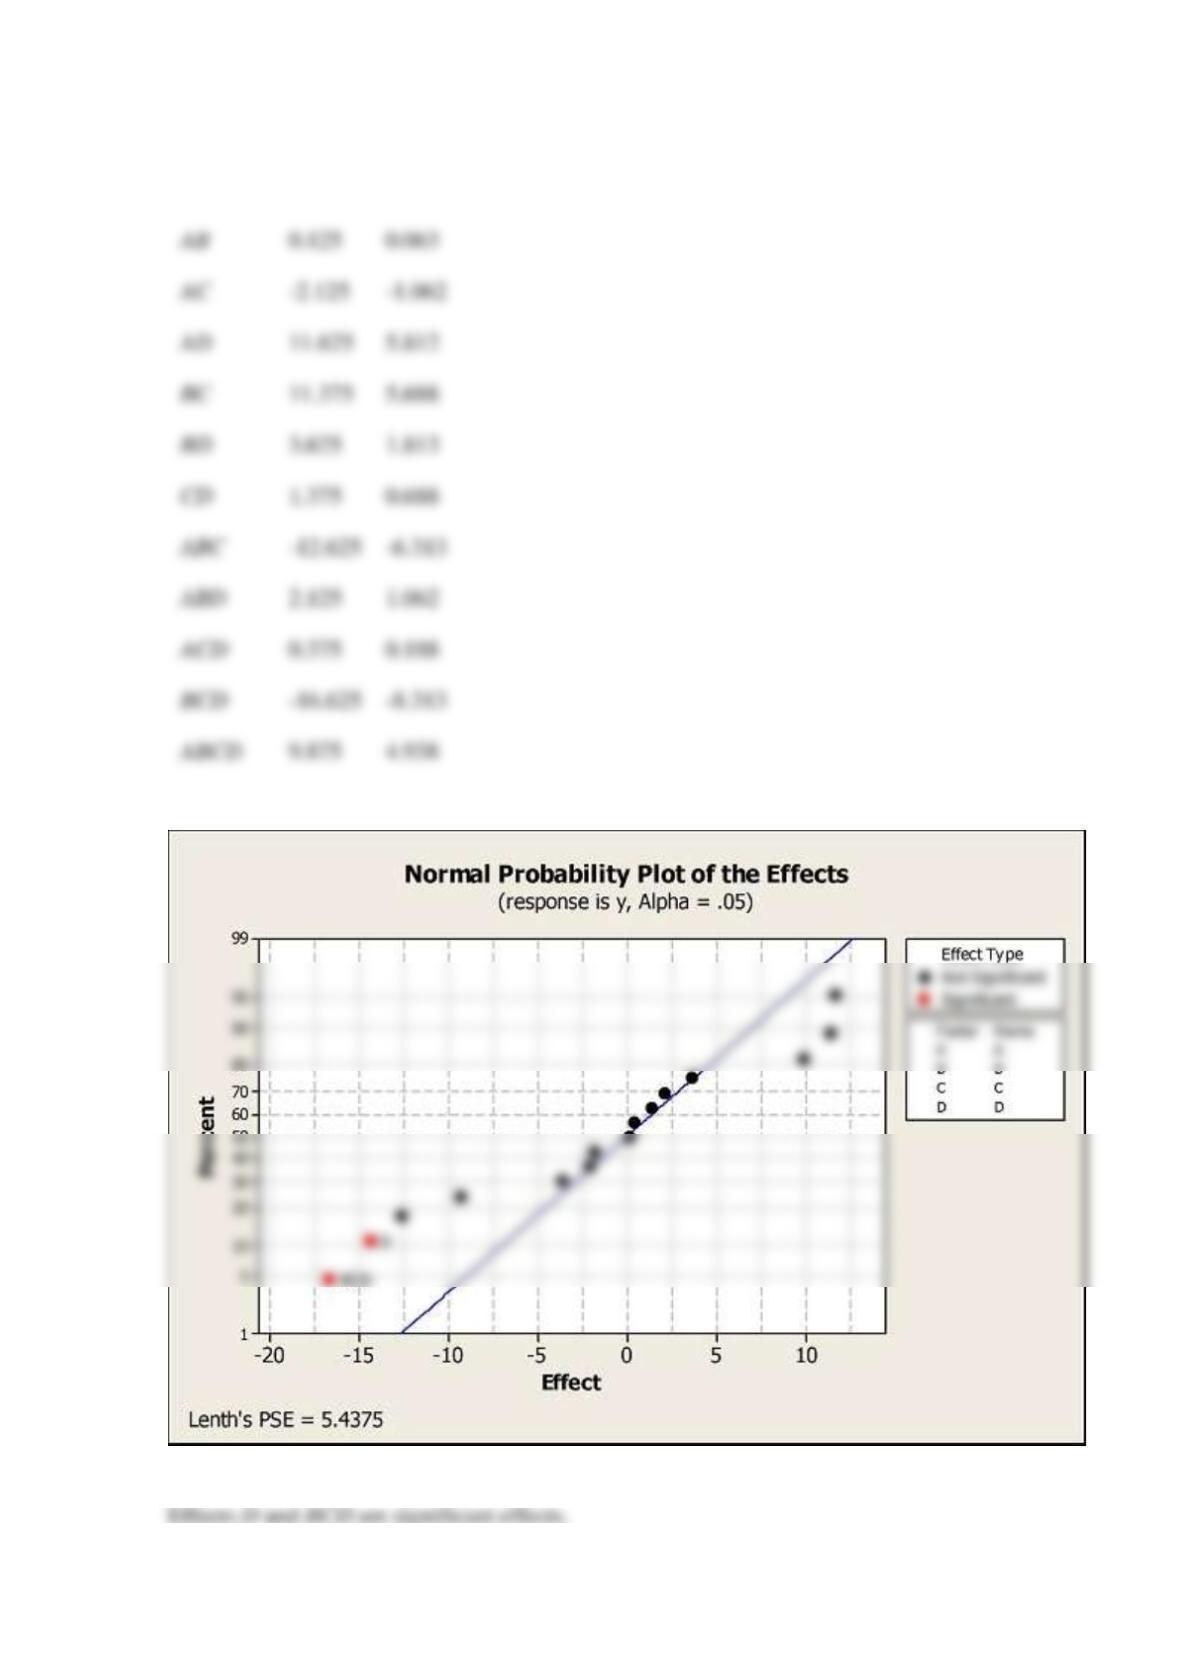
(a) Estimate the factor effects and use a normal probability plot to tentatively identify the
important factors.
(b) Fit an appropriate model using the factors identified in part (a)
(c) Use the residuals versus the predicted number of defects plot and a normal probability plot of
the residuals to comment the adequacy of this model.
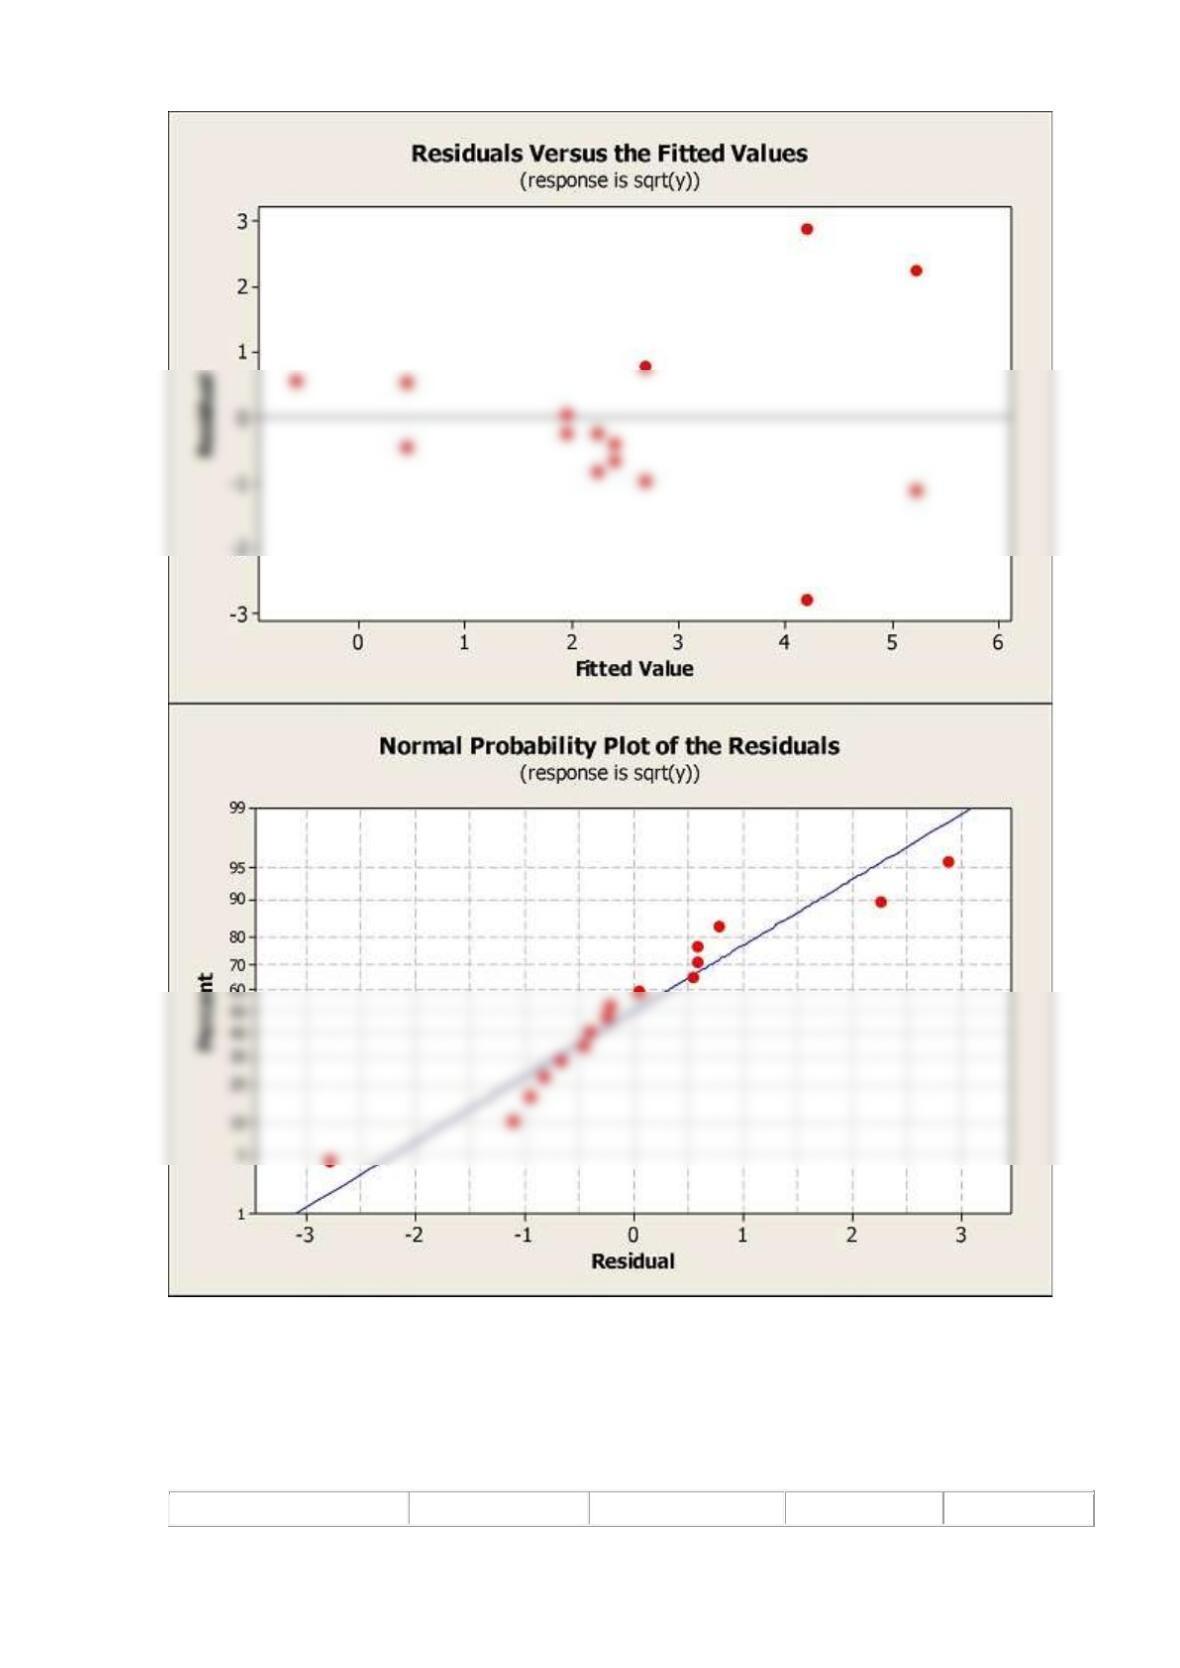
(d) The table also shows the square root of the number of defects. Use a normal probability plot
to identify the important factors using the square root of the number of defects as the response.
Use the residuals versus square root of the number of defects plot and a normal probability plot
of the residuals to comment the adequacy of this model.
SOLUTION
(a)
Estimated Effects and Coefficients for y (coded units)
Term
Effect
Coef
Constant
10.063
C
-3.625
-1.813
D
-14.375
-7.188
0.125
0.063
11.625
5.812
11.375
5.688
3.625
1.813
1.375
0.688
-12.625
-6.313
2.125
1.062
ACD
0.375
0.188
BCD
-16.625
-8.313
ABCD
9.875
4.938

(b)
(c)

(d)
Estimated Effects and Coefficients for
y
(coded units)
Term
Effect
Coef
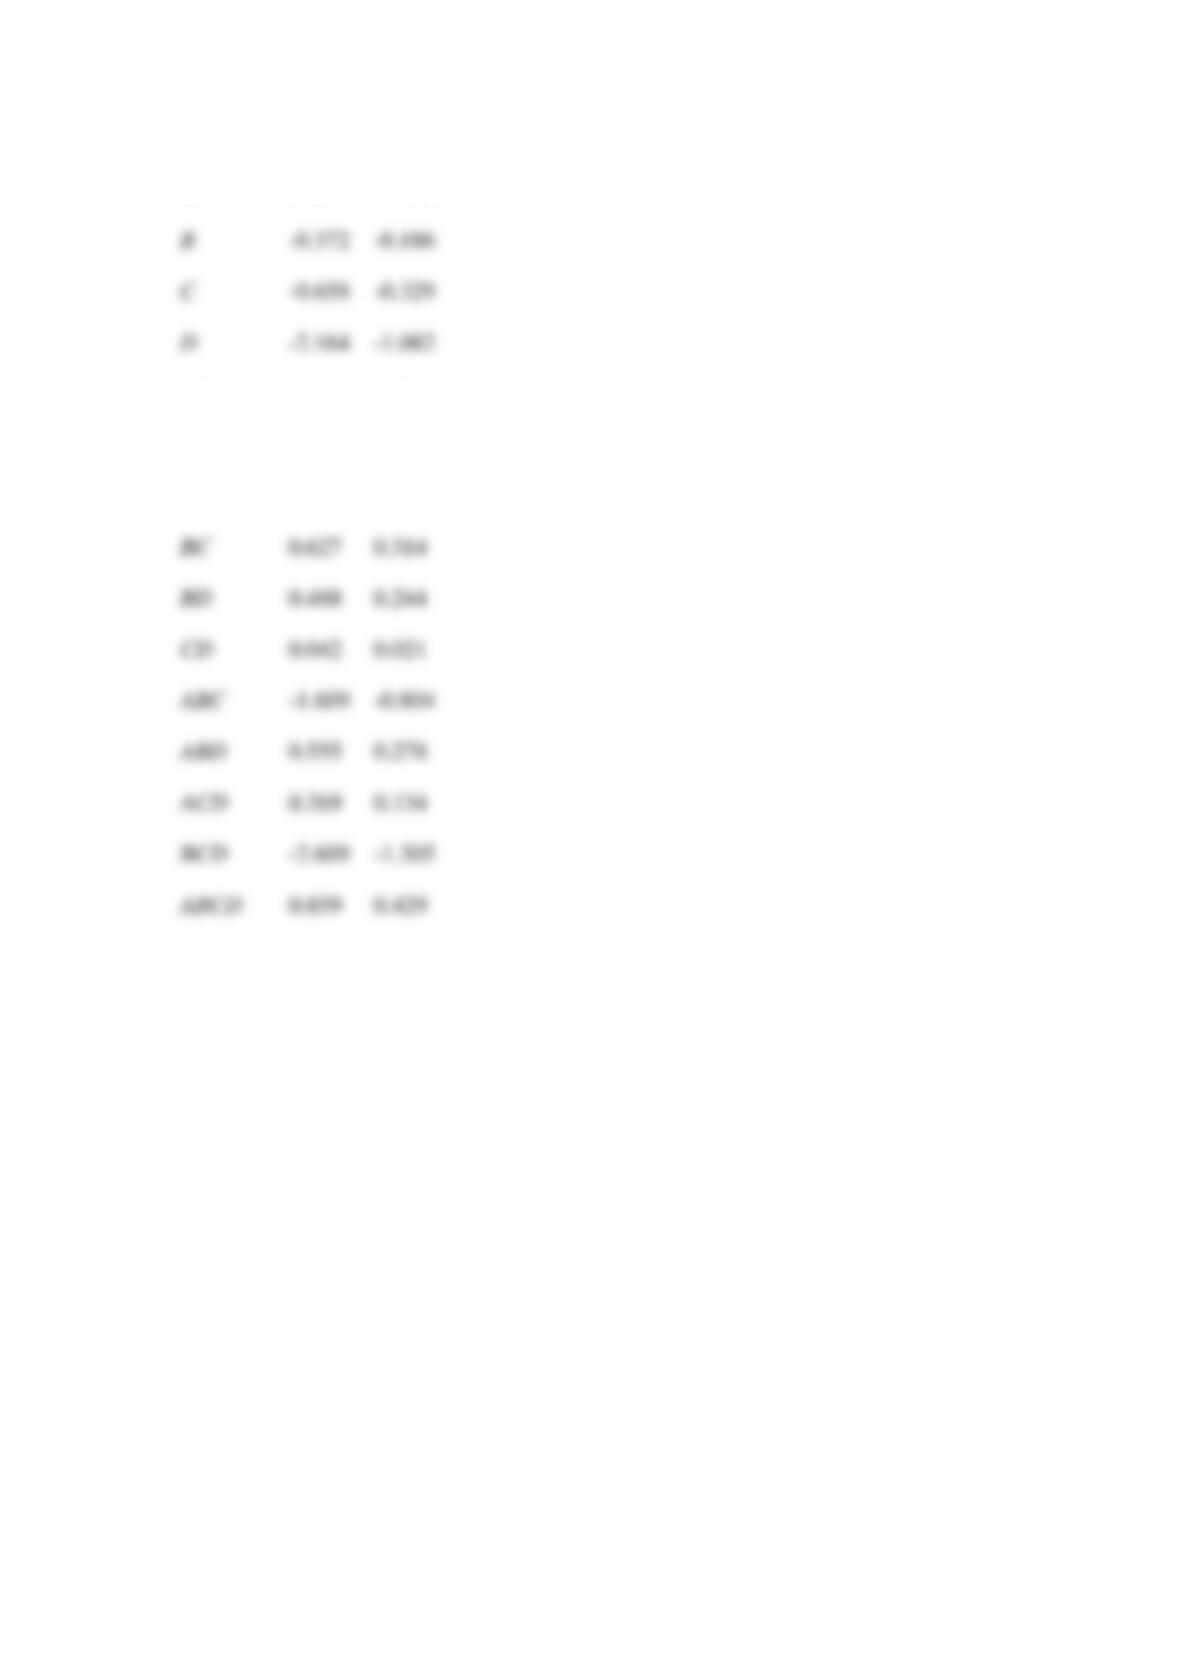
Constant
2.323
A
-0.895
-0.448
AB
0.061
0.030
AC
-0.385
-0.192
AD
1.145
0.573
BC
0.627
0.314
BD
0.488
0.244
0.042
0.021
ABC
-1.609
-0.804
ABD
0.555
0.278
ACD
0.269
0.134
BCD
-2.609
-1.305
ABCD
0.859
0.429
B
-0.372
-0.186
C
D
-2.164
-1.082
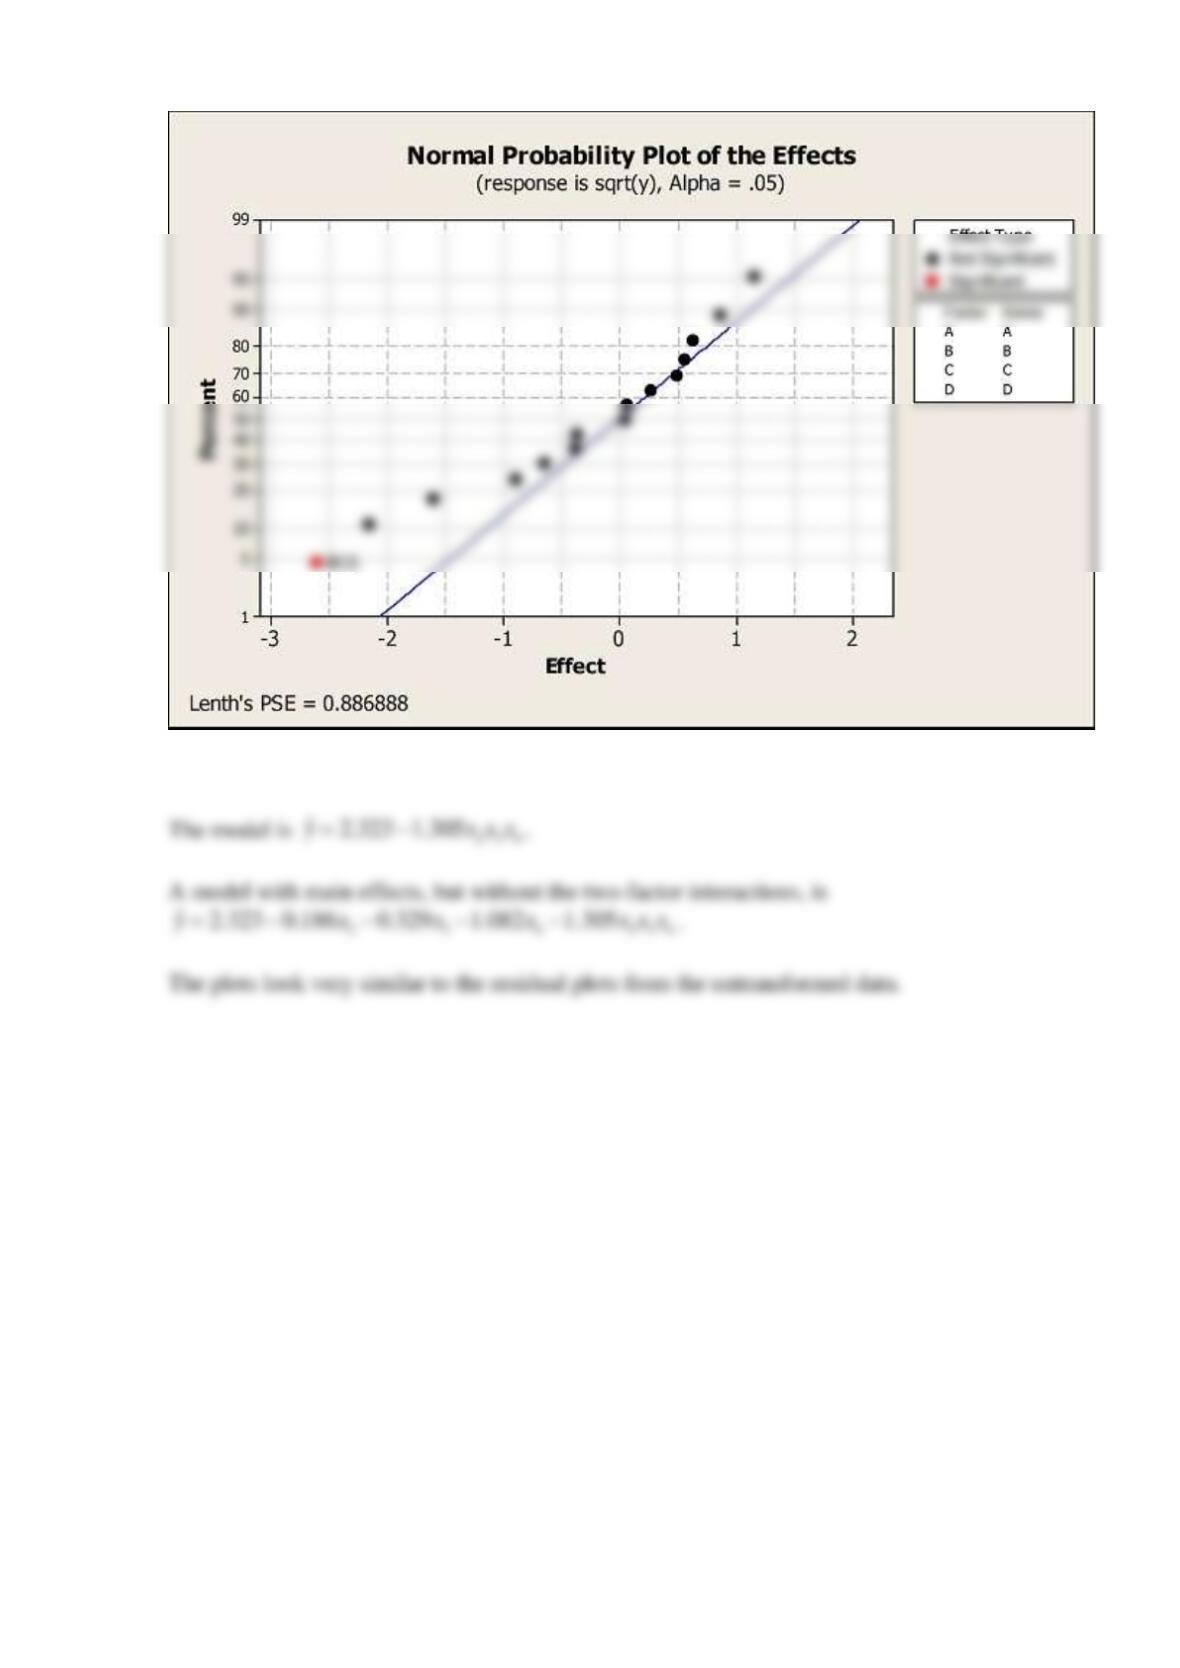
From the normal probability plot, only BCD is a significant effect.
Reserve Problems Chapter 14 Section 7 Problem 1
An article in the Fuel (“Optimization of Reactive Extraction of Castor Seed to Produce Biodiesel
Using Response Surface Methodology,” Vol. 2012) considered the effects of the following four
factors on FAME (fatty acid methyl esters) yield (%) of biodiesel.
A
B
C
D
Catalyst Concentration
(%)
Methanol/Oil
Ratio
Mixing Intensity
(rpm)
Temperature
(C)
FAME Yield
(%)
0.75
162.5
225
50
51.2
1.25
162.5
225
50
61
0.75
287.5
225
50
78.2
1.25
287.5
225
50
75.5
0.75
162.5
475
50
54
1.25
162.5
475
50
65.9
0.75
287.5
475
50
81.1
1.25
287.5
475
50
82.2
0.75
162.5
225
60
49.5
1.25
162.5
225
60
60
0.75
287.5
225
60
90.2
1.25
287.5
225
60
86
0.75
162.5
475
60
53.2
1.25
162.5
475
60
64.4
0.75
287.5
475
60
97.2
1.25
287.5
475
60
93
The article provided additional center point runs with the following values: 88.3, 88.2, 88.4,
88.2, 88.4, 88.2.
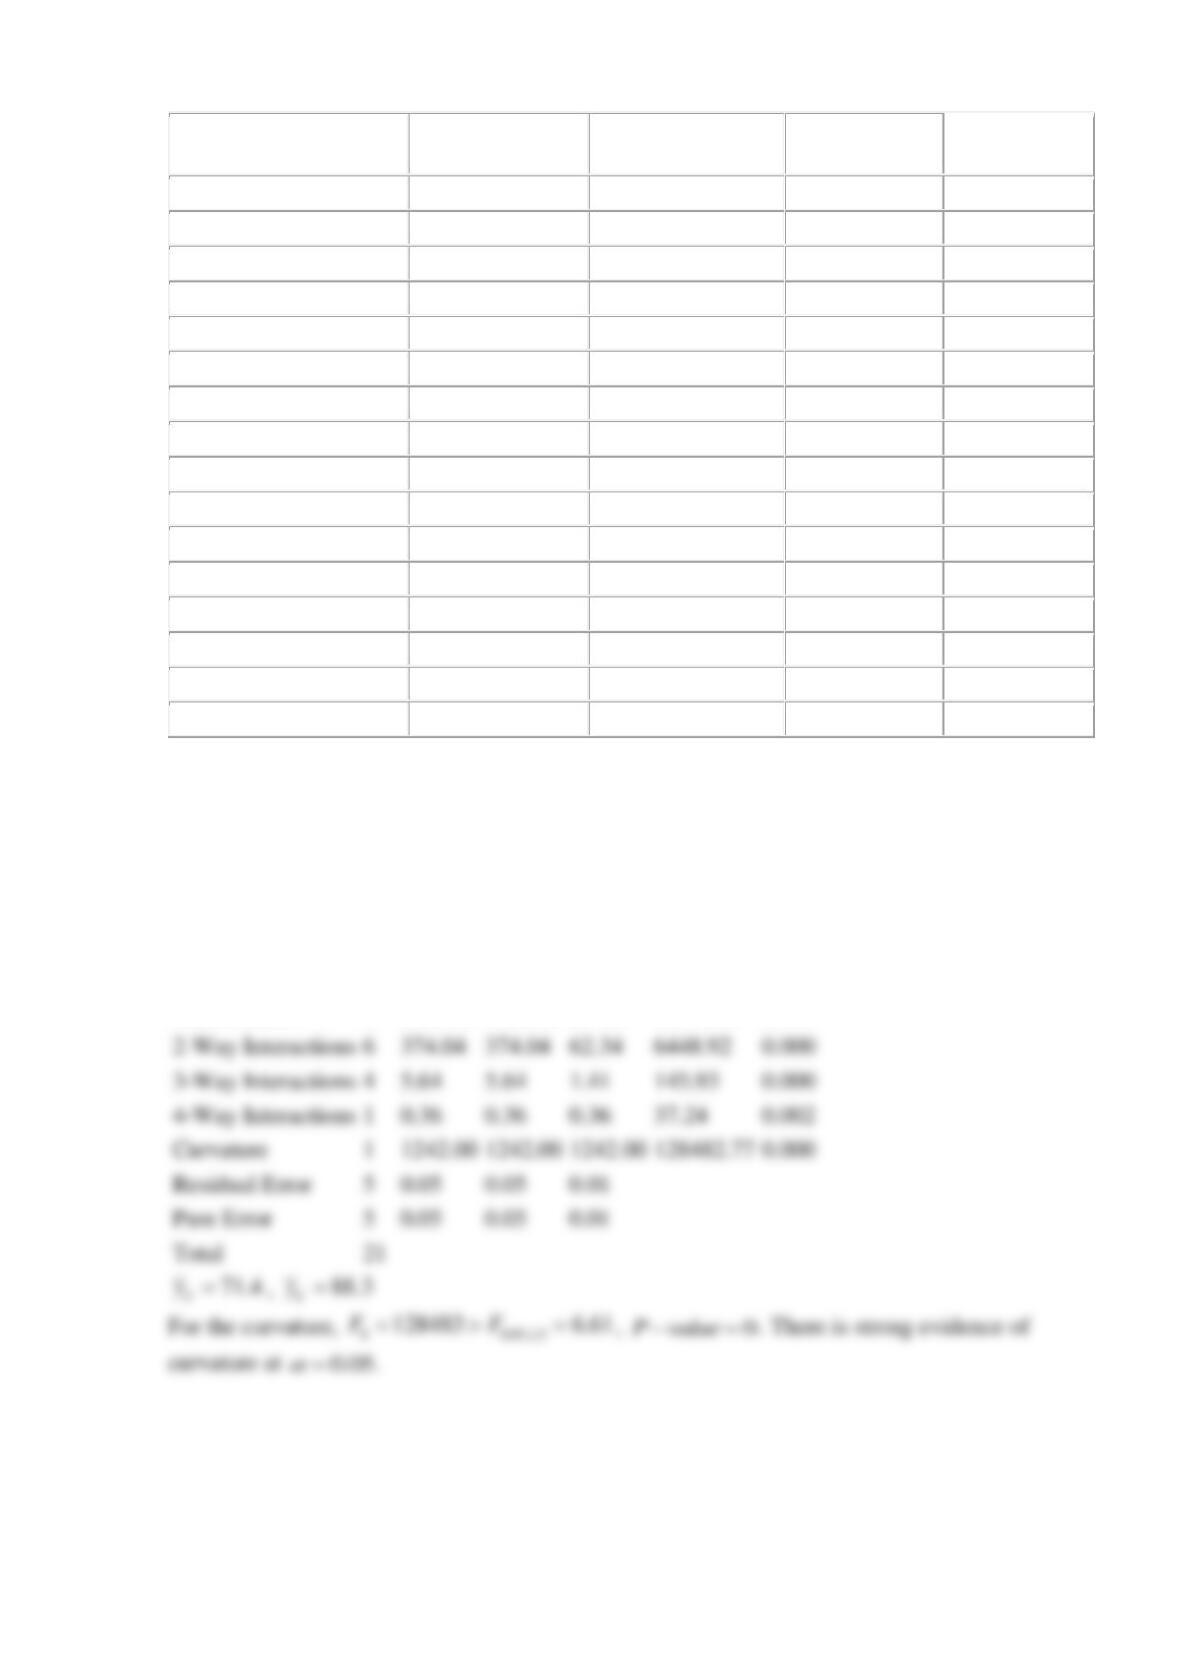
Compute an ANOVA with the sum of squares for curvature and conduct an F-test for curvature.
Use α = 0.05.
SOLUTION
Analysis of Variance for Yield (coded units)
Source
DF
Seq SS
Adj SS
Adj MS
F
P
Main Effects
4
3431.56
3431.56
857.89
88747.18
0.000
Reserve Problems Chapter 14 Section 7 Problem 2
2-Way Interactions
6
374.04
374.04
62.34
6448.92
0.000
3-Way Interactions
4
5.64
5.64
1.41
145.93
0.000
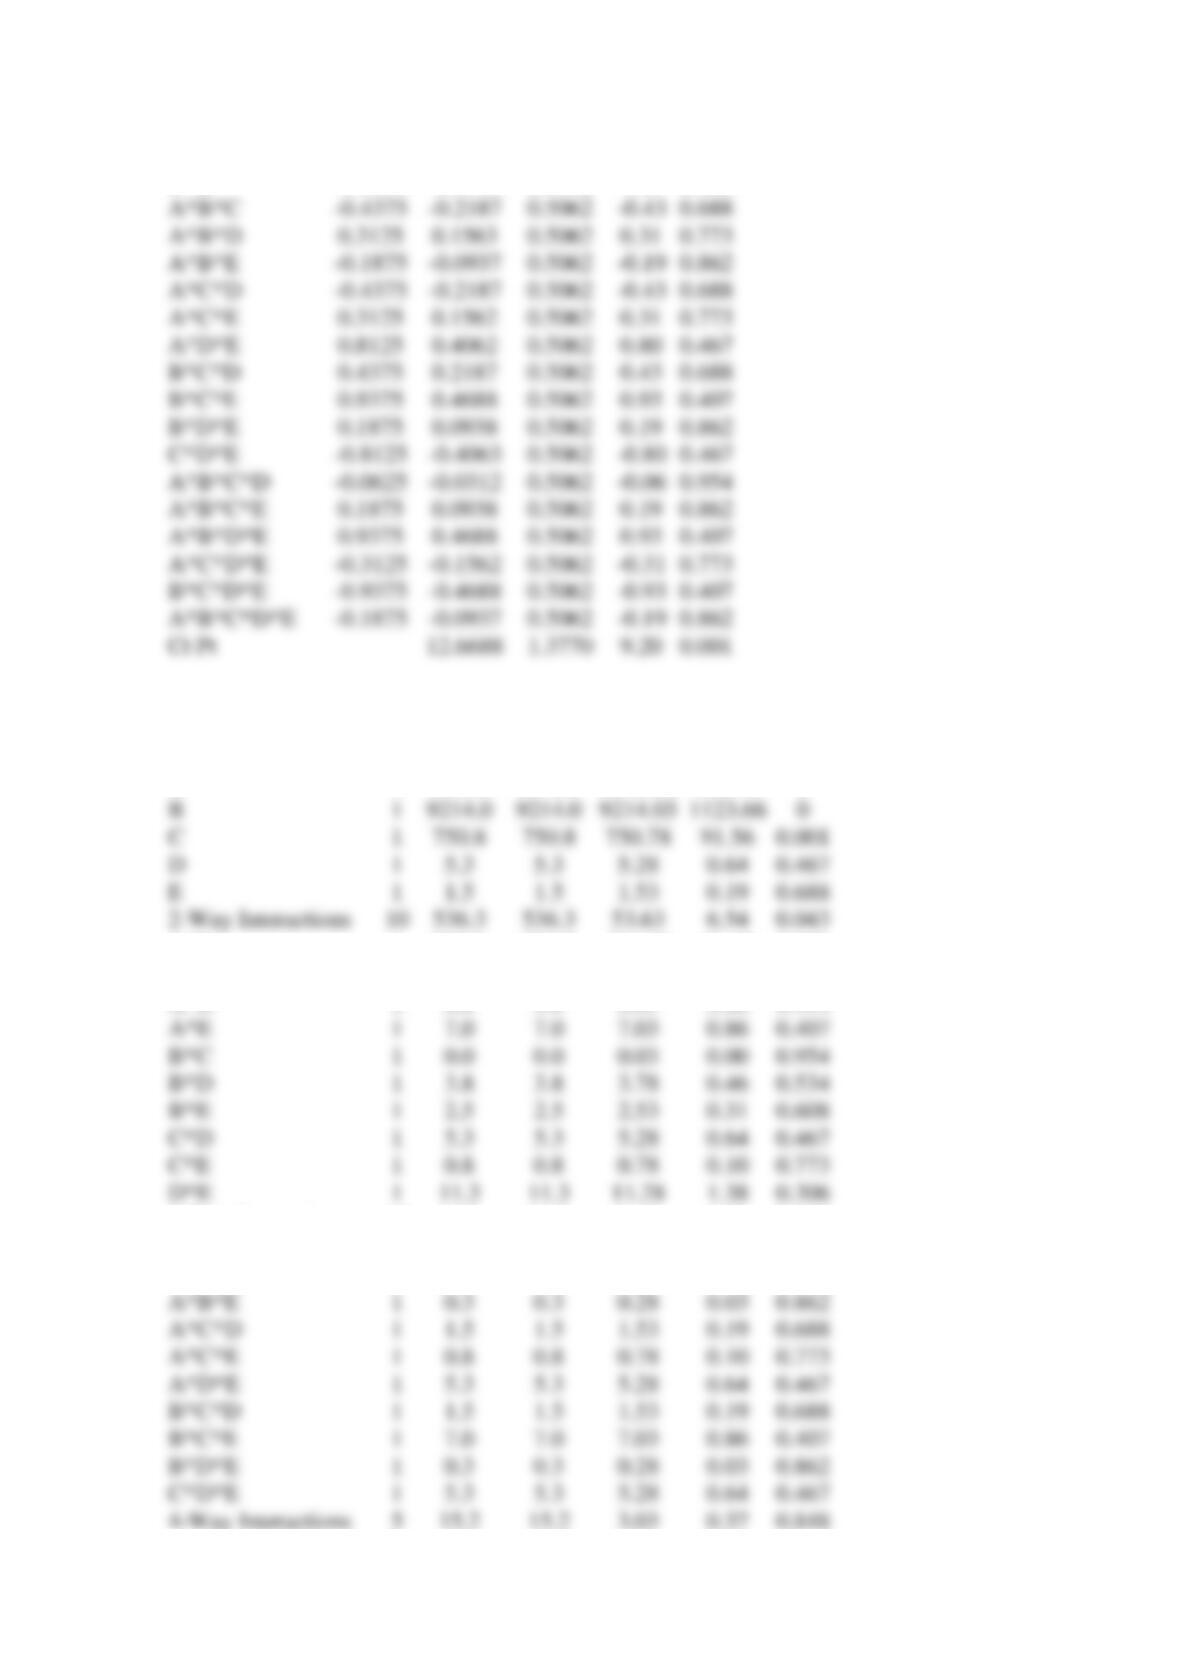
4-Way Interactions
1
0.36
0.36
0.36
37.24
0.002
Curvature
1
1242.00
1242.00
1242.00
128482.77
0.000
Residual Error
5
0.05
0.05
0.01
Pure Error
5
0.05
0.05
0.01
Total
21

An experiment was run in a semiconductor fabrication plant in an effort to increase yield. Five
factors, each at two levels, were studied. The factors (and levels) were A = aperture setting
(small, large), B = exposure time (20% below nominal, 20% above nominal), C = development
time (30 and 45 seconds), D = mask dimension (small, large), and E = etch time (14.5 and 15.5
minutes). The following unreplicated
5
2
design was run:
( )
1
=
7
e
=
8
a
=
9
ae
=
12
b
=
34
be
=
35
ab
=
55
abe
=
52
c
=
16
ce
=
15
ac
=
20
ace
=
22
bc
=
40
bce
=
45
abc
=
60
abce
=
65
d
=
8
de
=
6
ad
=
10
ade
=
10
bd
=
32
bde
=
30
abd
=
50
abde
=
53
cd
=
18
cde
=
15
acd
=
21
acde
=
20
bcd
=
44
bcde
=
41
abcd
=
61
abcde
=
63
Suppose that a center point with five replicates is added to the factorial runs and the responses
are 45, 40, 41, 47, and 43.
(a) Estimate the experimental error using the center points. Compare this to the estimate obtained
by pooling out apparently nonsigninficant effects.
(b) Test for curvature with
0.05
=
.
SOLUTION
(a)
Estimated Effects and Coefficients for y (coded units)
Term
Effect
Coef
SE Coef
T
P
Constant
30.5313
0.5062
60.31
0.000
A
11.8125
5.9063
0.5062
11.67
0.000
B
33.9375
16.9687
0.5062
33.52
0.000
C
9.6875
4.8438
0.5062
9.57
0.001
D
0.5062
-0.80
0.467
E
0.4375
0.2188
0.5062
0.43
0.688
A*B
7.9375
3.9687
0.5062
7.84
0.001
A*C
0.4375
0.2187
0.5062
0.43
0.688
A*D
0.5062
-0.06
0.954
A*E
0.9375
0.4688
0.5062
0.93
0.407
C*D
0.8125
0.4062
0.5062
0.80
0.467
C*E
0.3125
0.1563
0.5062
0.31
0.773
D*E
-1.1875
-0.5938
0.5062
-1.17
0.306
Analysis of Variance for y (coded units)
Source
DF
Seq SS
Adj SS
Adj MS
F
P
Main Effects
5
11087.9
11087.9
2217.58
270.44
0
A
1
1116.3
1116.3
1116.28
136.13
0
B
1
9214.0
9214.0
9214.03
1123.66
0
C
1
750.8
750.8
750.78
91.56
0.001
D
1
5.3
5.3
5.28
0.64
0.467
E
1
1.5
1.5
1.53
0.19
0.688
2-Way Interactions
10
536.3
536.3
53.63
6.54
0.043
A*B
1
504.0
504.0
504.03
61.47
0.001
A*C
1
1.5
1.5
1.53
0.19
0.688
A*D
1
0.0
0.0
0.03
0.00
0.954
A*E
1
7.0
7.0
7.03
0.86
0.407
B*C
1
0.0
0.0
0.03
0.00
0.954
B*D
1
3.8
3.8
3.78
0.46
0.534
B*E
1
2.5
2.5
2.53
0.31
0.608
C*D
1
5.3
5.3
5.28
0.64
0.467
C*E
1
0.8
0.8
0.78
0.10
0.773
D*E
1
11.3
11.3
11.28
1.38
0.306
3-Way Interactions
10
24.3
24.3
2.43
0.30
0.946
A*B*C
1
1.5
1.5
1.53
0.19
0.688
A*B*D
1
0.8
0.8
0.78
0.10
0.773
A*B*E
1
0.3
0.3
0.28
0.03
0.862
A*C*D
1
1.5
1.5
1.53
0.19
0.688
A*C*E
1
0.8
0.8
0.78
0.10
0.773
A*D*E
1
5.3
5.3
5.28
0.64
0.467
B*C*D
1
1.5
1.5
1.53
0.19
0.688
B*C*E
1
7.0
7.0
7.03
0.86
0.407
A*B*C
-0.4375
-0.2187
0.5062
-0.43
0.688
A*B*D
0.3125
0.1563
0.5062
0.31
0.773
A*B*E
-0.1875
-0.0937
0.5062
-0.19
0.862
A*C*D
-0.4375
-0.2187
0.5062
-0.43
0.688
A*C*E
0.3125
0.1562
0.5062
0.31
0.773
A*D*E
0.8125
0.4062
0.5062
0.80
0.467
B*C*D
0.4375
0.2187
0.5062
0.43
0.688
B*C*E
0.9375
0.4688
0.5062
0.93
0.407
B*D*E
0.1875
0.0938
0.5062
0.19
0.862
C*D*E
-0.8125
-0.4063
0.5062
-0.80
0.467
A*B*C*D
-0.0625
-0.0312
0.5062
-0.06
0.954
A*B*C*E
0.1875
0.0938
0.5062
0.19
0.862
A*B*D*E
0.9375
0.4688
0.5062
0.93
0.407
A*C*D*E
-0.3125
-0.1562
0.5062
-0.31
0.773
B*C*D*E
-0.9375
-0.4688
0.5062
-0.93
0.407
A*B*C*D*E
-0.1875
-0.0937
0.5062
-0.19
0.862
Ct Pt
12.6688
1.3770
9.20
0.001