
CHAPTER 14 RESERVE PROBLEMS
Please note that the values in the problem statements for this chapter may not be consistent with
the values that appear in your evaluation copy.
The following problems have been reserved for your use in assignments and testing and do not
appear in student versions of the text.
Reserve Problems Chapter 14 Section 3 Problem 1
Brands of lacrosse helmets were compared for severity from front and back impacts. Impacts
were measured with the Gadd Severity Index (where higher scores imply more severe impacts).
A reduced dataset provides three replicates for each of four brands and impact locations.
Location
Brand
Front
Back
1
1033.12
894.646
1348.208
902.892
1071.822
1010.01
2
1077.465
1113.792
1067.588
1087.07
881.427
1188.106
3
613.375
1526.328
1144.626
1551.818
1013.652
1572.681
4
1387.522
1710.564
1332.813
1543.174
1142.812
1652.74
(a) State the hypotheses of interest:
(b) Test the hypothesis in part (a) using the analysis of variance with
0.05
=
. What are your
conclusions?
(c) Analyze the residuals from this experiment.
(d) Using Fisher’s LSD method, investigate the differences between the mean impact severity for
the four brands. Use
0.05
=
.
SOLUTION
(a) The hypotheses of interest are:
(b)
2.
015.54f=
,
0.05,1,16 4.49f=
3.
010.19f=
,
0.05,3,16 3.24f=
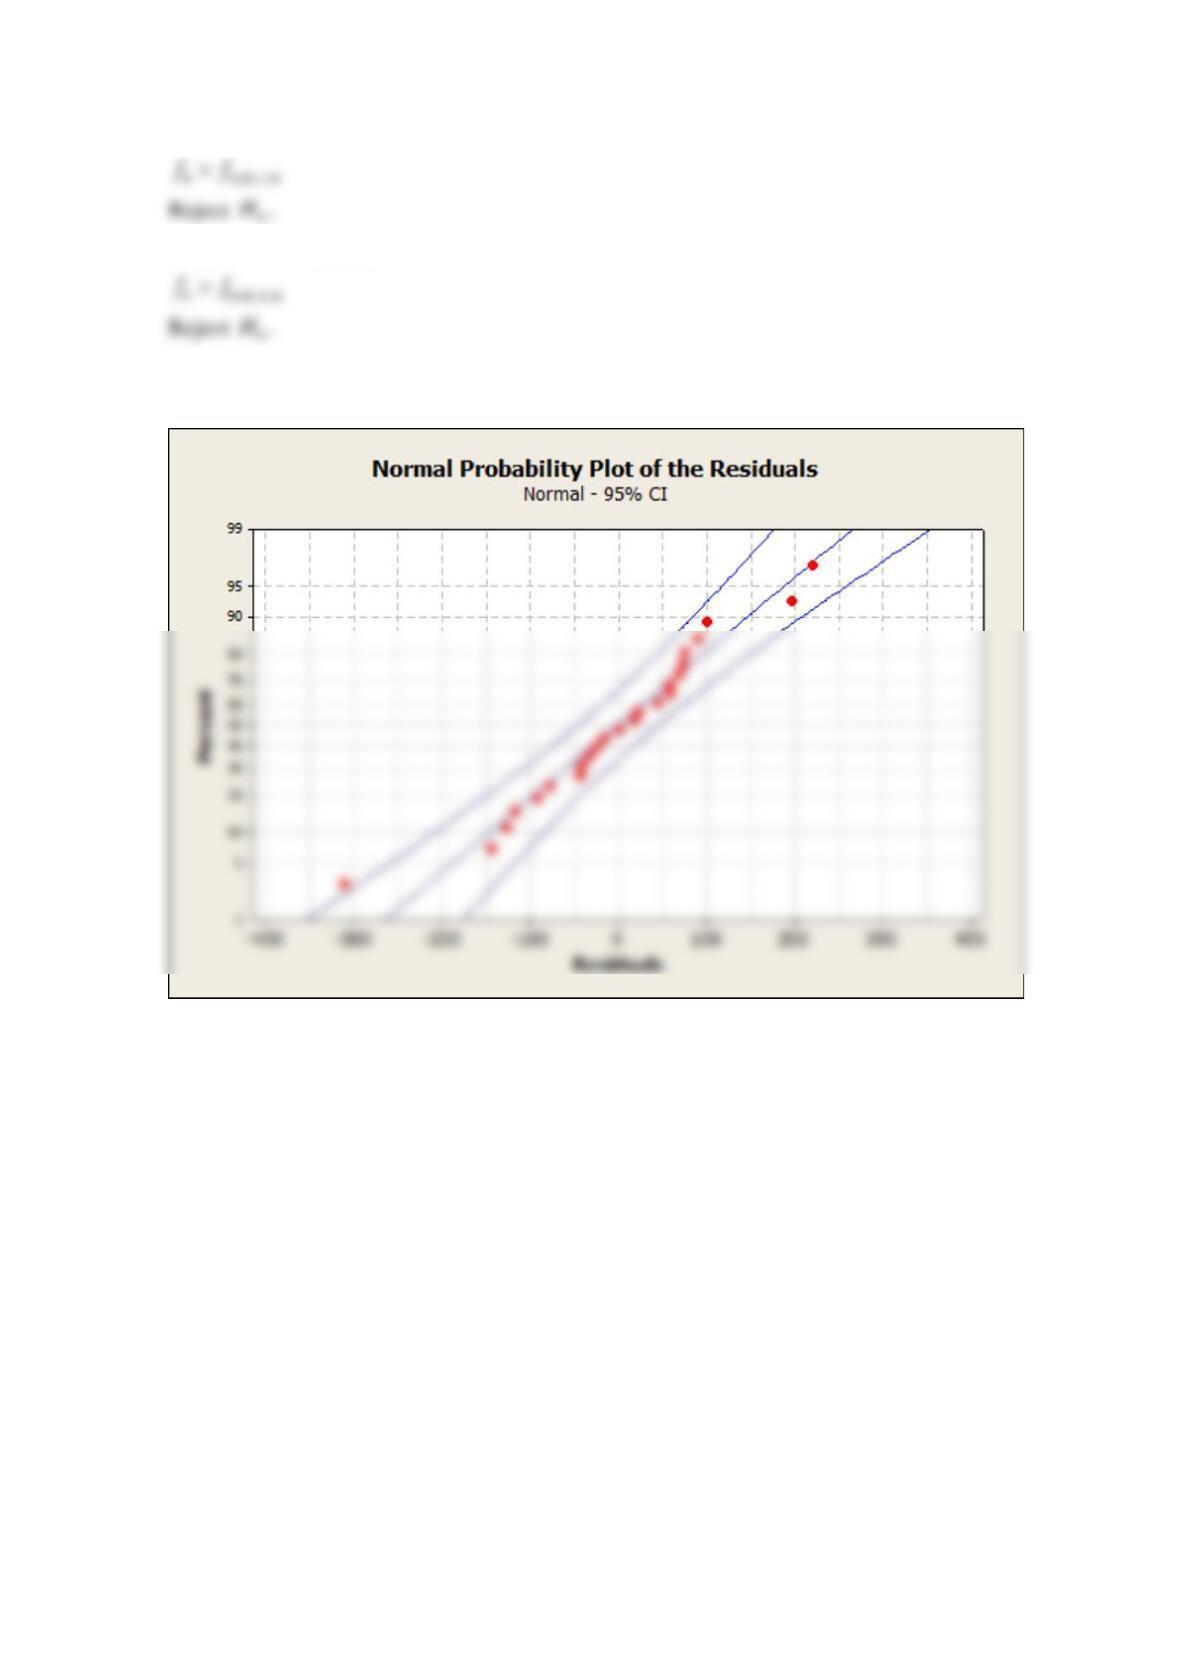
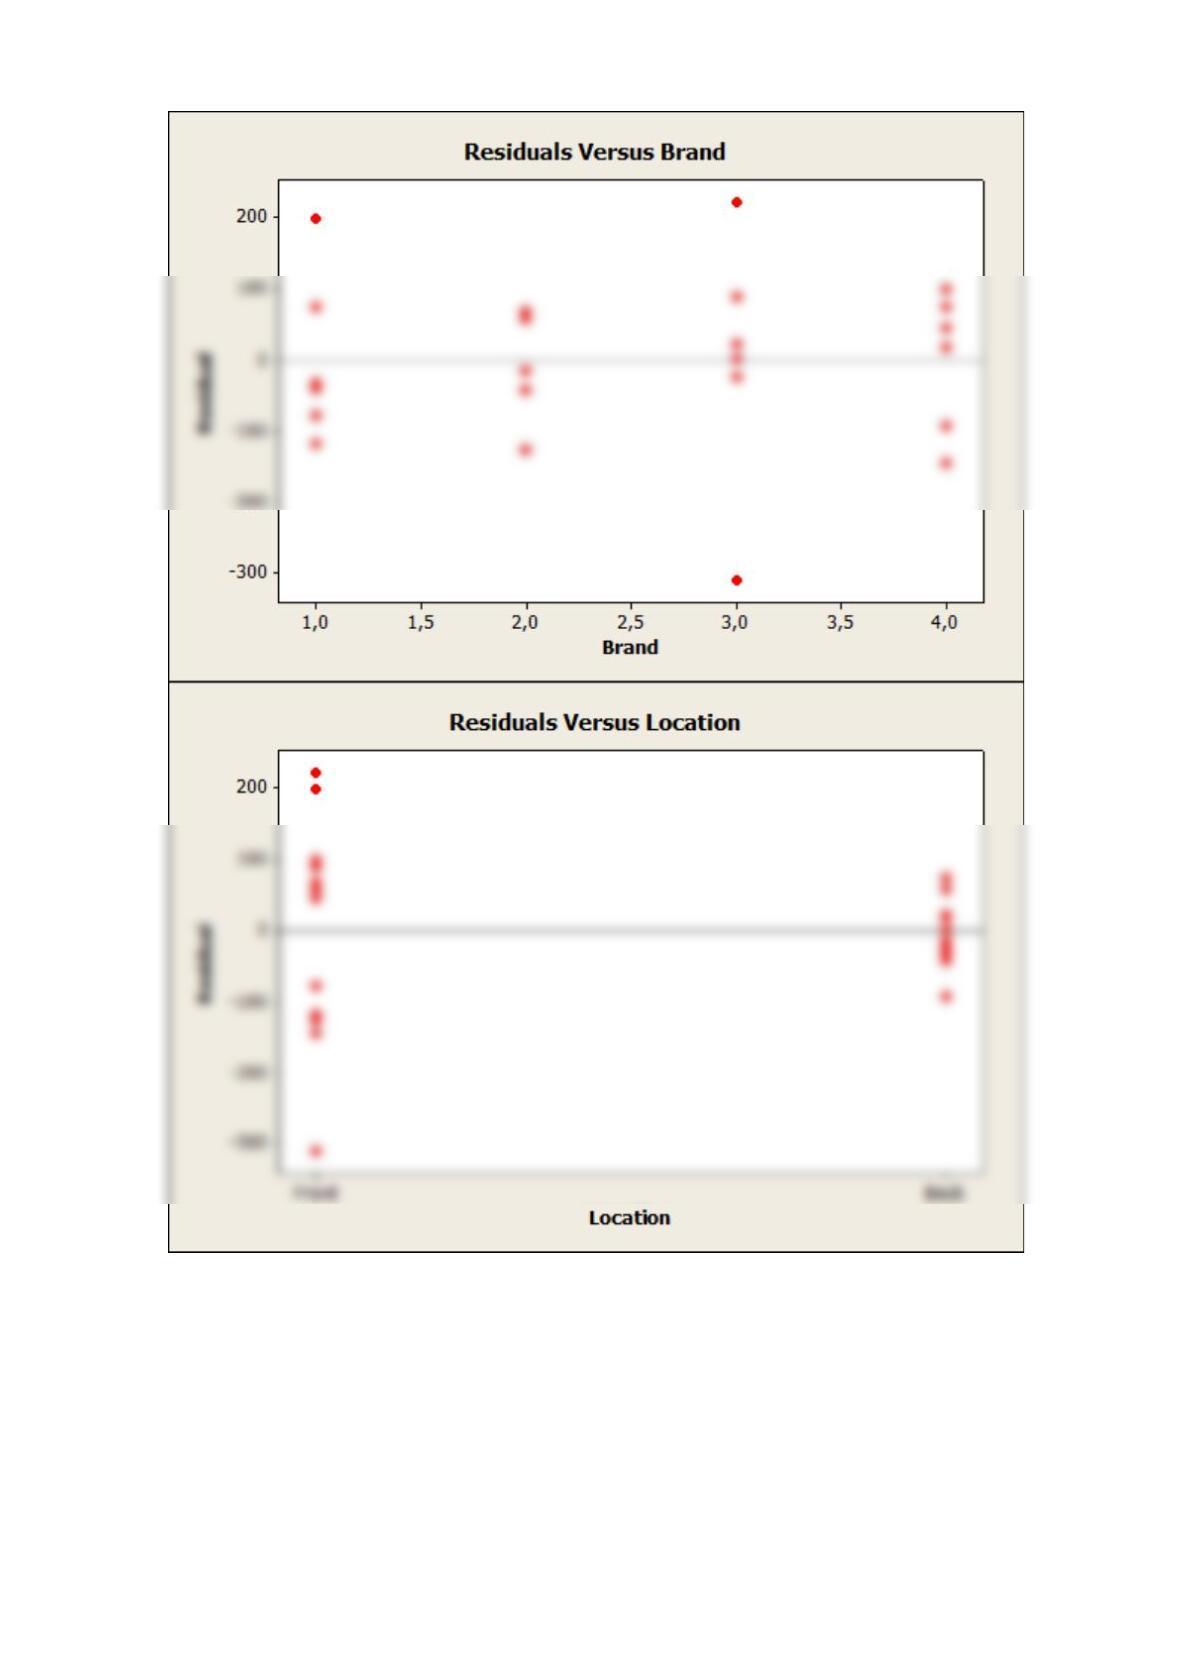
(c)
There appears to be more variability at the front location. The normal plot of the residuals
indicates that the assumption of normality is reasonable.
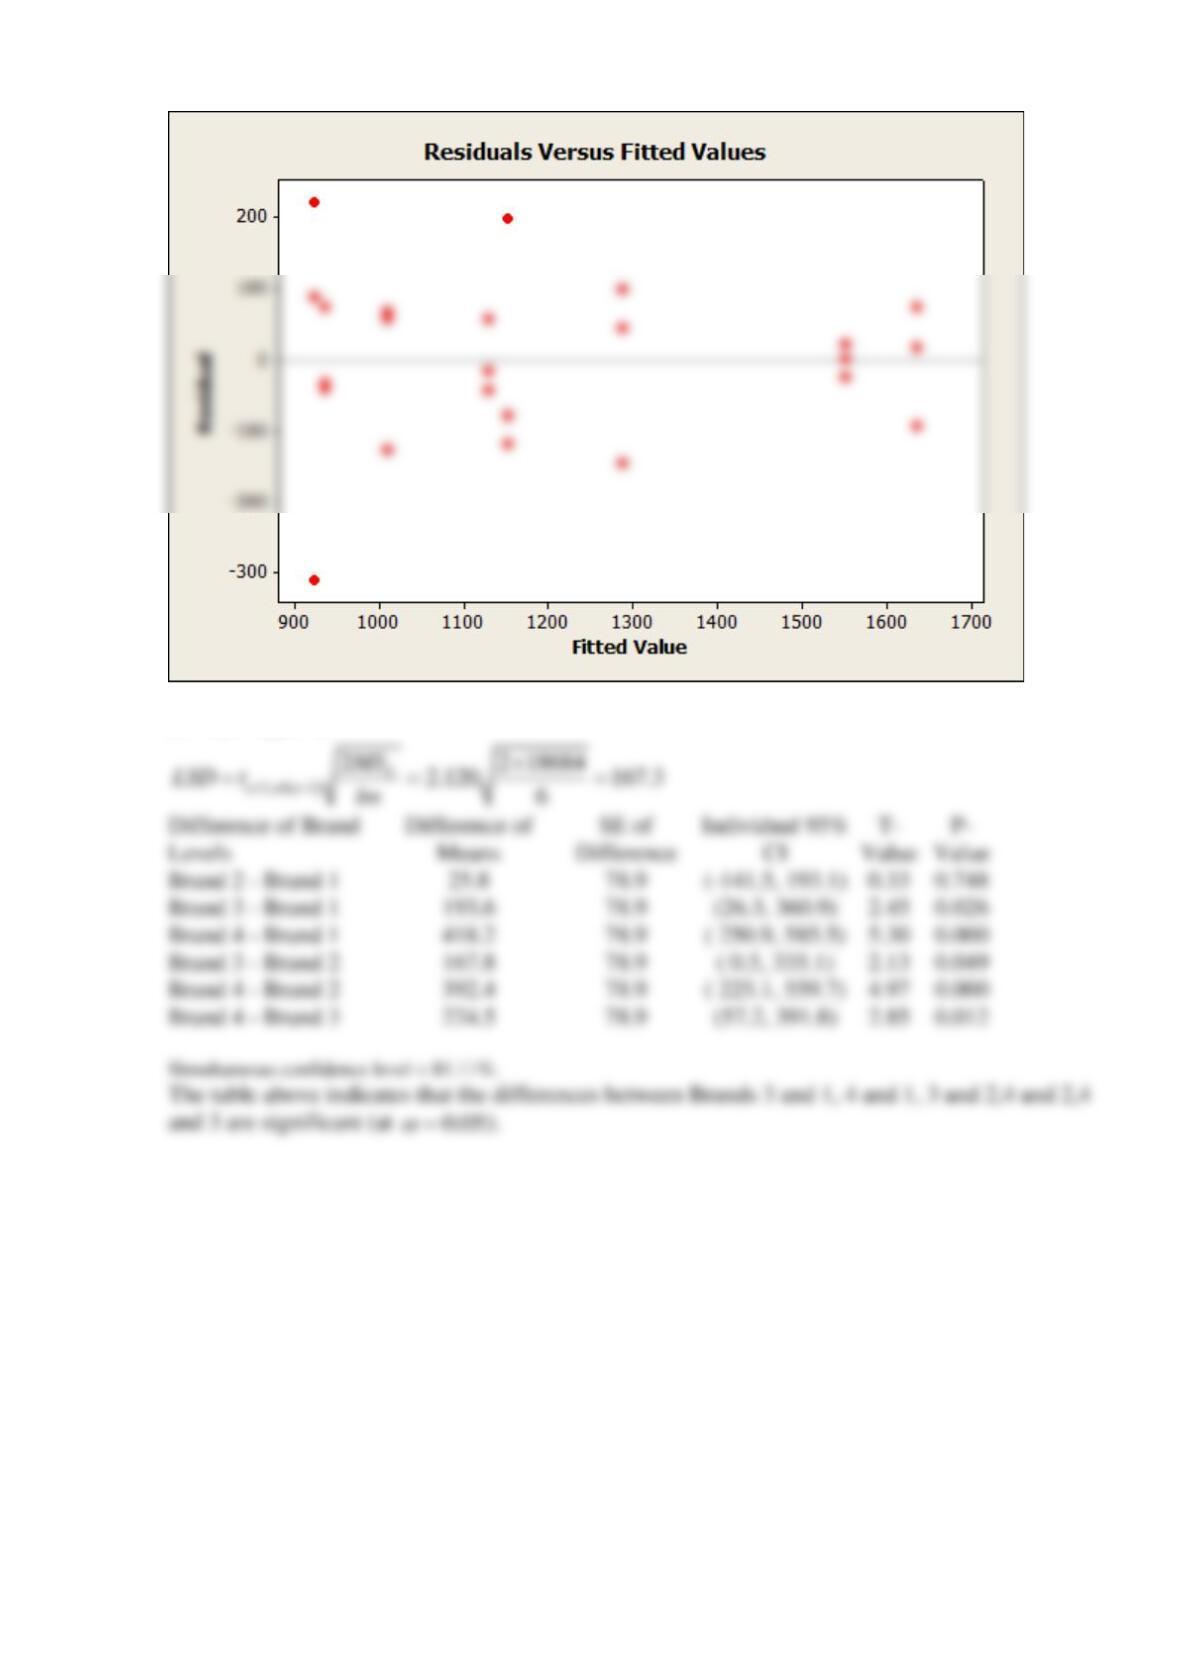
(d)
4, 2, 3a b n= = =
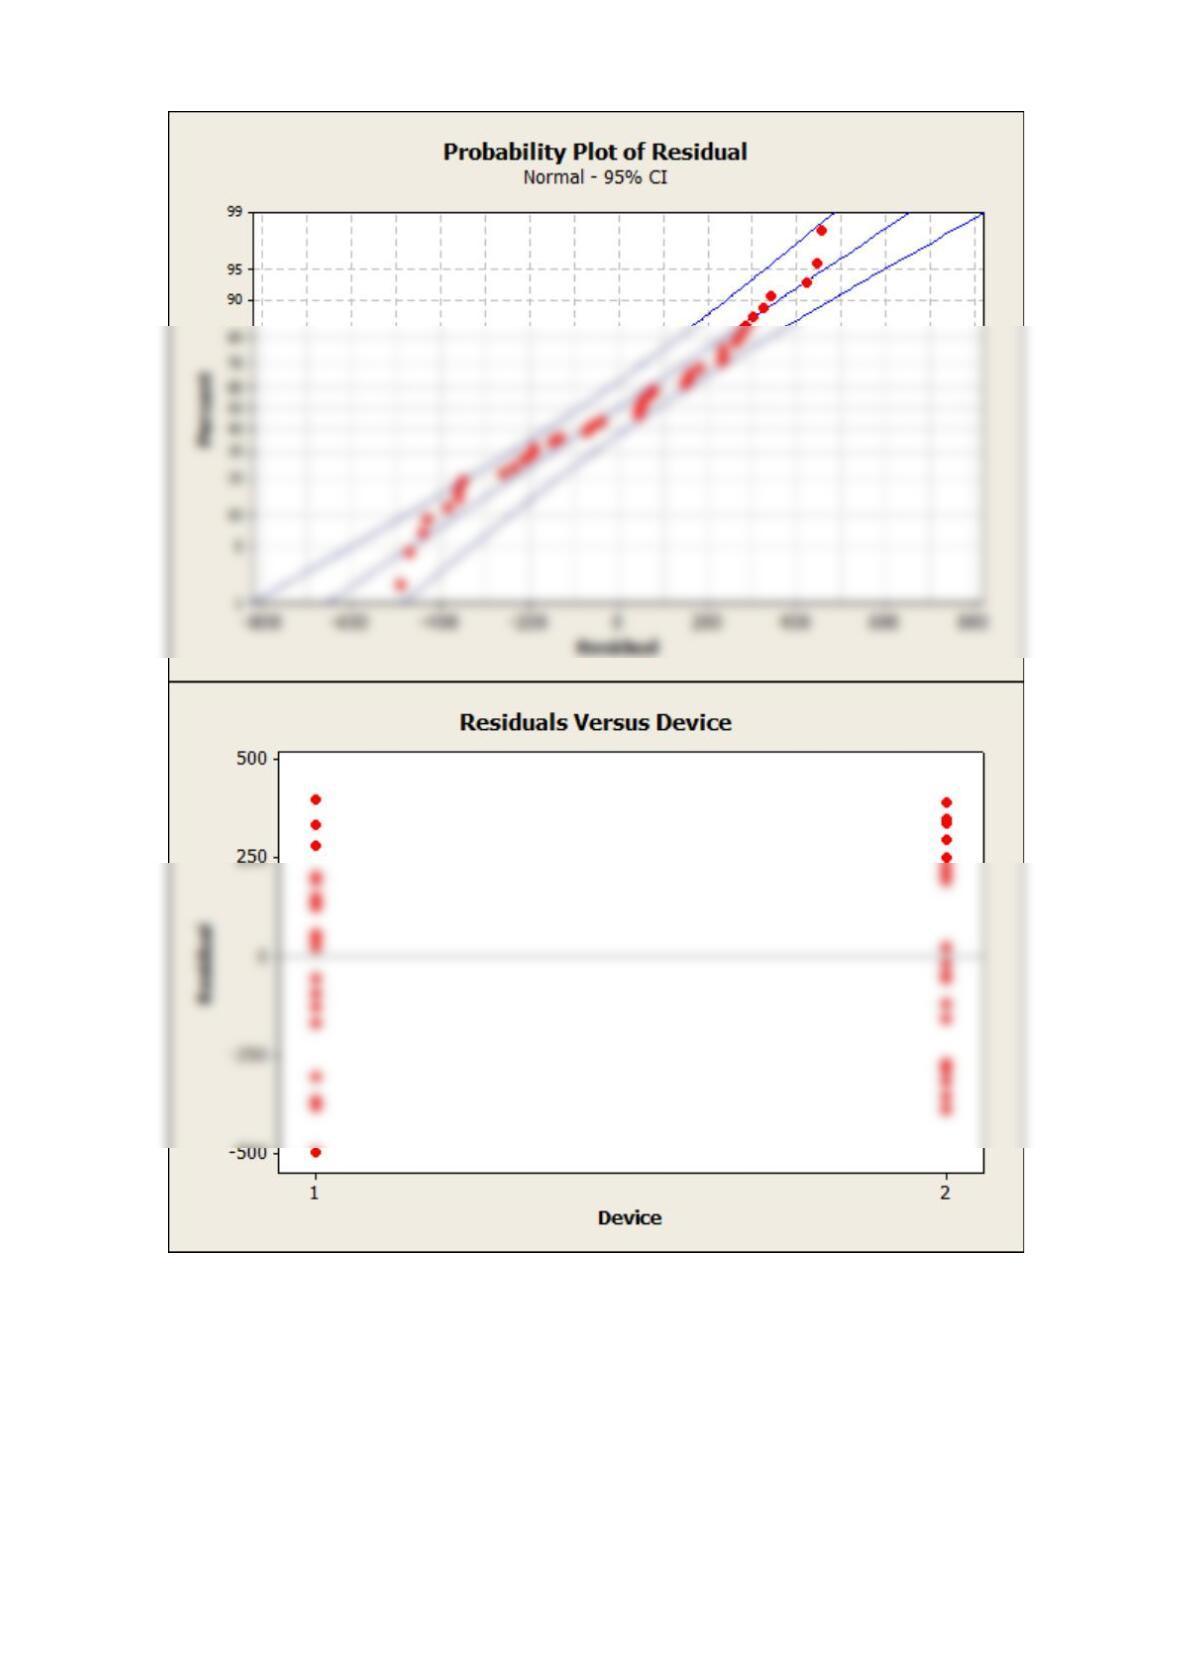
Reserve Problems Chapter 14 Section 3 Problem 2
An article in the Displays (“Reading Performance and Visual Fatigue When Using Electronic
Displays in Long-Duration Reading Tasks Under Various Lighting Conditions,” Vol. 34, 2013)
considered the effects of two device brands and four lighting conditions (200Lx, 500Lx, 1000Lx,
1500Lx) on the reading time, with five subjects for each treatment combination.
Lighting
Device
200
500
1000
1500
1
1656.26
1022.32
1000.28
1276.09
1405.92
1538.07
1142.75
1095.61
1797.21
1444.46
1494.78
572.08
1155.96
1257.76
1117.59
1195.2
1295.44
1667.19
713.07
1208.47
2
862.69
1290.54
1125.57
583.03
1094.63
1079.31
634.06
894.61
1203.72
741.65
860.09
551.34
1501.26
1395.44
641.96
1092.53
1588.64
976.03
1308.35
1218.54
(a) State the hypothesis of interest.
(b) Test the hypotheses in part (a) using the analysis of variance with
0.05
=
. What are your
conclusions?
(c) Analyze the residuals from this experiment.
(d) Using Fisher’s LSD method, investigate the differences between the mean reading time for
the four lighting levels. Use
0.05
=
.
SOLUTION
(a)
1.
0 1 2
:H
=
(no main effect of the device factor);
1:H
at least one
0
i
ij
(b)
0
2.
04.46f=
,
0.05,3,32 2.90f=
0
(d)
4, 2, 5a b n= = =

1000Lx – 500Lx
-237
125
(-492, 17)
-1.9
0.067
Reserve Problems Chapter 14 Section 3 Problem 3
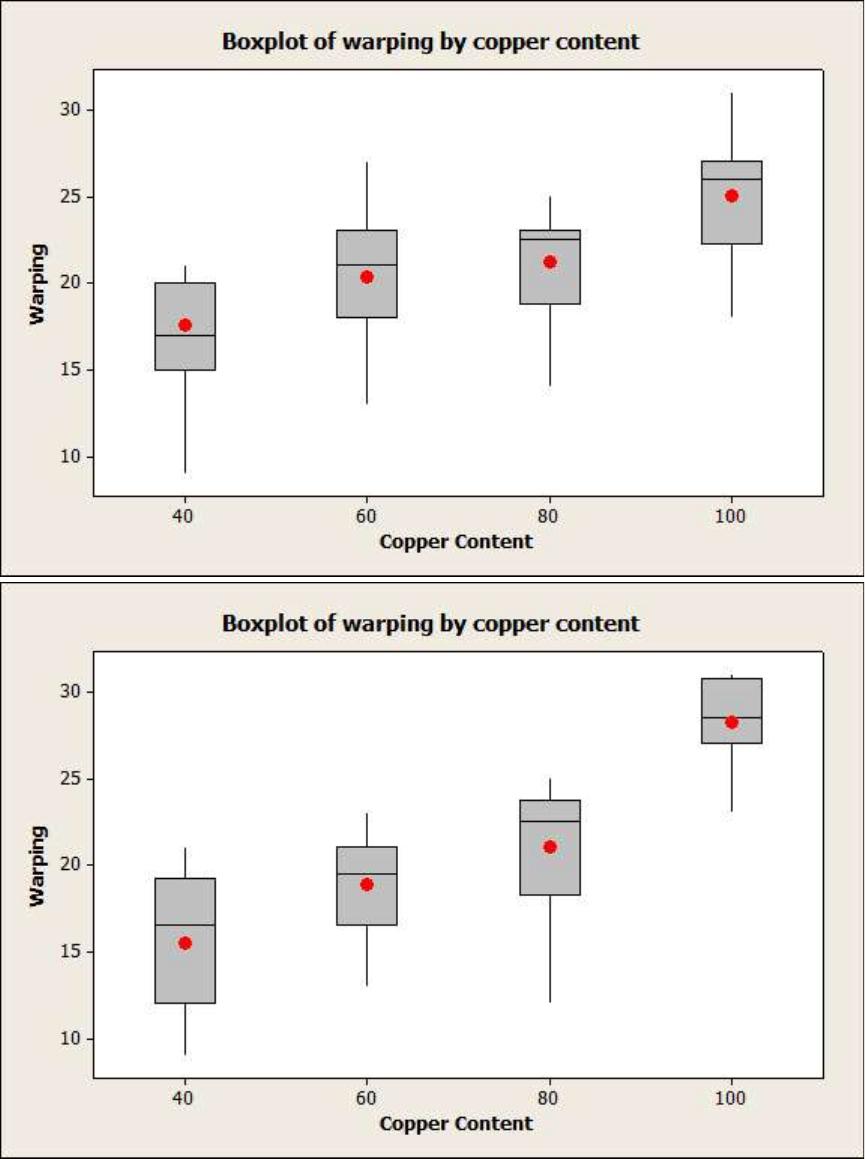
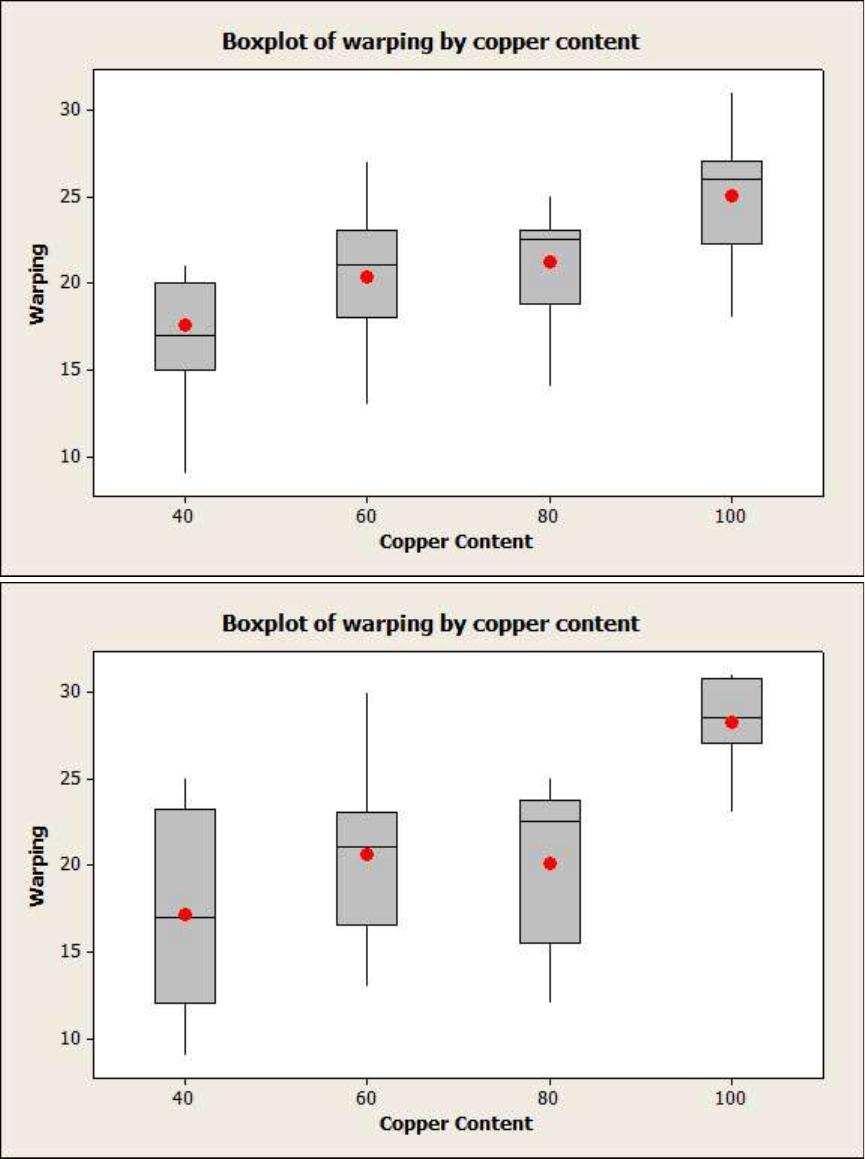
Johnson and Leone (Statistics and Experimental Design in Engineering and the Physical
Sciences, John Wiley, 1977) described an experiment conducted to investigate warping of copper
plates. The two factors studied were temperature and the copper content of the plates. The
response variable is the amount of warping. Each treatment combination was replicated twice.
The data are as follows:
Temperature
(°C)
Copper Content (%)
40
60
80
100
50
17, 20
16, 21
24, 22
28, 27
75
12, 9
18, 13
17, 12
27, 31
100
16, 12
18, 21
25, 23
30, 23
125
21, 17
23, 21
23, 22
29, 31
Part 1
(a) Is there any indication that either factor affects the amount of warping? Is there any
interaction between the factors? Use
0.05
=
.
Find
0
f
for temperature and copper content factors and for interaction.
Temperature have an effect on the mean warping (T/F).
Copper content have an effect on the mean warping (T/F).
The interaction is significant. (T/F).
(b) Analyze the residuals from this experiment. Are they normally distributed?
(c) Choose the correct plot for the average warping at each level of copper content.
1500Lx – 500Lx
-273
125
(-527, -18)
0.037
1500Lx – 1000Lx
125
(-290, 220)
0.781
A
B
C
D
Compare the levels using Fisher’s LSD method. Use
0.05
=
. Suppose that the interaction is
negligible.
Choose the levels of copper content with significant differences in the effects on warping.
If low warping is desirable, what level of copper content would you specify?
(d) Suppose that temperature cannot be easily controlled in the environment in which the copper
plates are to be used. Does this change your answer for part (c)?
SOLUTION
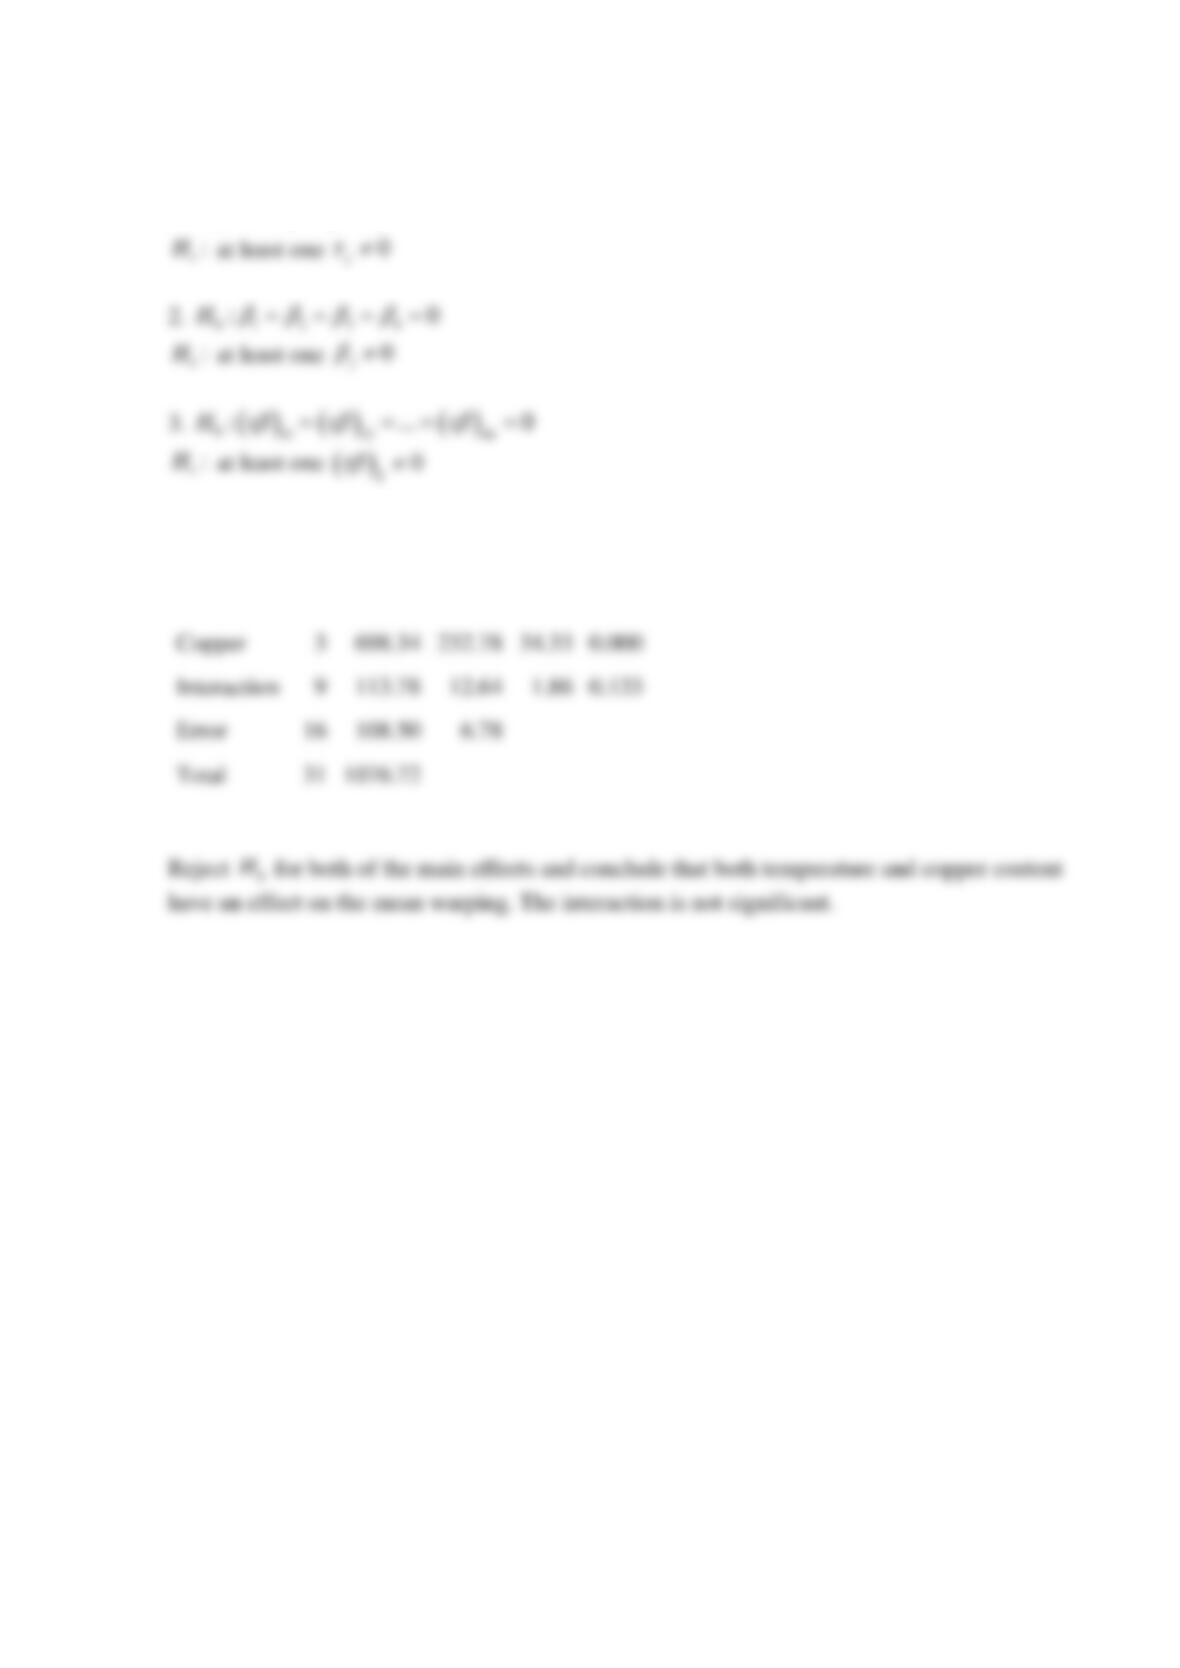
(a)
1.
0 1 2 3 4
:0H
= = = =
Analysis of Variance for warping
Source
DF
SS
MS
F
P
Temp
3
156.09
52.03
7.67
0.002
Copper
3
698.34
232.78
34.33
0.000
Interaction
9
113.78
12.64
1.86
0.133
Error
108.50
Total
1076.72
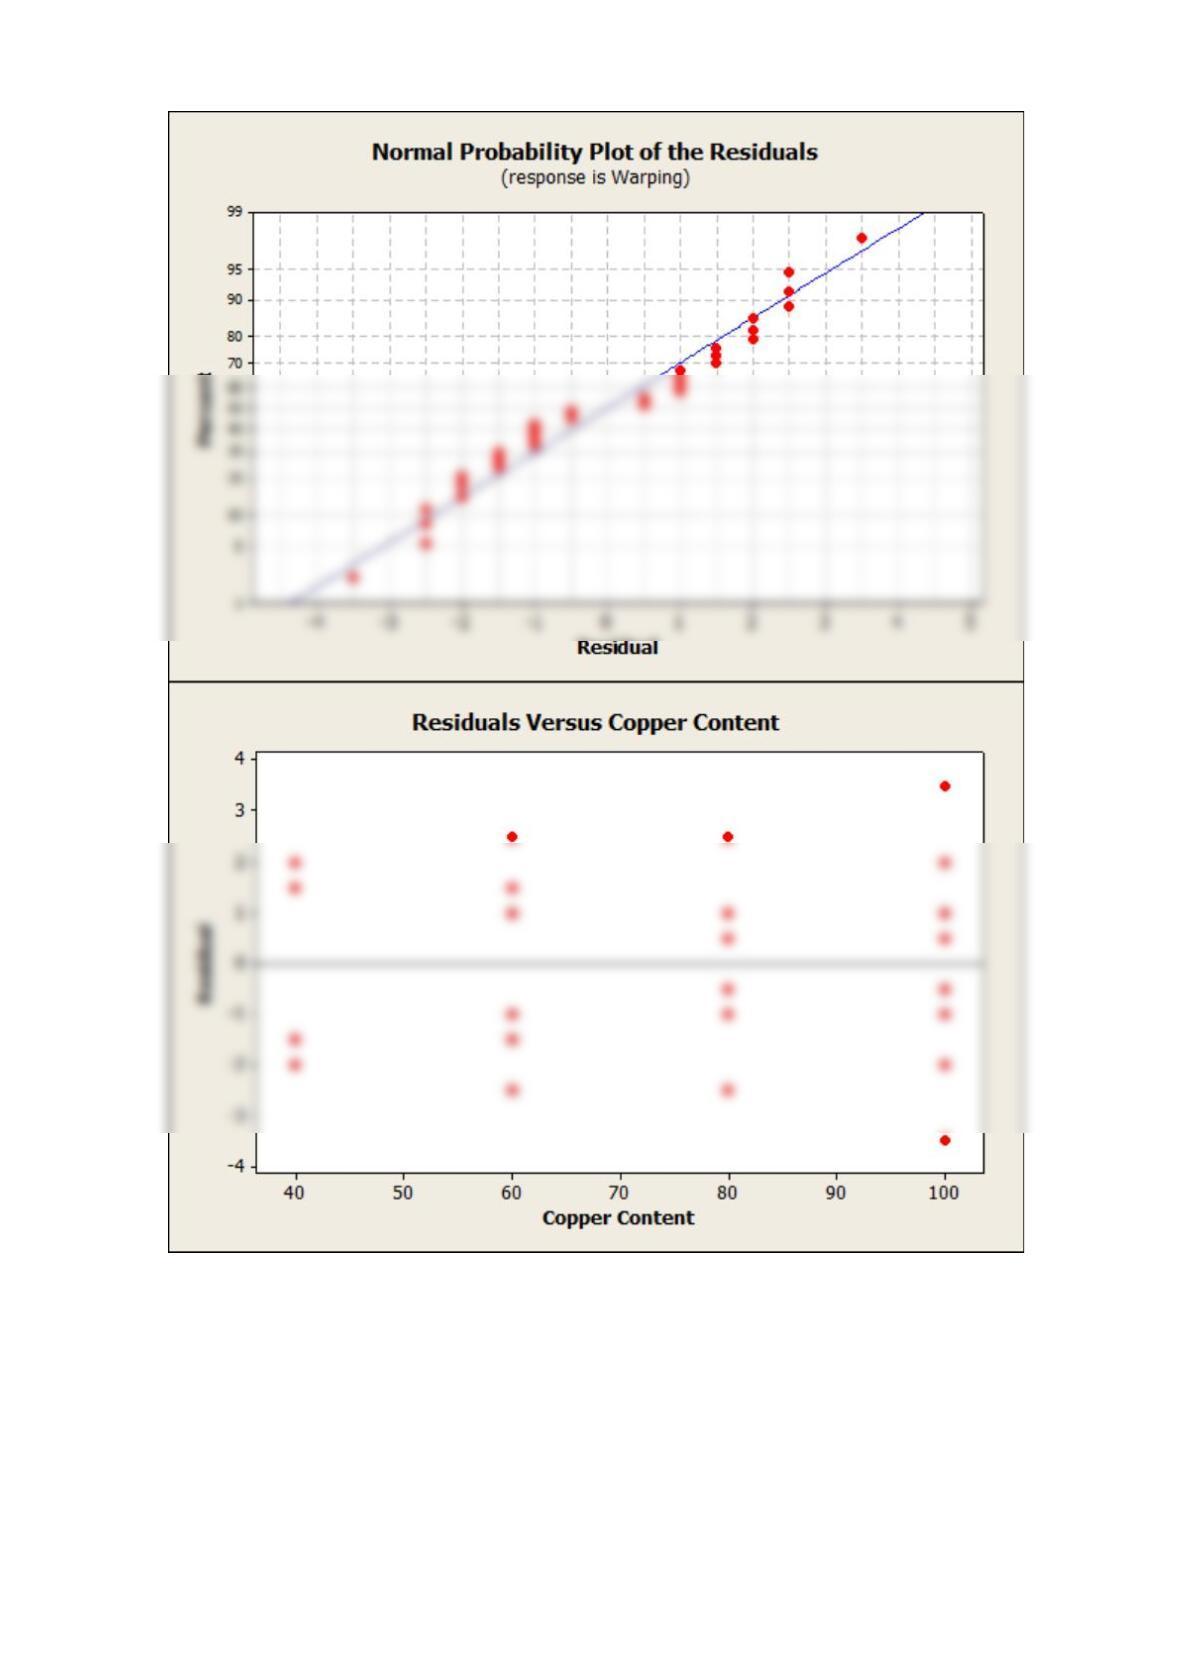
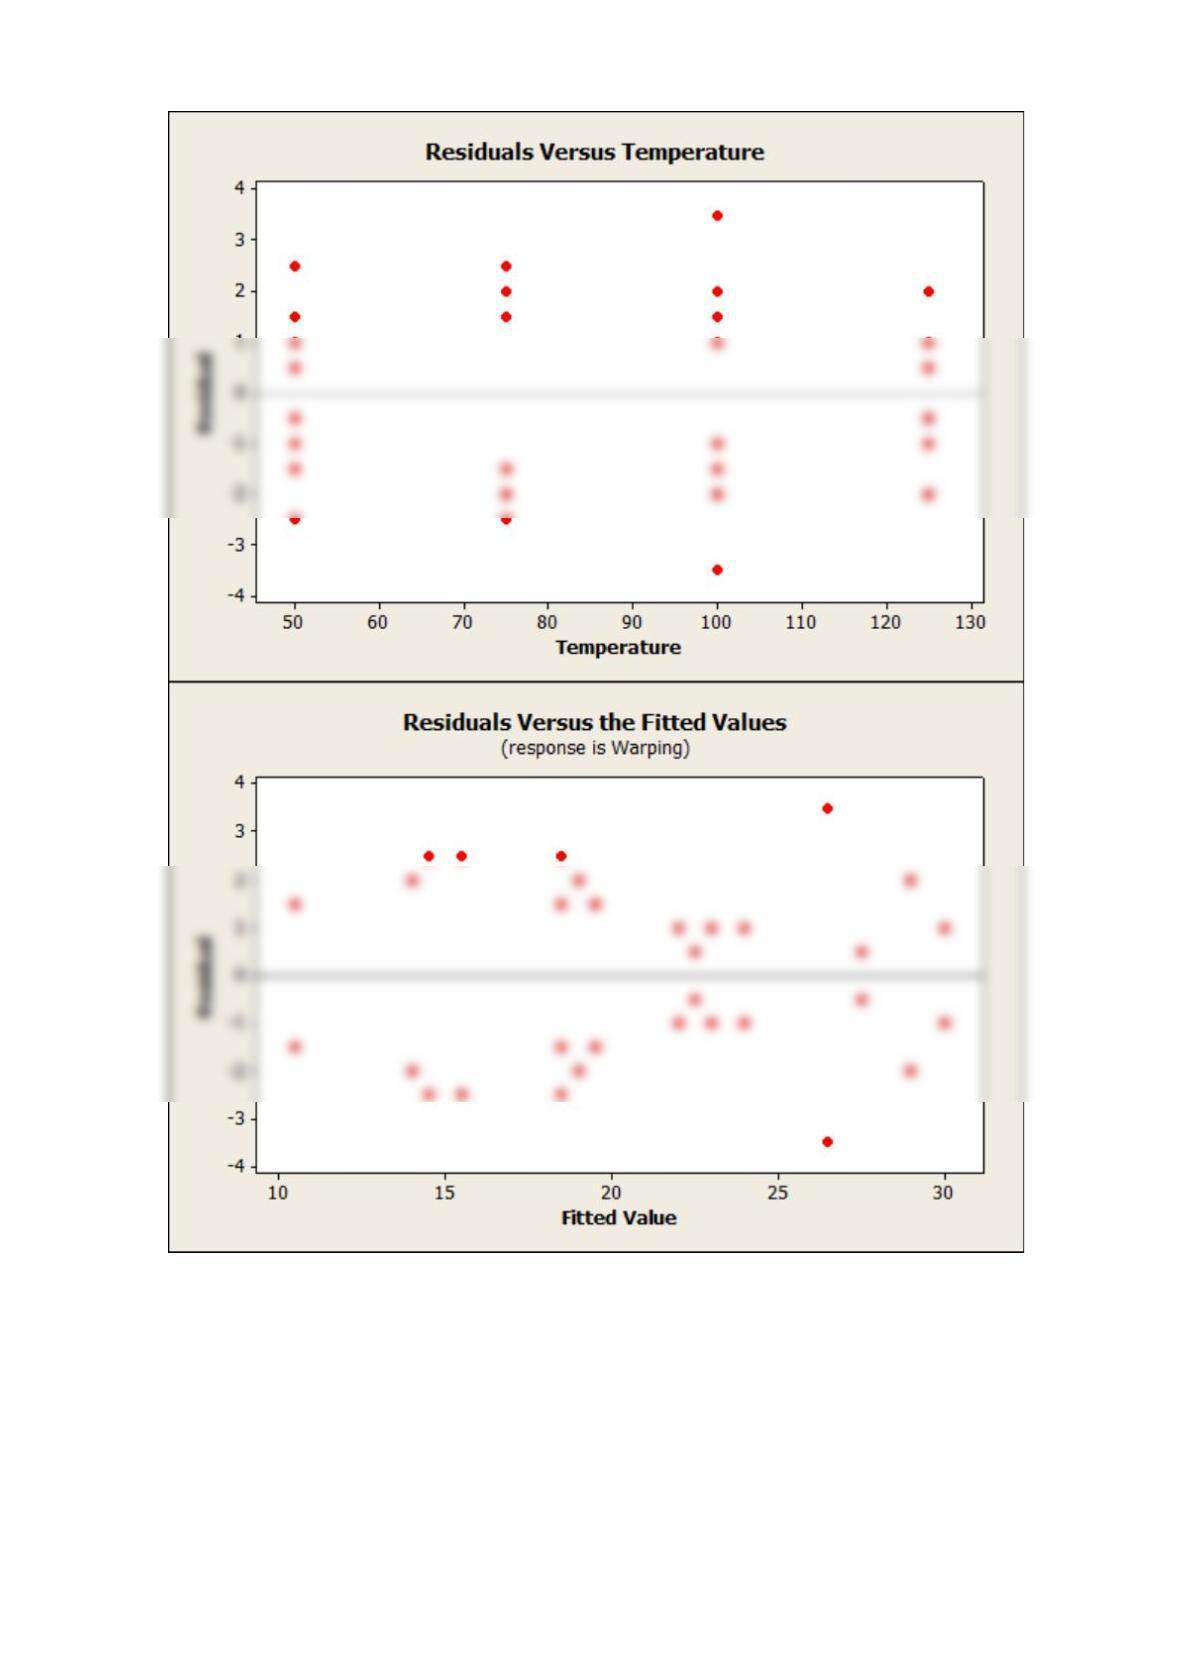
(b) The residuals for this experiment appear reasonable.
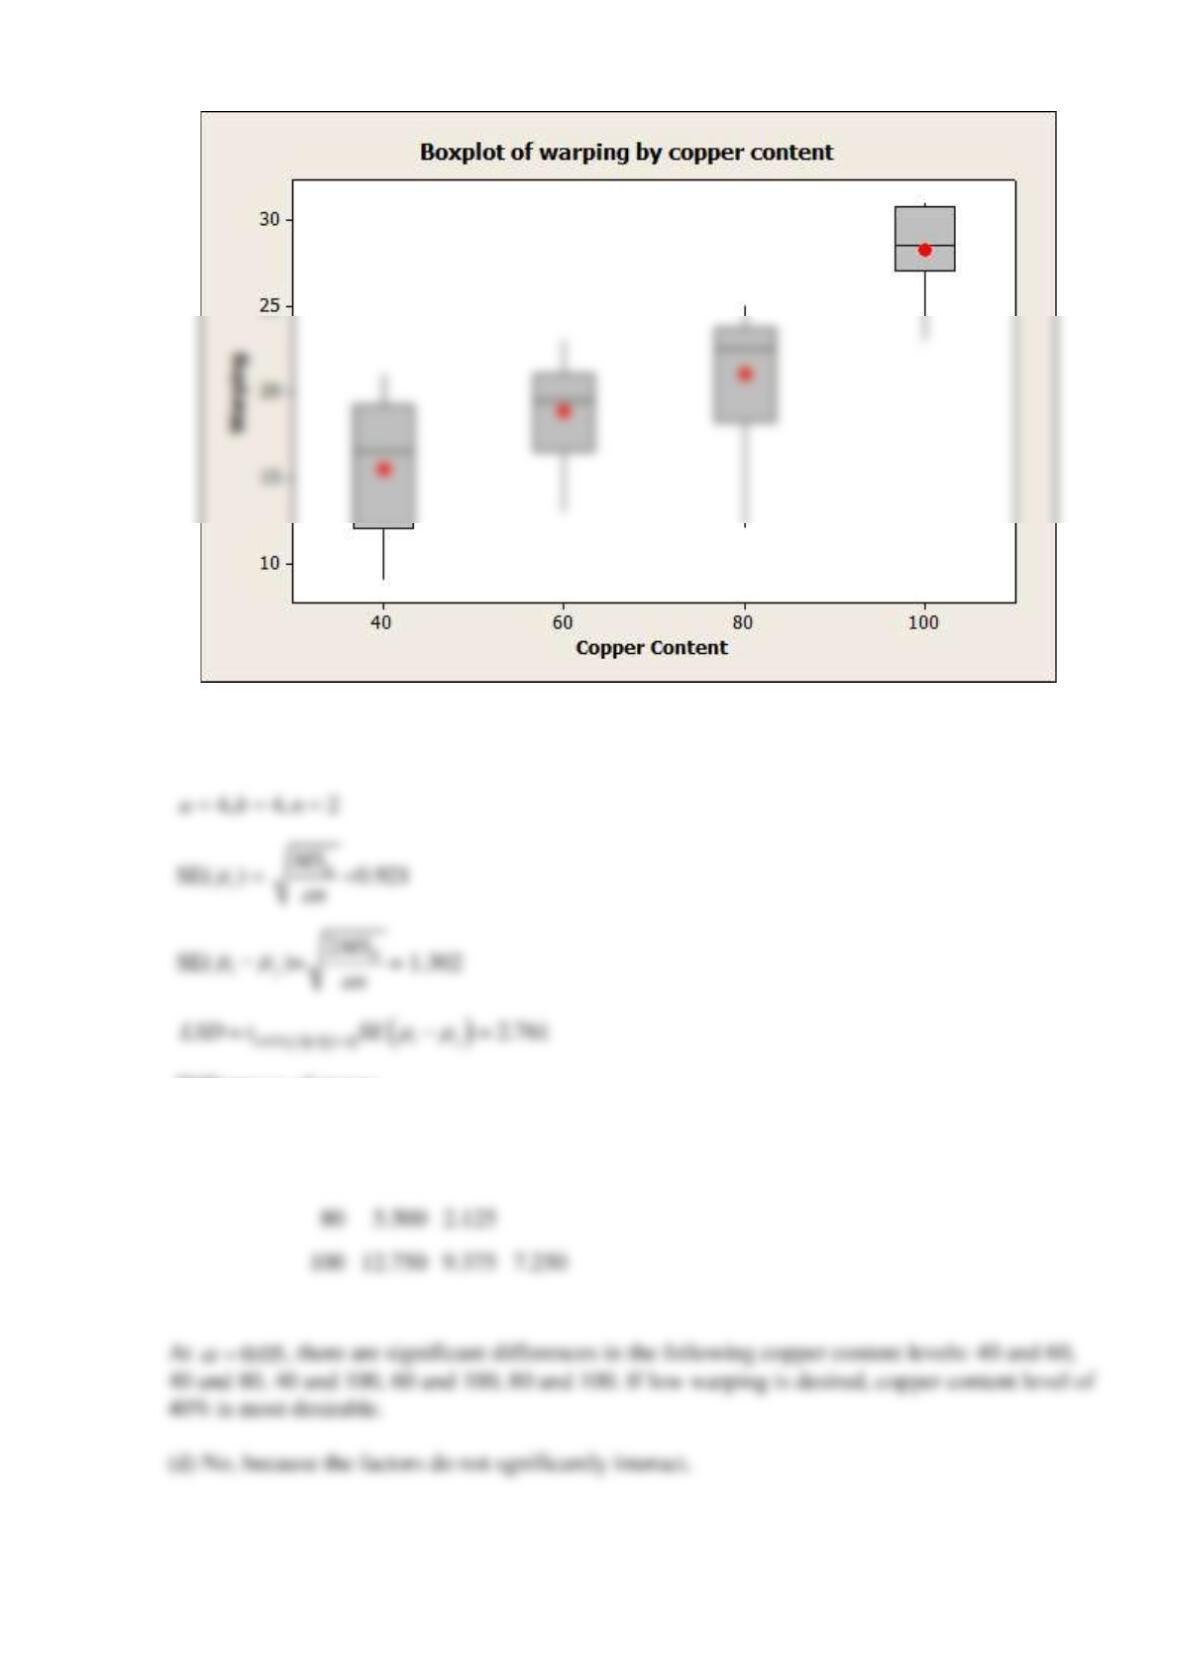
(c)
Fisher’s LSD test
Differences of means
40
60
80
60
3.375
80
5.500
2.125
12.750
9.375
7.250
Reserve Problems Chapter 14 Section 3 Problem 4
Consider a two-factor factorial experiment conducted to investigate warping of copper plates
described by Johnson and Leone (Statistics and Experimental Design in Engineering and the
Physical Sciences, John Wiley, 1977). The two factors studied were temperature and the copper
content of the plates. The response variable is the amount of warping. Each treatment
combination was replicated twice. The data are as follows:
Temperature
(°C)
Copper Content (%)
40
60
80
100
50
17, 20
16, 21
24, 22
28, 27
75
12, 9
18, 13
17, 12
27, 31
100
16, 12
18, 21
25, 23
30, 23
125
21, 17
23, 21
23, 22
29, 31
(a)
( )
100 1 %
−
confidence interval on the difference in two treatment means two means is
________.
(b) Determine a 95% CI on the difference in mean warping at the levels of copper content 80%
and 60%.
SOLUTION
There are an values in the column, so
the ratio
( )
2/
i j i j
E
yy
TMS an
− − −
=
has a t-distribution with
( )
1ab n −
degrees of freedom.
( )
100 1 %
−

Reserve Problems Chapter 14 Section 3 Problem 5
An article in Journal of Chemical Technology and Biotechnology [“A Study of Antifungal
Antibiotic Production by Thermomonospora sp MTCC 3340 Using Full Factorial Design” (2003,
Vol. 78, pp. 605-610)] considered the effects of several factors on antifungal activities. The
antifungal yield was expressed as Nystatin international units per cm3. Each treatment
combination was replicated three times. The results from carbon source concentration (glucose)
and incubation temperature factors follow.
Temperature (°C)
Carbon (%)
25
30
37
2
25.84
51.86
32.59
51.86
131.33
41.11
41.11
104.11
32.59
5
20.48
25.84
12.87
41.11
104.11
32.59
32.59
82.53
25.84
7.5
20.48
25.84
10.2
65.42
82.53
51.86
51.86
65.42
41.11
(a) State the hypotheses of interest.
(b) Test your hypotheses with
0.05
=
. Find the P-values for temperature, carbon and
interaction. Which factors affect the antifungal activities?
(с) Using Fisher’s LSD method, compare the means of antifungal activity for the different
carbon source concentrations. Use
0.05
=
.
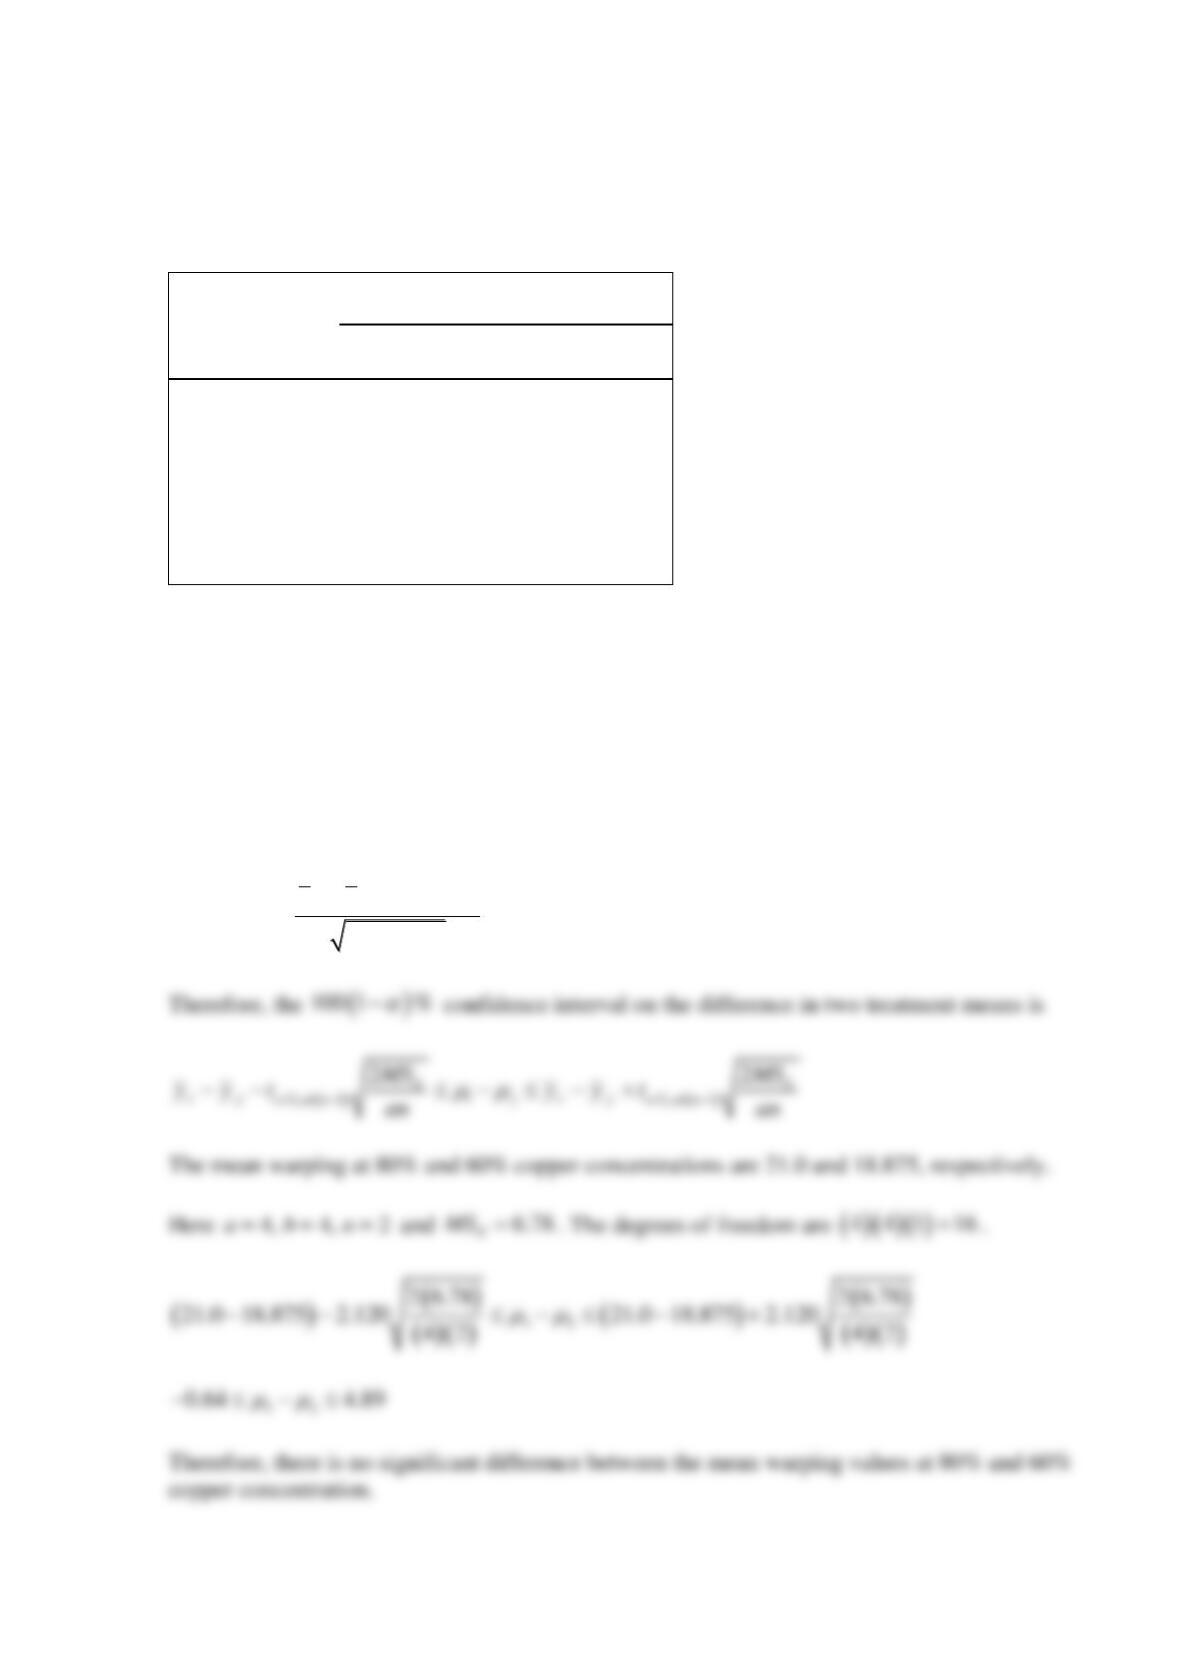
Find the standard error of the difference between two mean.
Find the largest difference in means of antifungal activity for the different carbon source
concentrations.
SOLUTION
(a)
0 1 2 3
:0H
= = =
,
1:H
at least one
0
i
(b)
ANOVA Table
Analysis of Variance for Anitfungal Activity, using Adjusted SS for Tests
Source
DF
Seq SS
Adj SS
Adj MS
F
P
Carbon
2
1072.8
1072.8
536.4
0.68
0.520
(с)
Here
0.05/ 2,18 2.101t=
. Therefore, the standard error of the difference between two mean is
( )
( )( )
2 790.2 13.251
33 =
and
( )
2.101 13.251 27.84LSD ==
.
Means
Carbon Level
N
Mean Yield
2.0
9
56.933
5.0
9
41.996
7.5
9
46.080
Reserve Problems Chapter 14 Section 4 Problem 1
An article in the Journal of Sandwich Structures and Materials “Evaluation of Low-Velocity
Impact Response of Honeycomb Sandwich Structures Using Factorial-Based Design of
Experiments,” Vol. 14(3), 2012 considered the effect of three factors on three responses [energy
absorbed (Joules), peak contact load (kN), max deflection (mm)] with two replicates of each
treatment.
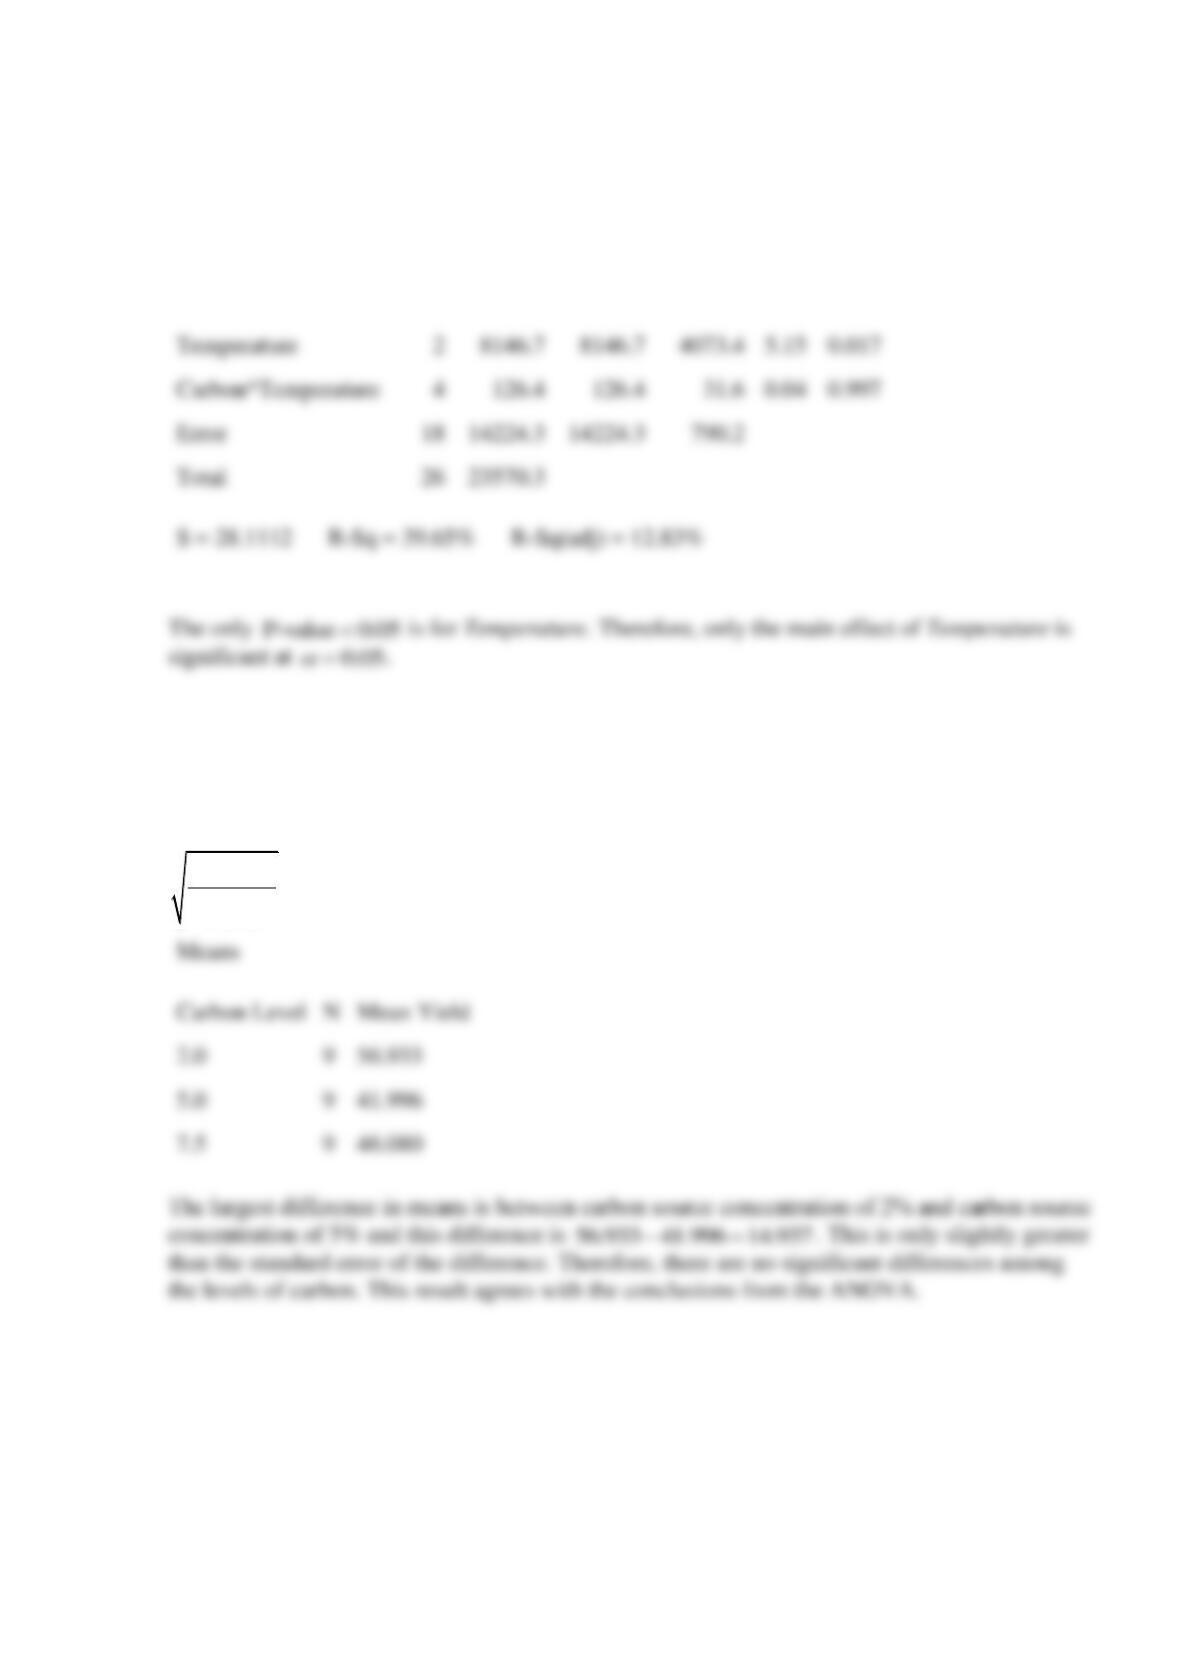
Temperature
2
8146.7
8146.7
5.15
0.017
Carbon*Temperature
4
126.4
126.4
0.04
0.997
Error
14224.3
14224.3
790.2
Total
23570.3
S = 28.1112 R-Sq = 39.65% R-Sq(adj) = 12.83%

A: Angle Difference Between Successive Prepreg Layers, -1 = 30, 0 = 45, +1 = 60
B: Number of Prepreg Layers, -1 = 4, 0 = 8, +1 = 12
C: Number of Adhesive Layers, -1 = 1, 0 = 2, +1 = 3
A
B
C
Energy
Load
Deflection
-1
-1
-1
5.7703
1.4738
8.1539
-1
-1
-1
5.8524
1.4122
8.2838
-1
-1
0
3.9717
2.1142
4.0304
-1
-1
0
4.3148
2.1203
4.3943
-1
-1
1
4.2778
2.1904
3.3504
-1
-1
1
4.1061
2.2131
3.3482
-1
0
-1
5.7507
1.6091
6.1794
-1
0
-1
5.7335
1.3344
7.131
-1
0
0
4.3177
2.1007
4.1117
-1
0
0
3.9038
2.175
4.0648
-1
0
1
4.1026
2.3917
3.1391
-1
0
1
3.5466
2.3801
3.0552
-1
1
-1
5.7746
1.4122
7.8127
-1
1
-1
5.5567
1.5291
6.4957
-1
1
0
4.3922
1.9838
4.3369
-1
1
0
4.0999
2.2752
4.1035
-1
1
1
3.8897
2.3744
3.1091
-1
1
1
3.9348
2.632
3.011
0
-1
-1
5.5161
1.3703
5.5002
0
-1
-1
5.5017
1.3972
5.5149
0
-1
0
4.7033
1.9221
4.4753
0
-1
0
4.4758
1.7661
4.6596
0
-1
1
4.3828
1.9613
3.5835
0
-1
1
4.3903
2.0388
3.3489
0
0
-1
5.5281
1.4311
5.4348
0
0
-1
5.1895
1.3723
6.4893
0
0
0
4.1373
2.237
3.8853
0
0
0
4.363
1.8062
4.2768
0
0
1
4.1047
2.0916
3.6705
0
0
1
4.1379
1.9025
3.5833
0
1
-1
5.4128
1.4115
6.0086
0
1
-1
5.6437
1.4921
6.7677
0
1
0
4.4288
1.8651
4.3097
0
1
0
4.4351
1.7448
4.7639
0
1
1
4.0977
2.0388
3.3827
0
1
1
4.4692
2.0956
3.5312
1
-1
-1
5.2507
1.3533
6.0754

1
-1
-1
5.6487
1.3926
6.4488
1
-1
0
4.4847
1.8802
4.4477
1
-1
0
4.2335
2.0221
4.3423
1
-1
1
4.3801
2.1719
3.2843
1
-1
1
4.6789
1.8428
3.5996
1
0
-1
5.693
1.5102
7.5819
1
0
-1
5.5499
1.3756
5.6833
1
0
0
4.6605
1.9043
4.4821
1
0
0
4.8172
1.6499
4.6711
1
0
1
4.3583
1.9819
3.3425
1
0
1
4.3718
2.0545
3.4786
1
1
-1
5.8231
1.5683
6.7922
1
1
-1
5.2701
1.5676
5.5085
1
1
0
4.5329
1.9025
4.5568
1
1
0
4.6349
1.6679
4.7026
1
1
1
4.1035
2.1957
3.2789
1
1
1
4.5153
1.882
3.8337
(a) State and test the appropriate hypotheses for the energy response using the analysis of
variance with
0.05
=
.
(b) The residuals may be obtained from
ijkl ijkl ijk
e y y=−
. Analyze the residuals from this
experiment.
SOLUTION
(a)
1.
0 1 2 3
:H
= = =
(no main effect of factor A);
1:H
at least one
0
i
2.
0 1 2 3
:H
= = =
(no main effect of factor B);
1:H
at least one
0
j
3.
0 1 2 3
:H
= = =
(no main effect of factor C);
1:H
at least one
0
k
4.
( ) ( ) ( )
011 12 33
: …H
= = = =
(no interaction between A and B);
1:H
at least one
5.
( ) ( ) ( )
011 12 33
: …H
= = = =
(no interaction between A and C);
1:H
at least one
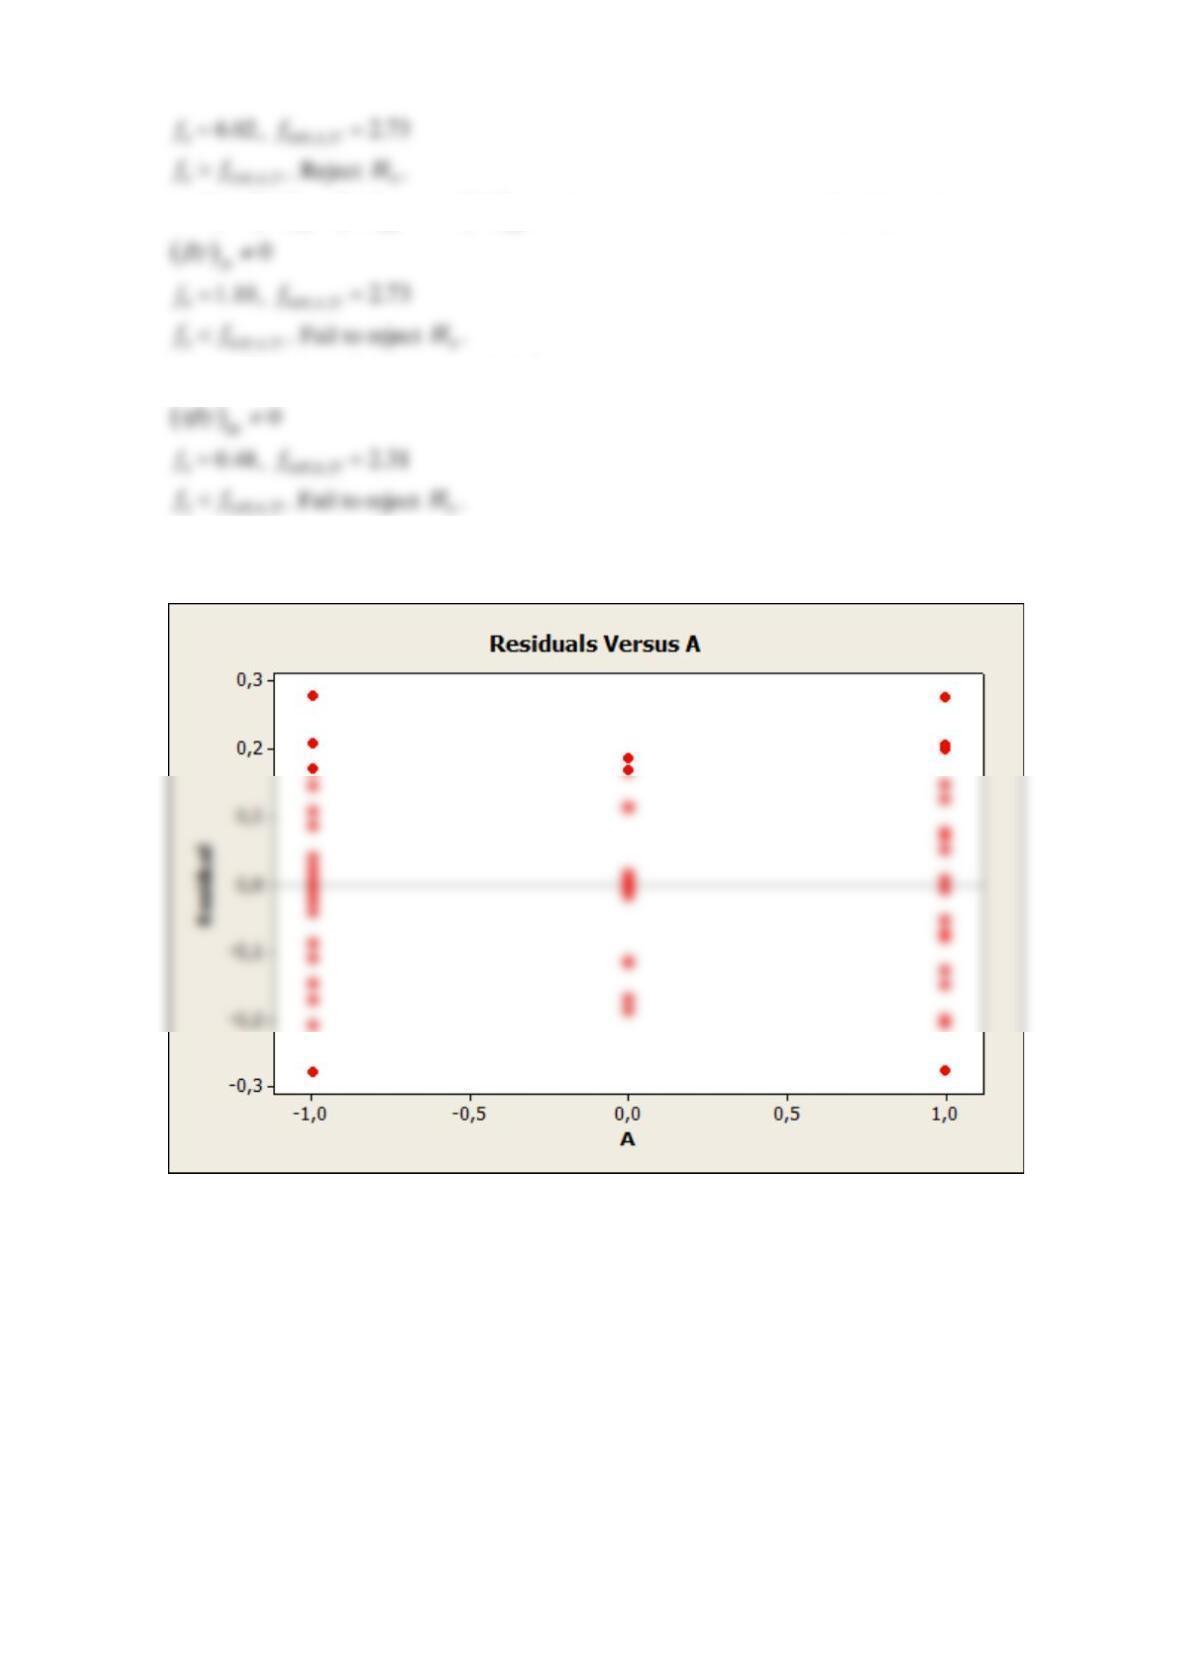
6.
( ) ( ) ( )
011 12 33
: …H
= = = =
(no interaction between B and C);
1:H
at least one
7.
( ) ( ) ( )
0111 112 333
: …H
= = = =
(no three-factor interaction);
1:H
at least one
(b)
There appears to be less variability at the 0 level of factors A and C. The normal plot of the
residuals indicates that the assumption of normality is reasonable.