
Source
DF
SeqSS
AdjSS
AdjMS
F
P
Main Effects
5
0.1944
0.1944
0.0389
3.3
0.051
A
1
0.0946
0.0946
0.0946
8.02
0.018
Reserve Supplemental Exercises Chapter 14 Problem 6
An article in Biotechnology Progress (December 2002, Vol. 18(6), pp. 1170–1175) presented a
73
2−
fractional factorial to evaluate factors promoting astaxanthin production. The data are
shown in the following table.
Runs
A
B
C
D
E
F
G
Weight Content (mg/g)
Cellular Content (pg/cell)
1
-1
-1
-1
1
1
1
-1
4.2
10.8
2
1
-1
-1
-1
-1
1
1
4.4
24.9
3
-1
1
-1
-1
1
-1
1
7.8
27.3
4
1
1
-1
1
-1
-1
-1
14.9
36.3
5
-1
-1
1
1
-1
-1
1
25.3
112.6
6
1
-1
1
-1
1
-1
-1
26.7
159.3
7
-1
1
1
-1
-1
1
-1
23.9
145.2
8
1
1
1
1
1
1
1
21.9
243.2
9
1
1
1
-1
-1
-1
1
24.3
72.1
10
-1
1
1
1
1
-1
-1
20.5
112.2
11
1
-1
1
1
-1
1
-1
10.8
22.5
12
-1
-1
1
-1
1
1
1
20.8
149.7
13
1
1
-1
-1
1
1
-1
13.5
140.1
14
-1
1
-1
1
-1
1
1
10.3
47.3
15
1
-1
-1
1
1
-1
1
23.0
153.2
16
-1
-1
-1
-1
-1
-1
-1
12.1
35.2
The factors and levels are shown in the following table.
Factor
-1
+1
A
Nitrogen concentration (mM)
4.06
0
B
Phosphorus concentration (mM)
0.21
0
C
Photon flux density
( )
22
Em s
−−
100
500
B
1
0.0298
0.0298
0.0298
2.52
0.143
D
1
0.0410
0.0410
0.0410
3.48
0.092
E
1
0.0116
0.0116
0.0116
0.98
0.345
Residual Error
10
0.1179
0.1179
0.01179
Total
15
0.3123
D
Magnesium concentration (mM)
1
0
E
Acetate concentration (mM)
0
15
F
Ferrous concentration (mM)
0
0.45
G
NaCl concentration (mM)
OHM
25
OHM: Optimal Haematococcus Medium
(a) Choose the correct complete defining relation and generators for the design.
(b) Estimate the main effects.
For Weight content:
For Cellular content:
(c) Plot the effect estimates on normal probability and interpret the results. Use
0.05
=
.
(d) Which factors (including two-ways interactions) are significant for the cellular content?
SOLUTION
(a)
Alias Structure (up to order 3):
I
A + B*C*G + B*E*F + C*D*F + D*E*G
B + A*C*G + A*E*F + C*D*E + D*F*G
Aliases:
A = BEF = BCG = CDF = DEG = ABCDE = ABDFG = ACEFG
B = AEF = ACG = CDE = DFG = ABCDF = ABDEG = BCEFG
AE = BF = DG = ABCD = ACFG = BCEG = CDEF = ABDEFG
(b)
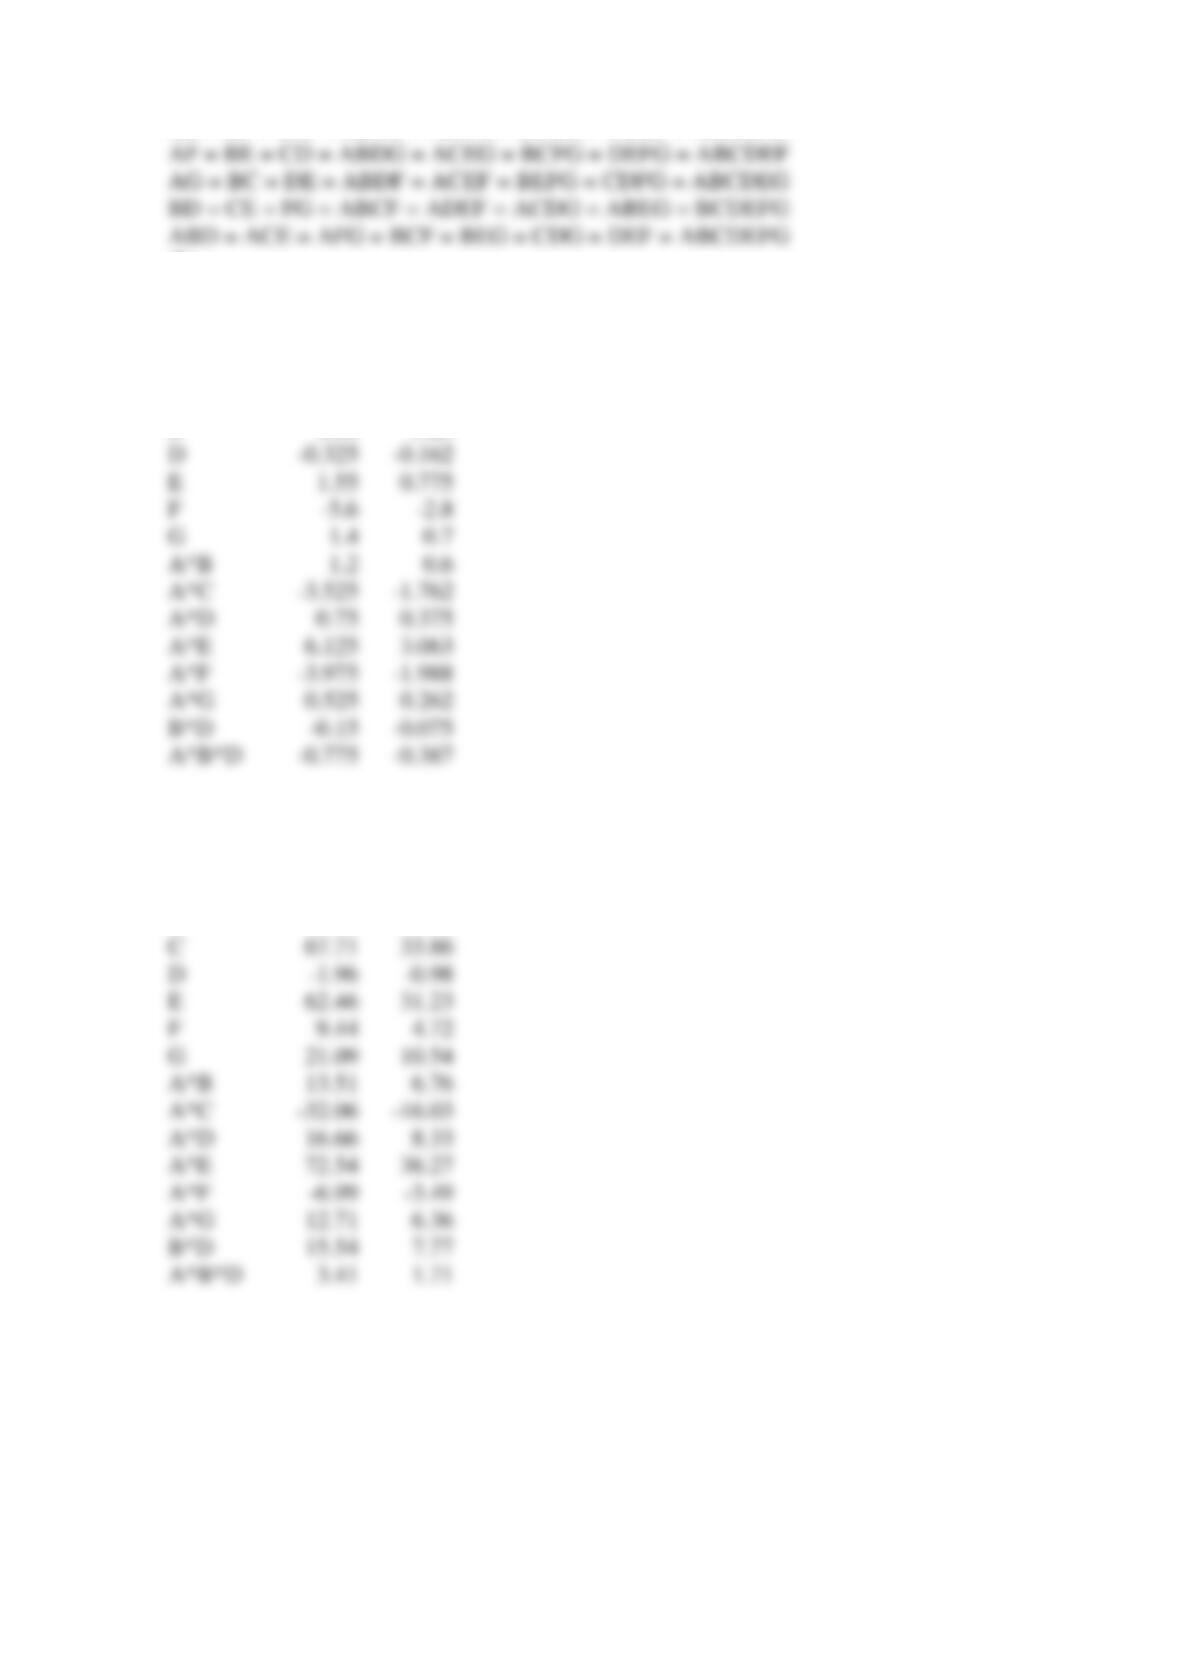
For weight content estimated effects and coefficients are:
Term
Effect
Coef
Constant
16.525
A
1.825
0.912
B
1.225
0.612
C
10.5
5.25
D
E
1.55
0.775
F
G
A*B
A*C
A*D
0.75
0.375
A*E
6.125
3.063
A*F
A*G
0.525
0.262
B*D
A*B*D
For cellural content:
Term
Effect
Coef
Constant
93.24
A
26.41
13.21
B
19.44
9.72
C
67.71
33.86
D
E
62.46
31.23
F
9.44
4.72
G
21.09
10.54
A*B
13.51
6.76
A*C
A*D
16.66
8.33
A*E
72.54
36.27
A*F
A*G
12.71
6.36
B*D
15.54
7.77
A*B*D
3.41
1.71
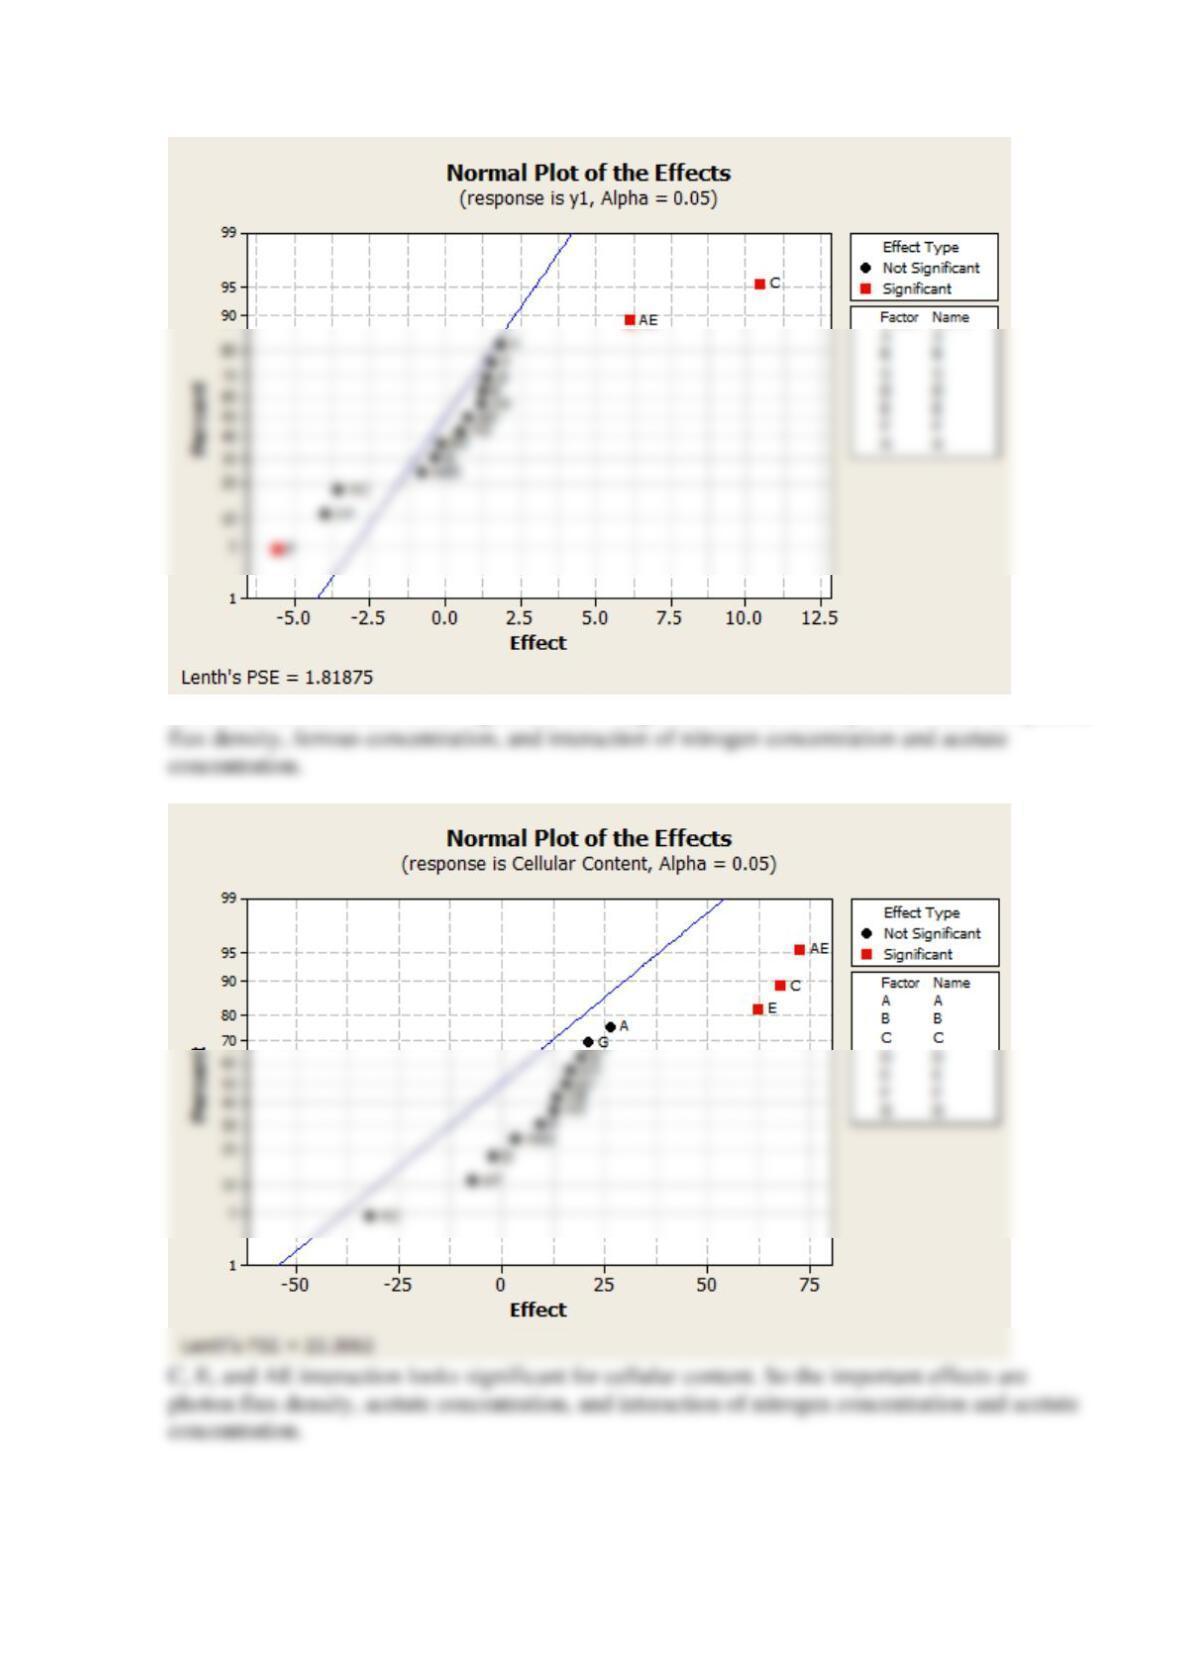
(c)
C, F, and AE interaction looks significant for weight content. So the important effects are photon
Reserve Supplemental Exercises Chapter 14 Problem 7

An article in European Food Research and Technology [“Factorial Design Optimisation of Grape
(Vitis vinifera) Seed Polyphenol Extraction” (2009, Vol. 229(5), pp. 731–742)] used a central
composite design to study the effects of basic factors (time, ethanol, and pH) on the extractability
of polyphenolic phytochemicals from grape seeds. Total polyphenol (TP in mg gallic acid
equivalents/100 g dry weight) from three types of grape seeds (Savatiano, Moschofilero, and
Agiorgitiko) were recorded. The data follow.
Run
Ethanol(%)
pH
Time(h)
TP
Moschofilero
TP
Savatiano
TP
Agiorgitiko
1
40
2
1
13,320
13,127
8,673
2
40
2
5
13,596
8,925
4,370
3
40
6
1
10,714
12,047
8,049
4
40
6
5
10,730
11,299
5,315
5
60
2
1
12,149
9,700
9,384
6
60
2
5
10,910
7,107
8,290
7
60
6
1
11,620
8,755
7,905
8
60
6
5
9,757
9,792
9,347
9
40
4
3
13,593
9,748
7,253
10
60
4
3
13,459
8,727
8,390
11
50
2
3
11,980
7,164
7,611
12
50
6
3
10,338
5,928
7,292
13
50
4
1
13,992
12,200
8,305
14
50
4
5
13,450
10,552
8,380
15
50
4
3
11,745
9,284
8,792
16
50
4
3
12,267
9,084
8,302
(a) Build a second-order response surface model for each seed type and compare the models.
Which factors are significant for total polyphenol from each seeds type? Use
0.05
=
.
(b) Which interaction and quadratic terms are significant for total polyphenol from each seeds
type? Use
0.05
=
.
SOLUTION
(a)
Response Surface analysis for TP Moschofilero:
Estimated Regression Coefficients for TP Moschofilero
Term
Coef
SE
Coef
T
P
Constant
12776.9
312.4
40.896
0.0
ethanol(%)
-405.8
208.7
-1.945
0.10
-879.6
208.7
-4.215
0.006
time(h)*time(h)
558.7
406.4
1.375
0.218
Analysis of Variance for TP Moschofilero
Source
DF
Seq SS
Adj SS
Adj MS
F
P
Regression
9
24800962
24800962
2755662
6.33
0.018
Linear
3
10507288
10507288
3502429
8.04
0.016
ethanol(%)
1
1646736
1646736
1646736
3.78
PH
1
7736962
7736962
7736962
17.77
0.006
time(h)
1
1123590
1123590
1123590
2.58
0.159
Square
3
10960575
10960575
3653525
8.39
0.014
ethanol(%)*ethanol(%)
1
361616
348646
348646
0.405
PH*PH
1
9776161
10580757
10580757
24.3
0.003
time(h)*time(h)
1
822797
822797
822797
1.89
0.218
Interaction
3
3333099
3333099
1111033
2.55
0.152
ethanol(%)*PH
1
1795512
1795512
1795512
4.12
0.089
ethanol(%)*time(h)
1
1439904
1439904
1439904
3.31
0.119
PH*time(h)
1
0.22
0.653
Residual Error
6
2612927
2612927
435488
Lack-of-Fit
5
2476685
2476685
495337
3.64
0.378
Pure Error
1
136242
136242
136242
Total
15
27413889
Response Surface analysis for TP Savatiano:
Term
Coef
SE
Coef
T
P
Constant
8824.69
333.2
26.488
0
ethanol(%)
-1106.5
222.5
-4.972
0.003
179.8
222.5
0.808
0.45
time(h)
-815.4
222.5
-3.664
0.011
ethanol(%)*ethanol(%)
592.47
433.4
1.367
0.221
PH*PH
–
2099.03
433.4
-4.843
0.003
time(h)*time(h)
2730.97
433.4
6.301
0.001
ethanol(%)*PH
55.75
248.8
0.224
0.83
ethanol(%)*time(h)
424.25
248.8
1.705
0.139
Analysis of Variance for TP Savatiano
Source
DF
Seq SS
Adj SS
Adj MS
F
P
Regression
9
54006900
54006900
6000767
12.12
0.003
Linear
3
19215475
19215474
6405158
12.93
0.005
ethanol(%)
1
12243423
12243423
12243423
24.72
0.003
PH
1
323280
323280
323280
0.65
0.45
time(h)
1
6648772
6648772
6648772
13.43
0.011
Square
3
27053775
27053775
9017925
18.21
0.002
ethanol(%)*ethanol(%)
1
2952824
925404
925404
1.87
0.221
PH*PH
1
4438496
11615675
11615675
23.46
0.003
ethanol(%)*PH
473.7
233.3
2.031
0.089
ethanol(%)*time(h)
-424.2
233.3
-1.818
0.119
PH*time(h)
-110.5
233.3
-0.474
0.653
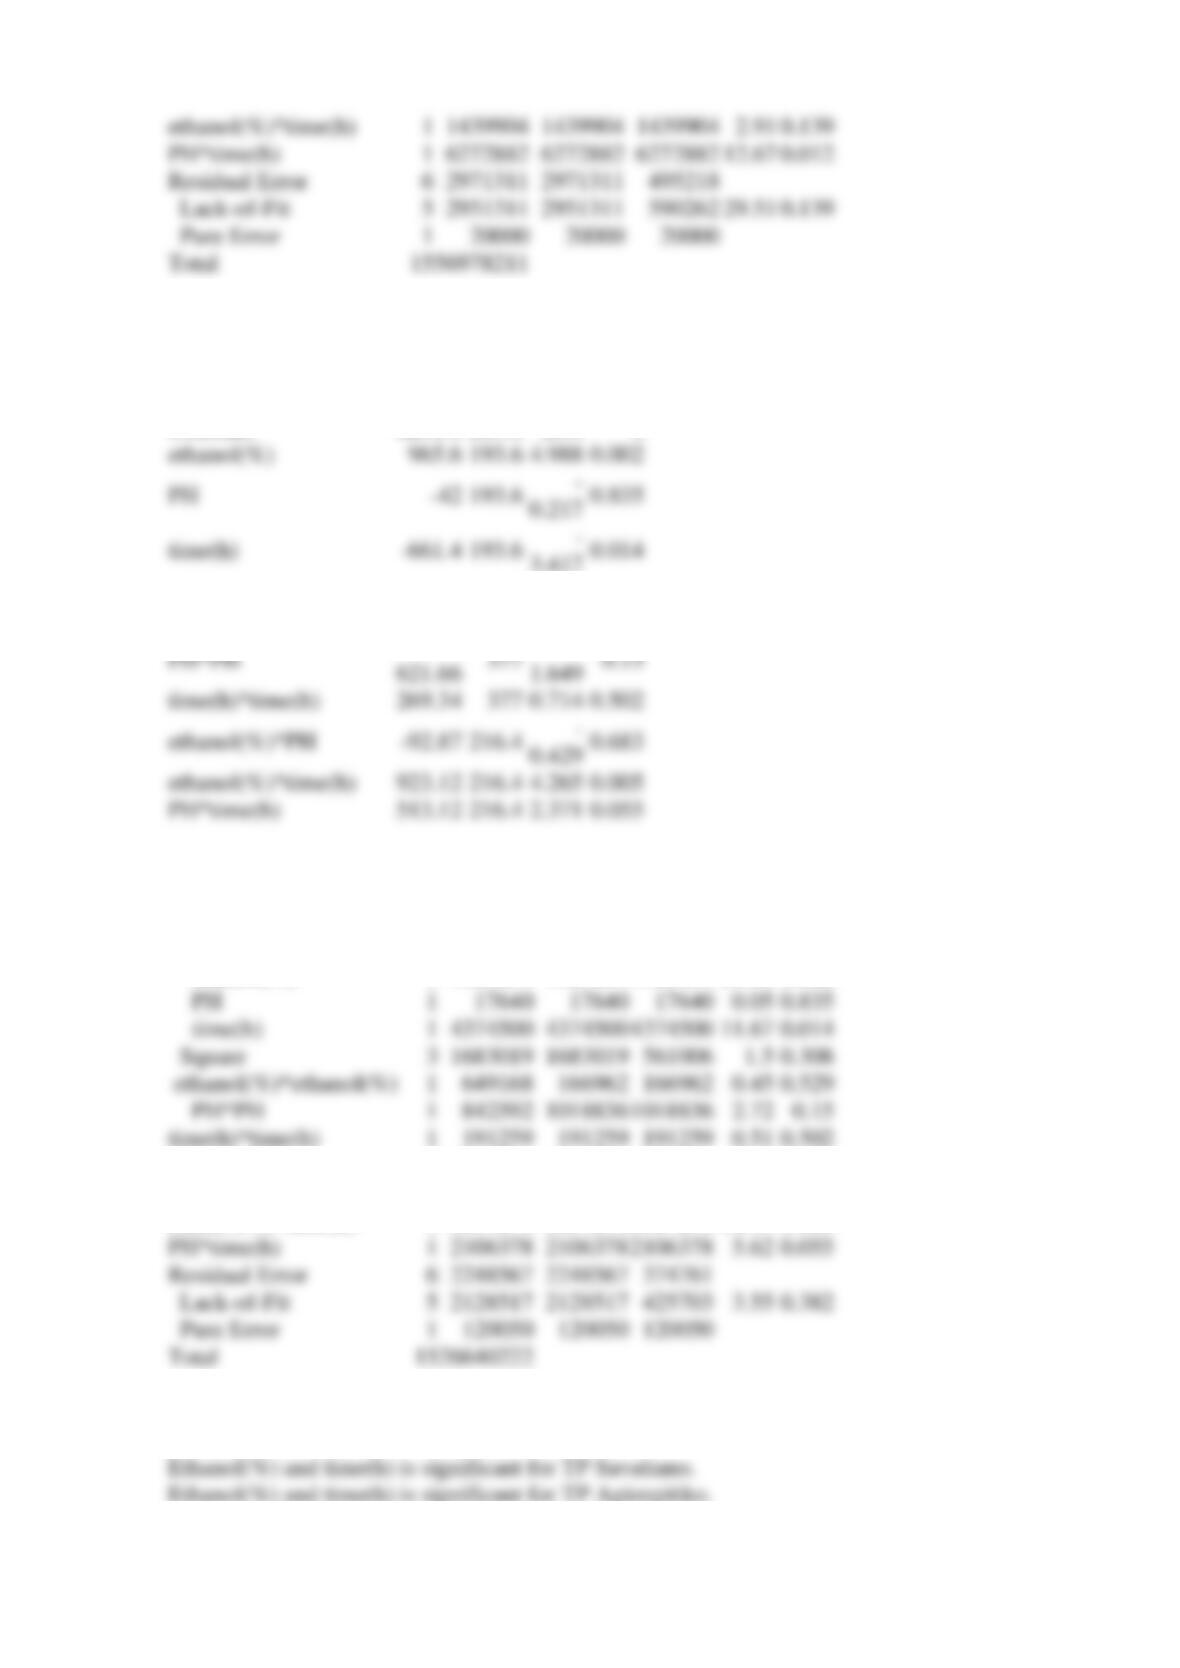
Response Surface analysis for TP Agiorgitiko:
Estimated Regression Coefficients for TP Agiorgitiko
Term
Coef
SE
Coef
T
P
Constant
8231.1
289.8
28.4
0
ethanol(%)
193.6
4.988
0.002
193.6
–
0.217
0.835
time(h)
193.6
–
3.417
0.014
ethanol(%)*ethanol(%)
–
251.66
377
–
0.667
0.529
PH*PH
621.66
377
1.649
time(h)*time(h)
269.34
0.714
0.502
ethanol(%)*PH
216.4
–
0.429
0.683
ethanol(%)*time(h)
923.12
216.4
4.265
0.005
PH*time(h)
513.12
216.4
2.371
0.055
–
–
Analysis of Variance for TP Agiorgitiko
Source
DF
Seq SS
Adj SS
Adj MS
F
P
Regression
9
24391655
24391655
2710184
7.23
0.013
Linear
3
13715973
13715973
4571991
12.2
0.006
ethanol(%)
1
9323834
9323834
9323834
24.88
0.002
PH
1
17640
17640
17640
0.05
0.835
time(h)
1
4374500
4374500
4374500
11.67
0.014
Square
3
1683019
1683019
0.308
ethanol(%)*ethanol(%)
1
0.45
0.529
PH*PH
1
1018836
1018836
2.72
0.15
time(h)*time(h)
1
0.51
0.502
Interaction
3
8992662
8992662
2997554
8
0.016
ethanol(%)*PH
1
69006
69006
69006
0.18
0.683
ethanol(%)*time(h)
1
6817278
6817278
6817278
18.19
0.005
PH*time(h)
1
2106378
2106378
2106378
5.62
0.055
Residual Error
6
2248567
2248567
Lack-of-Fit
5
2128517
2128517
3.55
0.382
Pure Error
1
Total
26640222
0.05
=
Factor is significant if
P value
−
. Fron model, we find:
pH is significant for TP Moschofilero.
ethanol(%)*time(h)
1439904
1439904
1439904
PH*time(h)
6272882
6272882
6272882
Residual Error
2971311
2971311
Lack-of-Fit
2951311
2951311
Pure Error
20000
20000
20000
Total
15
56978211
(b)
For Moschofilero, the second-order term for pH (PH*PH) is significant.
Reserve Supplemental Exercises Chapter 14 Problem 8
This
3
2
factorial design was used to study the effects of basic factors (time, ethanol, and pH) on
the extractability of polyphenolic phytochemicals from grape seeds. Total polyphenol from three
types of grape seeds (Savatiano, Moschofilero, and Agiorgitiko) were recorded. Assume that the
experiment was conducted in blocks based on seed type.
Run
Ethanol
(%)
pH
Time
(h)
TP
Moschofilero
TP
Savatiano
TP
Agiorgitiko
1
40
2
1
13,320
13,127
8,673
2
40
2
5
13,596
8,925
4,370
3
40
6
1
10,714
12,047
8,049
4
40
6
5
10,730
11,299
5,315
5
60
2
1
12,149
9,700
9,384
6
60
2
5
10,910
7,107
8,290
7
60
6
1
11,620
8,755
7,905
8
60
6
5
9,757
9,792
9,347
(a) Analyze the factorial effects. Use
0.1
=
. Which effects are important?
(b) Develop a regression model to predict the response in terms of the actual factor levels. Use
the significant terms and blocks identified in (a).
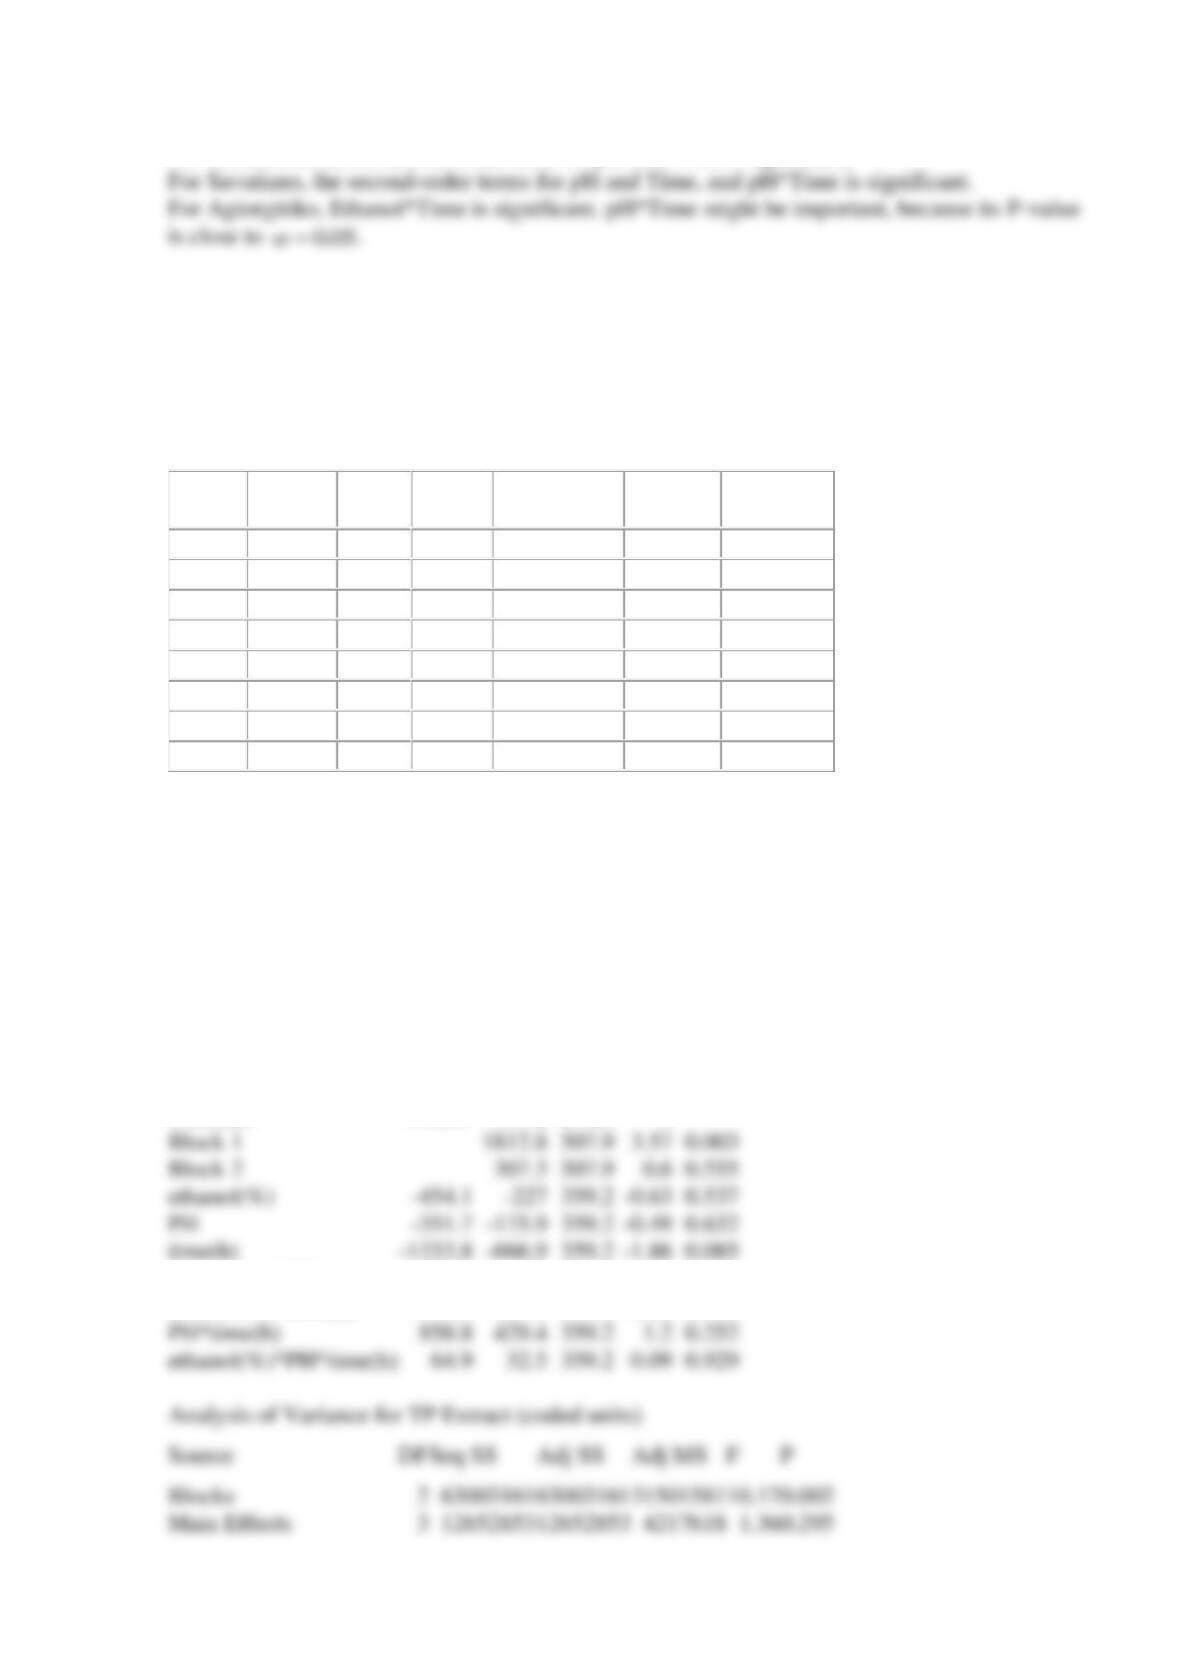
SOLUTION
(a)
Estimated Effects and Coefficients for TP Extract (coded units)
Term
Effect
Coef
SE
Coef
T
P
Constant
9786.7
359.2
27.25
0
Block 1
1812.8
507.9
3.57
0.003
Block 2
307.3
507.9
0.555
ethanol(%)
-454.1
359.2
0.537
-351.7
-175.9
359.2
0.632
time(h)
-666.9
359.2
0.085
ethanol(%)*PH
291.1
145.5
359.2
0.41
0.691
ethanol(%)*time(h)
615.4
307.7
359.2
0.86
0.406
PH*time(h)
858.8
429.4
359.2
0.252
ethanol(%)*PH*time(h)
359.2
0.09
0.929
ethanol(%)
1
1237150
1237150
1237150
0.4
0.537
PH
1
742368
742368
742368
0.24
0.632
time(h)
1
10673334
10673334
10673334
3.45
0.085
2-Way Interactions
3
7205512
7205512
2401837
0.78
0.527
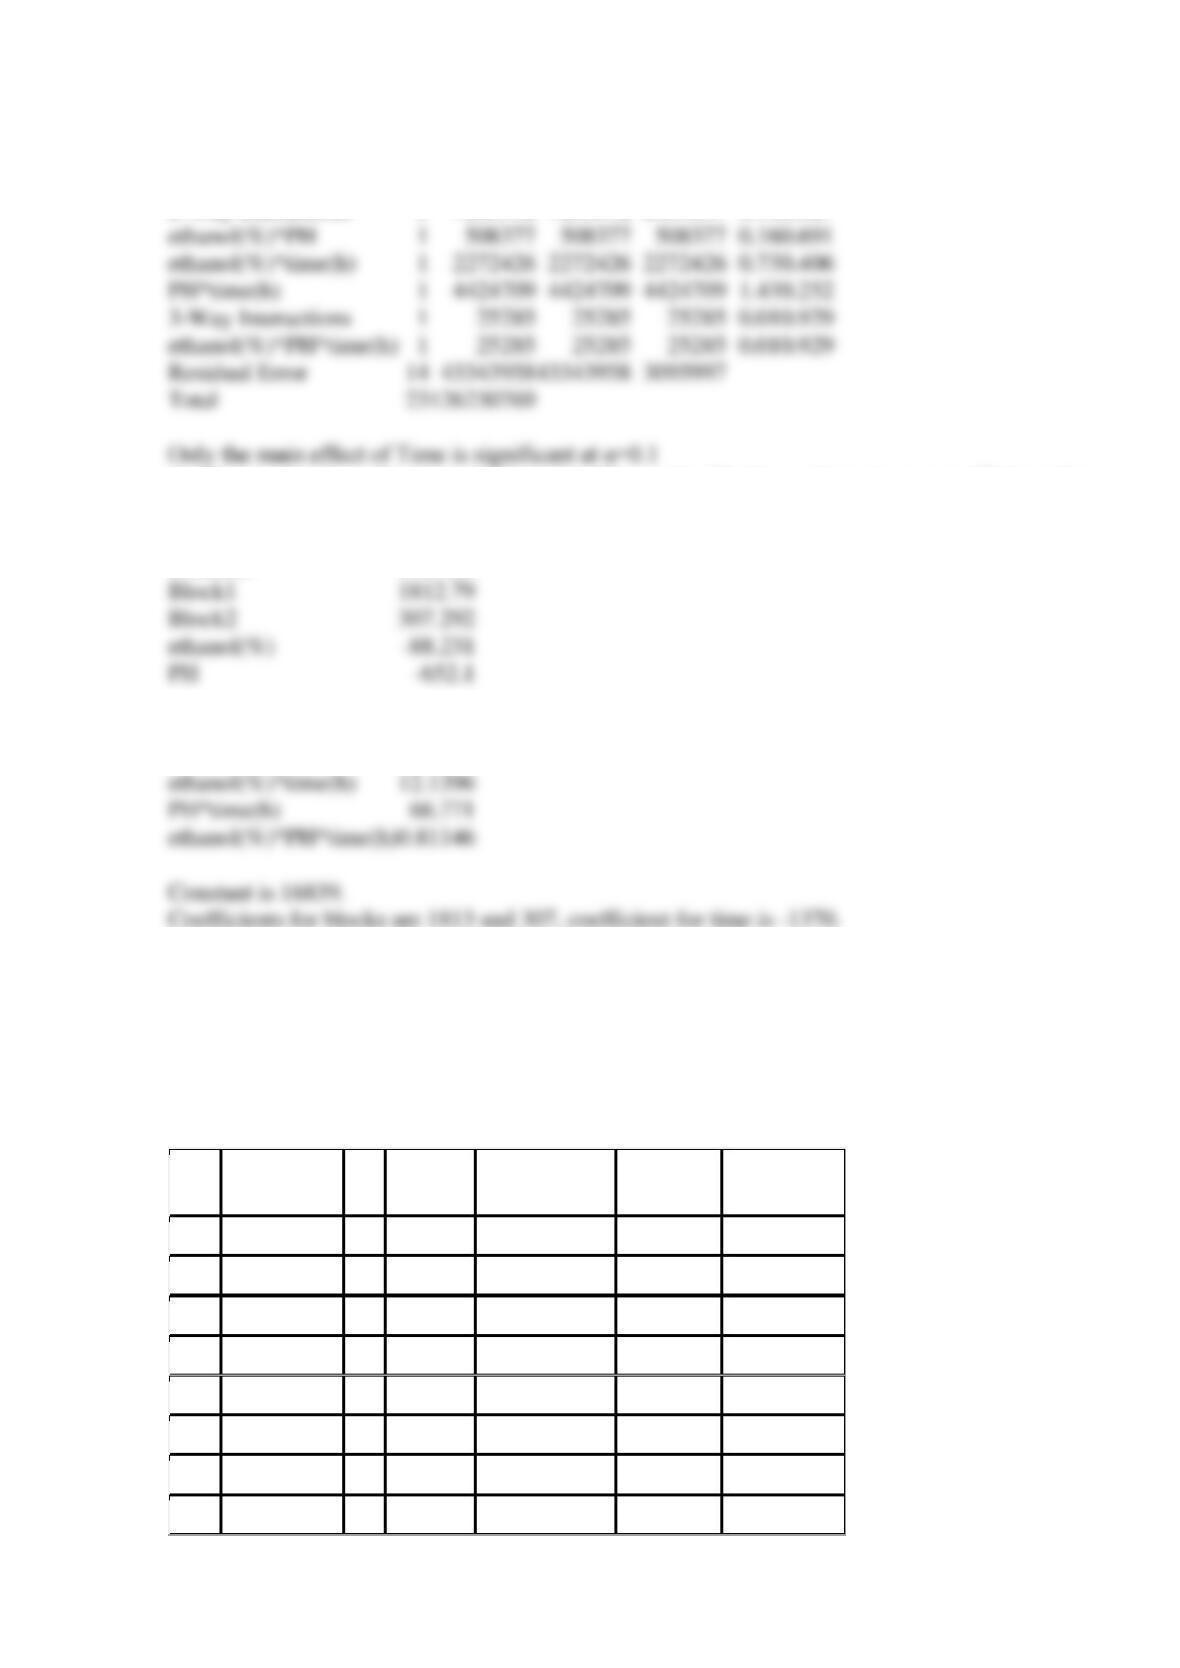
(b) We can develop a linear model, based on Time only. Blocks are important so coefficients for
blocks are included. For actual factor levels we use estimates for uncoded units:
Term
Coef
Constant
16838.5
Block1
1812.79
Block2
307.292
ethanol(%)
-88.231
PH
time(h)
–
1369.79
ethanol(%)*PH
4.8427
ethanol(%)*time(h)
12.1396
PH*time(h)
66.771
ethanol(%)*PH*time(h)
0.81146
Reserve Supplemental Exercises Chapter 14 Problem 9
Factorial design was used to study the effects of basic factors (time, ethanol, and pH) on the
extractability of polyphenolic phytochemicals from grape seeds. Total polyphenol from three
types of grape seeds (Savatiano, Moschofilero, and Agiorgitiko) were recorded. Assume that the
experiment was conducted in blocks based on seed type.
Run
Ethanol(%)
pH
Time(h)
TP
Moschofilero
TP
Savatiano
TP
Agiorgitiko
1
40
2
1
13,320
13,127
8,673
2
40
2
5
13,596
8,925
4,370
3
40
6
1
10,714
12,047
8,049
4
40
6
5
10,730
11,299
5,315
5
60
2
1
12,149
9,700
9,384
6
60
2
5
10,910
7,107
8,290
7
60
6
1
11,620
8,755
7,905
8
60
6
5
9,757
9,792
9,347
ethanol(%)*PH
1
508377
508377
508377
0.16
0.691
ethanol(%)*time(h)
1
2272426
2272426
2272426
0.73
0.406
PH*time(h)
1
4424709
4424709
4424709
1.43
0.252
3-Way Interactions
1
25285
25285
25285
0.01
0.929
ethanol(%)*PH*time(h)
1
25285
25285
25285
0.01
0.929
Residual Error
43343958
43343958
3095997
Total
126230769
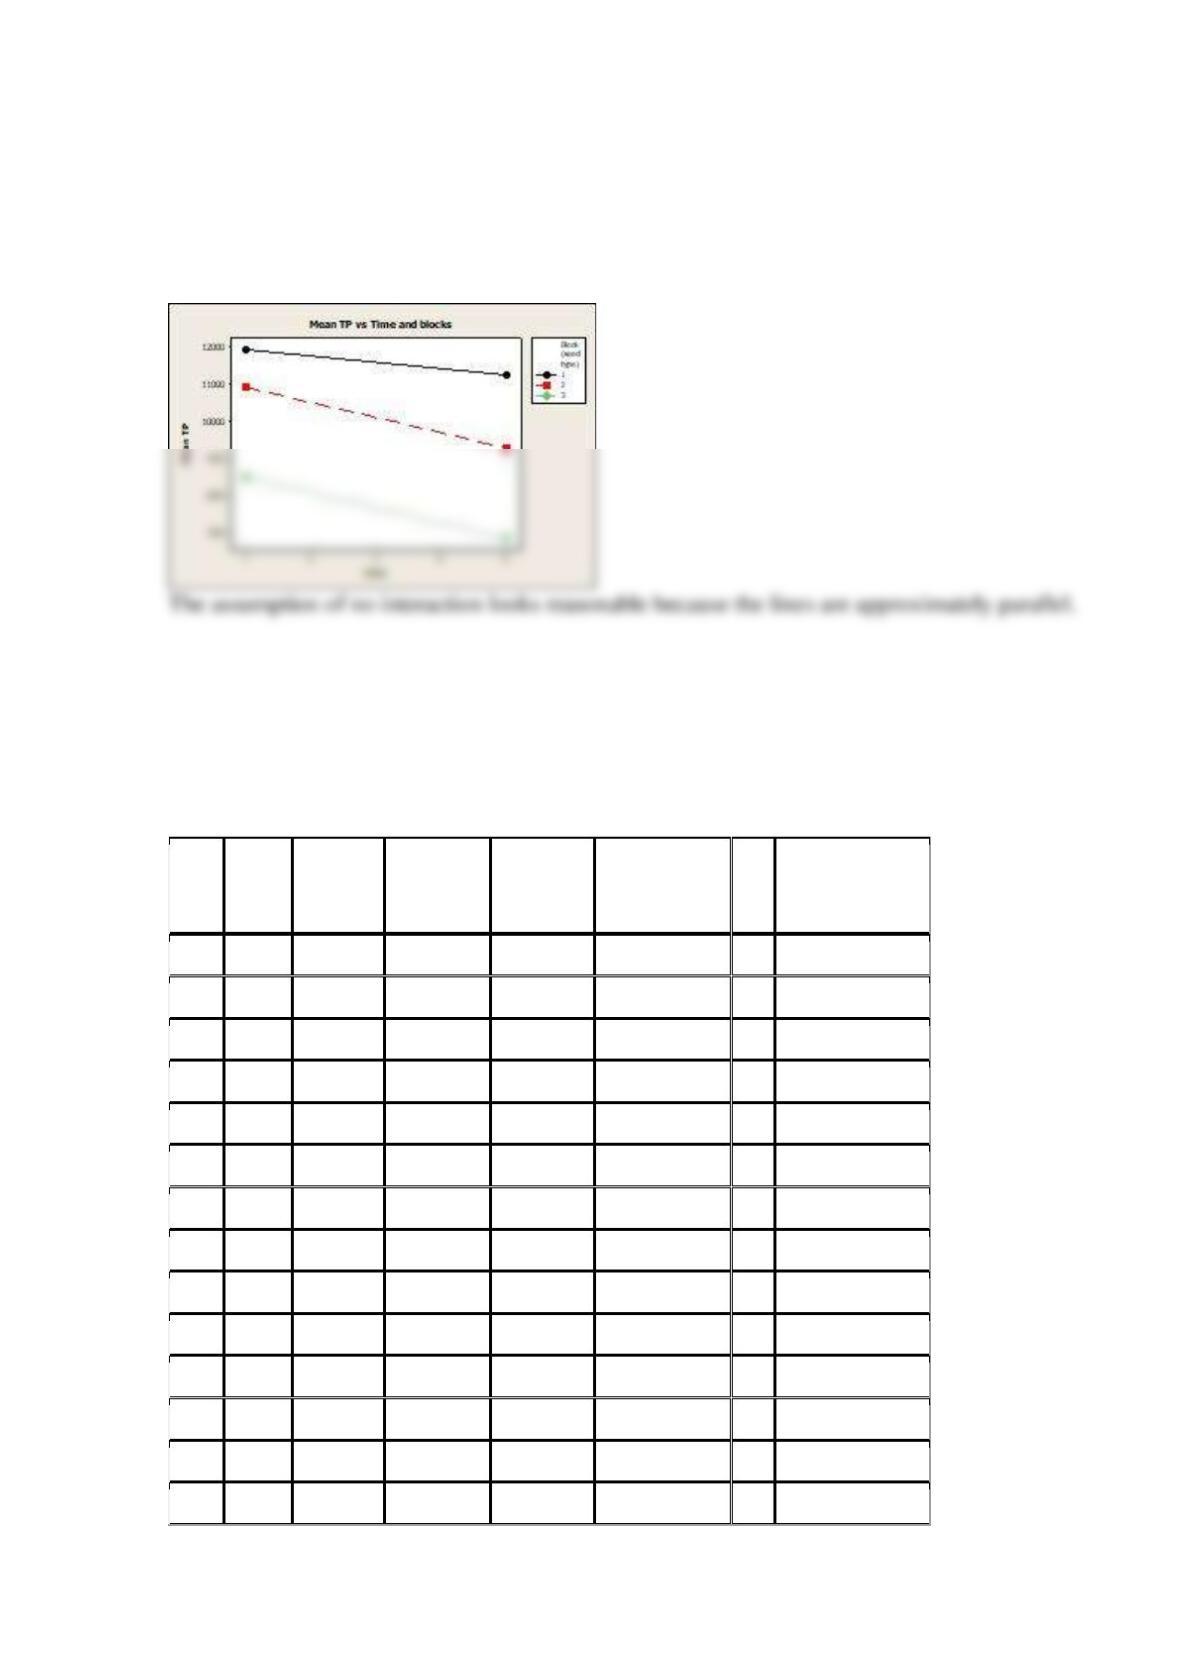
Graphically study the assumption of no interactions between blocks and treatments. Suppose that
time is the only significant factor.
Select the correct answer and explanation.
SOLUTION
The means of extract versus Time and block are plotted below.
Reserve Supplemental Exercises Chapter 14 Problem 10
An article in Journal of Applied Microbiology (2012, Vol. 113(1), pp. 36-43) described a
fractional factorial design with three center points to study six factors (yeast extract, peptone,
inoculum concentration, agitation,
temperature, and pH) for protease activity. Response units were proteolytic activity per ml
(U/ml). The data follow.
Run
Yeast
(g/L)
Peptone
(g/L)
Inoculum
(vol.%)
Agitation
(rpm)
Temperature
(°C)
pH
Protease
Activity
(U/ML)
1
5
2
1
0
34
6
29.81
2
10
2
1
0
34
8
15.52
3
5
4
1
0
34
8
18.23
4
10
4
1
0
34
6
27.25
5
5
2
3
0
34
8
25.81
6
10
2
3
0
34
6
37.21
7
5
4
3
0
34
6
22.75
8
10
4
3
0
34
8
8.01
9
5
2
1
100
34
8
26.01
10
10
2
1
100
34
6
37.21
11
5
4
1
100
34
6
26.73
12
10
4
1
100
34
8
7.4
13
5
2
3
100
34
6
36.97
14
10
2
3
100
34
8
16.24

15
5
4
3
100
34
8
18.15
16
10
4
3
100
34
6
25.3
17
5
2
1
0
40
8
32.6
18
10
2
1
0
40
6
47.33
19
5
4
1
0
40
6
37.33
20
10
4
1
0
40
8
12.32
21
5
2
3
0
40
6
37.7
22
10
2
3
0
40
8
19.01
23
5
4
3
0
40
8
36.24
24
10
4
3
0
40
6
35.88
25
5
2
1
100
40
6
39.94
26
10
2
1
100
40
8
20.34
27
5
4
1
100
40
8
38.19
28
10
4
1
100
40
6
32.72
29
5
2
3
100
40
8
52.85
30
10
2
3
100
40
6
54.61
31
5
4
3
100
40
6
41.09
32
10
4
3
100
40
8
21.34
33
7.5
3
2
50
37
7
25.1
34
7.5
3
2
50
37
7
25.5
35
7.5
3
2
50
37
7
25.3
(a) What is the generator or generators for this design?
(b) What is the resolution of this design?
(c) Choose the factors and interactions, which cause the most effect in Protease activity (up to
five terms).
(d) Construct reduced model for the effects chosen in Part C. What is the estimated coefficients
in terms of actual factor levels?
SOLUTION
(a) The generator is F=ABCDE.
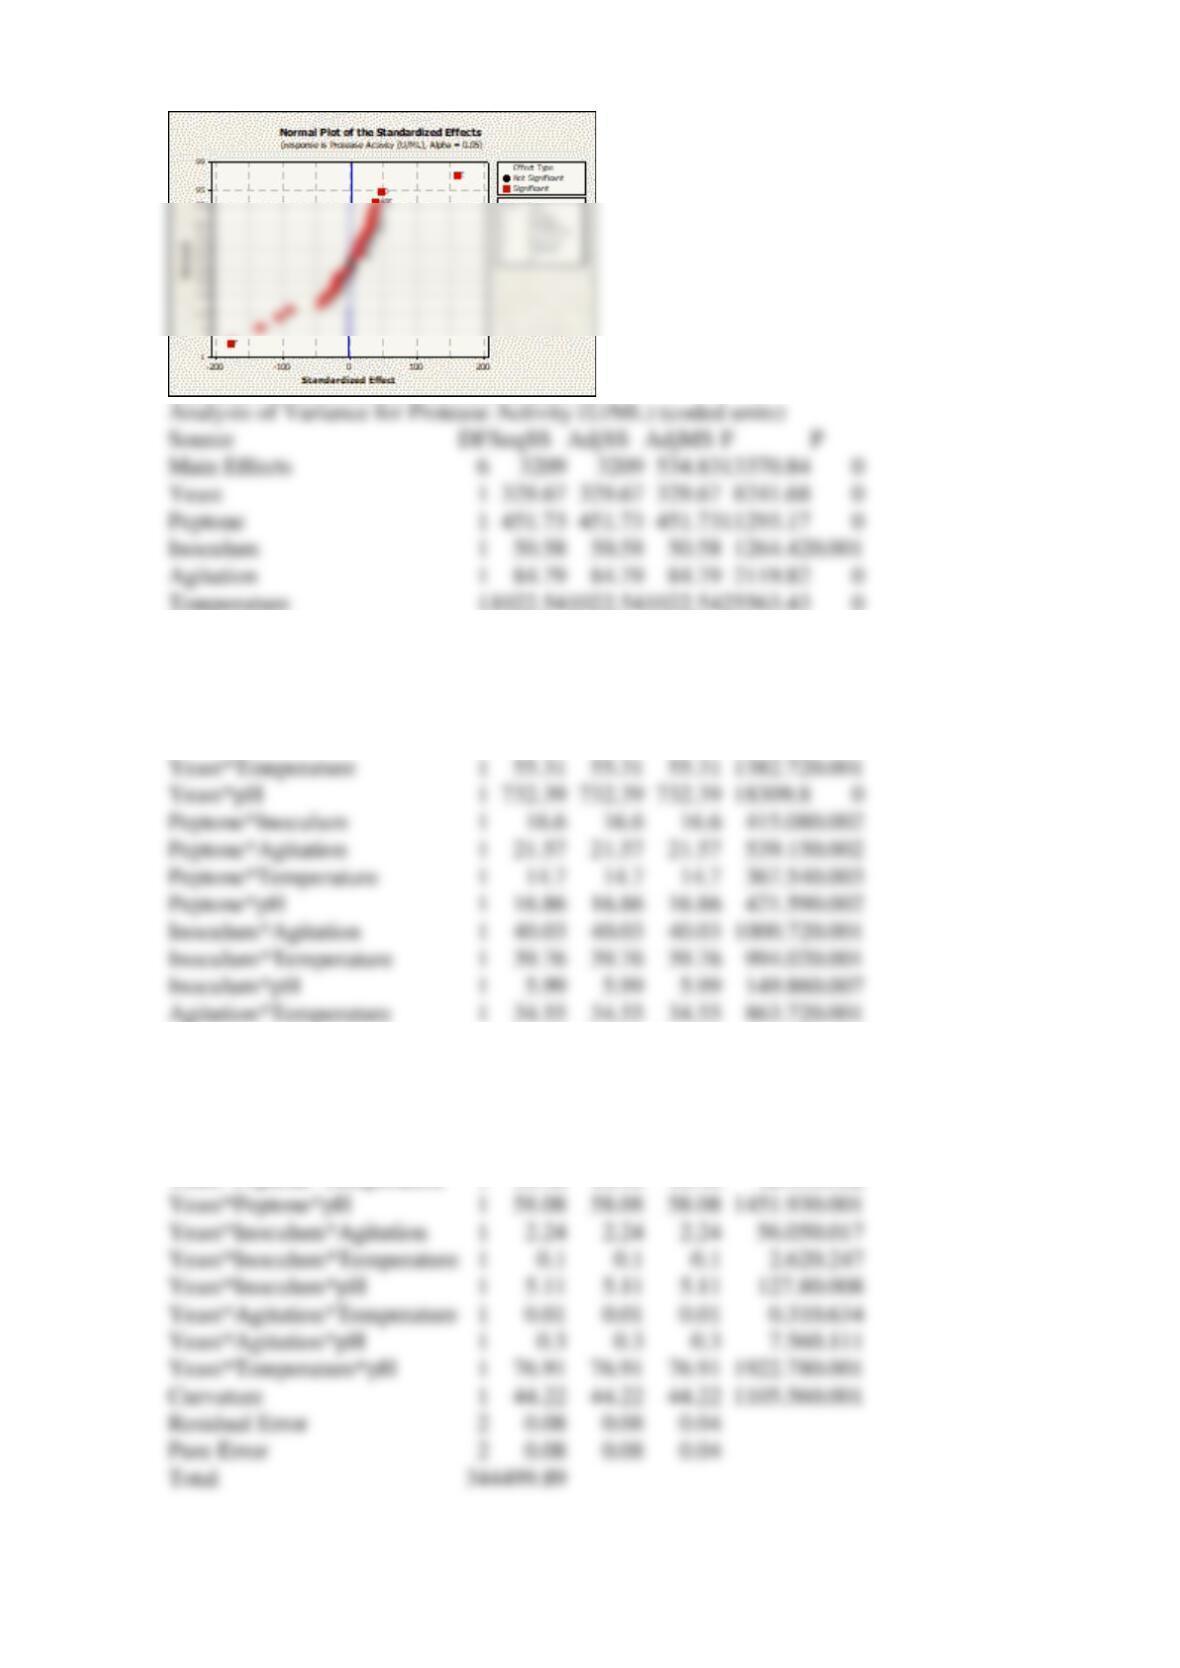
pH
1
1269.7
1269.7
1269.7
31742.55
0
2-Way Interactions
15
1049.74
1049.74
69.98
1749.57
0.001
Yeast*Peptone
1
36.7
36.7
36.7
917.53
0.001
Yeast*Inoculum
1
0.85
0.85
0.85
21.21
0.044
Yeast*Agitation
1
22.5
22.5
22.5
562.38
0.002
Yeast*Temperature
1
55.31
55.31
55.31
1382.72
0.001
Yeast*pH
1
732.39
732.39
732.39
18309.8
0
Peptone*Agitation
1
21.57
21.57
21.57
539.15
0.002
Peptone*Temperature
1
14.7
14.7
14.7
367.54
0.003
Peptone*pH
1
16.86
16.86
16.86
421.59
0.002
Inoculum*Agitation
1
40.03
40.03
40.03
1000.72
0.001
Inoculum*Temperature
1
39.76
39.76
39.76
994.02
0.001
Inoculum*pH
1
5.99
5.99
5.99
149.86
0.007
Agitation*Temperature
1
34.55
34.55
34.55
863.72
0.001
Agitation*pH
1
5.67
5.67
5.67
141.75
0.007
Temperature*pH
1
6.26
6.26
6.26
156.42
0.006
3-Way Interactions
10
196.84
196.84
19.68
492.11
0.002
Yeast*Peptone*Inoculum
1
30.79
30.79
30.79
769.79
0.001
Yeast*Peptone*Agitation
1
6.31
6.31
6.31
157.75
0.006
Yeast*Peptone*Temperature
1
16.98
16.98
16.98
424.5
0.002
Yeast*Peptone*pH
1
58.08
58.08
58.08
1451.93
0.001
Yeast*Inoculum*Agitation
1
2.24
2.24
2.24
56.05
0.017
Yeast*Inoculum*Temperature
1
0.247
Yeast*Inoculum*pH
1
5.11
5.11
5.11
127.8
0.008
Yeast*Agitation*Temperature
1
0.01
0.01
0.01
0.634
Yeast*Agitation*pH
1
0.111
Yeast*Temperature*pH
1
76.91
76.91
76.91
1922.78
0.001
Curvature
1
44.22
44.22
44.22
1105.56
0.001
Residual Error
2
0.08
0.08
0.04
Pure Error
2
0.08
0.08
0.04
Source
SeqSS
AdjSS
AdjMS
F
P
Main Effects
6
534.83
13370.84
0
Yeast
1
329.67
329.67
329.67
8241.68
0
Peptone
1
451.73
451.73
451.73
11293.17
0
Inoculum
1
50.58
50.58
50.58
1264.42
0.001
Agitation
1
84.79
84.79
84.79
2119.82
0
Temperature
1
1022.54
1022.54
1022.54
25563.43
0
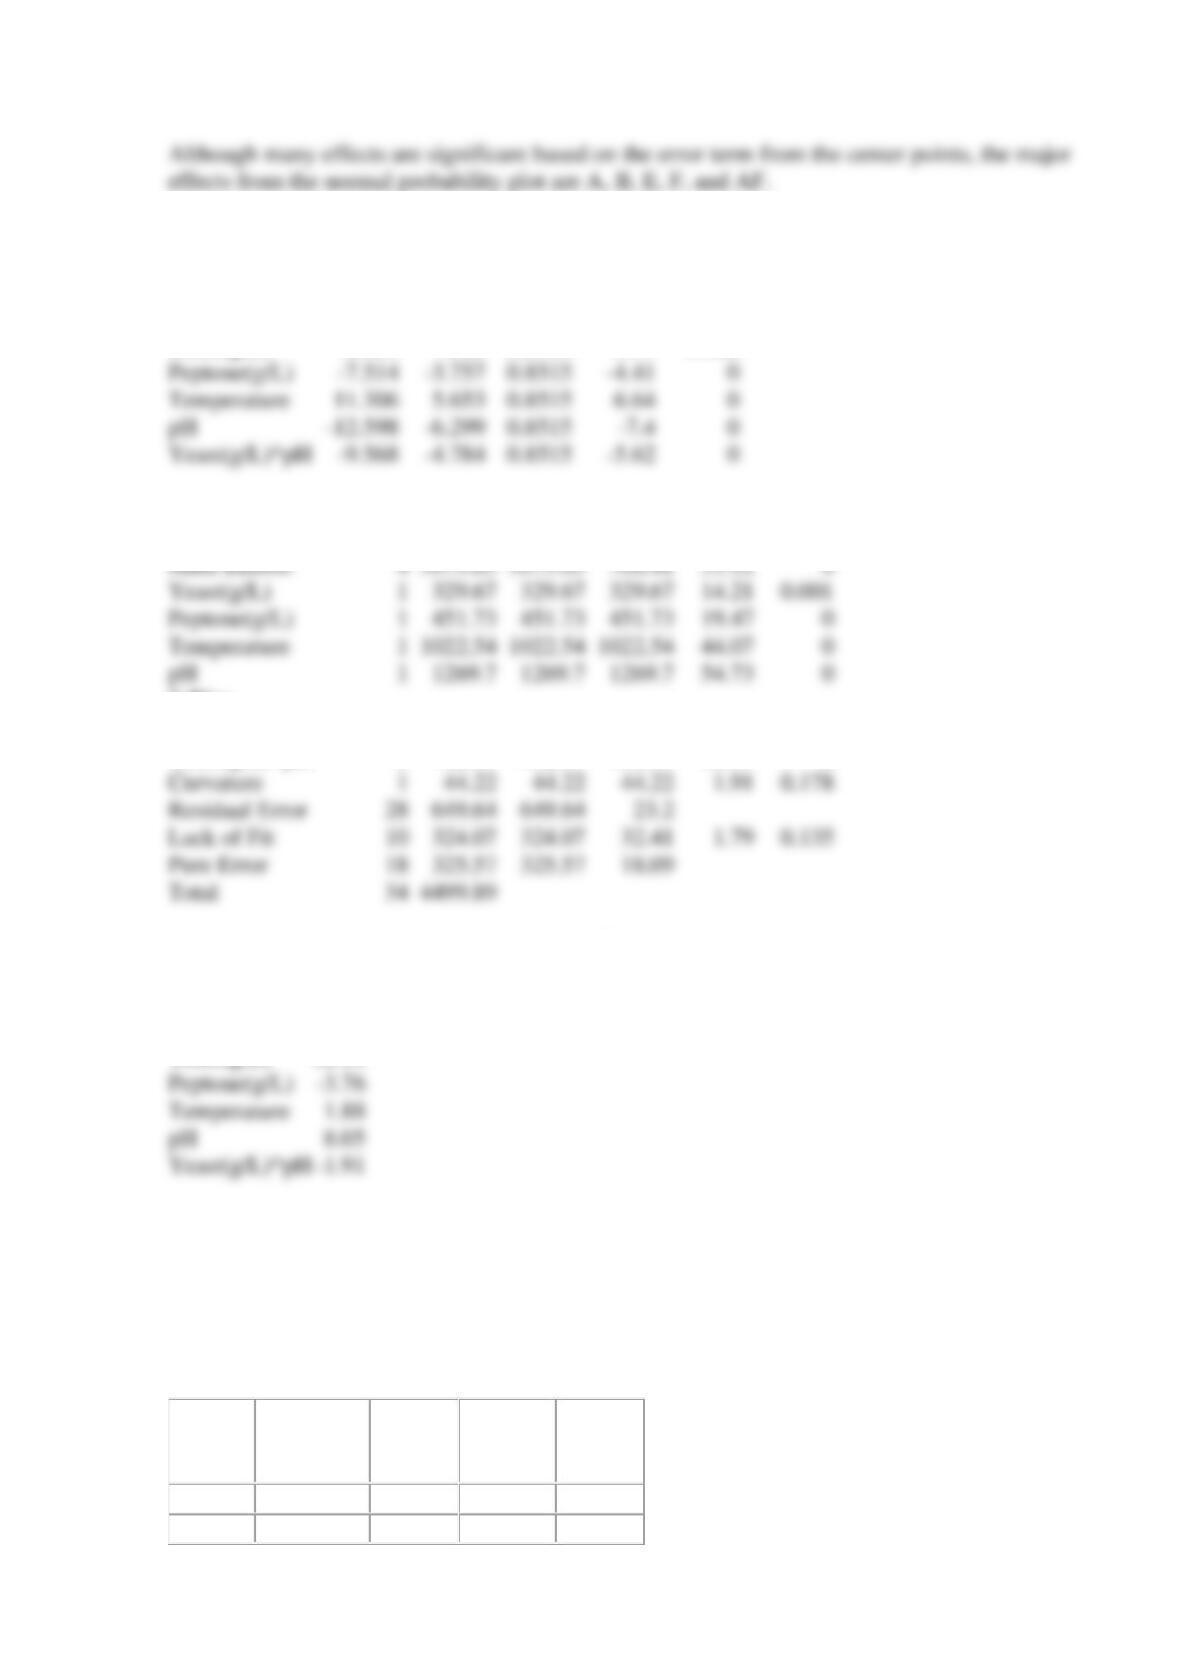
(d)
Factorial fit with chosen terms:
Term
Effect
Coef
SE Coef
T
P
Constant
29.315
0.8515
34.43
0
Yeast(g/L)
-6.419
-3.21
0.8515
-3.77
0.001
Peptone(g/L)
-7.514
-3.757
0.8515
-4.41
0
Temperature
11.306
0.8515
0
pH
-6.299
0.8515
0
Yeast(g/L)*pH
-9.568
-4.784
0.8515
-5.62
0
Analysis of variance:
Source
DF
Seq SS
Adj SS
Adj MS
F
P
Main Effects
4
768.41
33.12
0
Yeast(g/L)
1
329.67
329.67
329.67
14.21
0.001
Peptone(g/L)
1
451.73
451.73
451.73
19.47
0
Temperature
1
44.07
0
pH
1
1269.7
1269.7
1269.7
54.73
0
2-Way
Interactions
1
732.39
732.39
732.39
31.57
0
Yeast(g/L)*pH
1
732.39
732.39
732.39
31.57
0
Curvature
1
0.178
Residual Error
649.64
649.64
Lack of Fit
324.07
324.07
0.135
Pure Error
325.57
325.57
Total
For actual factor levels we use estimated coefficients in uncoded units:
Term
Coef
Constant
–
75.87
Yeast(g/L)
12.11
Peptone(g/L)
Temperature
pH
Yeast(g/L)*pH
Reserve Supplemental Exercises Chapter 14 Problem 11
Consider an unreplicated 2k factorial, and suppose that one of the treatment combinations is
missing. One logical approach to this problem is to estimate the missing value with a number
that makes the highest order interaction estimate zero. Apply this technique to the design
following, assuming that ab is missing.
A(Gap)
B(Pressure)
C(Flow)
D(Power)
Etch
Rate
(Å/min)
-1
-1
-1
-1
550
1
-1
-1
-1
669
-1
1
-1
-1
604
1
1
-1
-1
missed
ab
-1
-1
1
-1
633
1
-1
1
-1
642
-1
1
1
-1
601
1
1
1
-1
635
-1
-1
-1
1
1037
1
-1
-1
1
749
-1
1
-1
1
1052
1
1
-1
1
868
-1
-1
1
1
1075
1
-1
1
1
860
-1
1
1
1
1063
1
1
1
1
729
Estimate the missing value.
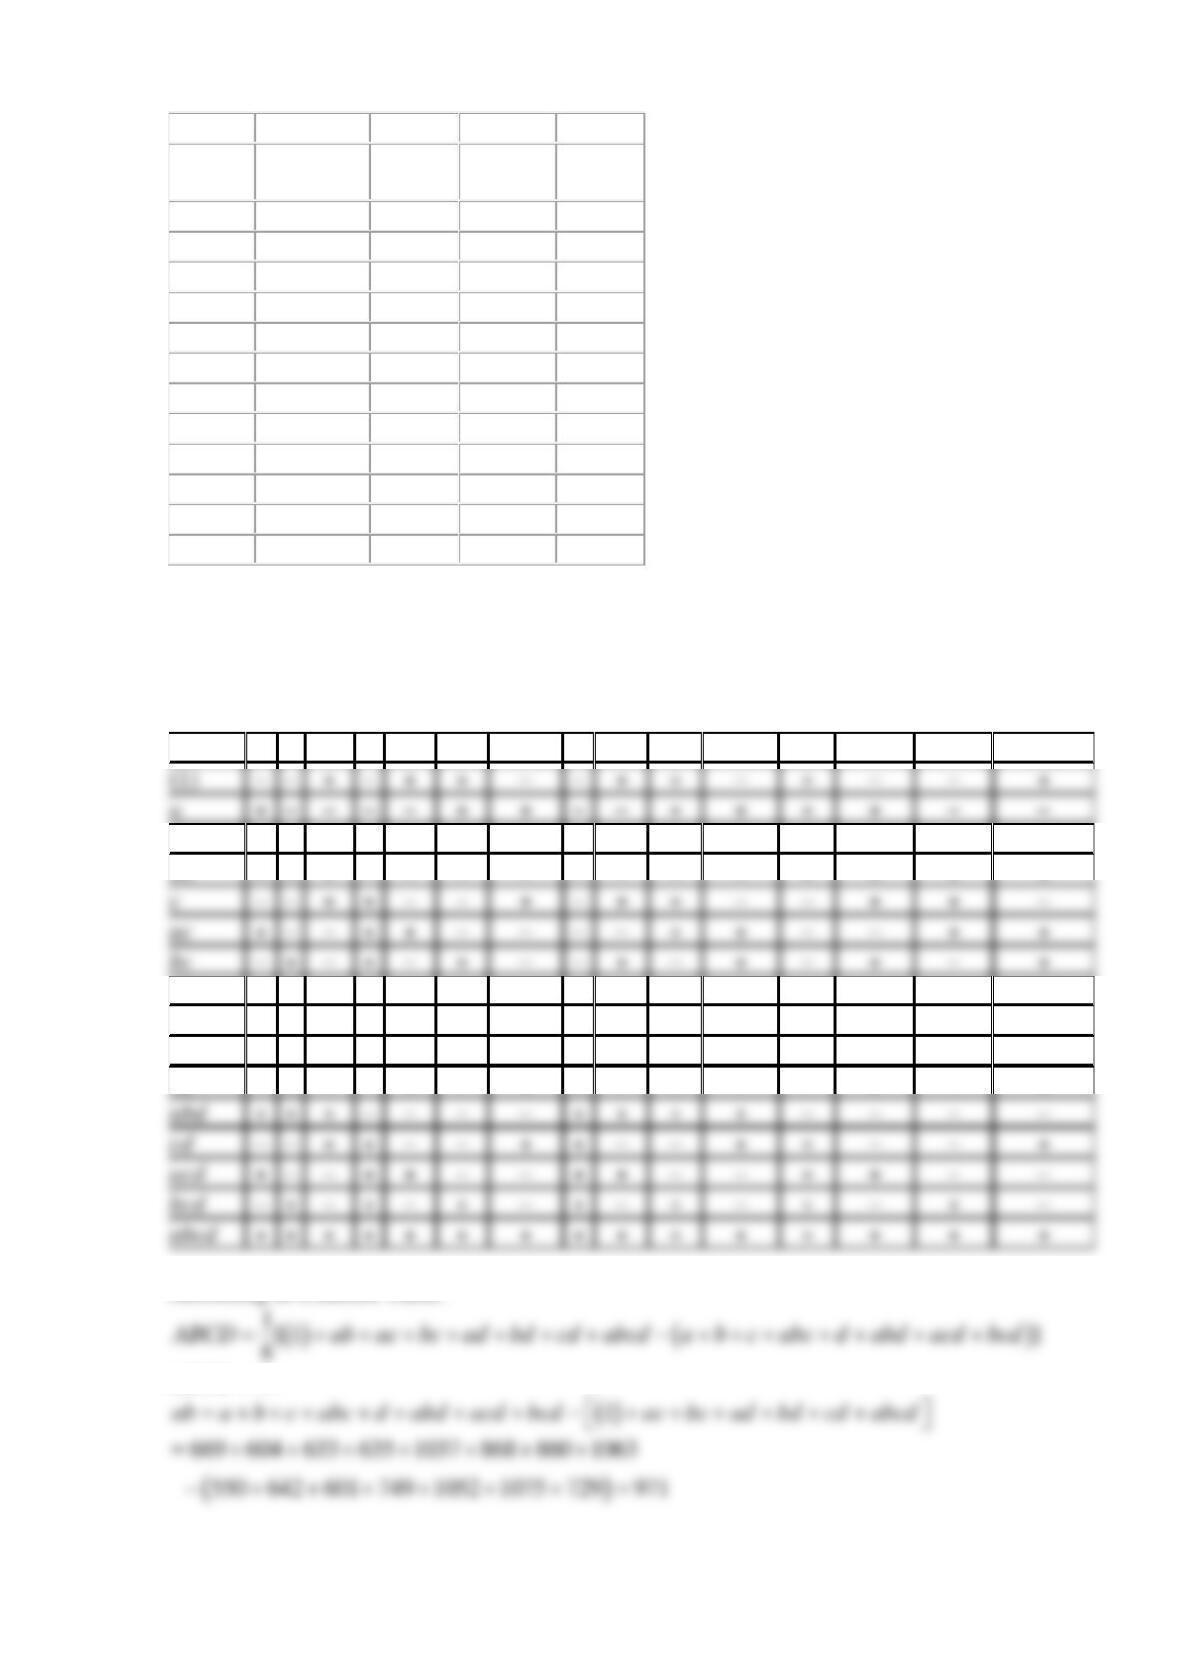
SOLUTION
Highest order interaction is ABCD. The table shows the contrast constants for 24 design.
A
B
AB
C
AC
BC
ABC
D
AD
BD
ABD
CD
ACD
BCD
ABCD
b
–
+
–
–
+
–
+
–
+
–
+
+
–
+
–
ab
+
+
+
–
–
–
–
–
–
–
–
+
+
+
+
–
–
+
+
–
–
+
–
+
+
–
–
+
+
–
ac
+
–
–
+
+
–
–
–
–
+
+
–
–
+
+
bc
–
+
–
+
–
+
–
–
+
–
+
–
+
–
+
abc
+
+
+
+
+
+
+
–
–
–
–
–
–
–
–
d
–
–
+
–
+
+
–
+
–
–
+
–
+
+
–
ad
+
–
–
–
–
+
+
+
+
–
–
–
–
+
+
bd
–
+
–
–
+
–
+
+
–
+
–
–
+
–
+
abd
+
+
+
–
–
–
–
+
+
+
+
–
–
–
–
–
–
+
+
–
–
+
+
–
–
+
+
–
–
+
acd
+
–
–
+
+
–
–
+
+
–
–
+
+
–
–
bcd
–
+
–
+
–
+
–
+
–
+
–
+
–
+
–
abcd
+
+
+
+
+
+
+
+
+
+
+
+
+
+
+
According to Contrast Table:
ABCD = 0:
–
–
+
–
+
+
–
–
+
+
–
+
–
–
+
a
+
–
–
–
–
+
+
–
–
+
+
+
+
–
–
Reserve Supplemental Exercises Chapter 14 Problem 12
What blocking scheme would you recommend if it were necessary to run a
4
2
design in four
blocks of four runs each? Select effects to be confounded with blocks.
SOLUTION
2
42=
, so we select 2 effects to be confounded with blocks, their general interaction will be also
Reserve Supplemental Exercises Chapter 14 Problem 13
Consider a
2
2
design in two blocks with AB confounded with blocks.
Which of the following proofs that
AB blocks
SS SS=
?
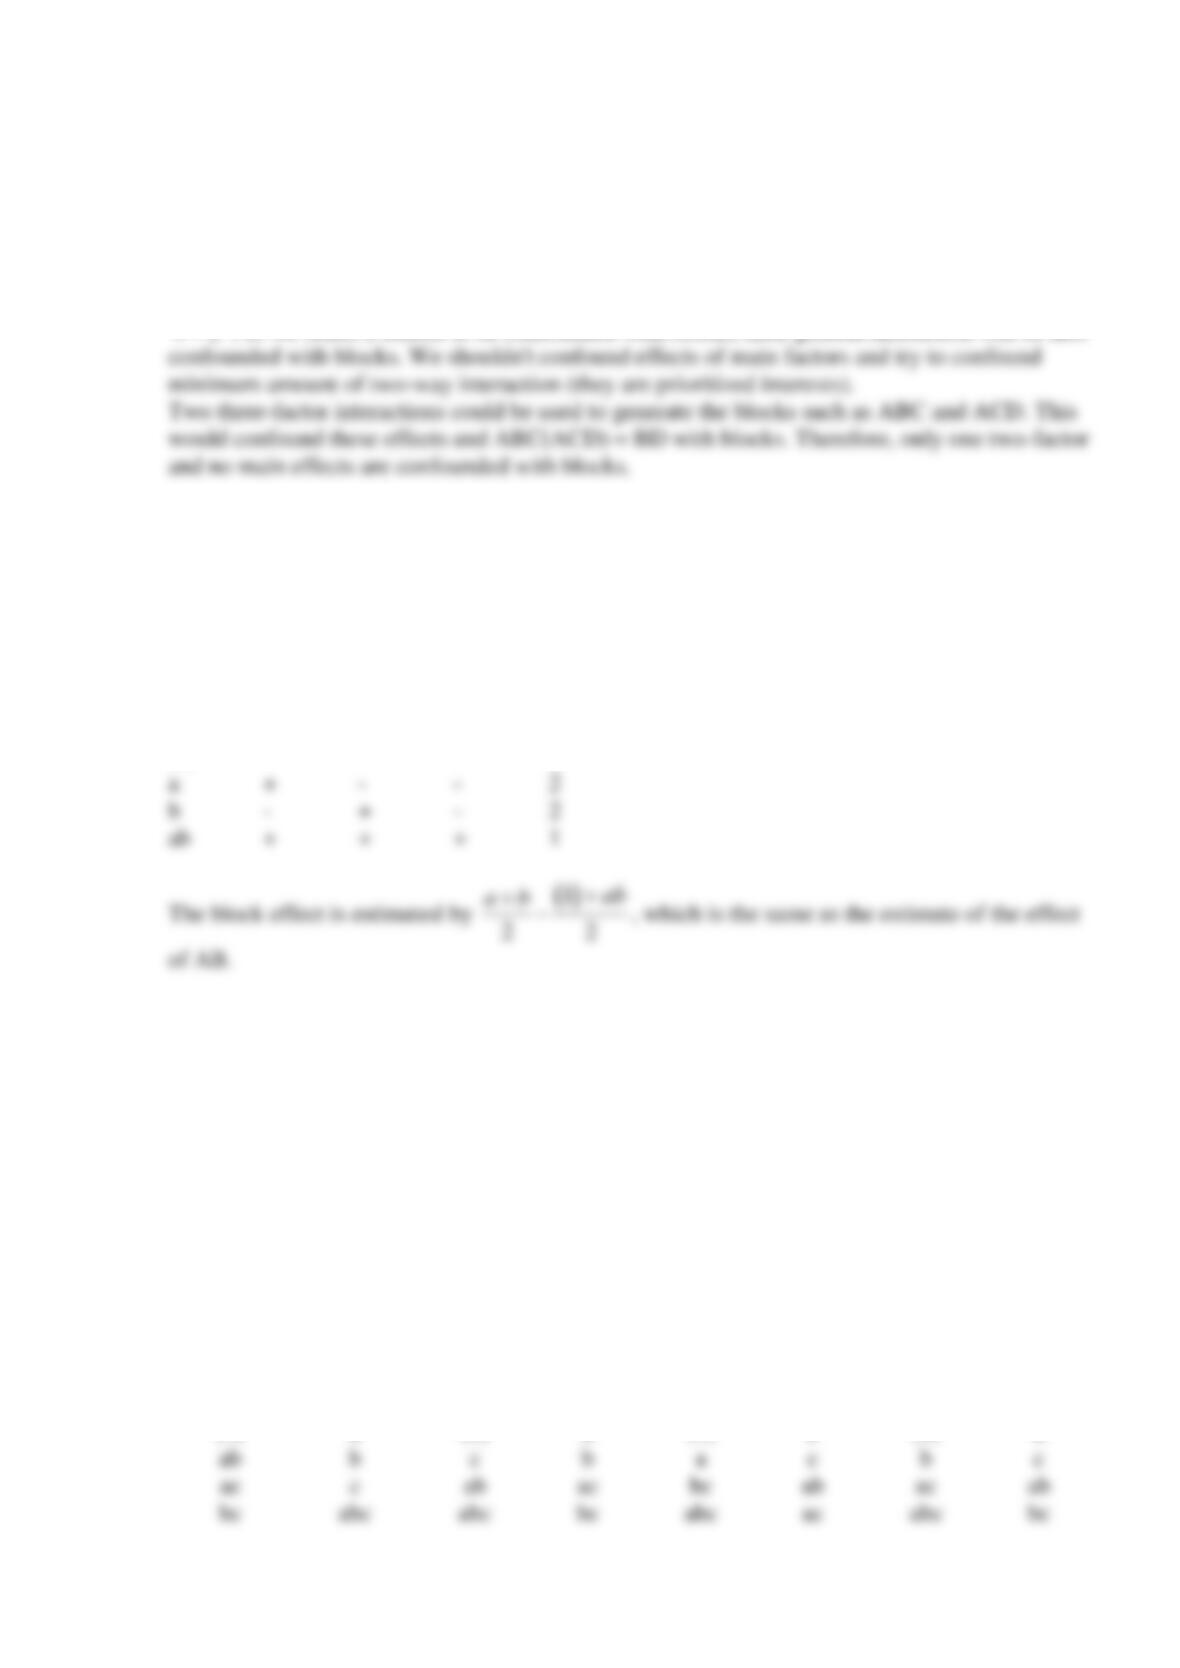
SOLUTION
A
B
AB
block
(1)
–
–
+
1
a
+
–
–
2
b
–
+
–
2
+
+
+
1
Reserve Supplemental Exercises Chapter 14 Problem 14
Consider a
3
2
design. Suppose that the largest number of runs that can be made in one block is
four, but you can afford to perform a total of 32 observations.
(a) Suggest a blocking scheme wich provides some information on all interactions.
(b) Determine the degrees of freedom for each source.
SOLUTION
(a)
A different interaction effect can be confounded in each replicate as follows.
Replicate1
Replicate2
Replicate3
Replicate4
ABC confounded
AB confounded
BC confounded
AC confounded
block1
block2
block3
block4
block5
block6
block7
block8
(1)
a
(1)
a
(1)
b
(1)
a
c
b
a
c
b
c

(b)
Source of
Variation
Degrees of
freedom
Replicates
3
Blocks with
replicates
AB (from
replicates 1, 3,
and 4)
1
replicates 1, 2,
and 3)
1
BC (from
replicates 1, 2,
and 4)
1
ABC (from
replicates 2, 3,
and 4)
1
Error (by
subtraction)
17
Total
31
AC (from
Reserve Supplemental Exercises Chapter 14 Problem 15
Construct a
51
2−
design. Suppose that it is necessary to run this design in two blocks of eight
runs each.
Choose the blocking scheme, that confounds a two-factor interaction (and its aliased three-factor
interaction) with blocks.
SOLUTION
A
B
C
D
E =
ABCD
AB =
CDE
block
–
–
–
–
+
+
1
4
A
1
B
1
C
1
+
+
+
–
–
+
1
–
–
–
+
–
+
1
+
–
–
+
+
–
2
–
+
–
+
+
–
2
+
+
–
+
–
+
1
–
–
+
+
+
+
1
+
–
+
+
–
–
2
–
+
+
+
–
–
2
+
+
+
+
+
+
1
Reserve Supplemental Exercises Chapter 14 Problem 16
Construct
72
2IV
−
design in four blocks of eight runs each.
(a) Which minimum number of two-factor interactions can be confounded in blocks?
(b) Choose the effects to confound with blocks to minimize the number of confounded two-
factor interactions.
SOLUTION
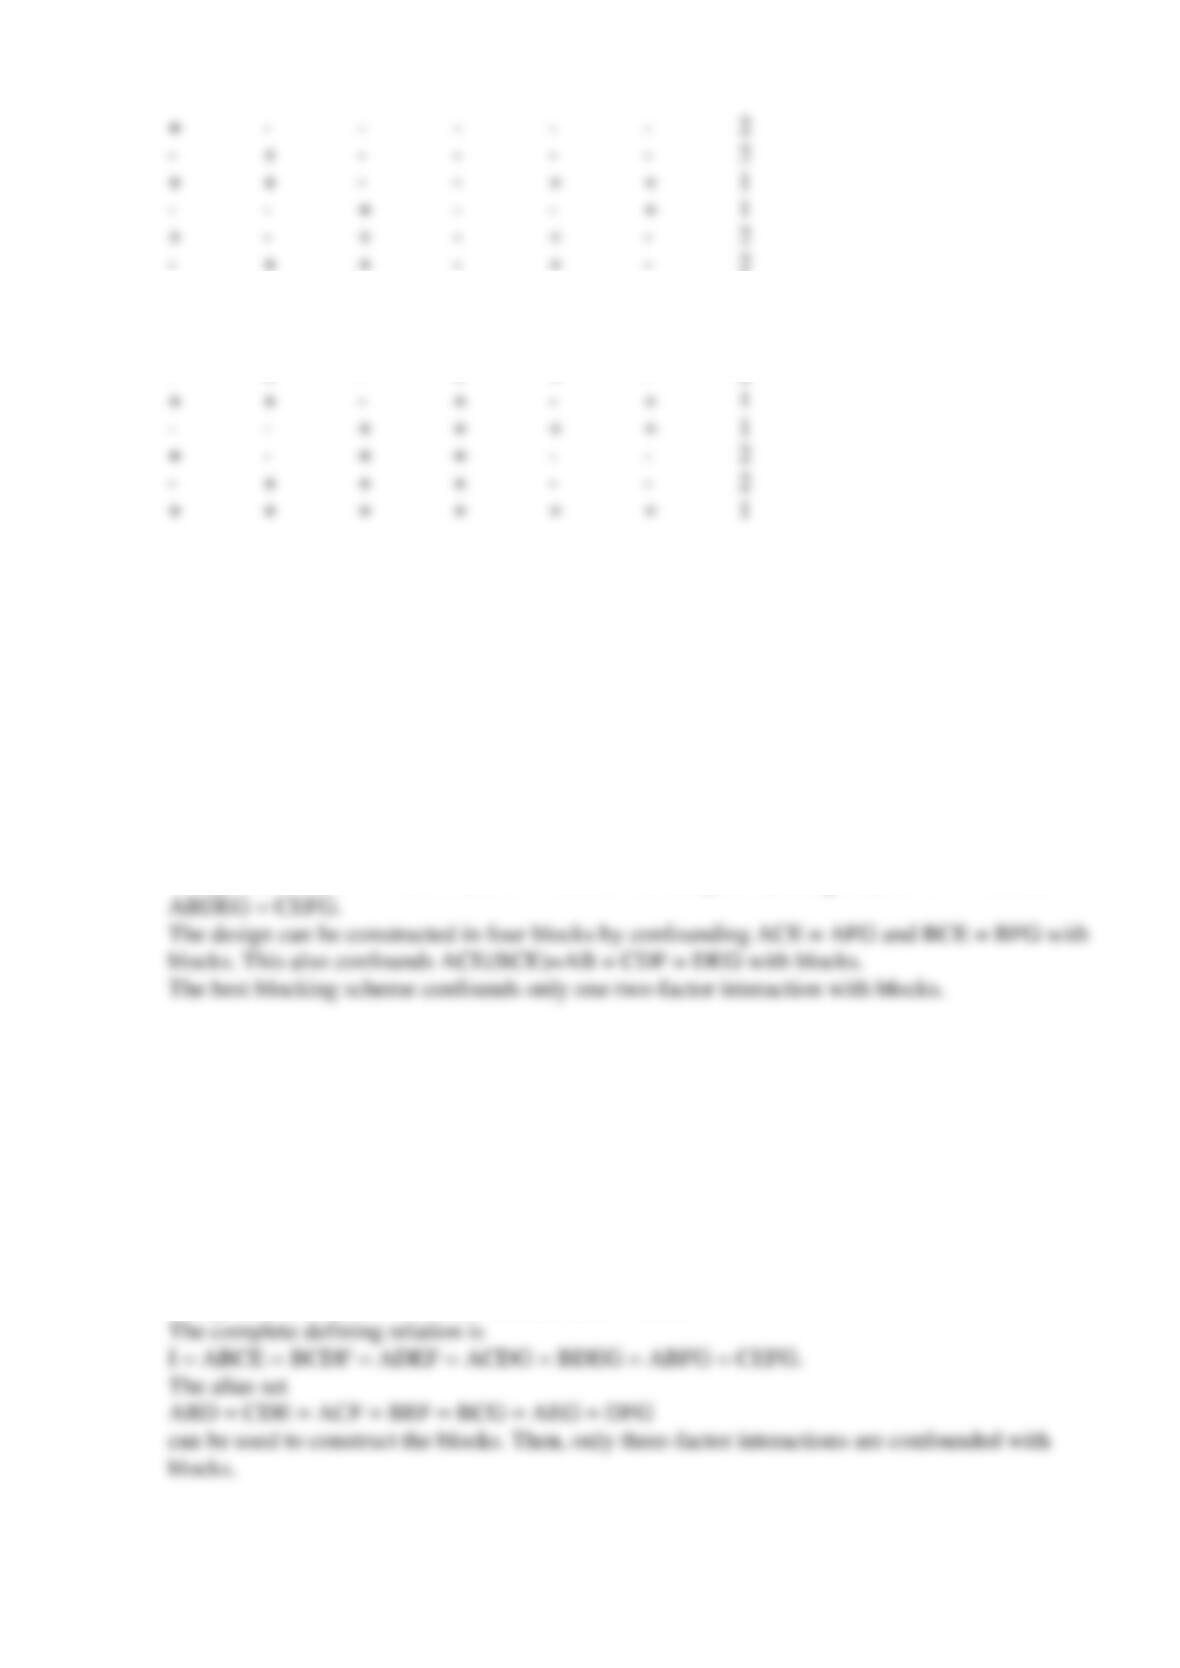
The generators are F = ABCD and G = ABDE. The complete defining relation is I = ABCDF =
Reserve Supplemental Exercises Chapter 14 Problem 17
Consider a
73
2IV
−
design with the generators E = ABC, F = BCD, and G = ACD.
Choose block generator using which this design can be confounded in two blocks of eight runs
each without losing information on any of the two-factor interactions.
SOLUTION
The generators are E = ABC, F = BCD, and G = ACD.
Reserve Supplemental Exercises Chapter 14 Problem 18
+
–
–
–
–
–
2
–
+
–
–
–
–
2
+
+
–
–
+
+
1
–
–
+
–
–
+
1
+
–
+
–
+
–
2
–
+
+
–
+
–
2
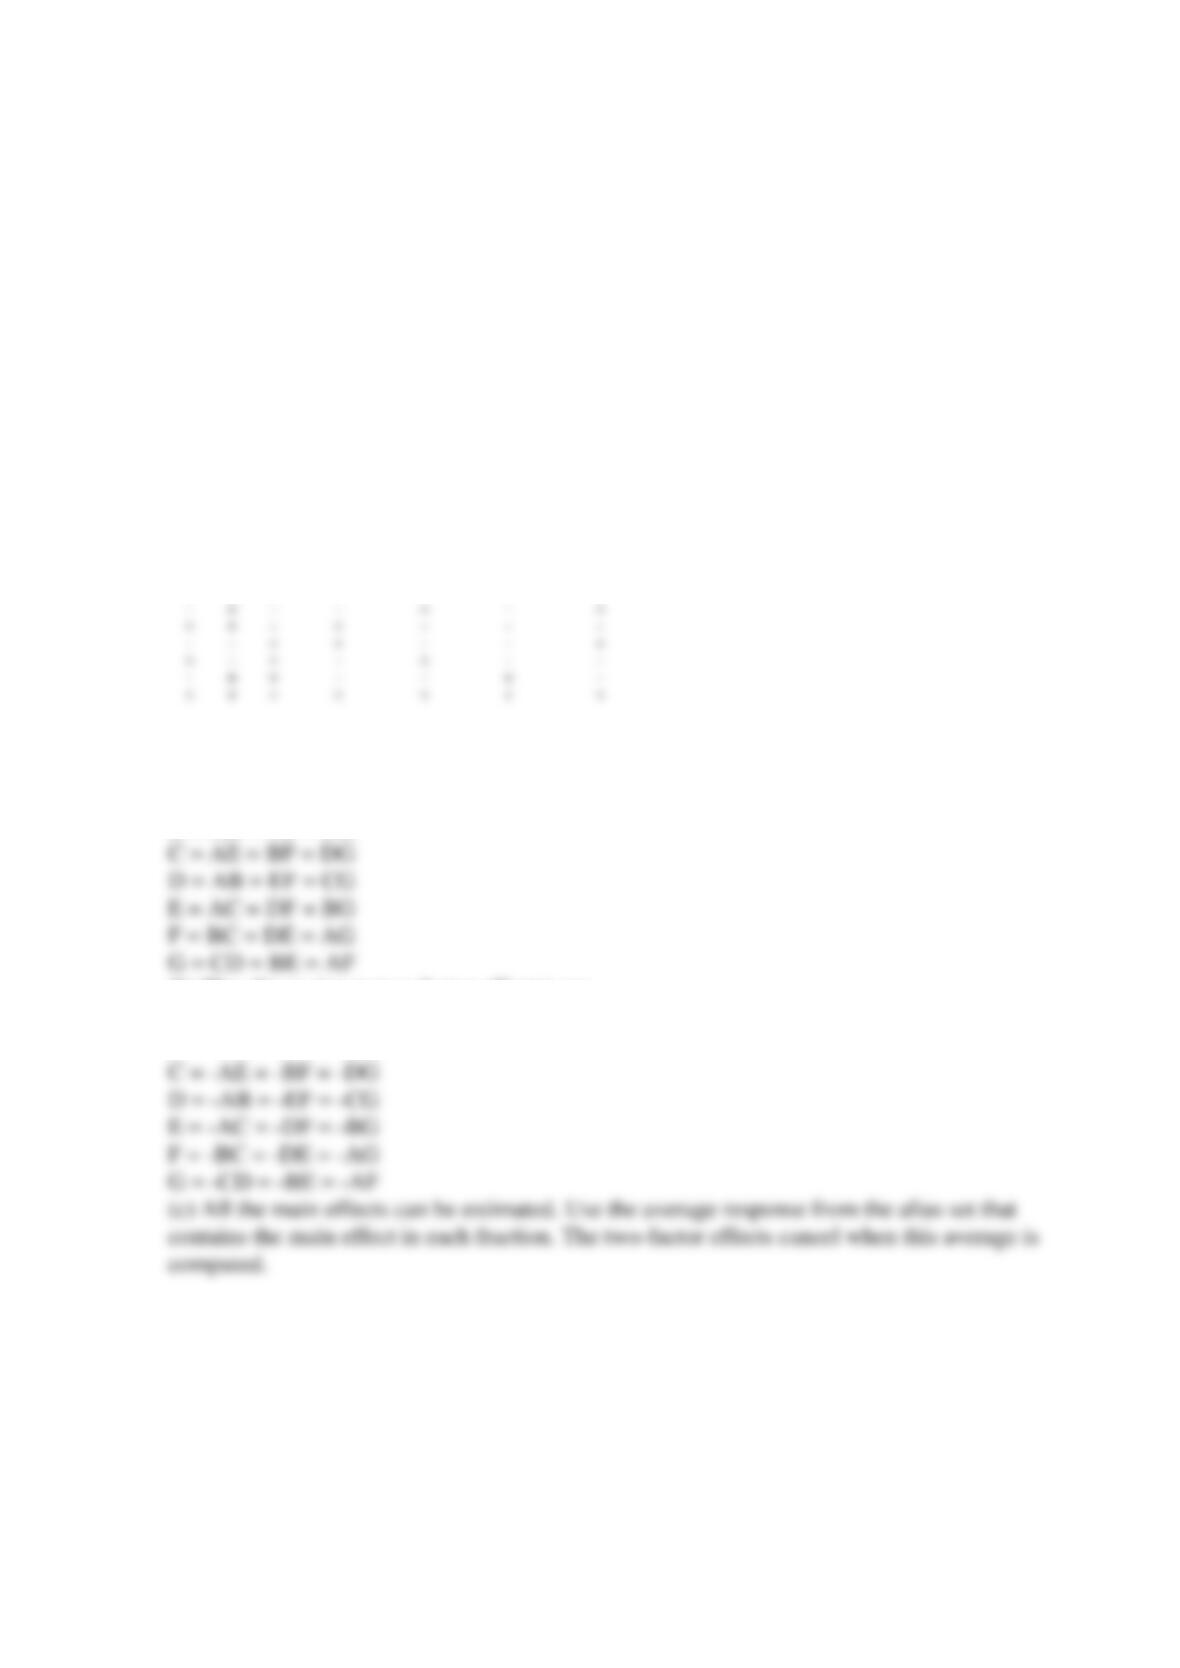
Set up a
74
2III
−
design using D = AB, E = AC, F = BC, and G = ABC as the design generators.
Ignore all interactions above two-factor interactions.
(a) Verify that each main effect is aliased with three two-factor interactions. Choose the correct
aliases for A.
(b) Construct a second
74
2III
−
design with generators D = –AB, E = –AC, F = –BC, and G = ABC
is run. What are the aliases of the D in this design?
(c) What factors may be estimated if the two sets of factor effect estimates in (a) and (b) are
combined?
SOLUTION
(a)
A
B
C
D = AB
E = AC
F = BC
G = ABC
–
–
–
+
+
+
–
+
–
–
–
–
+
+
The alias structure follows (including only one- and two-factor effects).
A = BD = CE = FG
B = AD = CF = EG
(b) The aliases (up to two-factor effects) are:
A = -BD = -CE = –FG
B = -AD = -CF = –EG
Reserve Supplemental Exercises Chapter 14 Problem 19
Consider the square root of the sum of squares for curvature and divide by the square root of
mean square error.
(a) What is the sum of squares for curvature?
(b) When the square root of the sum of squares for curvature is divided by the square root of
mean squared error, what is the resulting statistic?
–
+
–
–
+
+
+
+
–
+
–
–
–
–
+
+
–
+
+
–
+
–
+
–
–
+
+
–
–
+
–
+
+
+
+
+
+
+
(c) Can this statistic be used to conduct a t-test for curvature that is equivalent to the F test in the
ANOVA?
SOLUTION
(a) A coefficient for curvature is defined to be
FC
yy−
FC
(b)
When the square root of the sum of squares for curvature is divided by the square root of mean
squared error, the resulting statistic is
(c) If this t-statistic is significant,
FC
yy−
is large, meaning curvature is significant. This statistic
is compared to a t distribution with the degrees of freedom associated with the estimate of σ.