SOLUTION
ANOVA output:
Source
DF
SS
MS
F
P
Factor
2
0.144
0.072
0.443
0.644
Reserve Problems Chapter 13 Section 4 Problem 1
An experiment was performed to determine the effect of two different chemicals on the strength
of a fabric. These chemicals are used as part of the permanent-press finishing process. Five
fabric samples were selected, and a RCBD was run by testing each chemical type once in
random order on each fabric sample. The data are shown in the table.
type 1
type 2
1
1.2
2.1
2
1.6
2.2
3
0.5
0.4
4
1
2.2
5
1.1
2.1
a) Compare these two treatments with a paired t-test and compute the p-value.
b) Compare these two treatments with the RCBD ANOVA method and show that the square of
the t statistic in part (a) equals the value of the
0
f
statistic in this part. Compute the p-value for
the test of no treatment differences.
c) Comment on the results in parts (a) and (b).
SOLUTION
a) The parameter of interest is the difference in means for two chemicals
0 1 2
:0H
−=
Error
72
11.696
0.1624
Total
74
11.84
Reject the null hypothesis if
0 /2, 1n
tt
−
−
or
0 /2, 1n
tt
−
.
Reserve Problems Chapter 13 Section 4 Problem 2
An article in the International Journal of Sports Medicine (“The Effect of Different Dosages of
Caffeine on Endurance Performance Time,” Vol. 16, 1995) considered the effect of caffeine on
the endurance time of cyclists. The dosages were 0, 5, 9, or 13 mg and the minutes until
exhaustion at 80% of the maximum power were recorded. Nine cyclists were considered a
nuisance factor.
Caffeine Dose
Cyclist
0
5
9
13
1
36.05
42.47
51.5
37.55
2
52.47
85.15
65
59.3
3
56.55
63.2
73.1
79.12
4
45.2
52.1
64.4
58.33
5
35.25
66.2
57.45
70.54
6
66.38
73.25
76.49
69.47
7
40.57
44.5
40.55
46.48
8
57.15
57.17
66.47
66.35
9
28.34
35.05
33.17
36.2
a) Does caffeine dosage affect endurance? Use
0.05
=
.
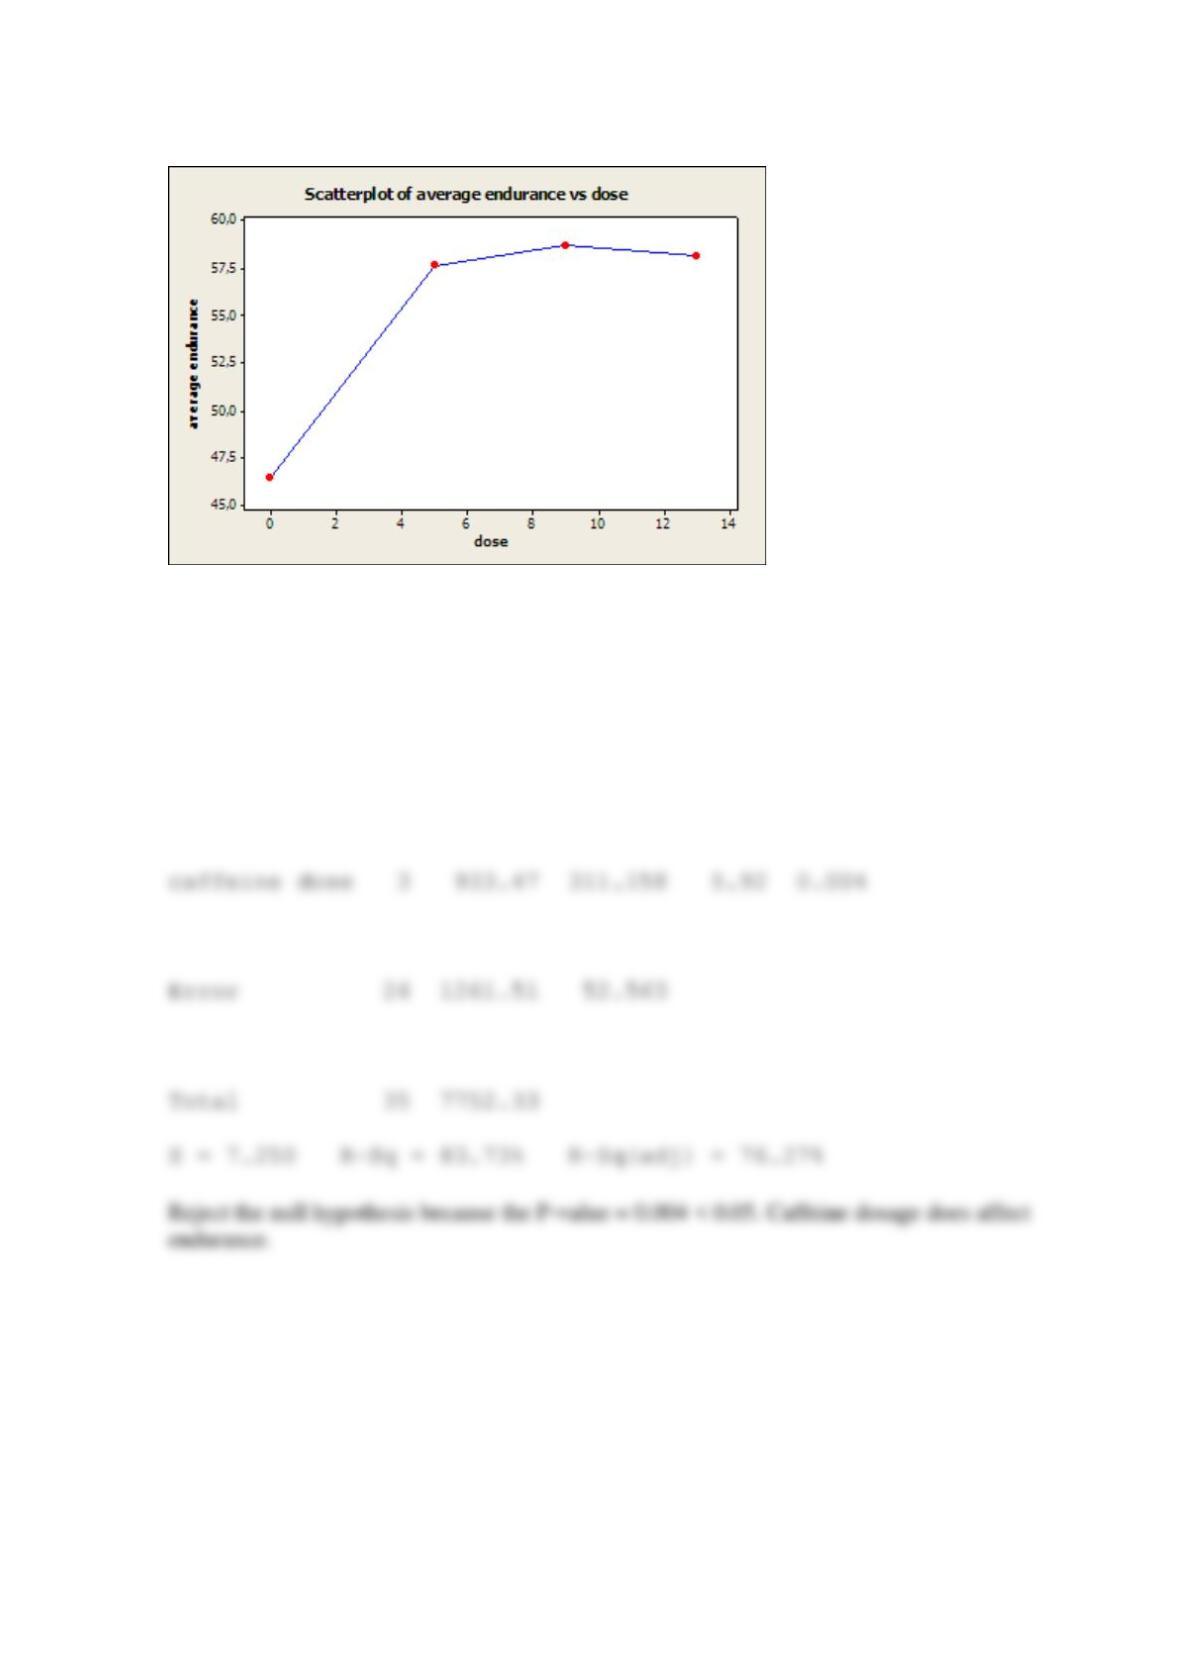
b) Use the scatterplot of average endurance against dosage to interpret the results.
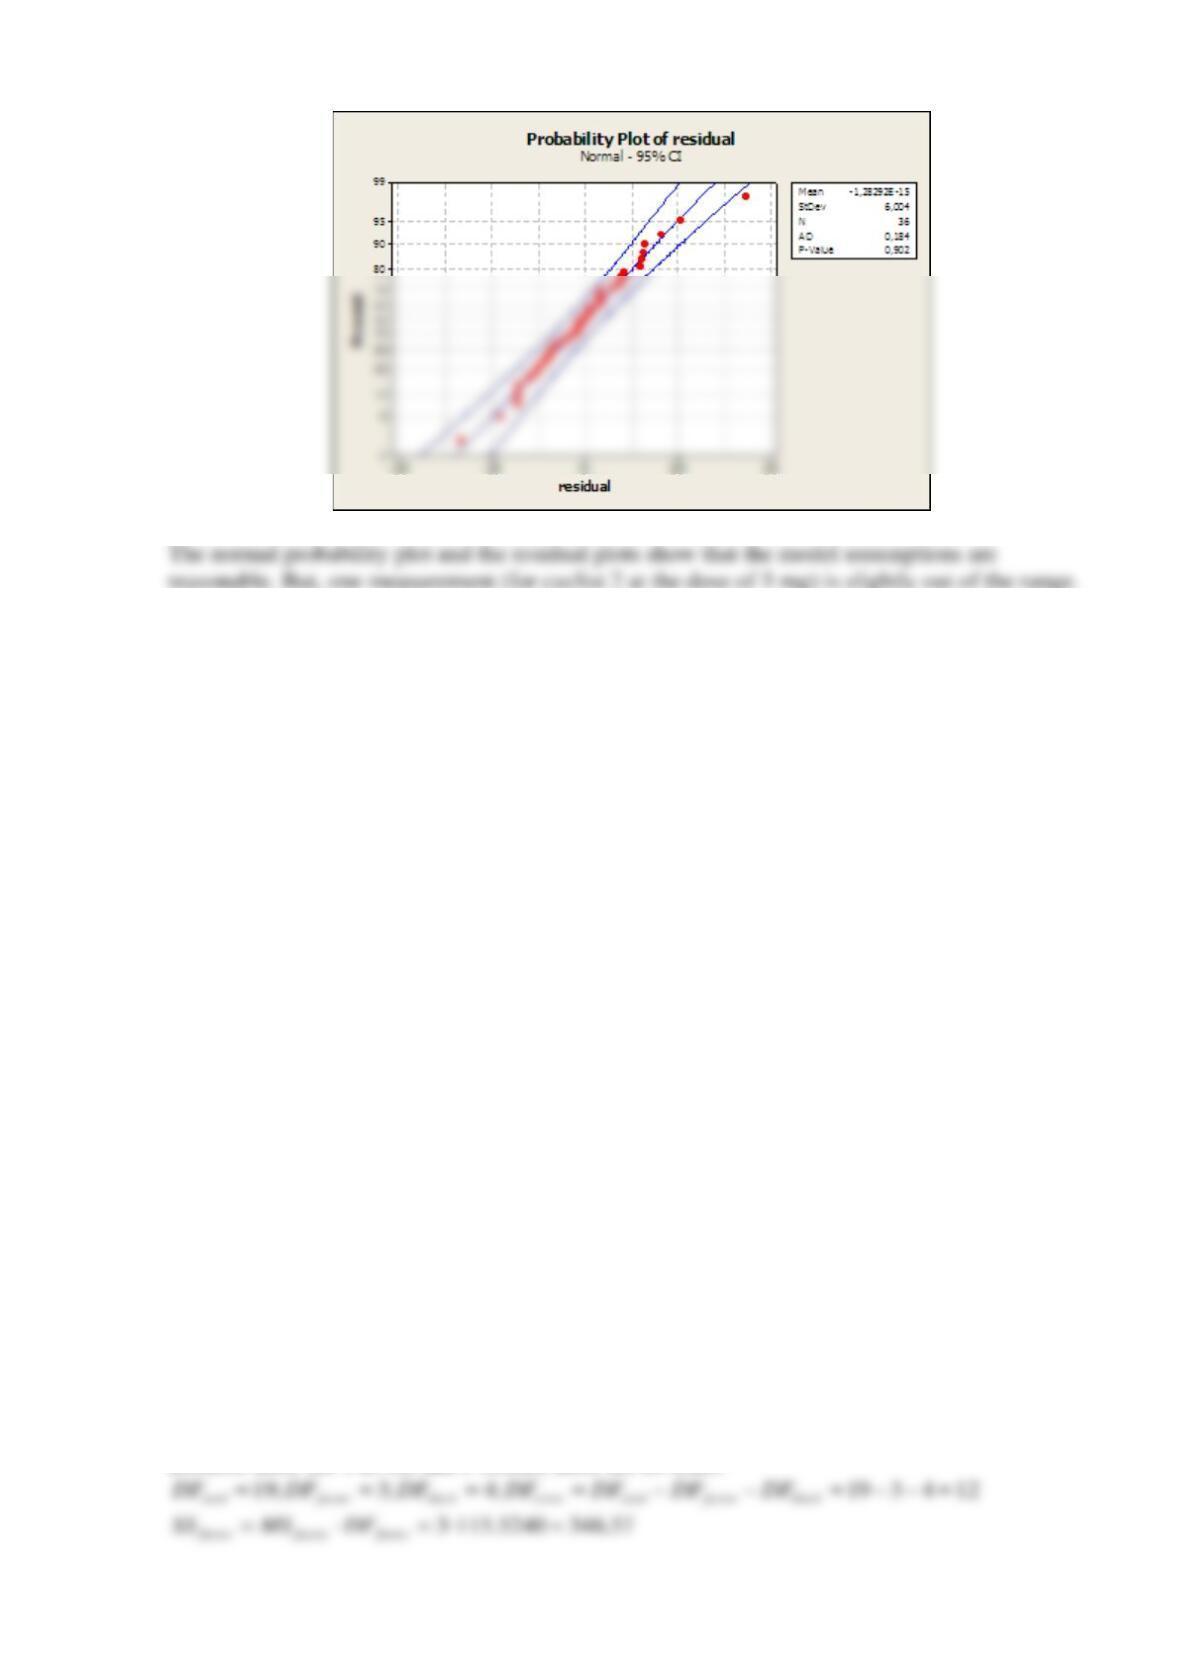
c) Analyze the residuals and comment on the model adequacy.
SOLUTION
a) ANOVA for endurance
Source DF SS MS F P
cyclist 8 5557.35 694.668 13.22 0.000
b)
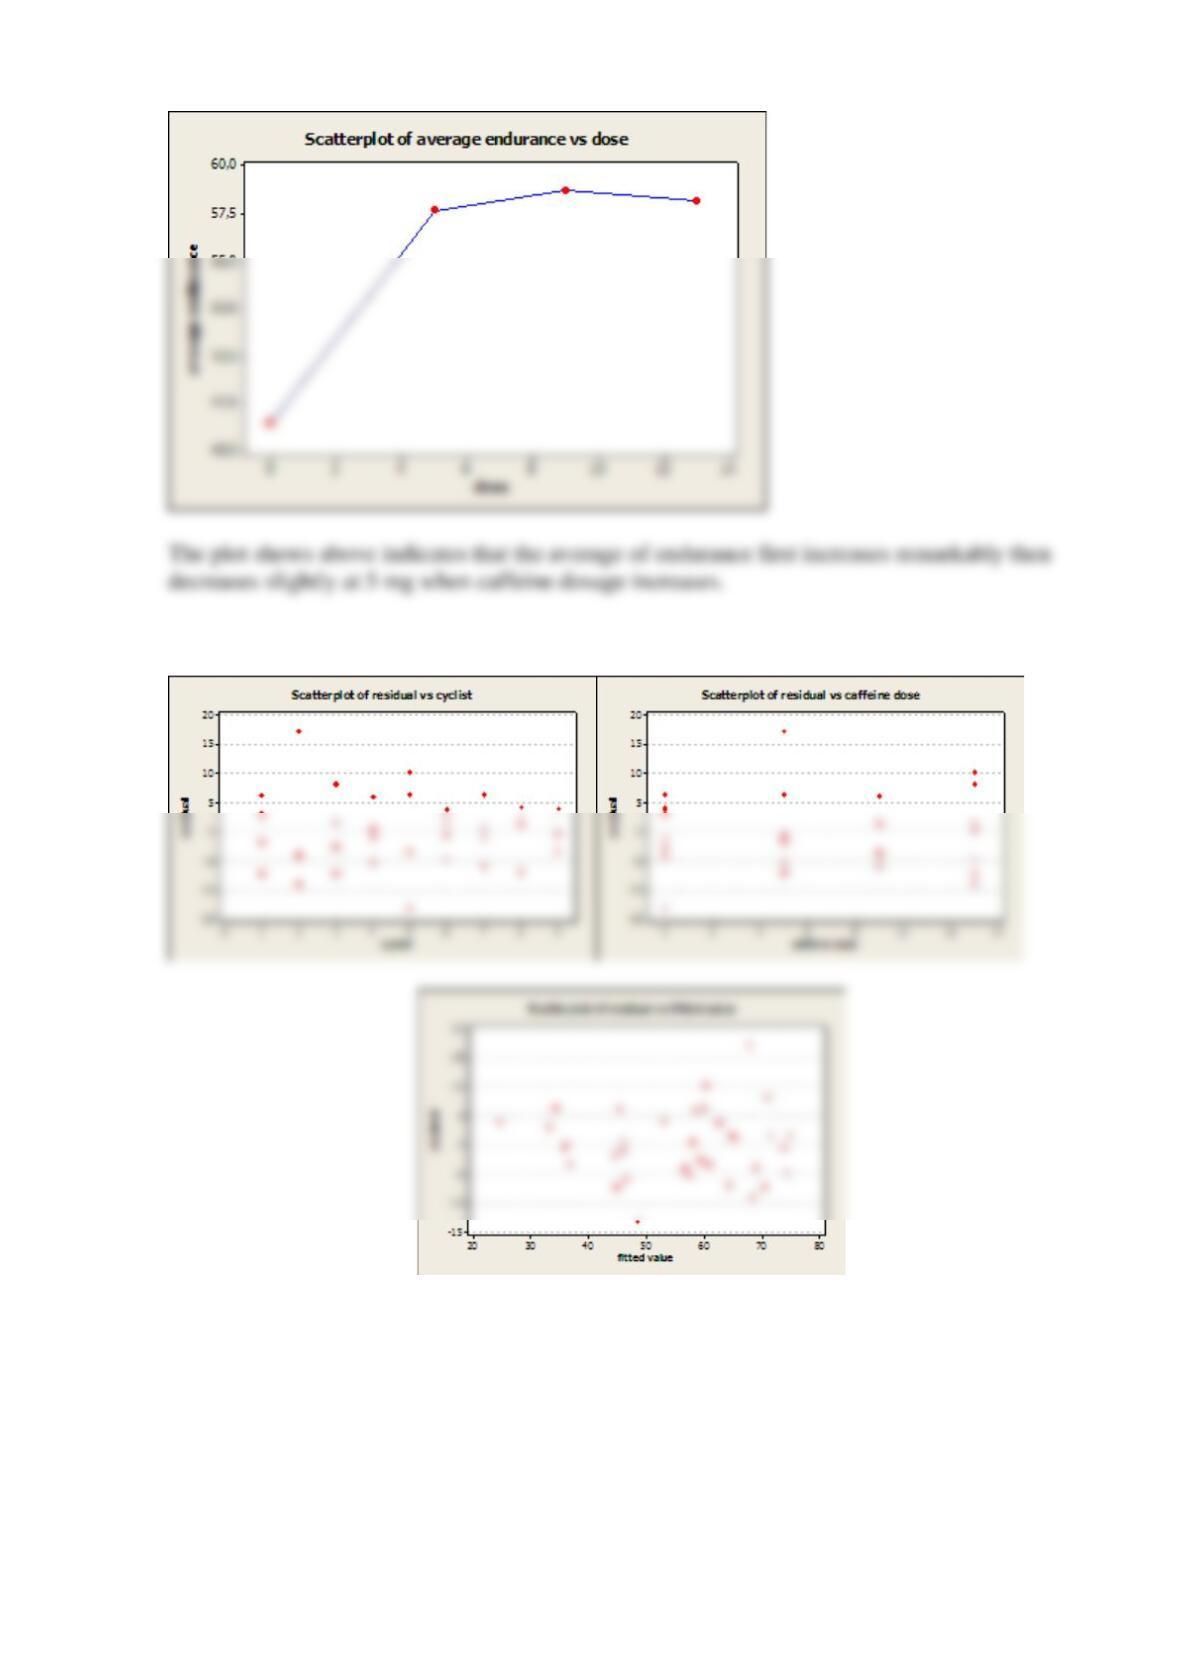
c)
Reserve Problems Chapter 13 Section 4 Problem 3
Consider the following computer output from a RCBD. There are four levels of the factor and
five blocks.
Source
DF
SS
MS
F
P
Factor
?
?
115.5240
3.698
?
Block
?
?
71.8931
Error
?
?
?
Total
?
?
Fill in the missing information.
factor
DF =
block
DF =
error
DF =
total
DF =
factor
SS =
block
SS =
error
SS =
total
SS =
error
MS =
P value−=
SOLUTION
Fill in the missing information.
Because there are 4 levels and 5 blocks, there are 20 trials.
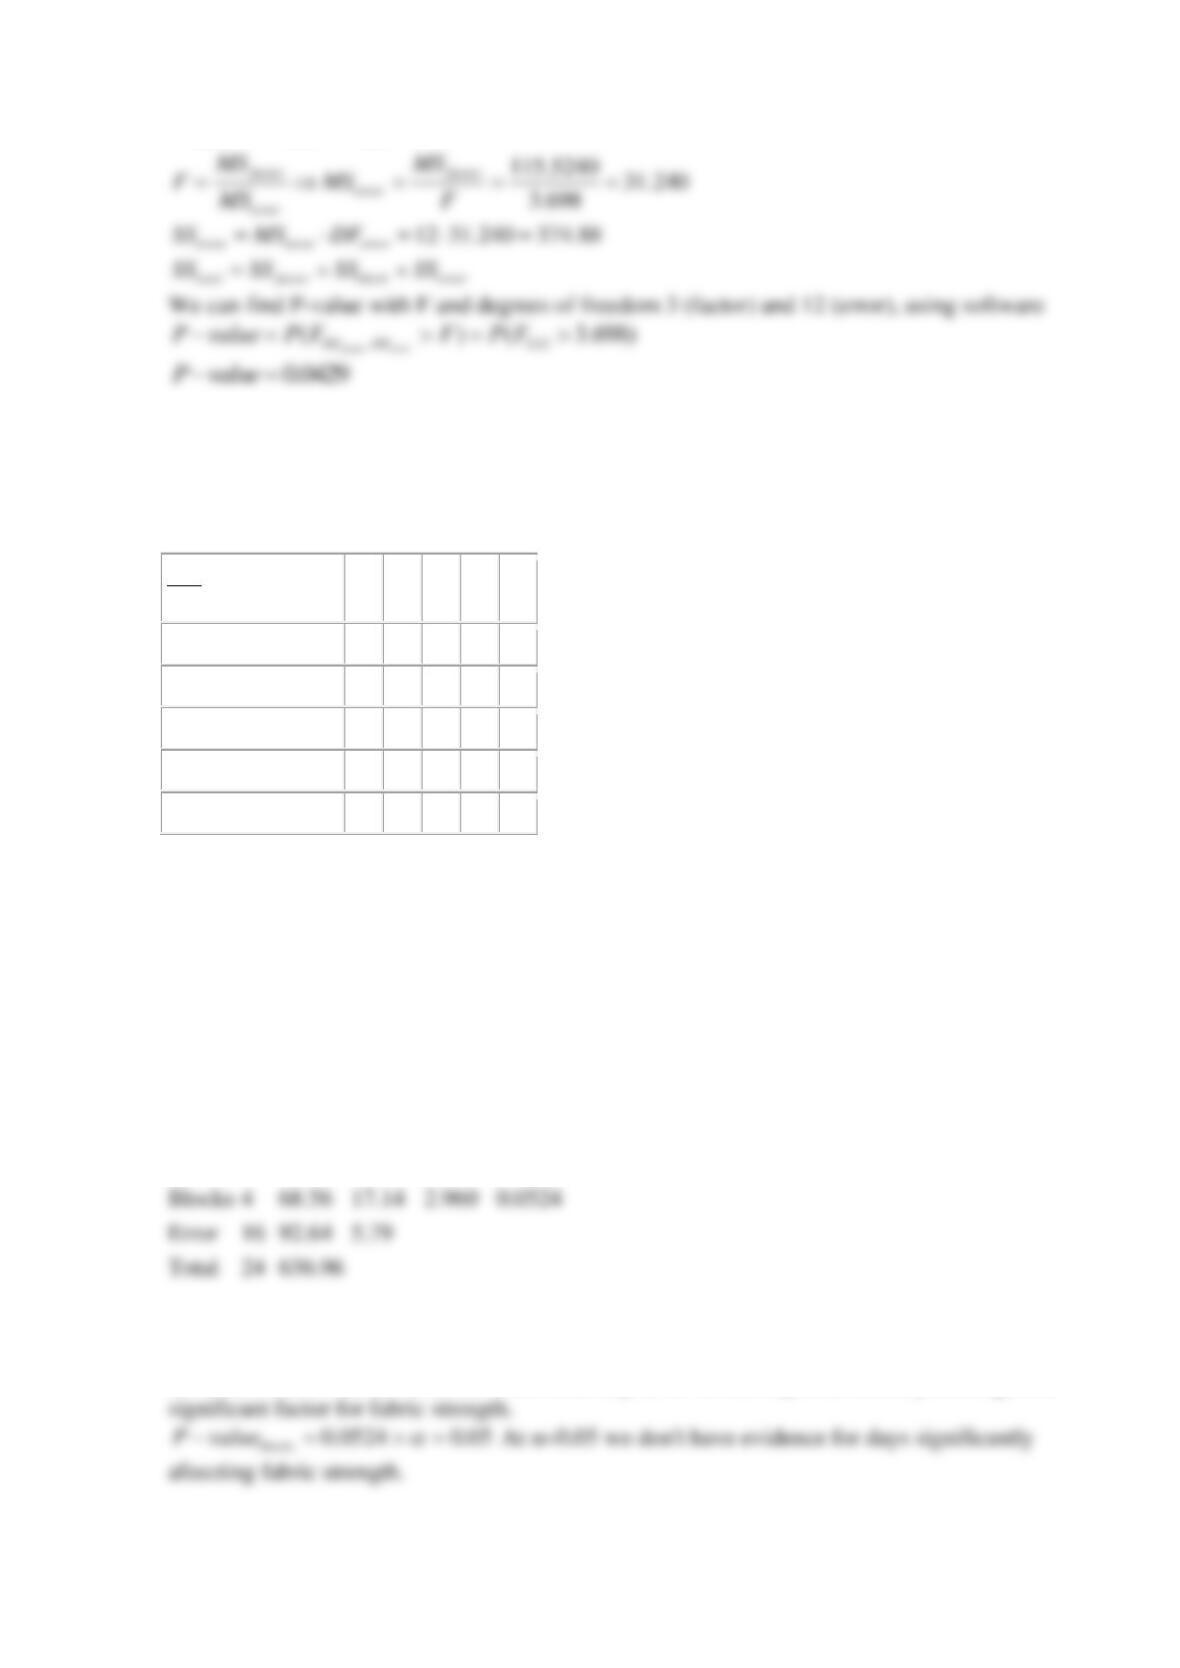
4 71.8931 287.57
block block block
SS MS DF= = =
Reserve Problems Chapter 13 Section 4 Problem 4
Tensile strength of synthetic fiber, which contains different amount of cotton. It is suspected that
strength is related to the percentage of cotton in the fiber. Five levels of cotton percentage were
used (denoted as rows in table), and measurements took place in five days (denoted as columns).
day
cotton percentage
1
2
3
4
5
15
7
7
15
11
9
20
12
17
12
18
18
25
14
18
18
19
19
30
19
25
22
19
23
35
7
10
11
15
11
(a) Consider day as a block and estimate the ANOVA for RCBD. What is the values of test
statistic and P-value for and mean errors?
(b) Compare the RCBD analysis here with the analysis without blocks.
SOLUTION
(a)
Two-factor ANOVA output:
Source
DF
SS
MS
F
P
Factor
4
475.76
118.94
20.542
4E-6
Blocks
4
68.56
17.14
2.960
0.0524
Error
16
92.64
5.79
Total
24
636.96
Values for cotton percentage labeled as factor, values for days – as block.
As we can see, P-value for factor is less than any α, so we can say, that cotton percentage is a
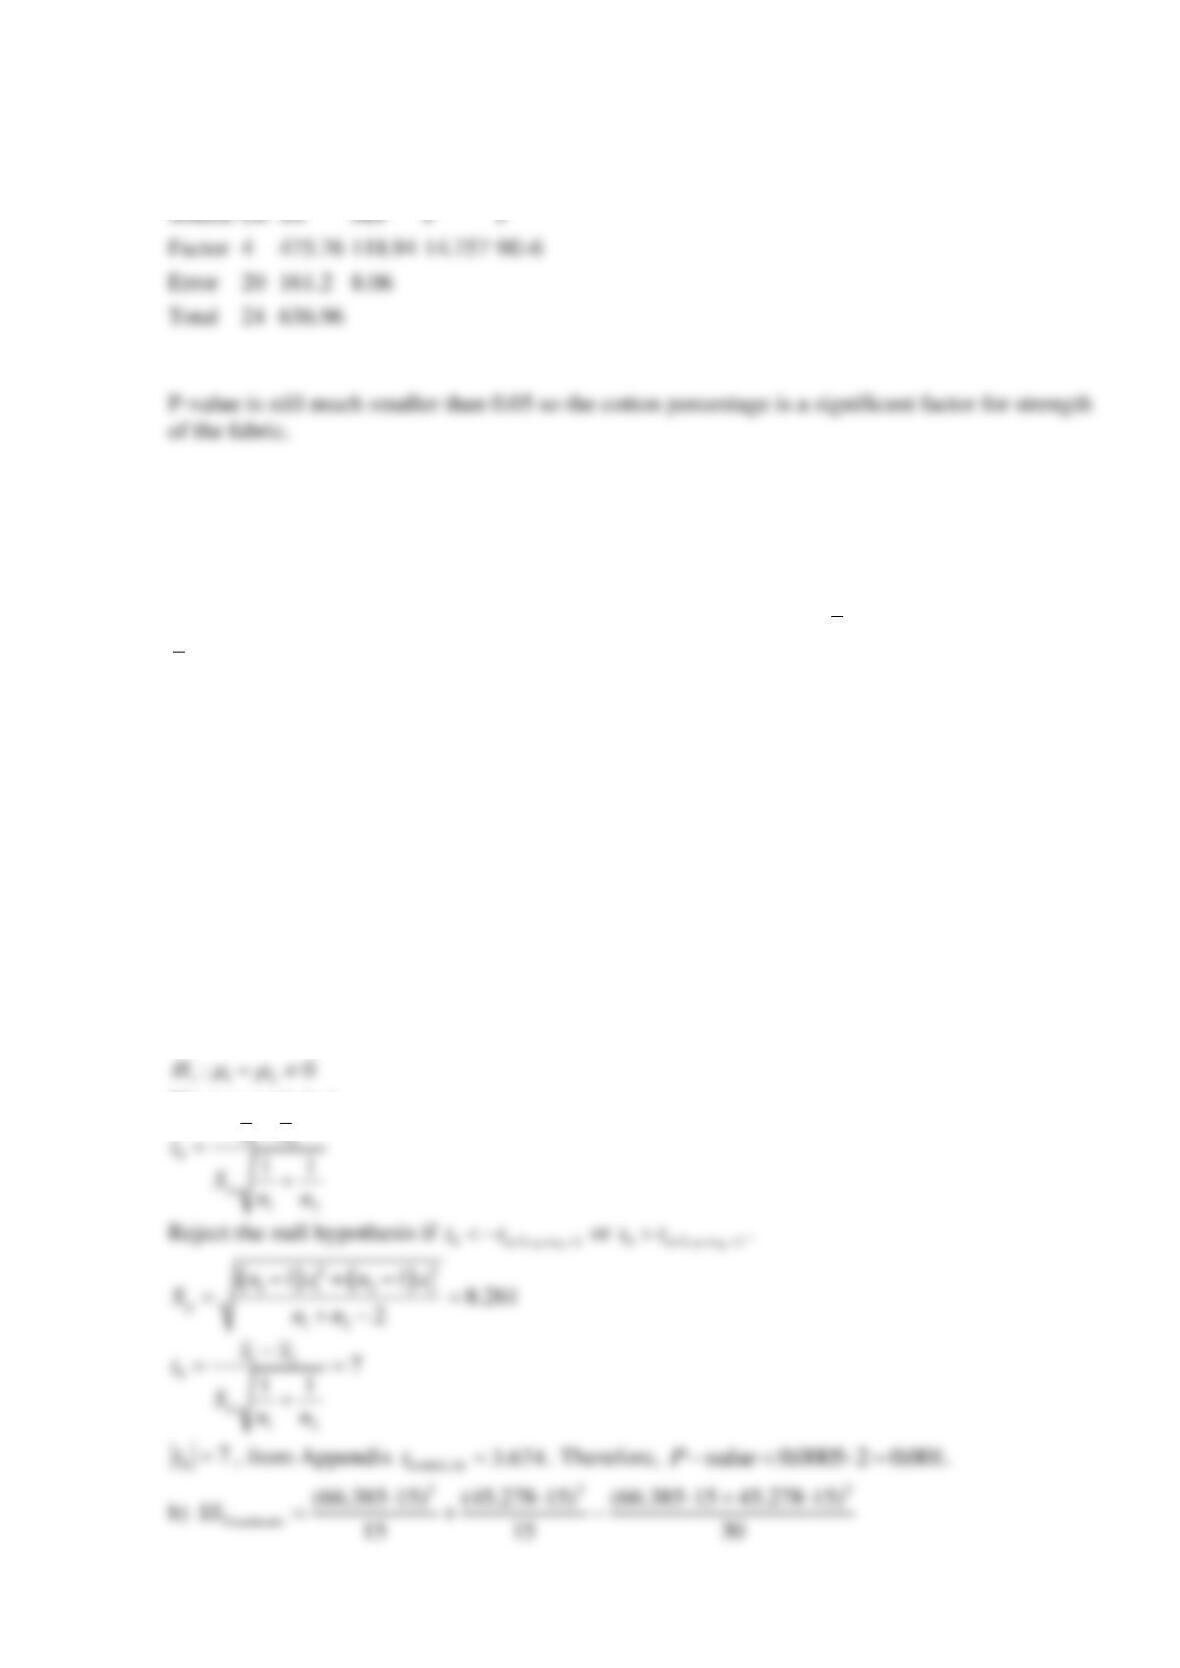
(b)
One-factor ANOVA output:
Reserve Supplemental Exercises Chapter 13 Problem 1
An article in Electronic Components and Technology Conference compared single (type 1)
versus dual (type 2) spindle saw processes for copper metallized wafers. A total of 15 devices of
each type were measured for the width of the backside chipouts with
166.385x=
,
17.895s=
and
245.278x=
,
28.612s=
.
a) Compare these two treatments with a two-sample t-test and compute the P-value.
b) Compare these two treatments with the ANOVA method and show that the square of the t
statistic in part (a) equals the value of the
0
f
statistic in this part. Compute the P-value for the
test of no treatment differences.
c) Comment on the results in parts (a) and (b).
SOLUTION
a) The parameter of interest is the difference in means
0 1 2
:0H
−=
The test statistic is
xx
−
Reserve Supplemental Exercises Chapter 13 Problem 2
Consider the etch uniformity data in the table below.
ObservationC2F6 Flow (SCCM)
125
160
1
3.2
5.4
2
4.6
5.5
3
3.5
5
4
2.6
5.2
5
4.2
3.2
6
3.2
5.1
a) Compare these two treatments with a two-sample t-test and compute the P-value.
b) Compare these two treatments with the ANOVA method and show that the square of the t
statistic in part (a) equals the value of the
0
f
statistic in this part. Compute the P-value for the
test of no treatment differences.
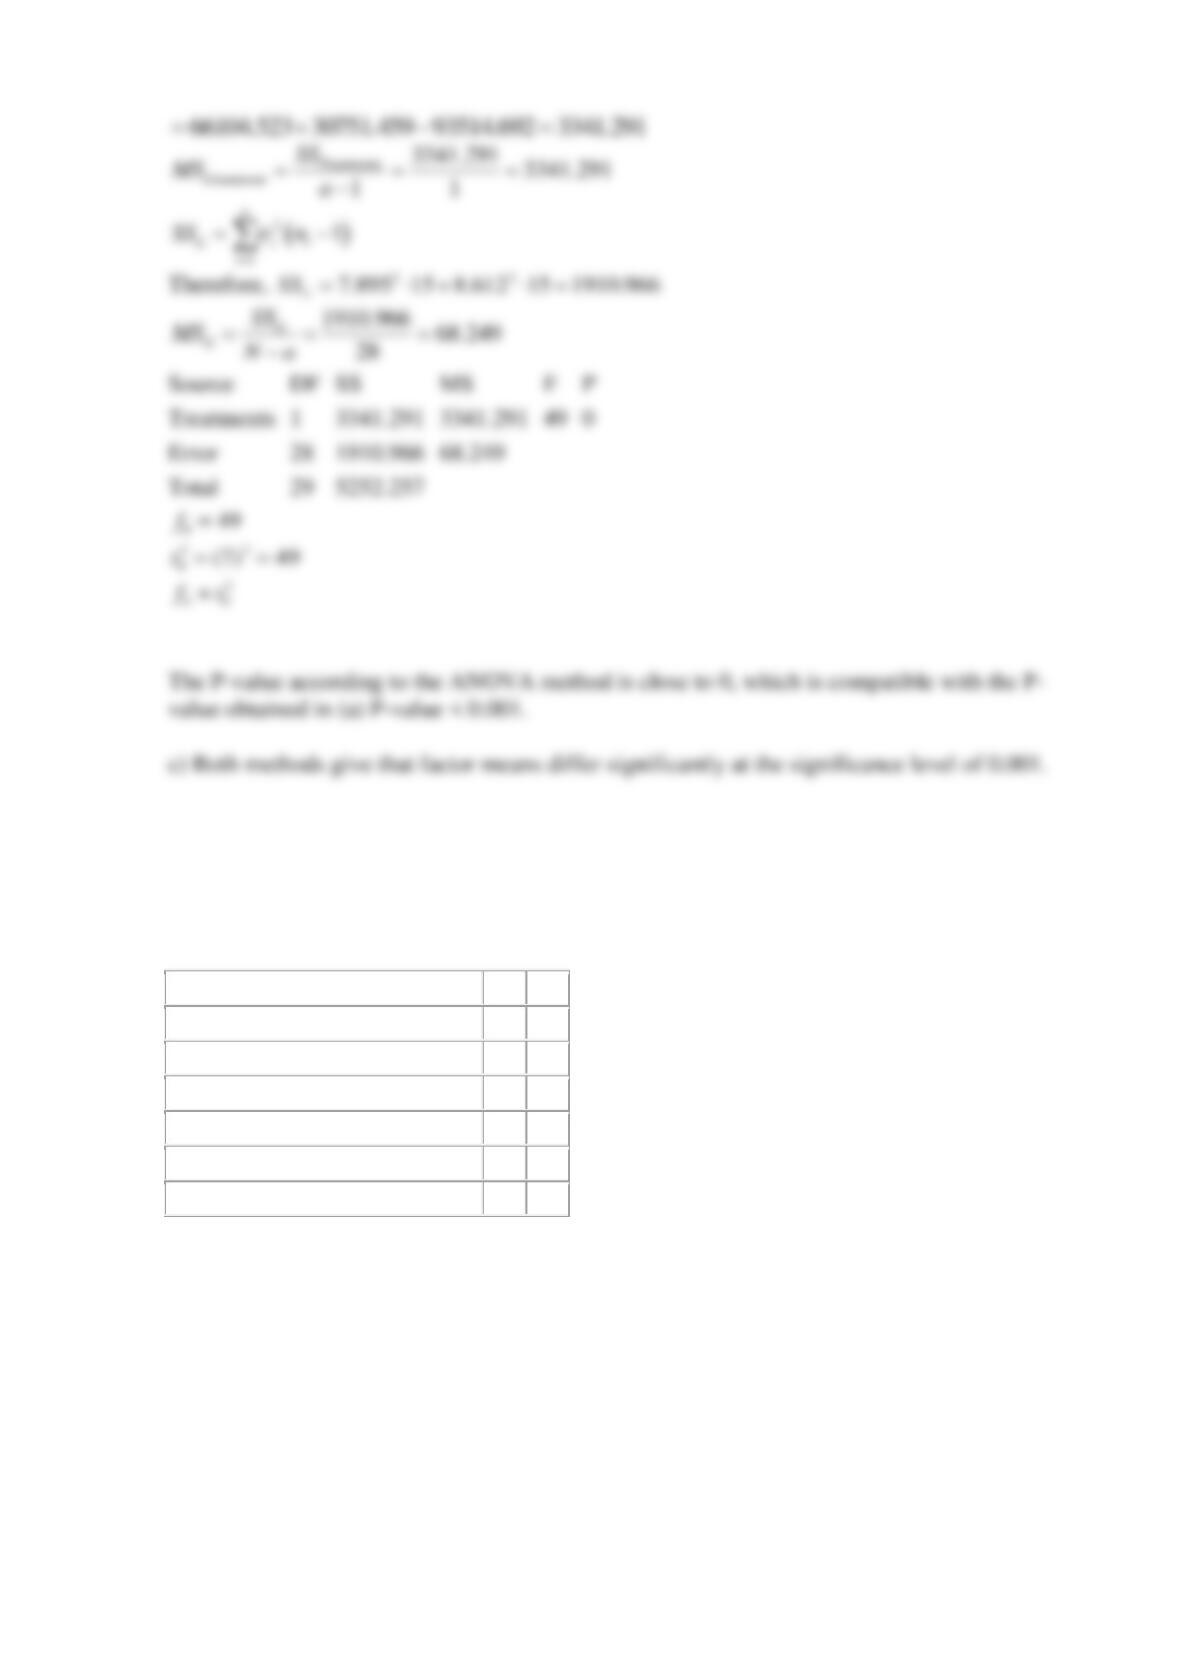
c) Comment on the results in parts (a) and (b).
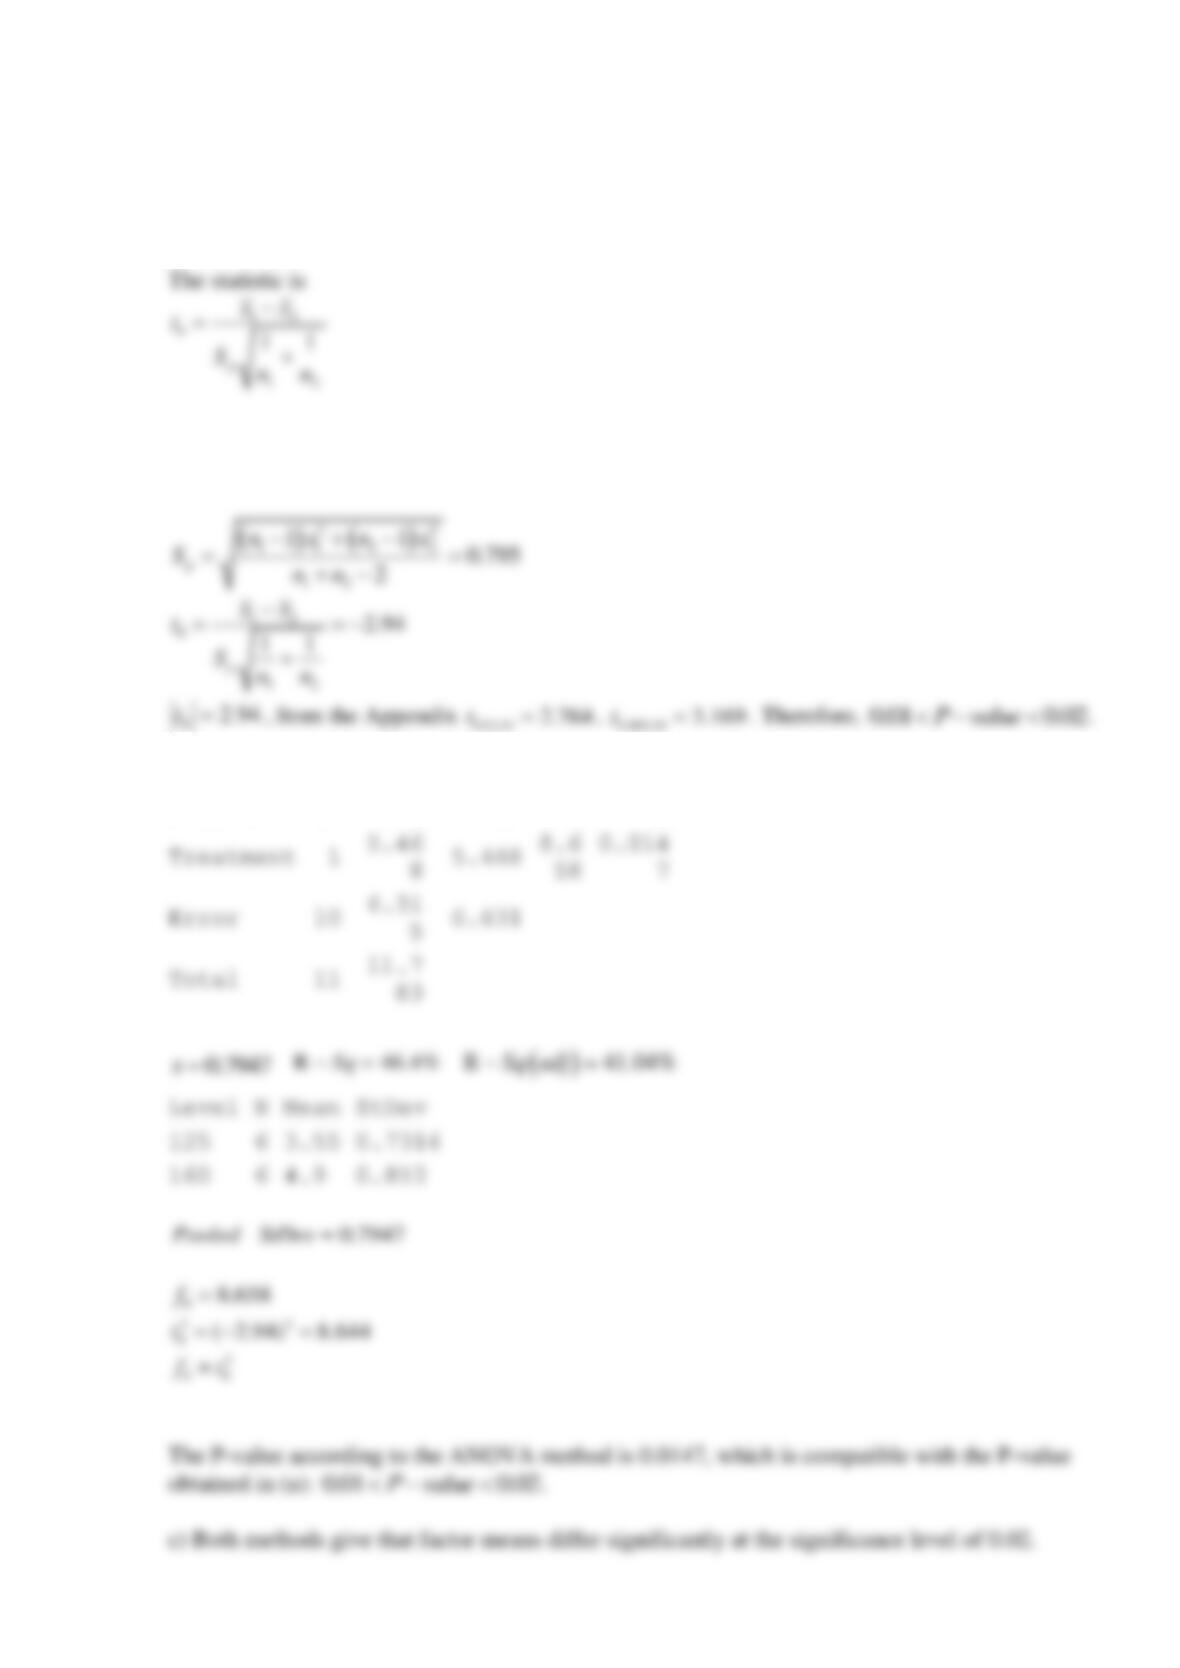
Source
F
P
Treatments
1
3341.291
3341.291
49
0
Error
28
1910.966
68.249
Total
29
5252.257
SOLUTION
a) The parameter of interest is the difference in means for two chemicals
0 1 2
:0H
−=
1 1 2
:0H
−
Reject the null hypothesis if
12
0 /2, 2nn
tt
+−
−
or
12
0 /2, 2nn
tt
+−
.
b) Output of the ANOVA method
Source
DF
SS
MS
F
P
Reserve Supplemental Exercises Chapter 13 Problem 3
Consider the contact resistance data in the table below.
Alloy
Contact resistance
1
92
97
100
97
99
102
101
93
95
97
2
102
103
105
105
99
104
111
104
97
104
a) Compare these two treatments with a paired t-test and compute the P-value.
b) Compare these two treatments with the RCBD ANOVA method and show that the square of
the t statistic in part (a) equals the value of the
0
f
statistic in this part. Compute the P-value for
the test of no treatment differences.
c) Comment on the results in parts (a) and (b).
SOLUTION
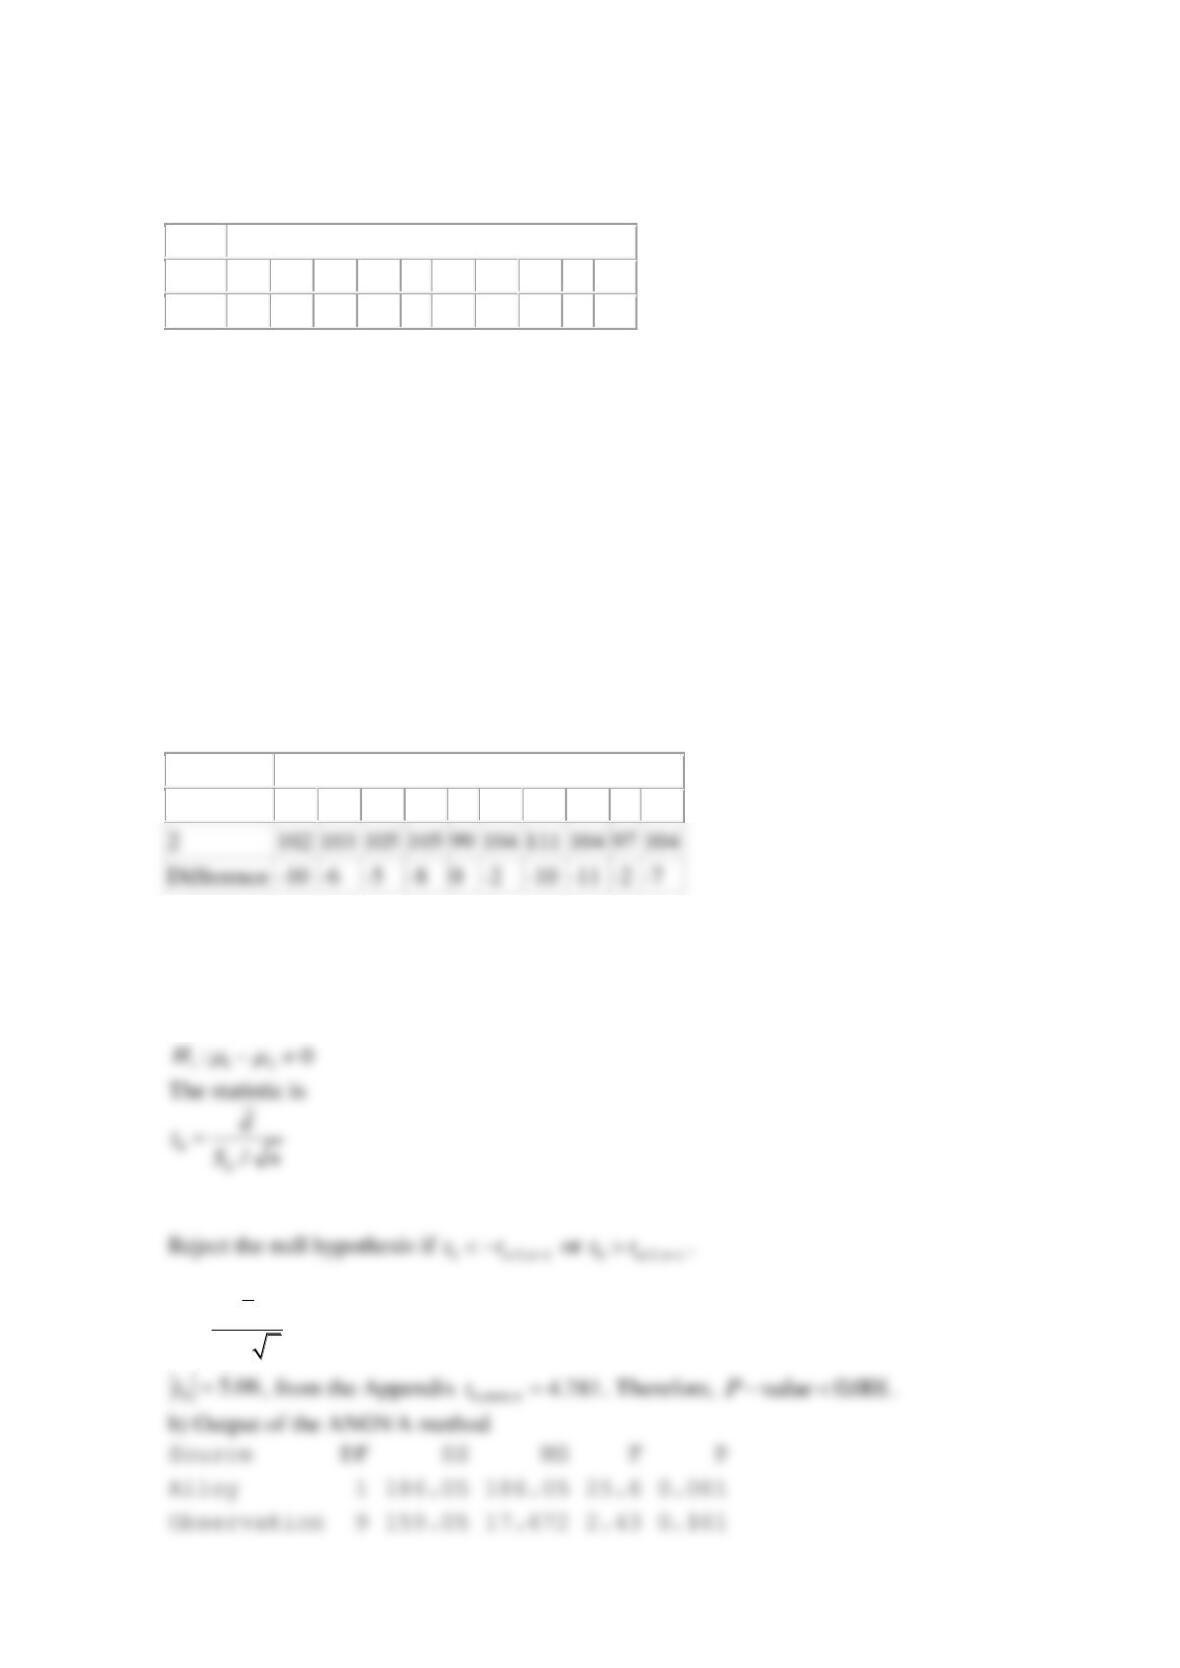
a)
Alloy
Contact resistance
1
92
97
100
97
99
102
101
93
95
97
The parameter of interest is the difference in means for two chemicals
0 1 2
:0H
−=
05.06
/
d
d
tSn
= = −
2
102
103
105
105
99
104
111
104
97
104
Difference
-10
-6
-5
-8
0
-2
-10
-11
-2
-7
Reserve Supplemental Exercises Chapter 13 Problem 4
An article in The American Journal of Sports Medicine (“Biomechanical Comparison of the
FasT-Fix Meniscal Repair Suture System with Vertical Mattress Sutures and Meniscus Arrows,”
Vol. 31, 2002) compared three fixation methods [vertical suture (vs), meniscus arrow (ma),
FasT-Fix (FasT)] with six replicates for each method. Three responses [load at failure (N),
displacement (mm), stiffness (N/mm)] were measured.
Method
Load at
Failure
Displacement
Stiffness
vs
97.3
16.9
8.3
vs
106.4
20.2
7.2
vs
118.2
20.1
6.3
vs
99.7
15.7
7.3
vs
106.5
13.9
8.7
vs
84.2
14.9
8.7
ma
44.9
7.9
4.7
ma
46.1
12.5
6.1
ma
59.3
15.5
5
ma
35.5
10.2
5.8
ma
50.7
8.9
6.6
ma
56.8
13.3
8.4
FasT
88
18
8
FasT
119.8
18.5
8.3
FasT
65.8
9.2
7.6
FasT
82.9
18.8
6.4
FasT
149.9
22.8
8.2
FasT
117.1
17.5
7.7
a) Does the fixation method affect the load at failure? Use
0.05
=
.
b) Analyze the residuals and comment on the model adequacy.
c) Does the fixation method affect the displacement? Use
0.05
=
.
d) Analyze the residuals and comment on the model adequacy.
SOLUTION
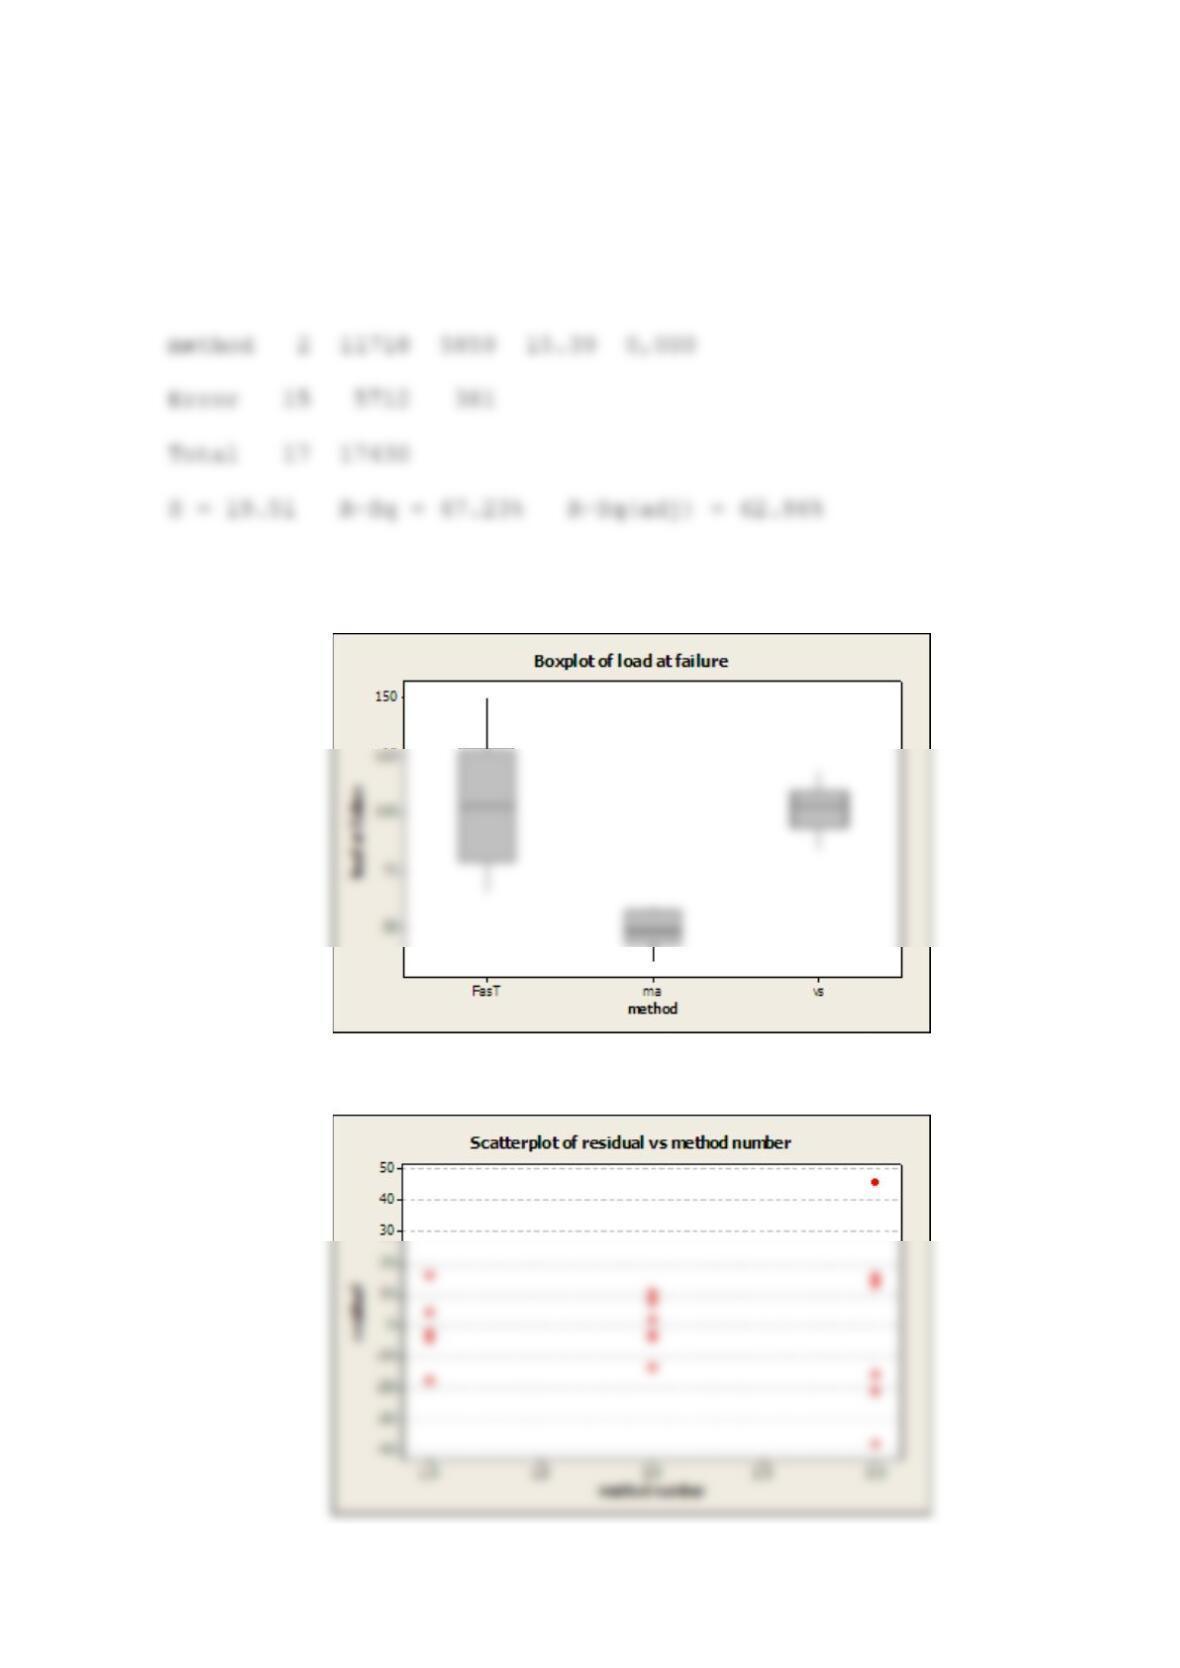
a) ANOVA for load at failure
Source DF SS MS F P
Reject the null hypothesis because the P-value < 0.05. At
0.05
=
, there is enough evidence that
the fixation method affects the load at failure.
b)
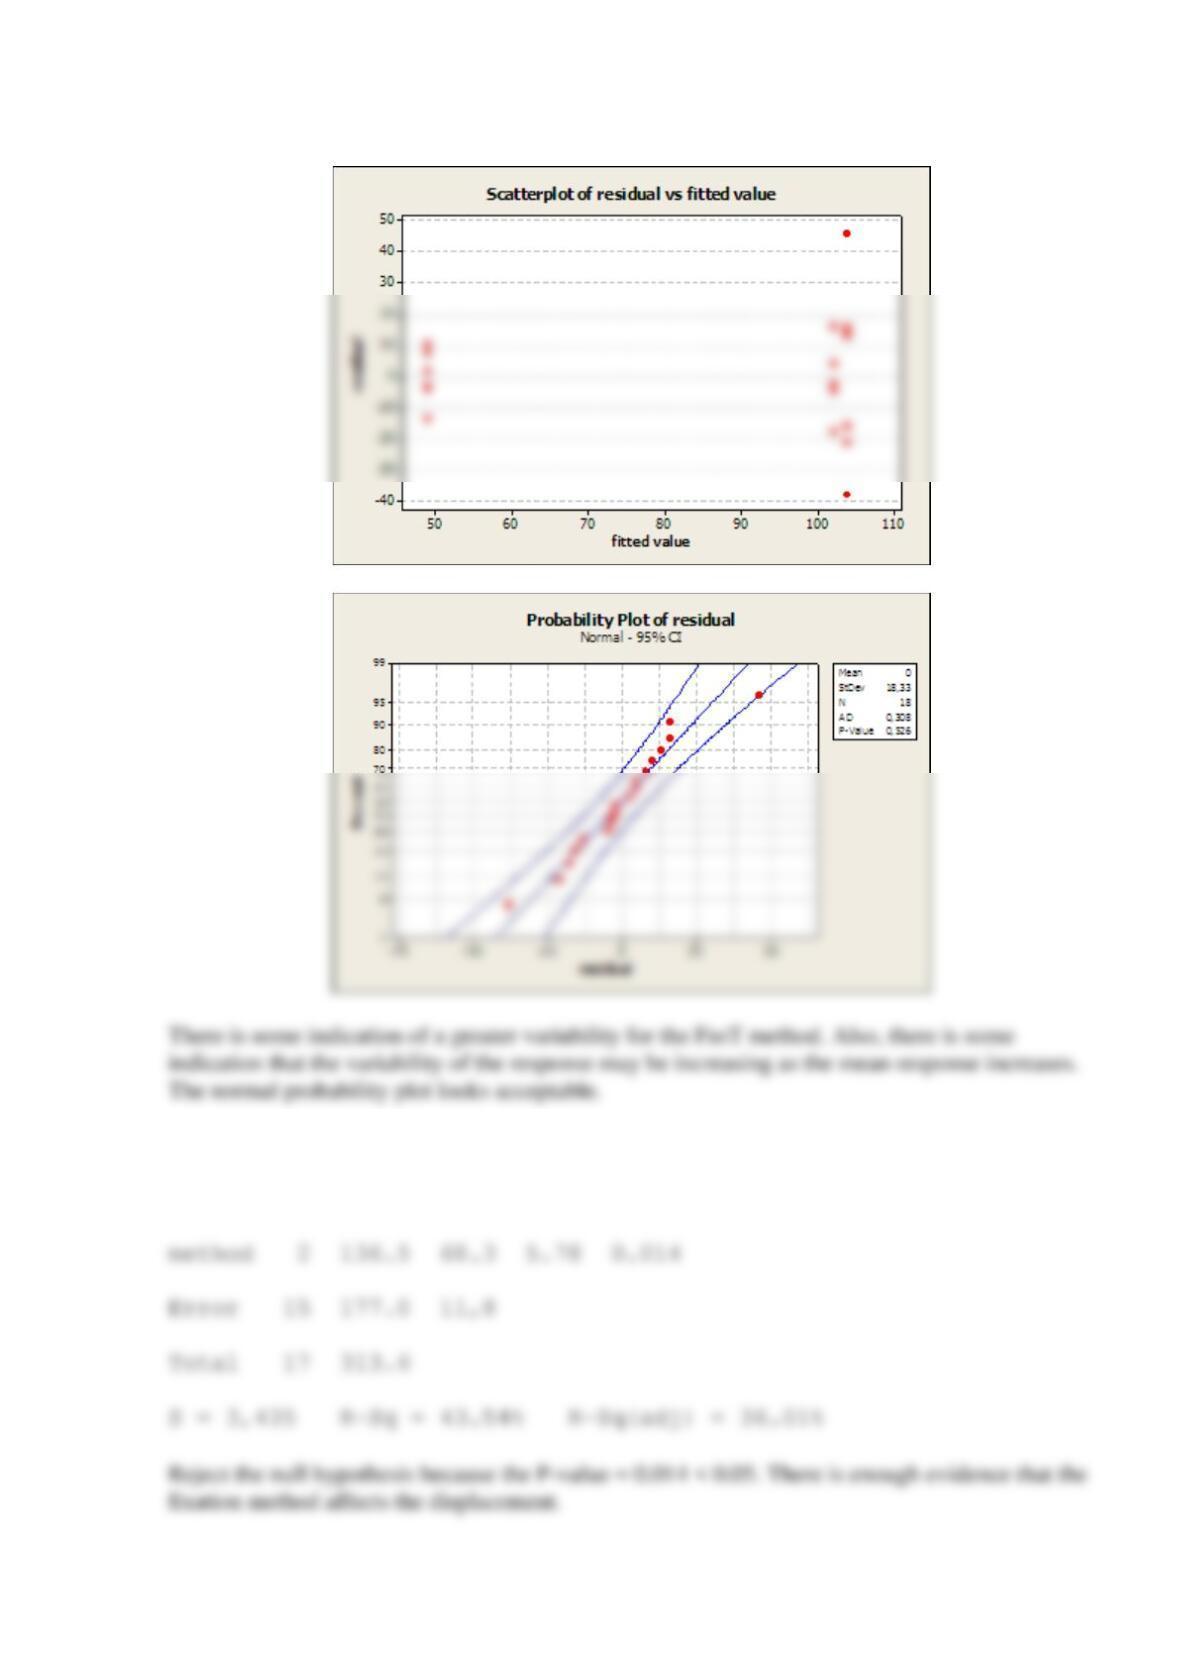
1 – vs; 2 – ma; 3 – FasT.
c) ANOVA for displacement
Source DF SS MS F P
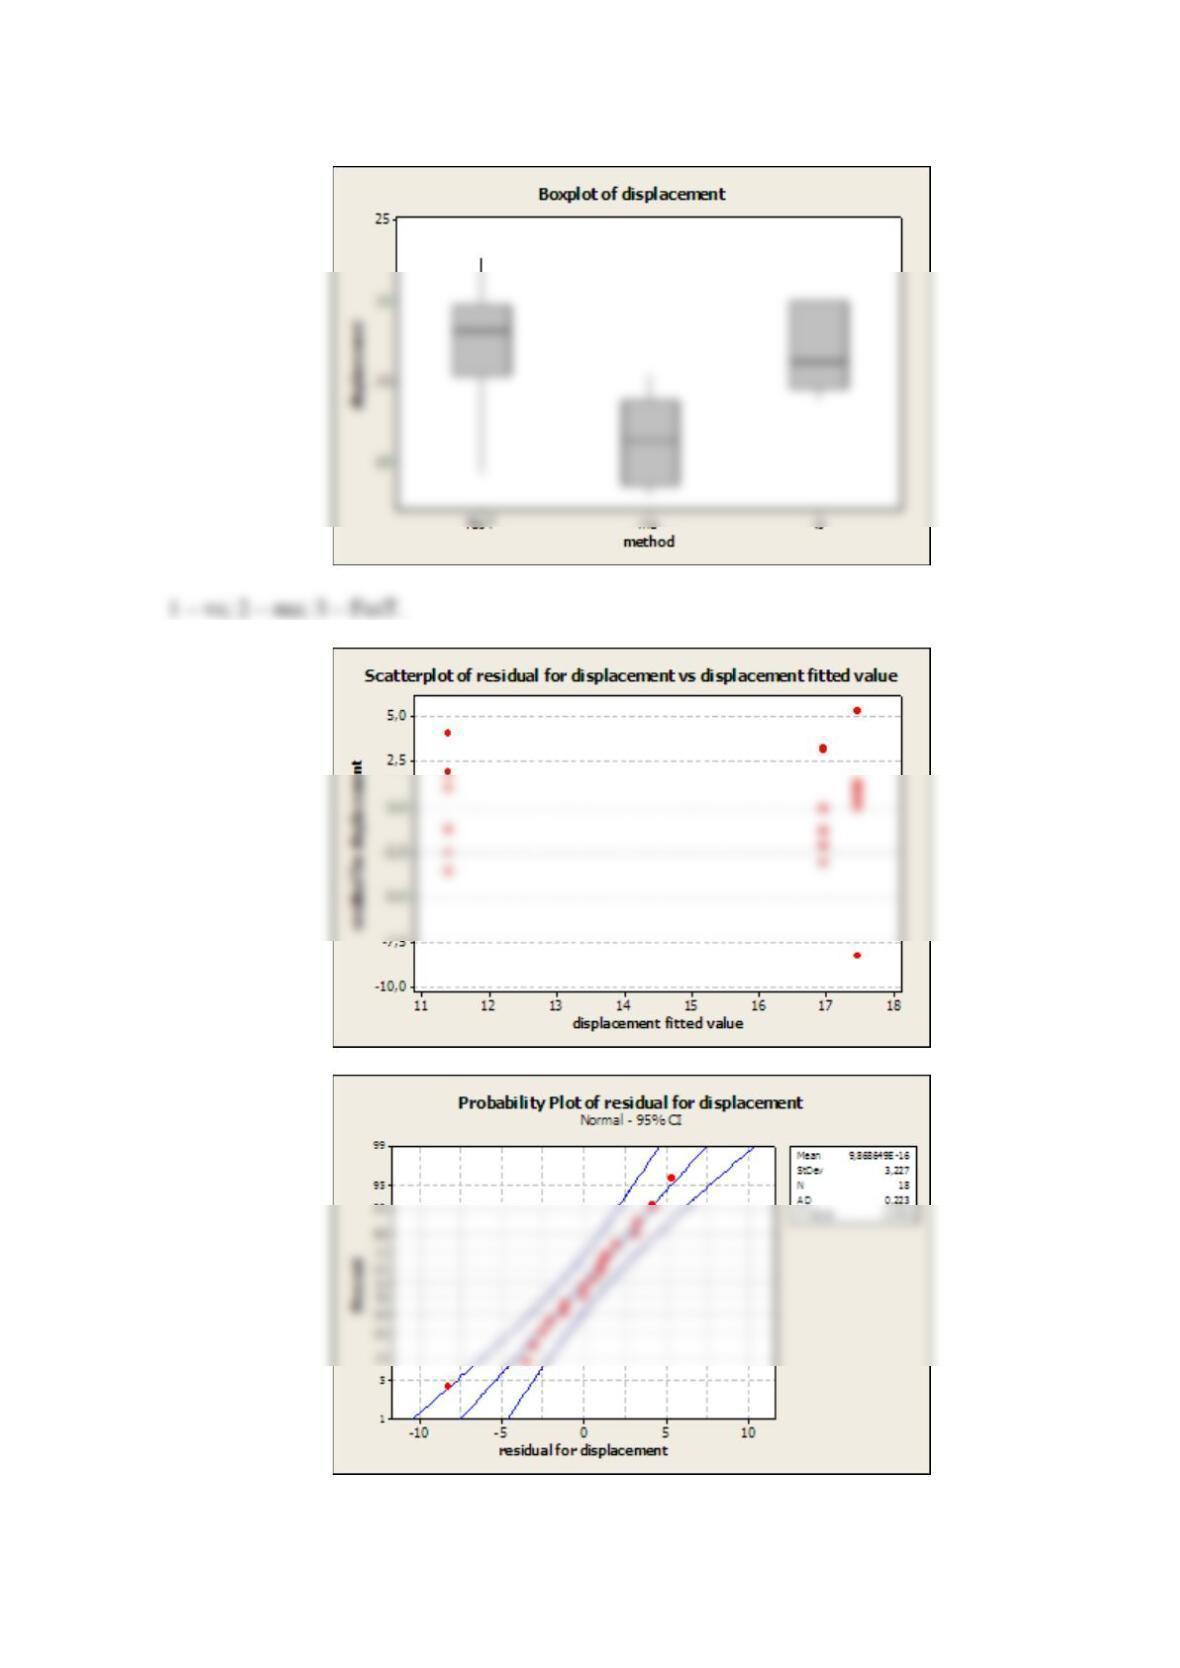
d)