Applied Statistics and Probability for Engineers,7th edition 2017
(c) Analysis of Variance for LEAKAGE VOLTAGE
Source DF SS MS F P
LENGTH 3 8.1775 2.7258 6.16 0.009
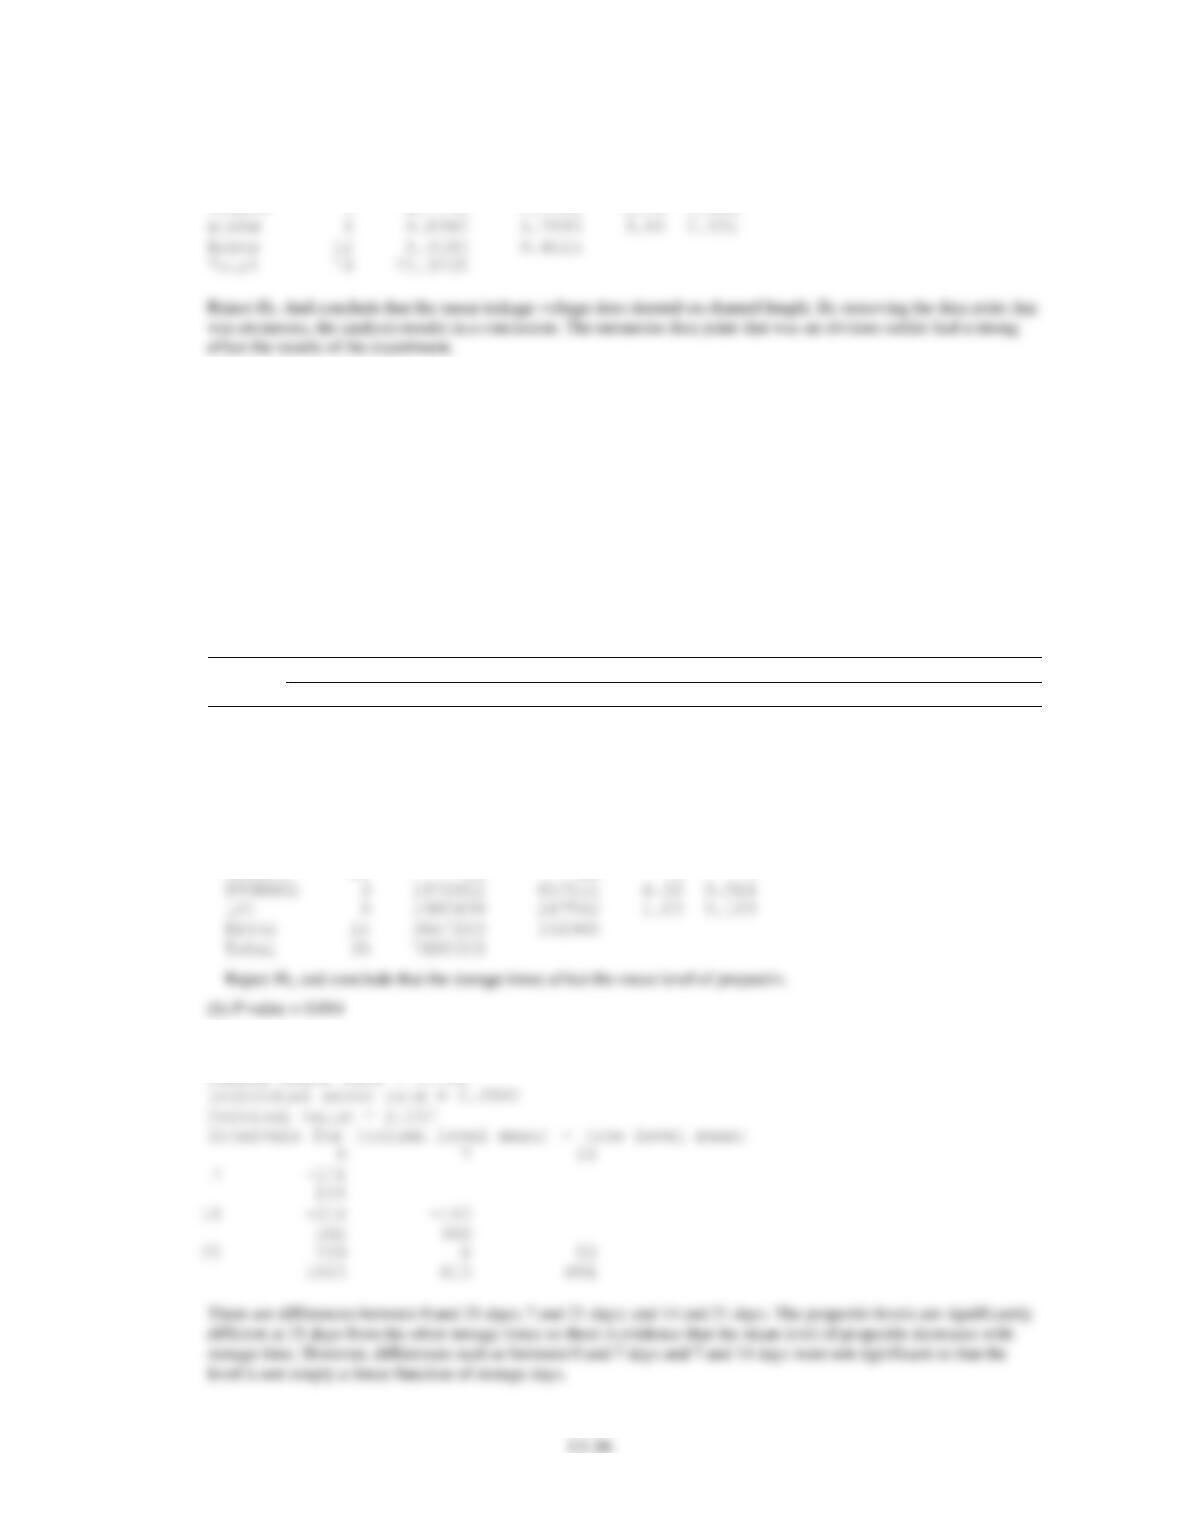
13.4.8 An article in the Food Technology Journal (1956, Vol. 10, pp. 39–42) described a study on the protopectin content of
tomatoes during storage. Four storage times were selected, and samples from nine lots of tomatoes were analyzed. The
protopectin content (expressed as hydrochloric acid soluble fraction mg/kg) is in Table 13E-1.
(a) The researchers in this study hypothesized that mean protopectin content would be different at different storage
times. Can you confirm this hypothesis with a statistical test using
= 0.05?
(b) Find the P-value for the test in part (a).
(c) Which specific storage times are different? Would you agree with the statement that protopectin content decreases
as storage time increases?
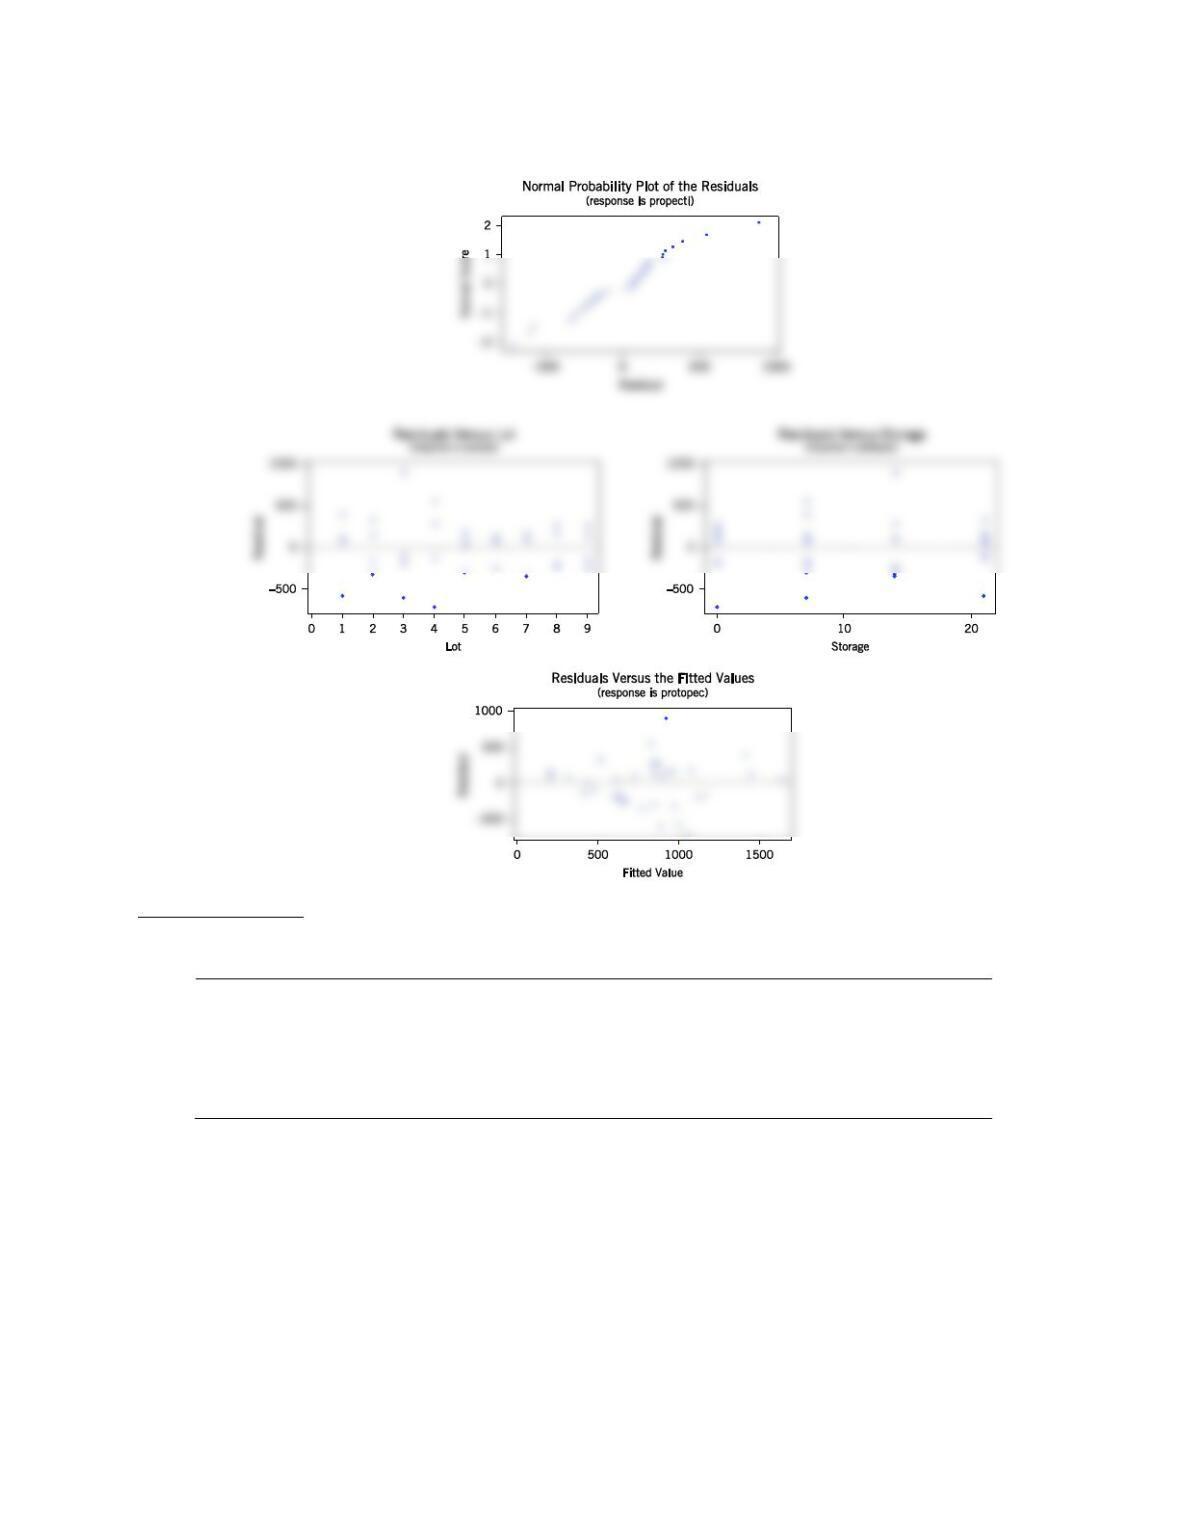
(d) Analyze the residuals from this experiment.
TABLE 13E-1 Protopectin Content of Tomatoes in Storage
Storage
Time
Lot
1
2
3
4
5
6
7
8
9
0 days
1694.0
989.0
917.3
346.1
1260.0
965.6
1123.0
1106.0
1116.0
7 days
1802.0
1074.0
278.8
1375.0
544.0
672.2
818.0
406.8
461.6
14 days
1568.0
646.2
1820.0
1150.0
983.7
395.3
422.3
420.0
409.5
21 days
415.5
845.4
377.6
279.4
447.8
272.1
394.1
356.4
351.2
(a) Analysis of Variance of Propectin
Source DF SS MS F P
(c)
Fisher’s pairwise comparisons
Family error rate = 0.196

13–37
Applied Statistics and Probability for Engineers,7th edition 2017
13–38
(d) Observations from lot 3 at 14 days appear unusual. Otherwise, the residuals are acceptable.
Supplemental Exercises
13.S9 Consider the following computer output.
Source
DF
SS
MS
F
P
Factor
?
126.880
63.4401
?
?
Block
?
54.825
18.2751
Error
6
?
2.7403
Total
11
198.147
(a) How many levels of the factor were used in this experiment?
(b) How many blocks were used?
(c) Fill in the missing information. Use bounds for the P-value.
(d) What conclusions would you draw if
= 0.05? What if
= 0.01?

Applied Statistics and Probability for Engineers,7th edition 2017
13–39
13.S10 An article in Lubrication Engineering (December 1990) described the results of an experiment designed to investigate
the effects of carbon material properties on the progression of blisters on carbon face seals. The carbon face seals are
used extensively in equipment such as air turbine starters. Five different carbon materials were tested, and the surface
roughness was measured. The data are as follows:
Carbon
Material Type
Surface Roughness
EC10
0.50
0.55
0.55
0.36
EC10A
0.31
0.07
0.25
0.18
0.56
0.20
EC4
0.20
0.28
0.12
EC1
0.10
0.16
(a) Does carbon material type have an effect on mean surface roughness? Use
= 0.05.
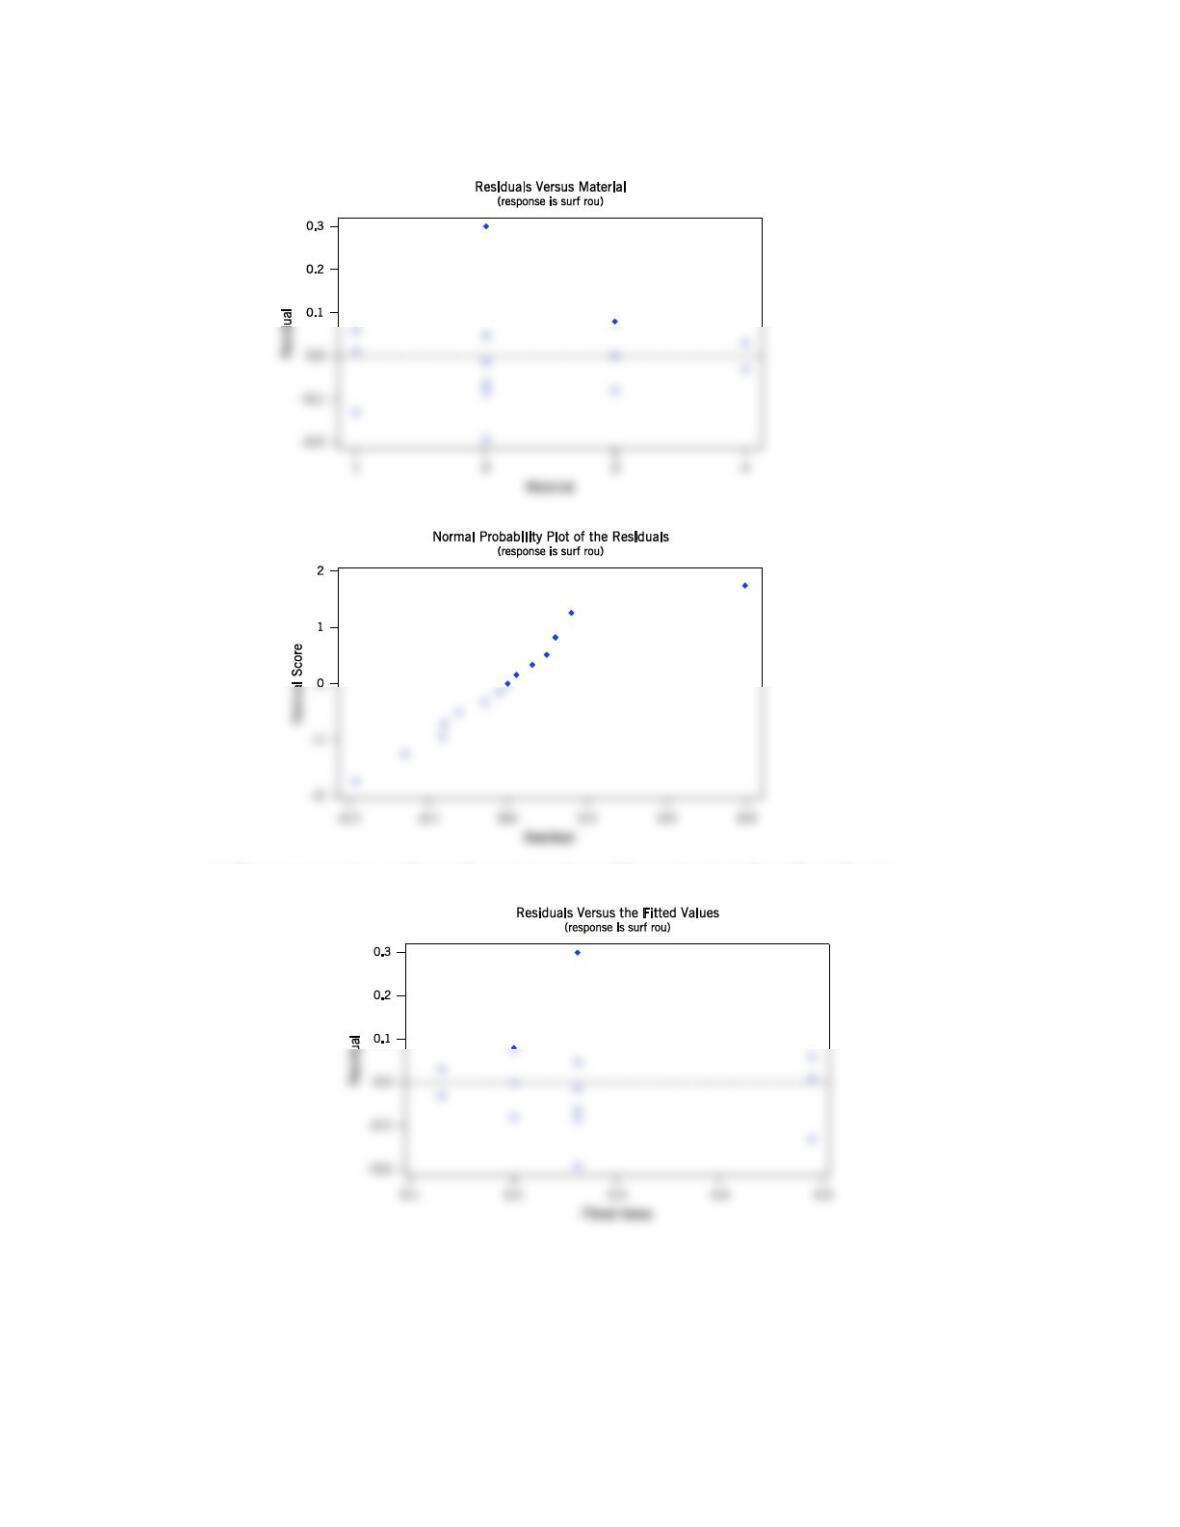
(b) Find the residuals for this experiment. Does a normal probability plot of the residuals indicate any problem with the
normality assumption?
(c) Plot the residuals versus
ˆij
y
. Comment on the plot.
(d) Find a 95% confidence interval on the difference between mean surface roughness for the EC10 and the EC1
carbon grades.
(e) Apply the Fisher LSD method to this experiment. Summarize your conclusions regarding the effect of material type
on surface roughness.
(a)
Analysis of Variance for SURFACE ROUGNESS
Source DF SS MS F P
Material 3 0.2402 0.0801 4.96 0.020
Applied Statistics and Probability for Engineers,7th edition 2017
13–40
(b) One observation is an outlier.
(c) There appears to be a problem with constant variance. This may be due to the outlier in the data.
Applied Statistics and Probability for Engineers,7th edition 2017
13–41
(d) 95% Confidence interval on the difference in the means of EC10 and EC1
13.S11 An article in the IEEE Transactions on Components, Hybrids, and Manufacturing Technology [(1992, Vol. 15(2), pp.
146–153)] described an experiment in which the contact resistance of a brake-only relay was studied for three different
materials (all were silver-based alloys). The data are as follows.
Alloy
Contact Resistance
1
95
97
99
98
99
99
99
94
95
98
2
104
102
102
105
99
102
111
103
100
103
3
119
130
132
136
141
172
145
150
144
135
(a) Does the type of alloy affect mean contact resistance? Use
= 0.01.
(b) Use Fisher’s LSD method to determine which means differ.
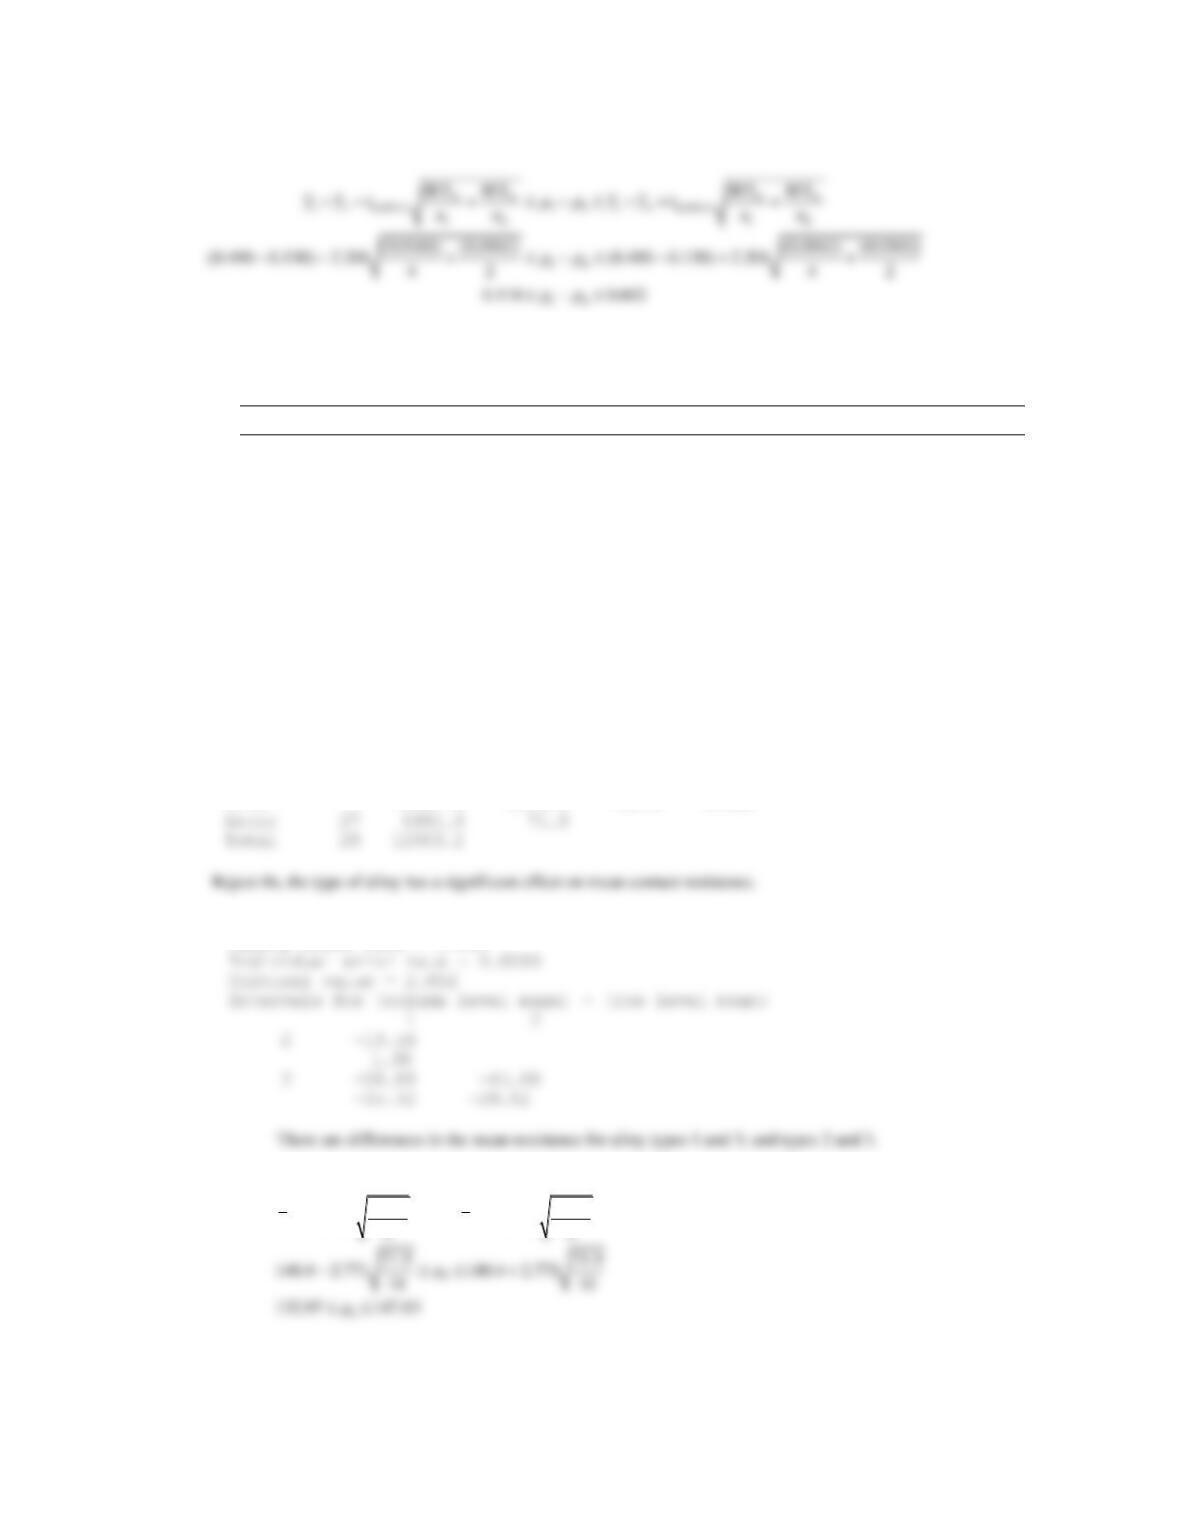
(c) Find a 99% confidence interval on the mean contact resistance for alloy 3.
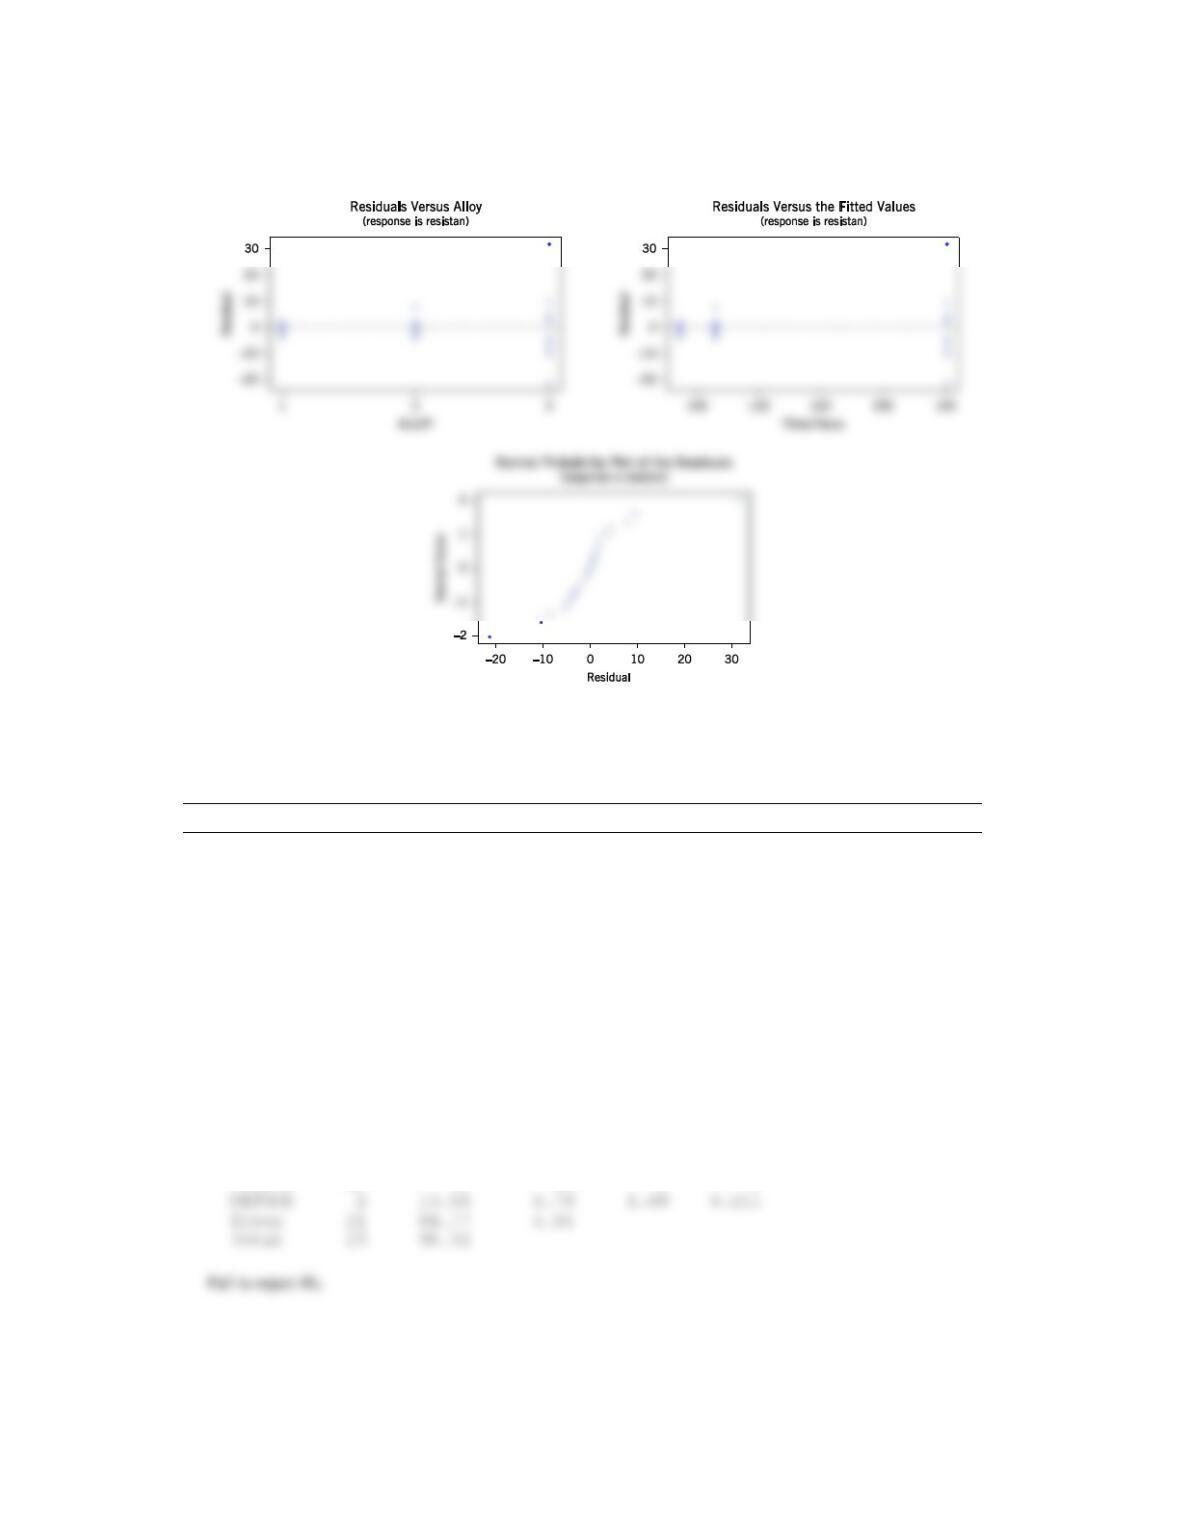
(d) Analyze the residuals for this experiment.
(a) Analysis of Variance for RESISTANCE
Source DF SS MS F P
ALLOY 2 10941.8 5470.9 76.09 0.000
(b) Fisher’s pairwise comparisons
Family error rate = 0.119
(c) 99% Confidence interval on the mean contact resistance for alloy 3
3 0.005,27 3 0.005,27
EE
i
M S M S
y t y t
nn
− +
Applied Statistics and Probability for Engineers,7th edition 2017
13–42
(d) Variability of the residuals increases with the response. The normal probability plot has some curvature in the tails,
indicating a problem with the normality assumption. A transformation of the response should be conducted.
13.S12 An article in the Journal of Quality Technology [(1982, Vol. 14(2), pp. 80–89)] described an experiment in which three
different methods of preparing fish were evaluated on the basis of sensory criteria, and a quality score was assigned.
Assume that these methods have been randomly selected from a large population of preparation methods. The data are
in the following table:
Method
Score
1
24.4
23.2
25.0
19.7
22.2
24.4
23.8
18.0
2
22.1
19.5
17.3
19.7
22.3
23.2
21.4
22.6
3
23.3
22.8
22.4
23.7
20.4
23.5
20.8
24.1
(a) Is there any difference in preparation methods? Use
= 0.05.
(b) Calculate the P-value for the F-statistic in part (a).
(c) Analyze the residuals from this experiment and comment on model adequacy.
(d) Estimate the components of variance.
(a) Analysis of Variance for SCORE
Source DF SS MS F P
Applied Statistics and Probability for Engineers,7th edition 2017
13–43
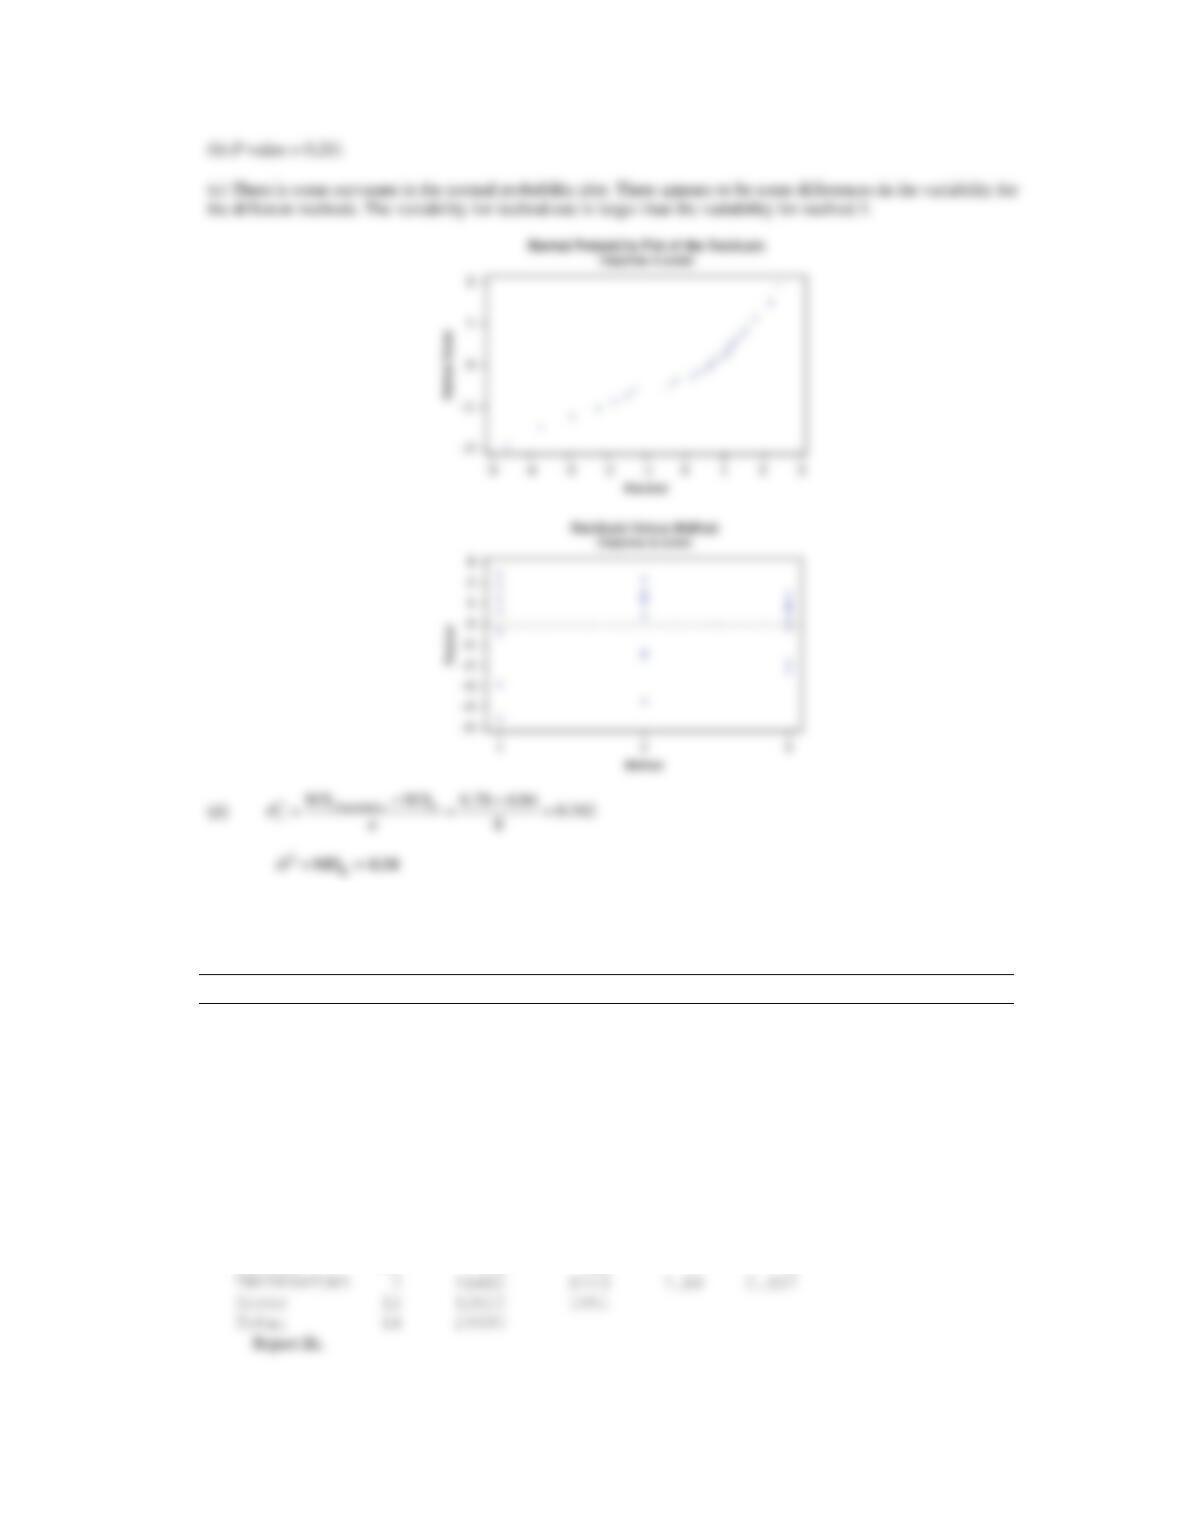
13.S13 An article in the Journal of Agricultural Engineering Research (1992, Vol. 52, pp. 53–76) described an experiment to
investigate the effect of drying temperature of wheat grain on baking quality bread. Three temperature levels were
used, and the response variable measured was the volume of the loaf of bread produced. The data are as follows:
Temperature (°C)
Volume (CC)
70.0
1245
1235
1285
1245
1235
75.0
1235
1240
1200
1220
1210
80.0
1225
1200
1170
1155
1095
(a) Does drying temperature affect mean bread volume? Use
= 0.01.
(b) Find the P-value for this test.
(c) Use the Fisher LSD method to determine which means are different.
(d) Analyze the residuals from this experiment and comment on model adequacy.
(a) Analysis of Variance for VOLUME
Source DF SS MS F P
Applied Statistics and Probability for Engineers,7th edition 2017
13–44
(d) There are some relatively small differences in the variability at the different levels of temperature. The variability
decreases with the fitted values. There is an unusual observation on the normal probability plot.
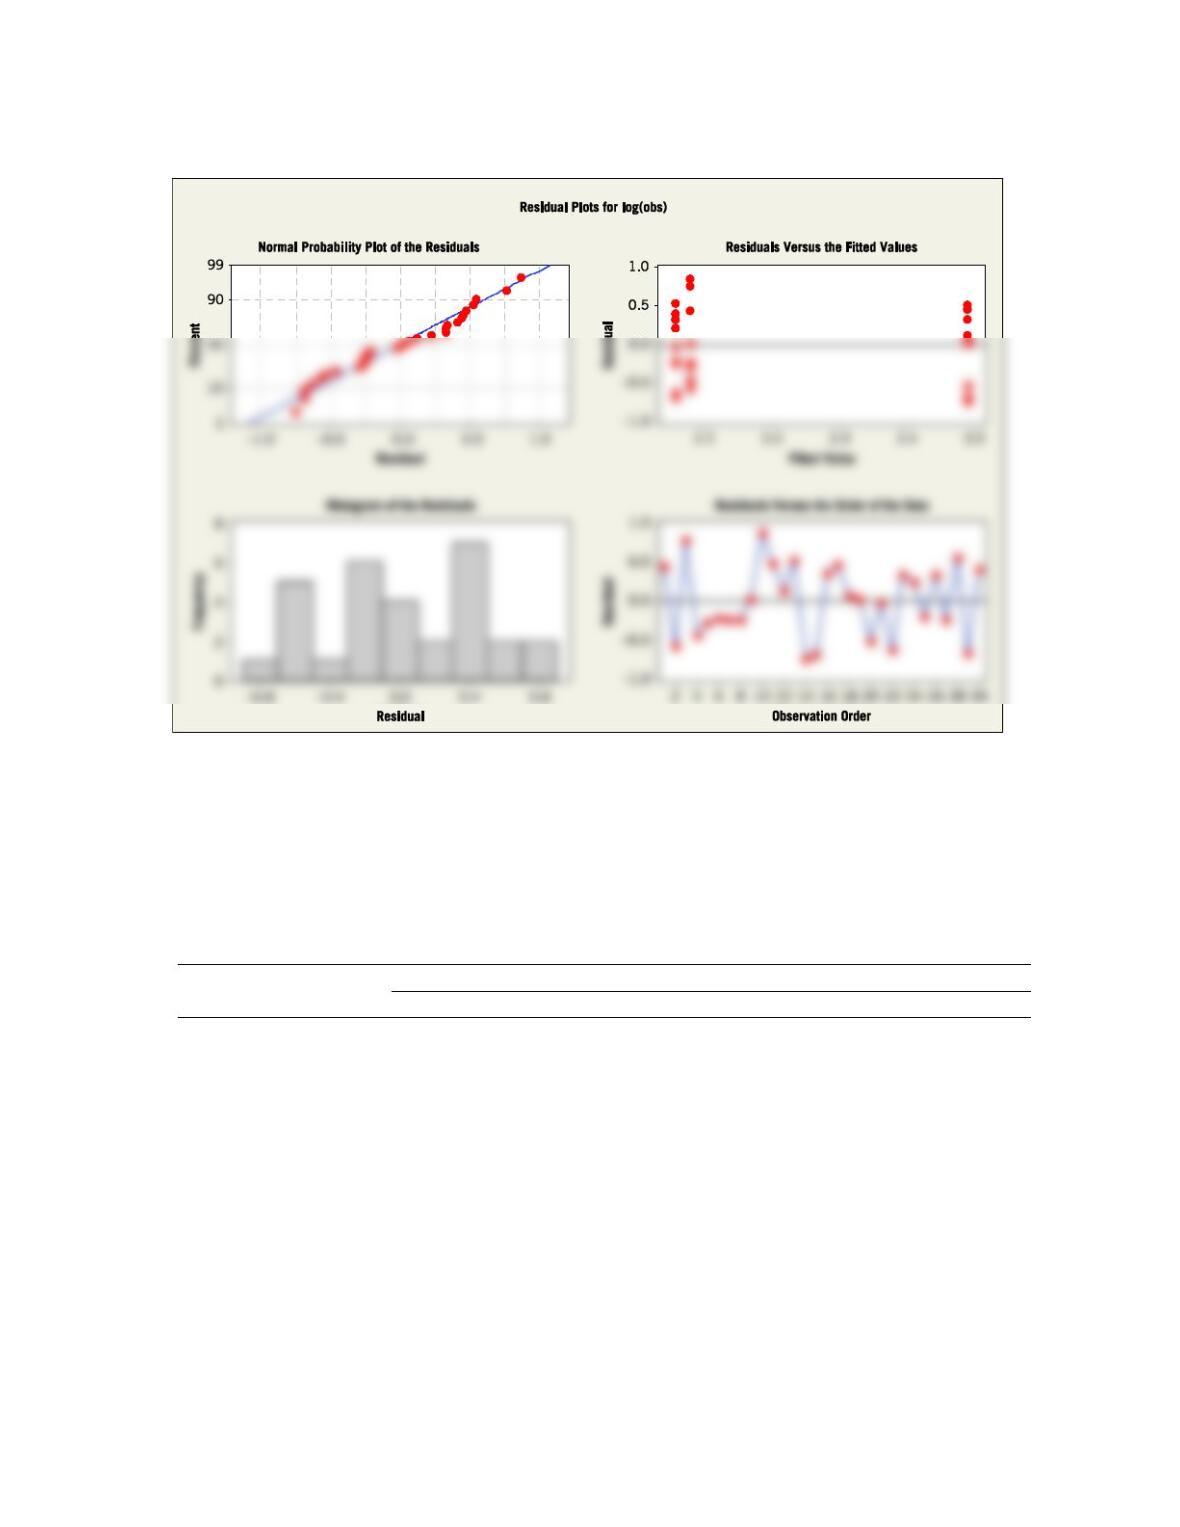
13.S14 An article in Nature Genetics [(2003, Vol. 34(1), pp. 85–90)], “Treatment-Specific Changes in Gene Expression
Discriminate in vivo Drug Response in Human Leukemia Cells,” reported the results of a study of gene expression as a
function of different treatments for leukemia. Three treatment groups are mercaptopurine (MP) only, low-dose
methotrexate (LDMTX) and MP, and high-dose methotrexate (HDMTX) and MP. Each group contained 10 subjects.
The responses from a specific gene are shown in Table 13E-3.
(a) Check the normality of the data. Can you assume that these samples are from normal populations?
(b) Take the logarithm of the raw data and check the normality of the transformed data. Is there evidence to support the
claim that the treatment means differ for the transformed data? Use
= 0.1.
(c) Analyze the residuals from the transformed data and comment on model adequacy.
Applied Statistics and Probability for Engineers,7th edition 2017
13–45
TABLE 13E-3 Treatment-Specific Changes in Gene Expression
Treatments
Observations
MP ONLY
334.5
31.6
701
41.2
61.2
69.6
67.5
66.6
120.7
881.9
MP + HDMTX
919.4
404.2
1024.8
54.1
62.8
671.6
882.1
354.2
321.9
91.1
MP + LDMTX
108.4
26.1
240.8
191.1
69.7
242.8
62.7
396.9
23.6
290.4
(a) The normal probability plot shows that the normality assumption is not reasonable.
(b) The normal probability plot shows that the normality assumption is reasonable.
Applied Statistics and Probability for Engineers,7th edition 2017
13–46
(c) The normal probability plot and the residual plots show that the model assumptions are reasonable.
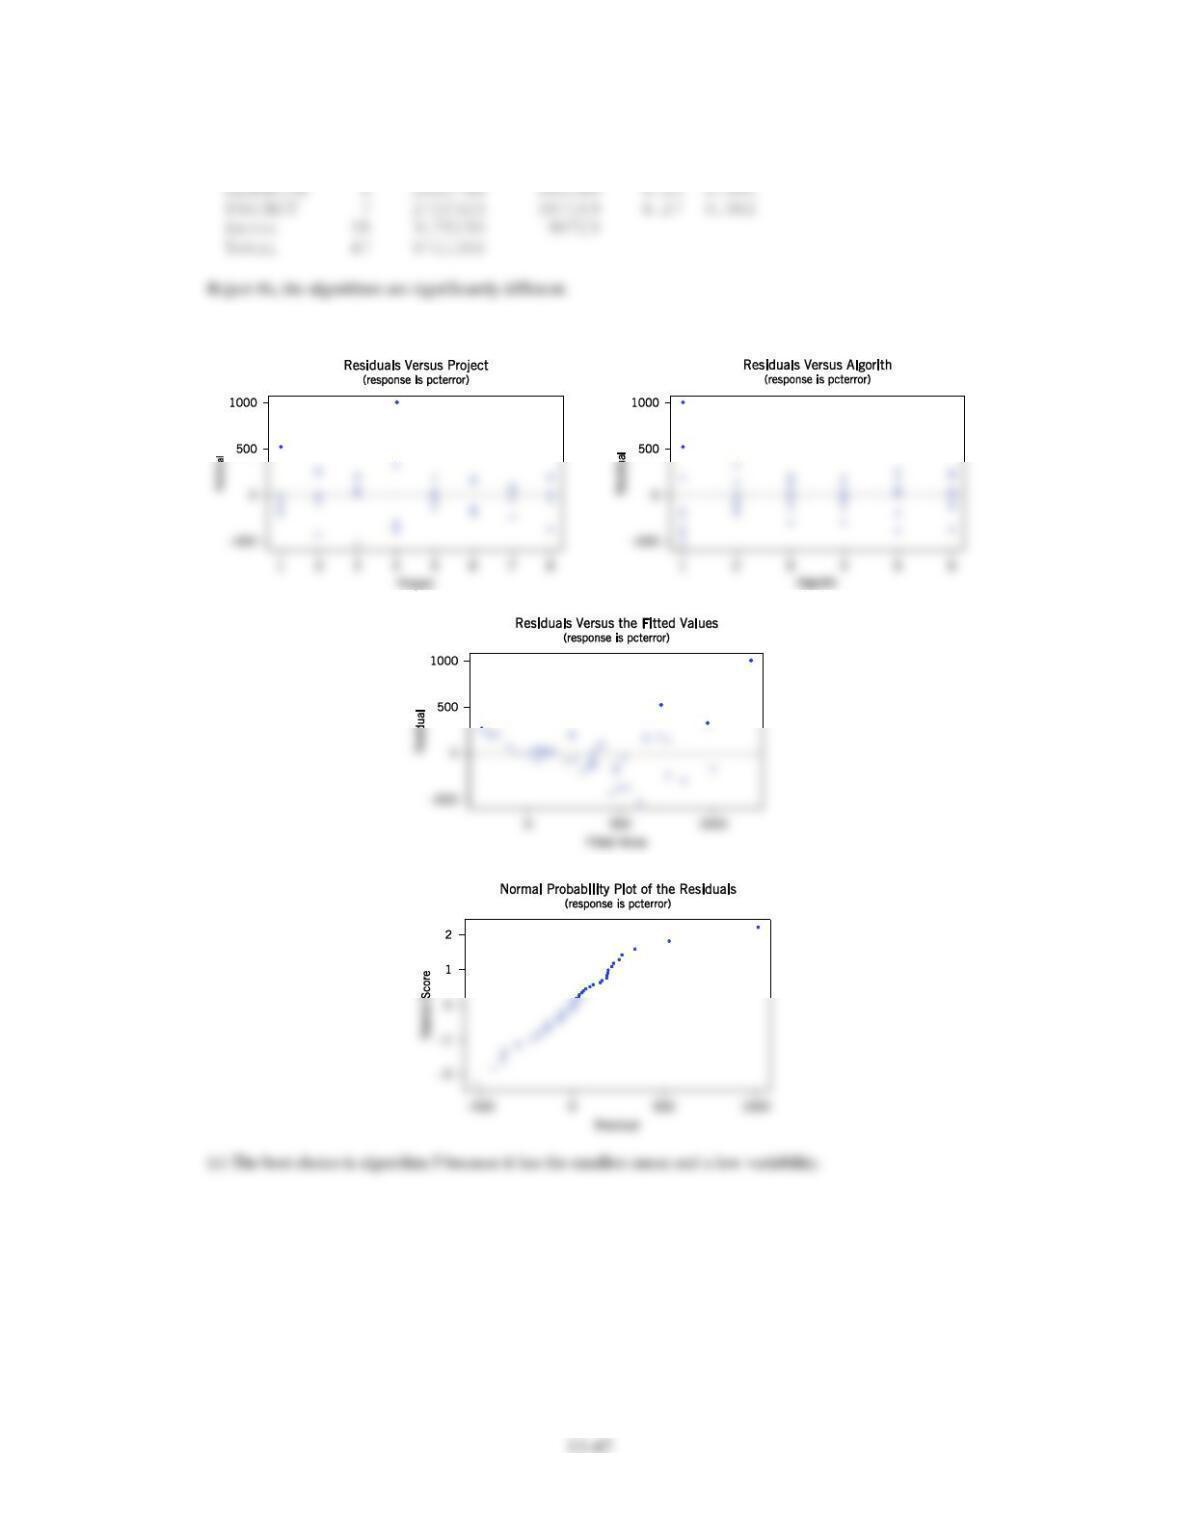
13.S15 An article in Communications of the ACM [(1987, Vol. 30(5), pp. 53–76] reported on a study of different algorithms for
estimating software development costs. Six algorithms were applied to eight software development projects and the
percent error in estimating the development cost was observed. The data are in Table 13E-2.
(a) Do the algorithms differ in mean cost estimation accuracy? Use
= 0.05.
(b) Analyze the residuals from this experiment.
(c) Which algorithm would you recommend for use in practice?
TABLE 13E-2 Software Development Costs
Project
Algorithm
1
2
3
4
5
6
7
8
1 (SLIM)
1244
21
82
2221
905
839
527
122
2(COCOMO-A)
281
129
396
1306
336
910
473
199
3(COCOMO-R)
220
84
458
543
300
794
488
142
4(COCOMO-C)
225
83
425
552
291
826
509
153
5(FUNCTION POINTS)
19
11
−34
121
15
103
87
−17
6(ESTIMALS)
−20
35
−53
170
104
199
142
41
Applied Statistics and Probability for Engineers,7th edition 2017
(a) Analysis of Variance for PCTERROR
Source DF SS MS F P
(b) The residuals look acceptable, except there is one unusual point.
13–48
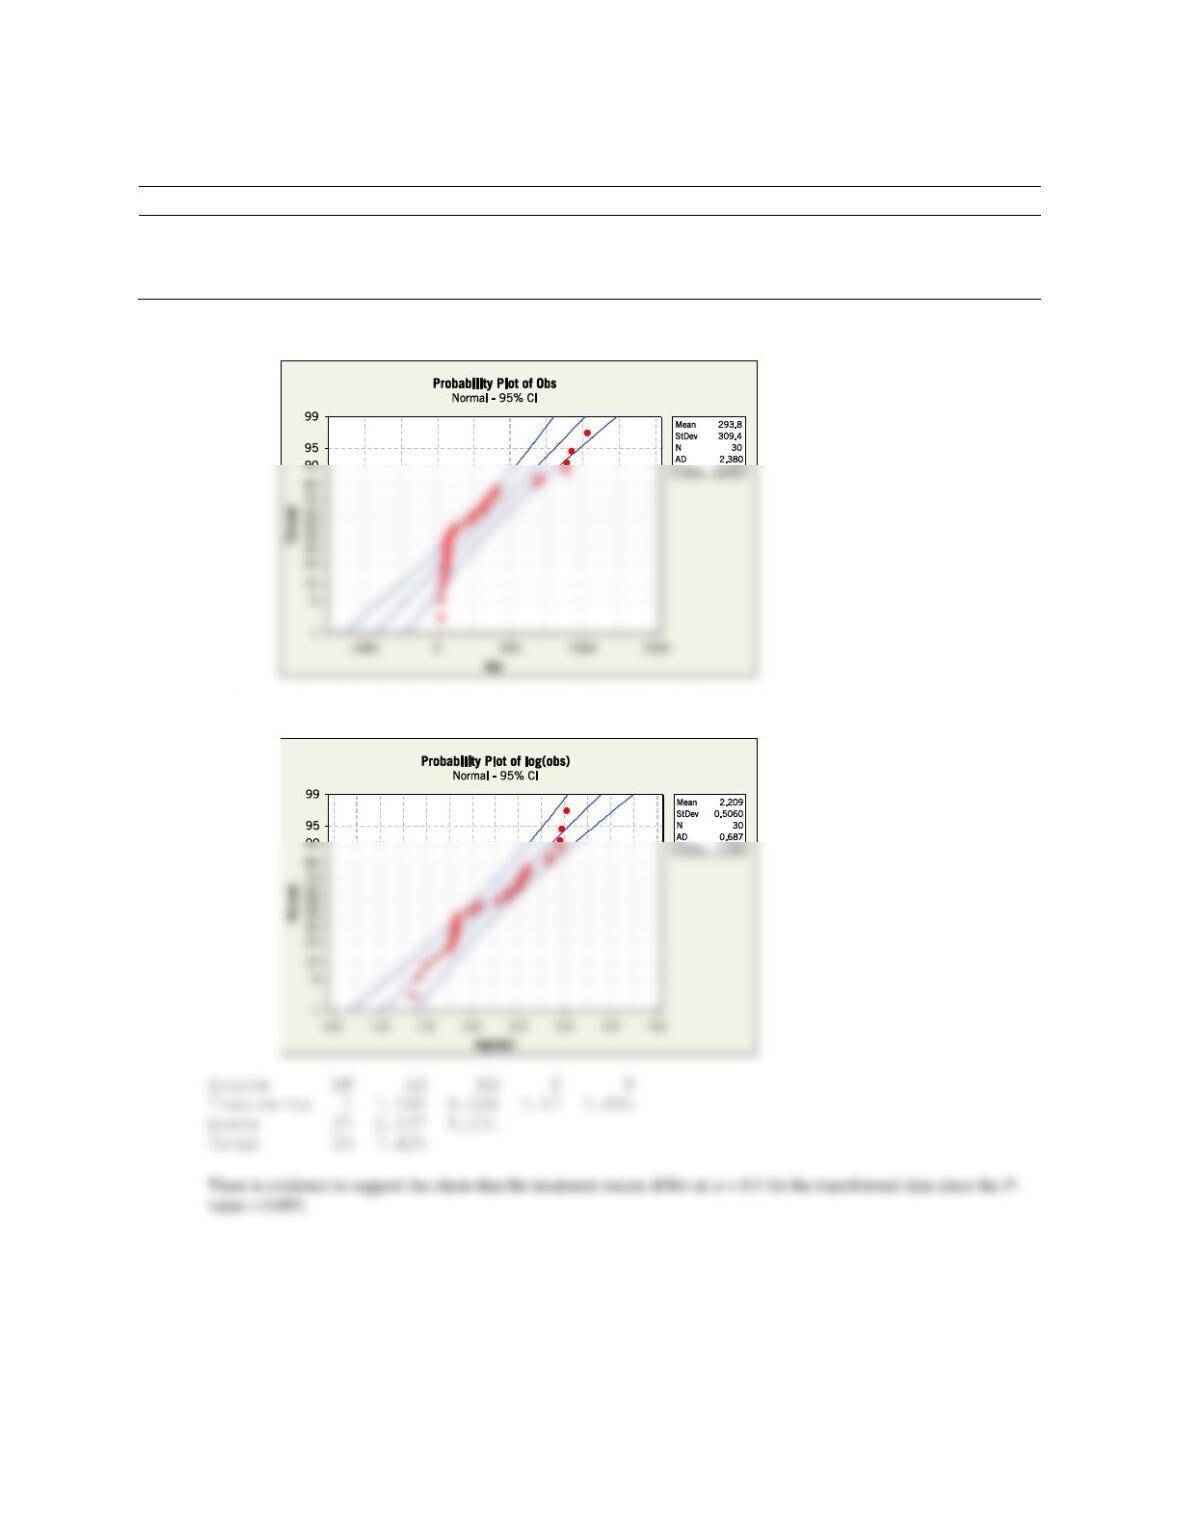
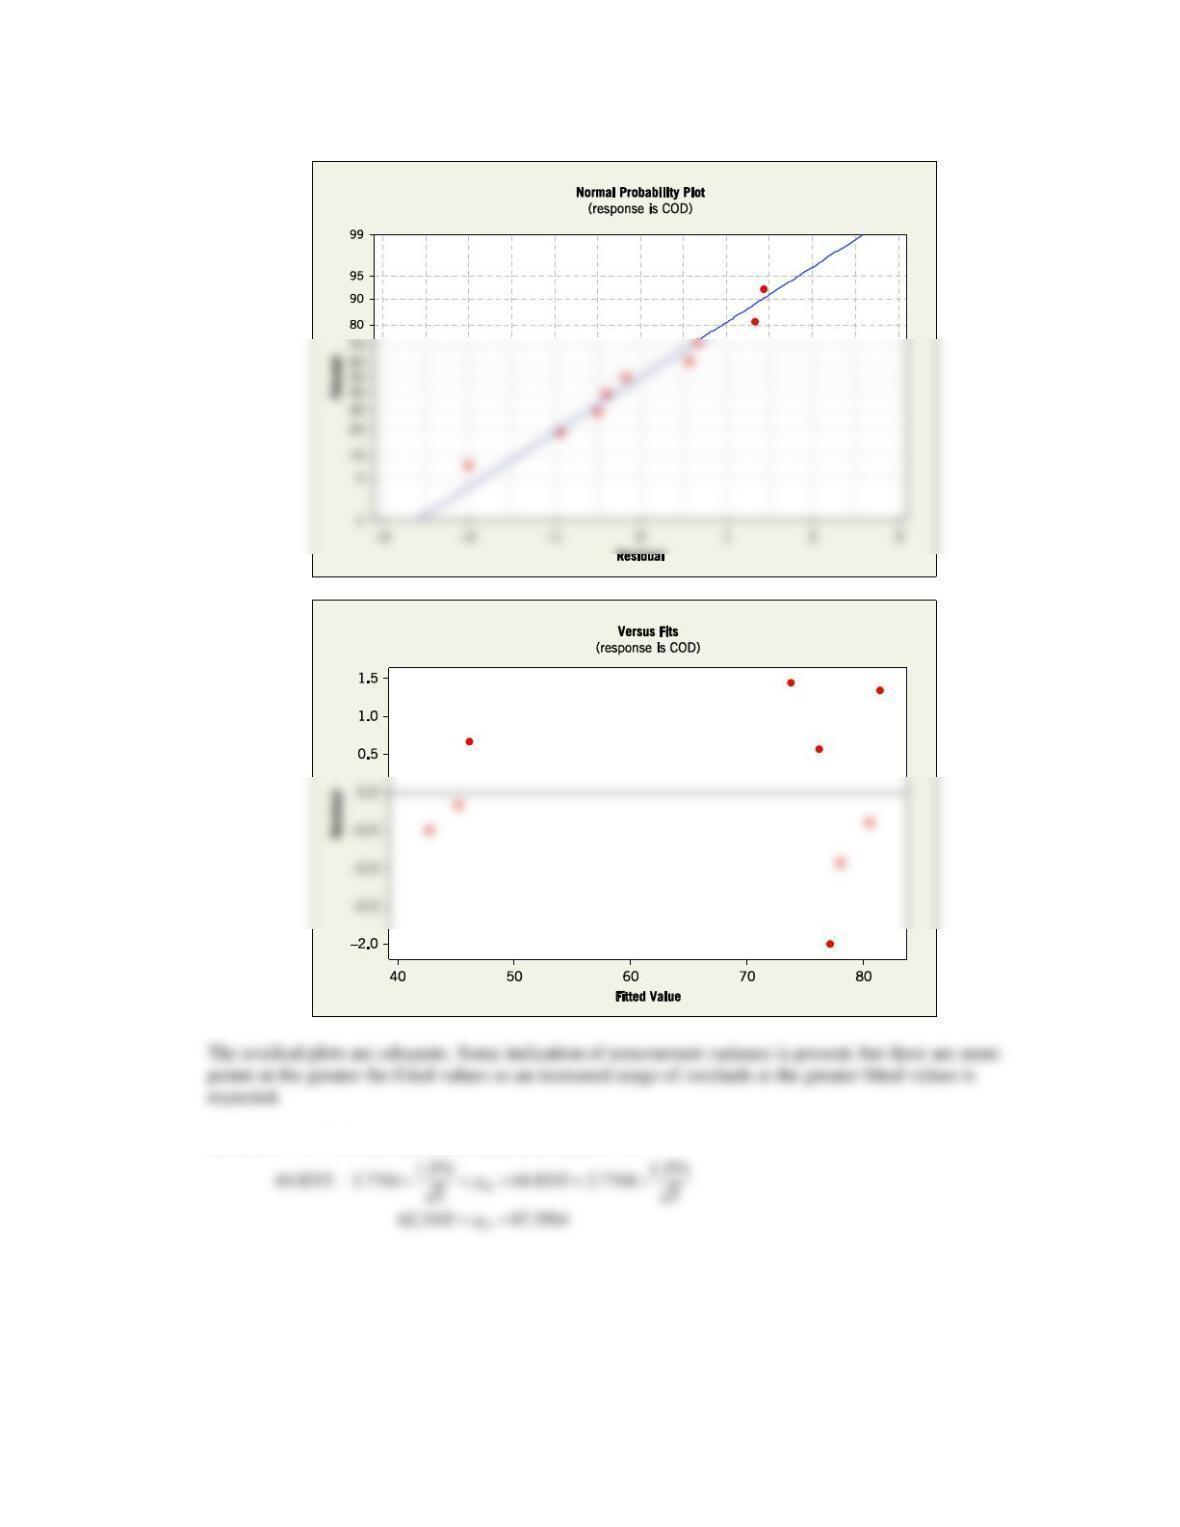
13.S16 An article in Journal of Hazardous Materials [“Toxicity Assessment from Electro-Coagulation Treated-Textile Dye
Waste Waters by Bioassays,” 2009, Vol. 172(1), pp. 330–337] discussed a study of pollutant removal from textile
dyeing waste water with an electro-coagulation technique. Chemical oxygen demand (COD) (a common measure of
water pollution) was used as the response, and three different values for electrolysis time were considered. The
following data were extracted from a larger study. Suppose that a randomized complete block experiment was
conducted with three blocks based on initial pH values.
Electrolysis
time (min)
Initial pH
3
7
11
15
77.1
75.2
42.2
30
80.1
76.8
45.0
45
82.8
75.2
46.8
(a) Is there an effect of electrolysis time at
= 0.05? Calculate the P-value.
(b) Analyze the residuals from the experiment.
(c) Calculate a 95% confidence interval on mean COD removal when the electrolysis time is 15 minutes.
(d) Perform an ANOVA assuming that all data are collected at a single pH value. Comment on differences from
part (a).
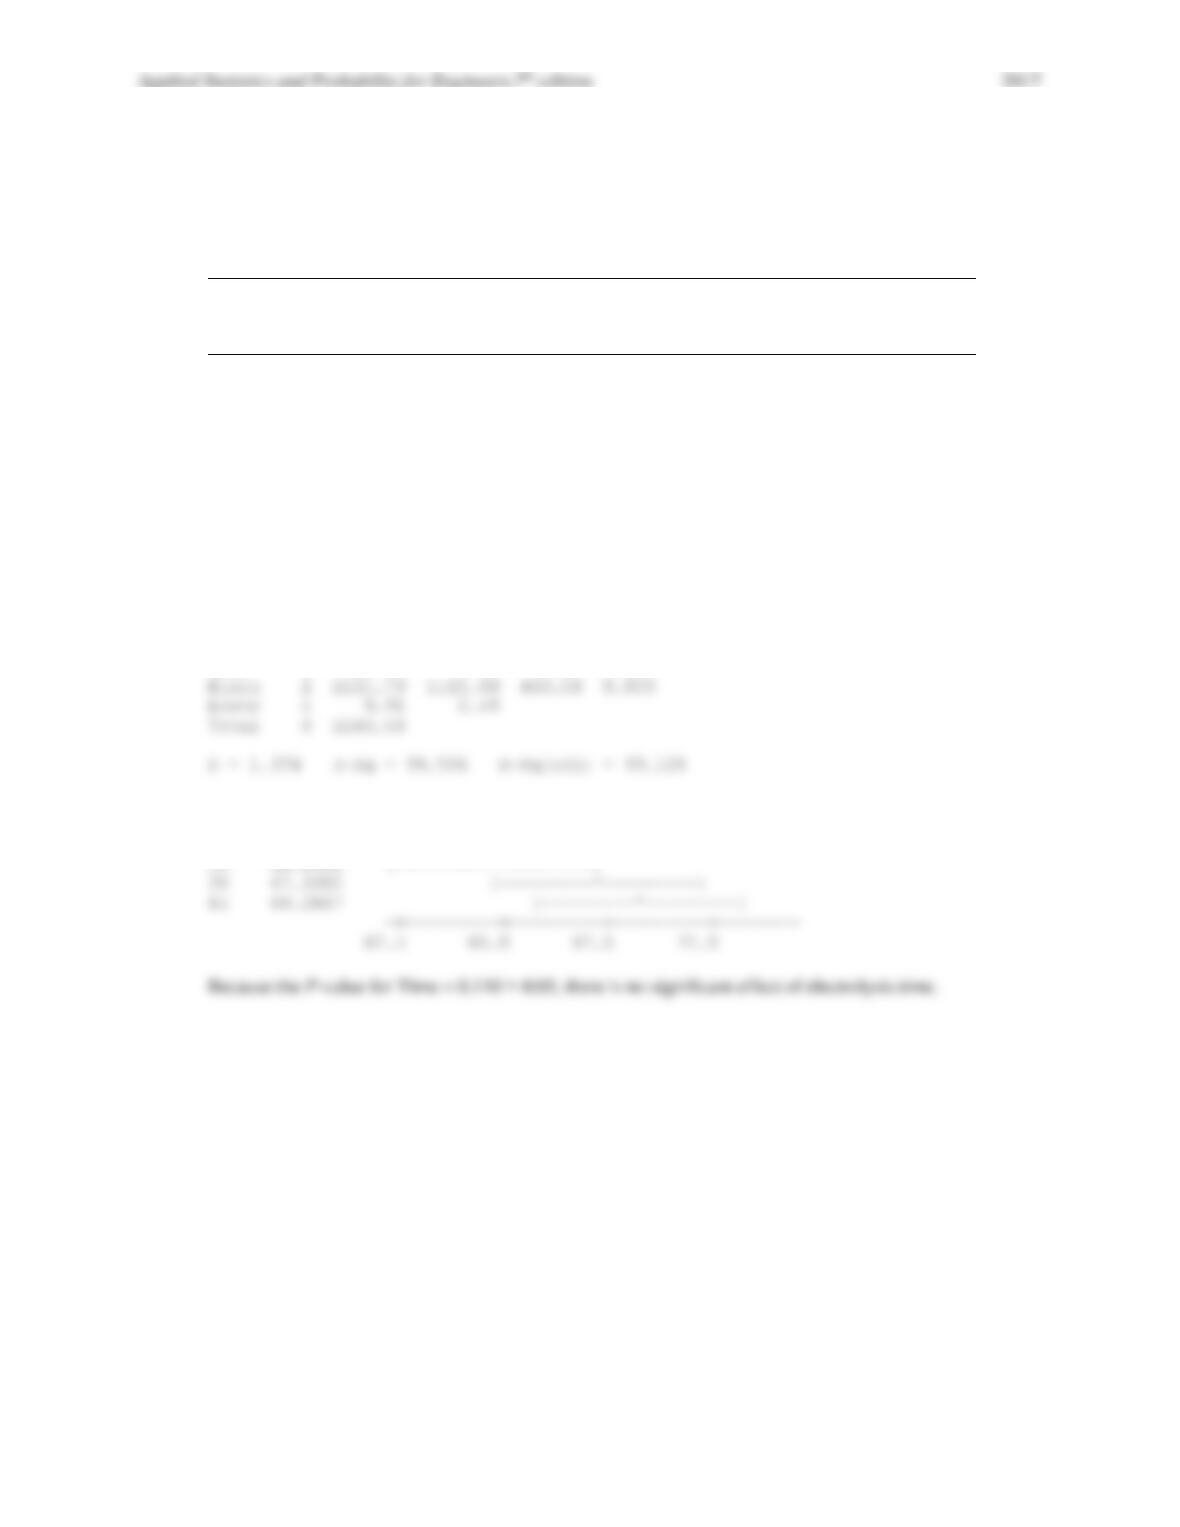
(a)
Source DF SS MS F P
Time 2 18.81 9.40 3.80 0.119
Individual 95% CIs For Mean Based on Pooled StDev
Time Mean -+———+———+———+——–
Applied Statistics and Probability for Engineers,7th edition 2017
13–49
(b)
(c) t0.05/2,4 = 2.7764, and the pooled standard deviation is 1.574.
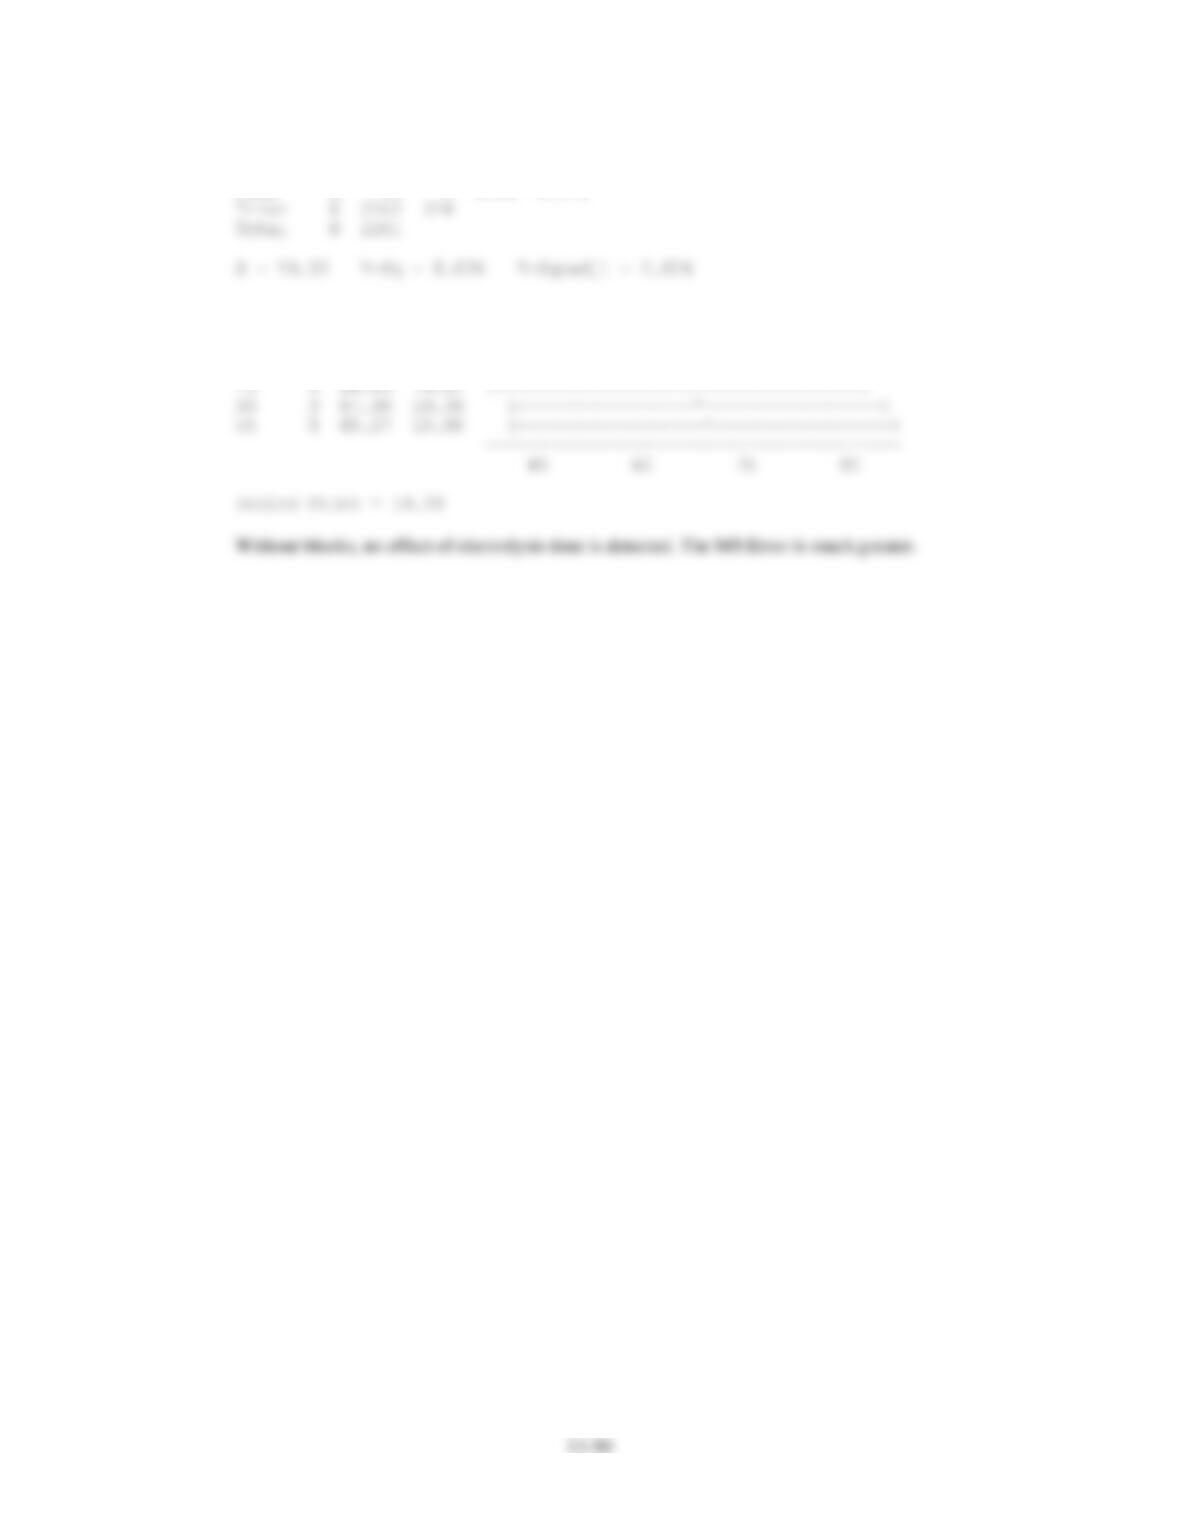
Applied Statistics and Probability for Engineers,7th edition 2017
(d)
Source DF SS MS F P
Time 2 19 9 0.03 0.975
Individual 95% CIs For Mean Based on
Pooled StDev
Level N Mean StDev —–+———+———+———+—-