
CHAPTER 13 RESERVE PROBLEMS
The following problems have been reserved for your use in assignments and testing and do not
appear in student versions of the text.
Reserve Problems Chapter 13 Section 2 Problem 1
Consider the tensile strength example in the table below.
Tensile Strength of Paper (psi)
Observation
5% hardwood
concentration
10% hardwood
concentration
1
7
12
2
9
17
3
15
12
4
10
17
5
10
19
6
9
14
a) Compare these two treatments with a two-sample t-test and compute the P-value.
b) Compare these two treatments with the ANOVA method, and show that the square of the t
statistic in part (a) equals the value of the
0
f
statistic in this part. Compute the P-value for the
test of no treatment differences.
c) Comment on the results in parts (a) and (b).
SOLUTION
a)
Observation
5% concentration
10% concentration
1
7
12
2
9
17
3
12
4
17
5
19
6
9
14

The parameter of interest is the difference in means
0 1 2
:0H
−=
Reject the null hypothesis if
12
0 /2, 2nn
tt
+−
−
or
12
0 /2, 2nn
tt
+−
.
( ) ( )
22
1 1 2 2
11
2.808
p
n s n s
Snn
− + −
==
b) Output of the ANOVA method
Source
DF
SS
MS
F
P
Percentage
1
80.08
80.08
10.16
0.0097
Error
10
7.88
Total
11
158.91
Source
N
Mean
StDev
5
6
10
2.683
10
6
15.17
2.927
Reserve Problems Chapter 13 Section 2 Problem 2

An article in the American Journal of Emergency Medicine compared the ability to detect acute
traumatic aortic injury (ATAI) on cervical x-ray images. The data consisted of 13 cases of ATAI,
19 cases with negative aortography (NAO) and 18 cases with multiple trauma (MT) without
aortography. Measurements of the cervical soft-tissue width at the third cervical vertebrae
generated the following results. Averages were 9.9, 9.2 and 7.4 mm and standard deviations were
3.6, 2.4 and 1.5 mm for the ATAI, NAO, and MT groups, respectively. Consider an ANOVA for
these data.
a) Use the sample sizes and group averages to compute the grand mean width and the mean
square for treatments.
b) Use the sample sizes and standard deviations in the groups to compute the mean square error.
c) Use the results in the previous parts to conduct the ANOVA test and prove that the mean
widths do not differ. Calculate the P-value for the test.
SOLUTION
a)
9.9 13 9.2 19 7.4 18 8.734
50
+ +
==
Reserve Problems Chapter 13 Section 2 Problem 3
Consider the following computer output for an experiment.
Source
DF
SS
MS
F
P-value
Factor
5
?
?
?
?
Error
?
27.28
?
Total
29
66.44
Source
F
P
Treatments
2
53.83
26.92
4.25
0.02
Error
47
297.45
6.33
Total
49
351.28
(a) How many replicates did the experimenter use?
(b) Fill in the missing information in the ANOVA table.
(c) Compute an estimate for
2
.
SOLUTION
(a)
Because there are 29 total degrees of freedom, there are 30 observations. Because there are 5
(b)
Row labeled as “Factor” consists data for treatments.
(c)
Reserve Problems Chapter 13 Section 2 Problem 4
In the book Analysis of Longitudinal Data, 2nd ed., (2002, Oxford University Press), by Diggle,
Heagerty, Liang,and Zeger, the authors analyzed the effects of three diets on the protein content
of cow’s milk. The data shown here were collected after one week and include 25 cows on the
barley diet and 27 cows each on the other two diets:
Diet
Protein content of cow’s milk
Barley
3.
6
3
3.
2
4
3.
9
8
3.
6
6
4.
3
4
4.
3
6
4.
1
7
4.
4
3.
4
3.
7
5
4
.
2
4.
0
2
4.
0
2
3.
9
3.
8
1
3.
6
2
3.
6
6
4.
4
4
4.
2
3
3.
8
2
3.
5
3
4.
4
7
3.
9
3
3.
2
7
3
.
3
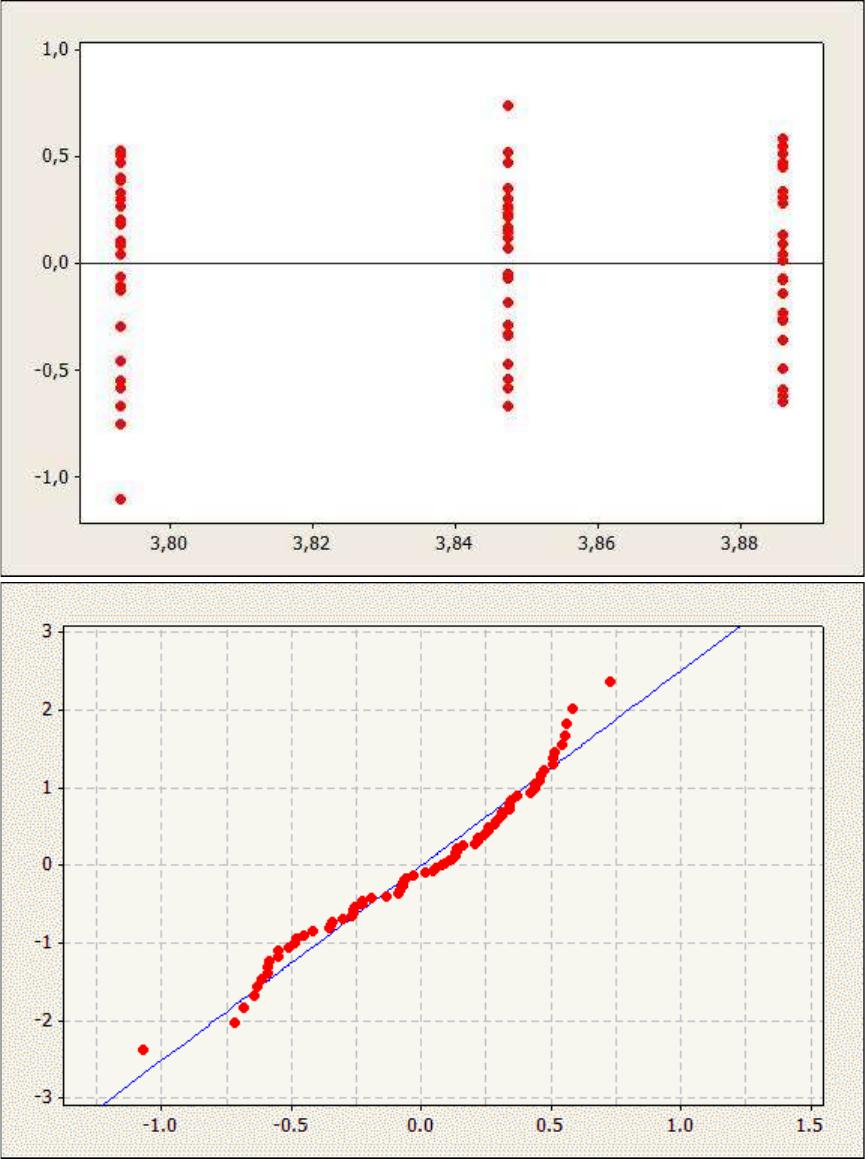
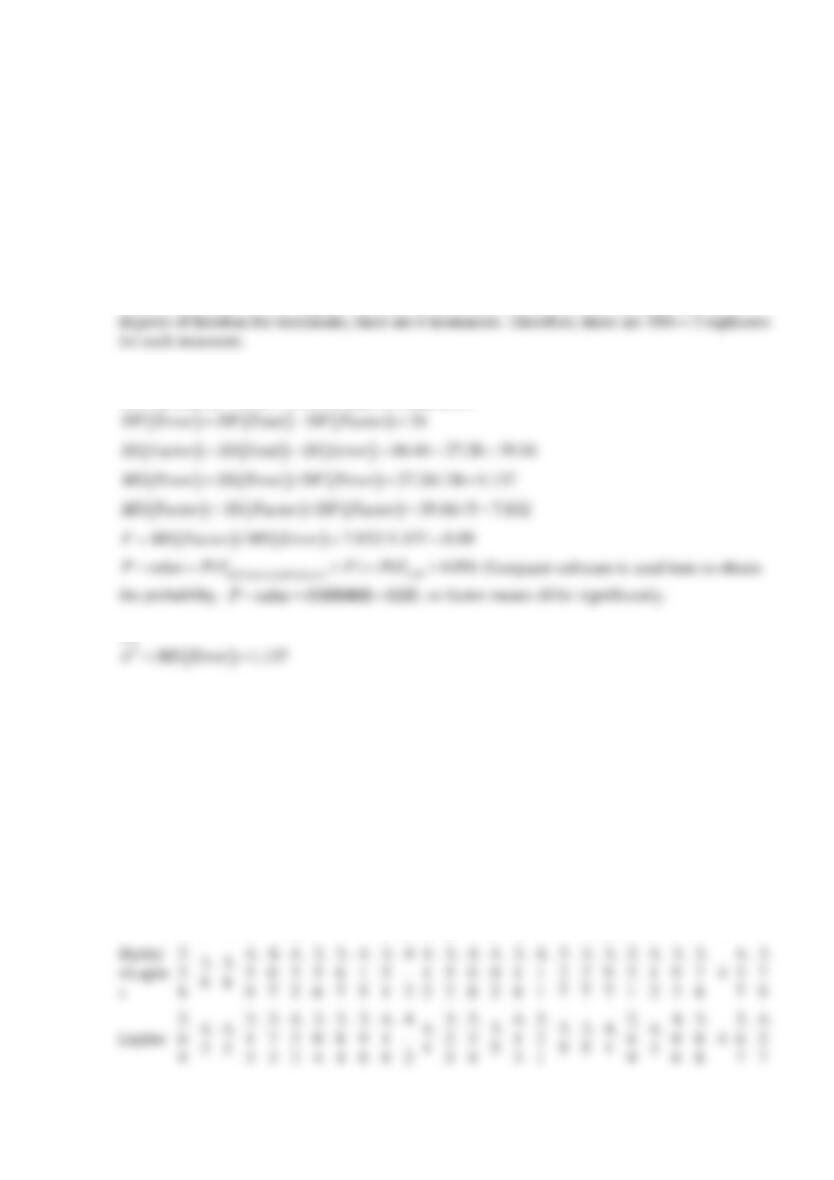
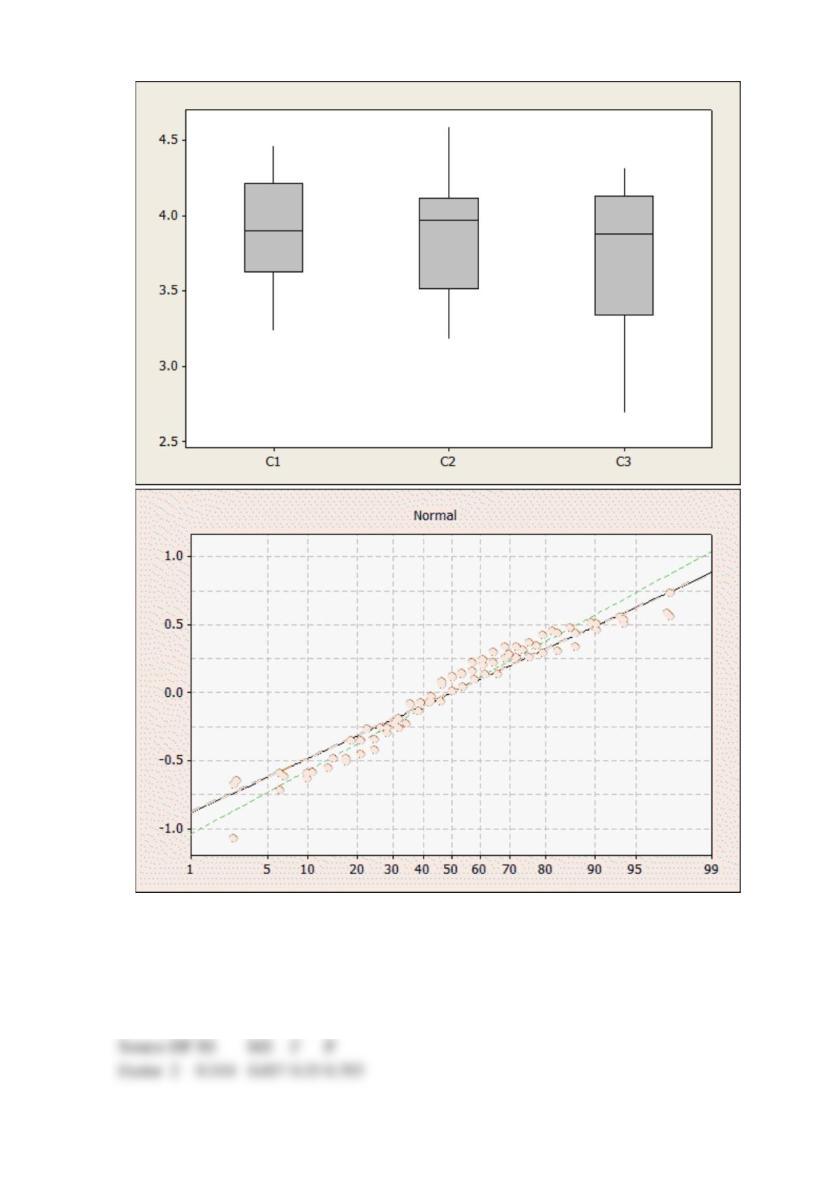
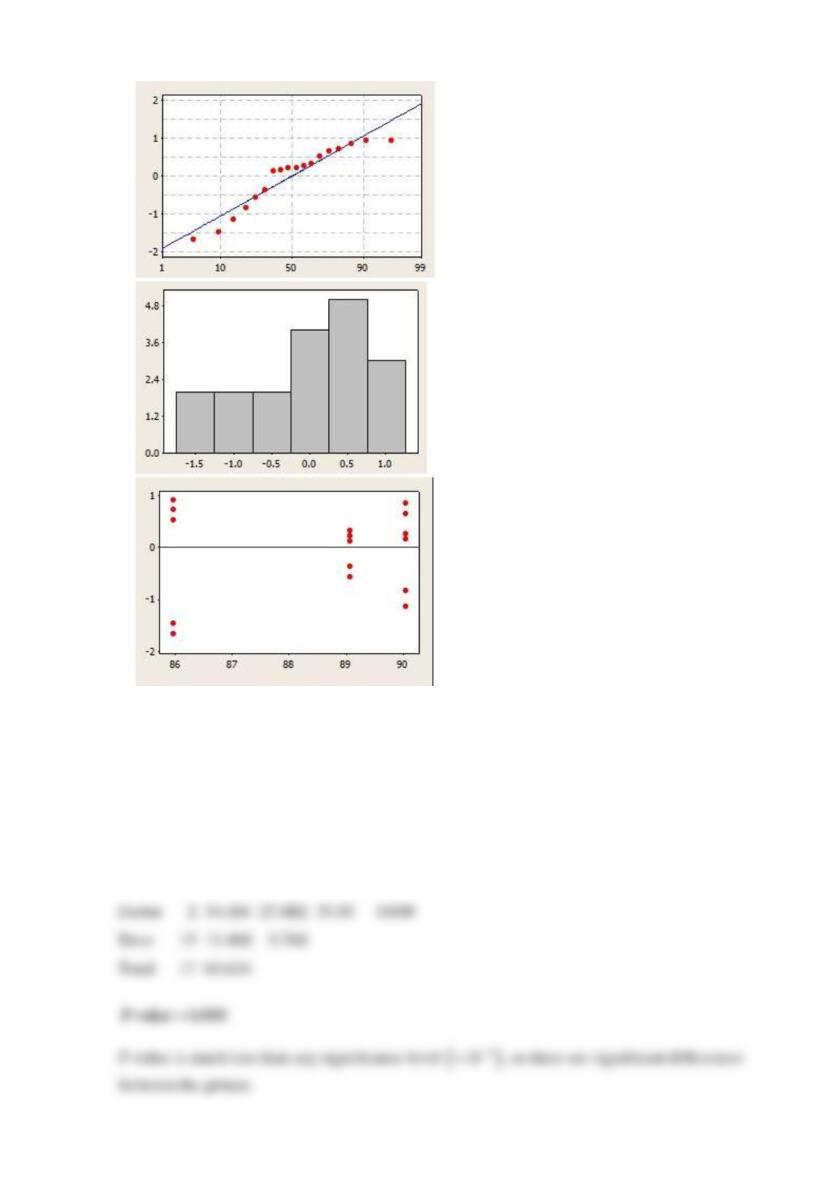
(a) Does diet affect the protein content of cow’s milk? Find the P-value of the test, use
0.05
=
.
(b) Analyze the residuals. Select from the
above the plot of residuals versus fitted values.
A
B
C
D
SOLUTION
(a) Does diet affect the protein content of cow’s milk? Find the P-value of the test, use
0.05
=
.
ANOVA output:
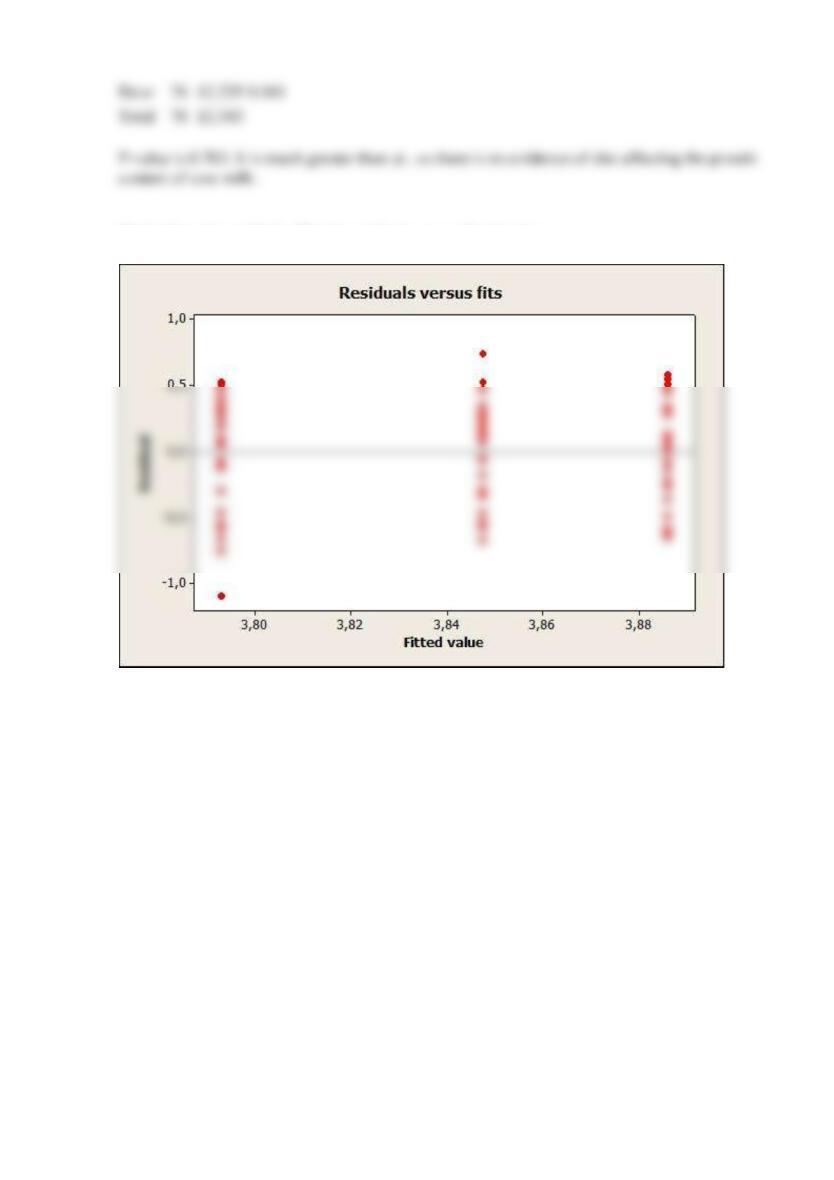
(b) Analyze the residuals. Plot the residuals versus fitted values.
Reserve Problems Chapter 13 Section 2 Problem 5
An article in Fuel Processing Technology described an experiment to investigate the effect of
potassium hydroxide in synthesis of biodiesel. It is suspected that potassium hydroxide (PH) is
related to fatty acid methyl esters (FAME) which are key elements in biodiesel. Three levels of
PH concentration were used, and six replicates were run in a random order. Data are shown in
the following table:
PH concentration(wt.%)
FAME concentration (wt.%)
0.6
84.3
84.5
86.5
86.7
86.9
86.9
0.9
89.3
89.4
88.5
88.7
89.2
89.3
1.2
90.2
90.3
88.9
89.2
90.7
90.9
(a) Construct the analysis of variance. Are there any differences in PH concentrations at
0.05
=
? Calculate the P-value.
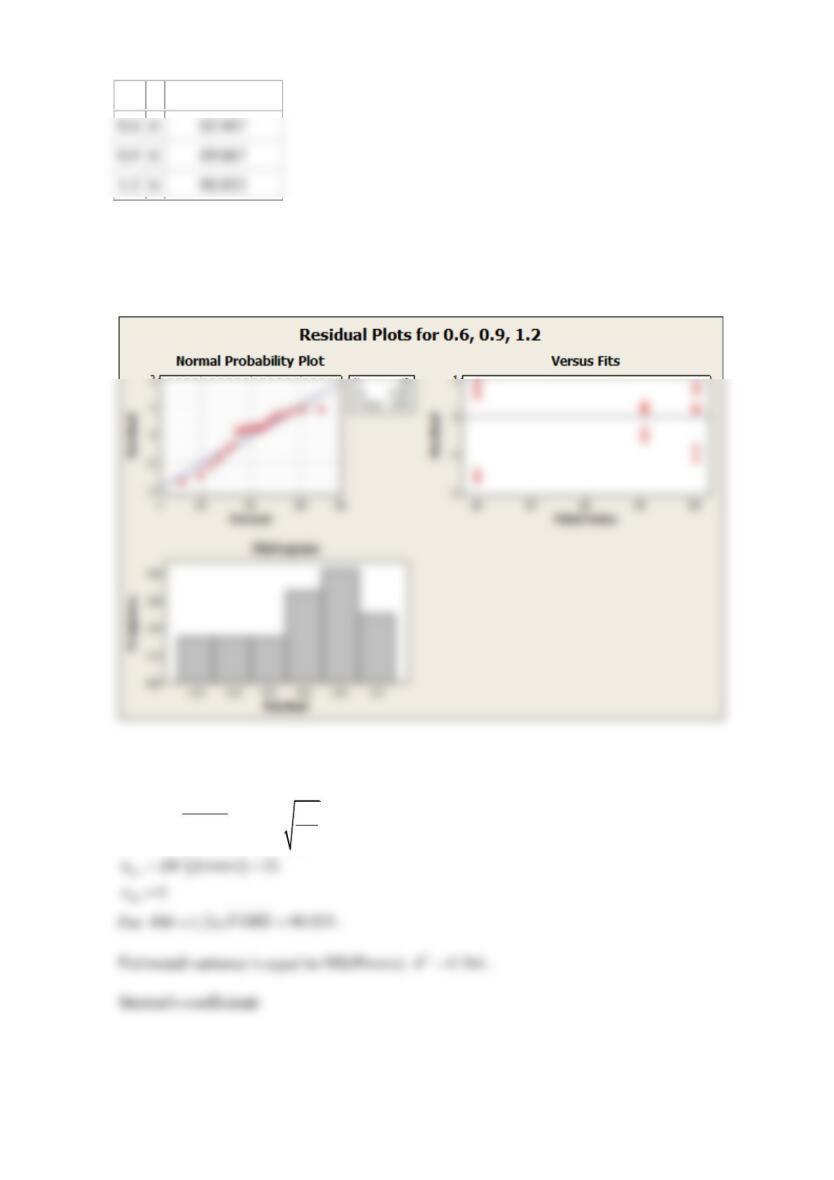
(b) Analyze the residuals from the experiment. Choose the right normal probability plot from
below.
Error
76
12.229
0.161
Total
78
12.343
A
B
C
(c) Compute a 95% confidence interval on FAME when the PH concentration is 1.2. Round your
answers to three decimal places.
SOLUTION
(a)
ANOVA output is:
Source
DF
SS
MS
F
P-value
Factor
54.164
27.082
35.45
Error
11.460
Total
65.624
PH
n
Average FAME
(b)
Residuals plots for this data are:
(c)
Interval:
2
/2,
ˆ
err
n
ph
FAME t n
6
6
6

Reserve Problems Chapter 13 Section 2 Problem 6
The response time in milliseconds was determined for three different types of circuits in an
electronic calculator. The results are recorded in table:
Circuit type
Response
1
19
22
20
18
25
2
20
21
33
27
40
3
16
15
18
26
17
Apply Fisher’s LSD method with
0.01
=
and determine which circuits type differ. What is the
value of LSD? What is the difference between means for circuits 1 and 3 (by module)? Estimate
the standart error for means for graphical method using.
SOLUTION
ANOVA output:
Source
DF
SS
MS
F
P
Factor
2
260.9
130.5
4.01
0.046
Error
12
390.8
32.6
Total
14
651.7
circuit
n
mean
1
5
20.8
2
5
28.2
3
5
18.4

Difference of means and LSD:
Reserve Problems Chapter 13 Section 2 Problem 7
Conductivity of five different types of coating for cathode ray tubes is measured. Data shown in
table:
Coating type
Conductivity
1
143
141
150
146
2
152
149
137
143
3
134
133
132
127
4
129
127
132
129
5
147
148
144
142
Apply Fisher’s LSD method with
0.02
=
and determine which levels of the factor differ. What
is the value of LSD? What is the difference (absolute) between means conductivity for coating
type 5 and coating type 3? Estimate the standart error for means for graphical method using.
SOLUTION
ANOVA Output:
source
DF
SS
MS
F
P
factor
4
1060.5
265.1
16.35
0
error
15
243.3
16.2
total
19
1303.8
coating type
mean conductivity
1
145.0
Table of mean differencies (column mean – row mean):
2
3
4
5
1
0.25
-13.5
-15.75
0.25
2
-13.75
-16.0
0
3
-2.250
13.750
4
16
Reserve Problems Chapter 13 Section 2 Problem 8
In the book Analysis of Longitudinal Data, 2nd ed., (2002, Oxford University Press), by Diggle,
Heagerty, Liang,and Zeger, the authors analyzed the effects of three diets on the protein content
of cow’s milk. The data shown here were collected after one week and include 25 cows on the
barley diet and 27 cows each on the other two diets:
diet
Protein content of cow’s milk.
Barley
3.
63
3.
24
3.
98
3.
66
4.
34
4.
36
4.
17
4.
4
3.
4
3.
75
4
.
2
4.
02
4.
02
3.
9
3.
81
3.
62
3.
66
4.
44
4.
23
3.
82
3.
53
4.
47
3.
93
3.
27
3
.
3
2
145.25
3
131.50
4
129.25
5
145.25

Barley+
Lupins
3.
38
3.
8
3.
8
4.
59
4.
07
4.
32
3.
56
3.
67
4.
15
3.
51
4
.
2
4.
12
3.
52
4.
08
4.
02
3.
18
4.
11
3.
27
3.
27
3.
97
3.
31
4.
12
3.
92
3.
78
4
4.
37
3.
79
Lupins
3.
69
4.
2
4.
2
3.
13
3.
73
4.
32
3.
04
3.
84
3.
98
4.
18
4
.
2
4.
1
3.
25
3.
34
3.
5
4.
13
3.
21
3.
9
3.
5
4.
1
2.
69
4.
3
4.
06
3.
88
4
3.
67
4.
27
Apply Fisher’s LSD method with
0.01
=
and determine which levels of the factor differ. What
is the value of LSD for Barley diet and Lupins diet? What is the difference (absolute) between
mean protein content after Barley diet and Lupins diet? Estimate the standart error for means for
graphical method using. Use minimum sample size.
SOLUTION
Anova output:
Source
DF
SS
MS
F
P
Factor
2
0.114
0.057
0.35
0.703
Mean values:
n
mean protein
Barley (b)
25
3.886
Barley+Lupins (b+l)
27
3.847
Lupins (l)
27
3.793
Mean differences:
12 31 32
0.039 0.093 0.054
b l b l b l b l
M Mean Mean M Mean Mean M Mean Mean
++
= − = = − = = − =
Error
76
12.229
0.161
Total
78
12.343
Reserve Problems Chapter 13 Section 2 Problem 9
Suppose that five normal populations have common variance
2100
=
and means
1 2 3 4 5
175, 190, 160, 200, 215
= = = = =
.
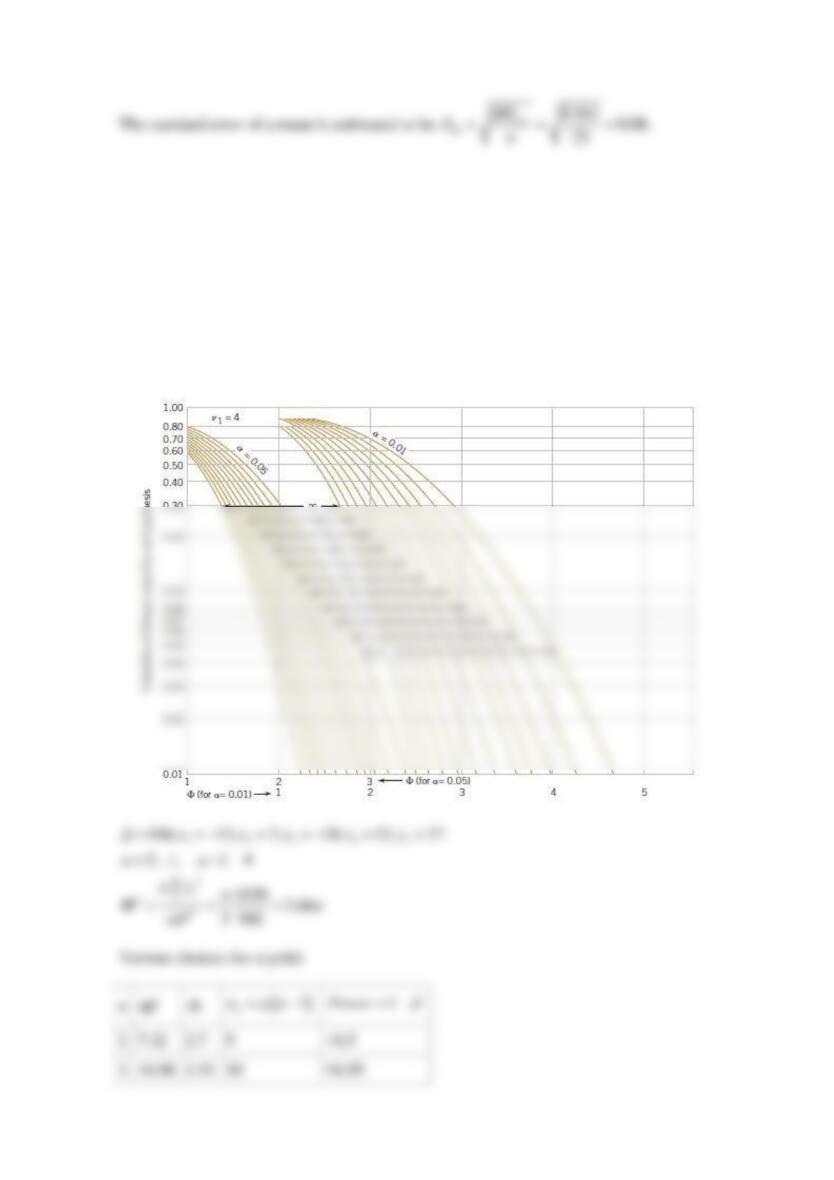
How many observations per population must be taken so that the probability of rejecting the
hypothesis of equality of means is at least 0.95?
SOLUTION
Use
0.01
=
and chart below:
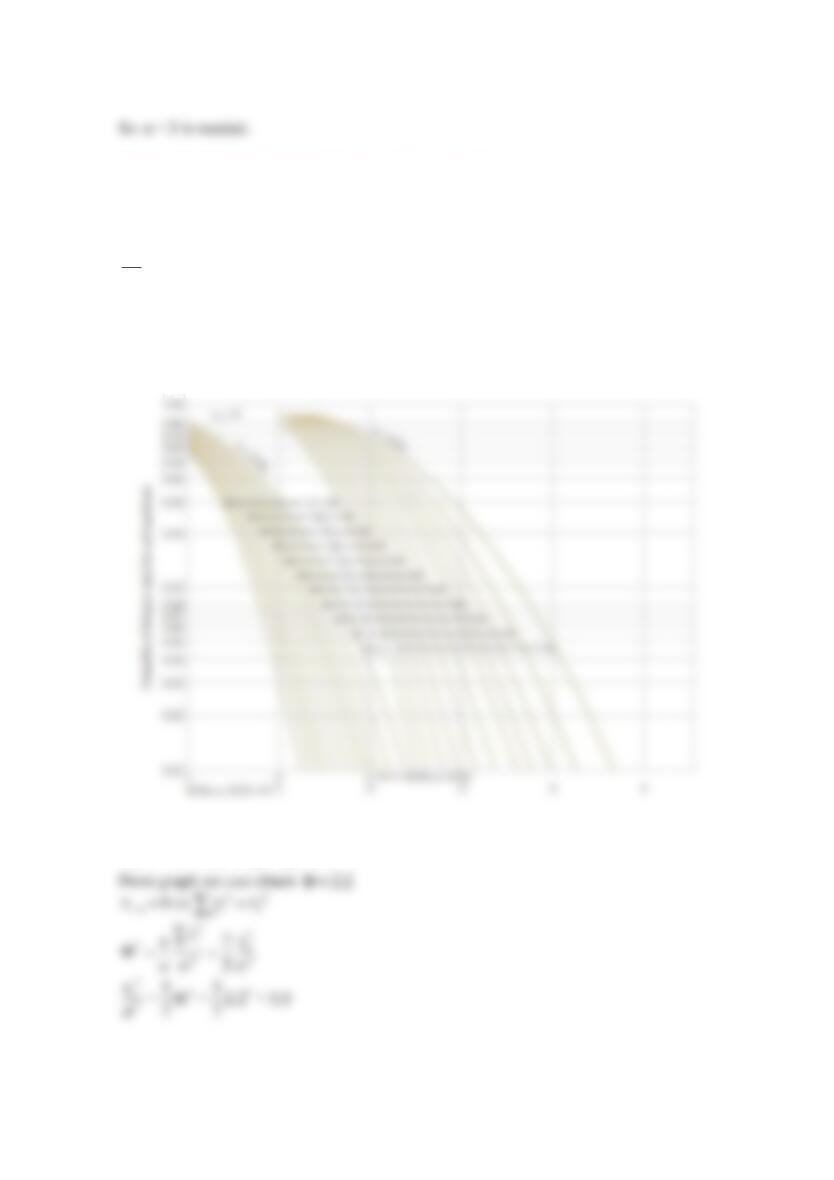
Reserve Problems Chapter 13 Section 2 Problem 10
Suppose that five normal populations with common variance
2
are to be compared with a
sample size of seven observations from each.
1 2 3 4 0
= = = =
. What is the smallest value for
2
5
2
that can be detected with power 90% and
0.01
=
?
SOLUTION
Use the chart below:
5, 7an==
( )
12
1 4; 1 30a a n
= − = = − =
Reserve Problems Chapter 13 Section 3 Problem 1

In the book Bayesian Inference in Statistical Analysis (1973, John Wiley and Sons) by Box and
Tiao, the total product yield for five samples was determined randomly selected from each of six
randomly chosen batches of raw material. Data shown in table:
Batch
Yield (in grams)
1
1545
1440
1440
1520
1580
2
1540
1555
1490
1560
1495
3
1595
1550
1605
1510
1560
4
1445
1440
1595
1465
1545
5
1595
1630
1515
1635
1625
6
1520
1455
1450
1480
1445
(a) Test if the different batches of raw material significantly affect mean yield. What is the P-
value of test? Use
0.01
=
.
(b) Estimate the variability between batches.
(c)
Analyze the residuals from this experiment. Select normal probability plot from below:
A
B

C
D
SOLUTION
(a)
ANOVA output:
Source
DF
SS
MS
F
P
Batch
5
56538
11272
4.60
0.004
(b)
(c)
Residuals plots for this data are:
Error
24
58830
2451
Total
29
115188

Reserve Problems Chapter 13 Section 3 Problem 2
A textile mill has a large number of looms. Each loom is supposed to provide the same output of
cloth per minute. To investigate this assumption, five looms are chosen at random, and their
output is measured at different times. The following data are obtained:
Loom
Output (lb/min)
1
4.1
4.1
4.2
4.0
4.1
2
3.9
3.8
3.9
3.9
4.0
3
4.1
4.1
4.1
4.0
3.9
4
3.6
3.8
4.1
3.9
3.7
5
3.8
3.6
3.9
3.8
4.1
(a) Estimate the total variability in the output response.
(b) How much of the total variability in the output response is due to the difference between
looms?
(c) To what level could the variability in the output response be reduced if the loom-to-loom
variability could be eliminated?
SOLUTION
(a)
ANOVA output for data:

Total
24
0.660
Reserve Problems Chapter 13 Section 3 Problem 3
The response time in milliseconds was determined for three random types of circuits in an
electronic calculator. The results are recorded in table:
Circuit type
Response time
1
19
22
22
18
25
2
20
21
33
27
42
3
16
17
18
24
17
Estimate the parameters of statistical model for this experiment. What is the value of variance
components?
SOLUTION
ANOVA output:
Source
DF
SS
MS
F
P
Factor
2
277.7
138.87
4.113
0.0436
Error
12
405.2
33.77
Total
14
682.9

Reserve Problems Chapter 13 Section 3 Problem 4
Protein content in cow’s milk is observed for cows on three random selected diets. Data are shown in table:
diet
Protein content of cow’s milk.
1
3.63
3.24
3.98
3.66
4.34
4.36
4.17
4.4
3.4
3.75
4.2
4.02
4.02
3.9
3.81
3.62
3.66
4.44
4.23
3.82
3.53
4.47
3.93
3.27
3.3
2
3.38
3.8
3.8
4.59
4.07
4.32
3.56
3.67
4.15
3.51
4.2
4.12
3.52
4.08
4.02
3.18
4.11
3.27
3.27
3.97
3.31
4.12
3.92
3.78
3
3.69
4.2
4.2
3.13
3.73
4.32
3.04
3.84
3.98
4.18
4.2
4.1
3.25
3.34
3.5
4.13
3.21
3.9
3.5
4.1
2.69
4.3
4.06
3.88