Fit a multiple regression model to relate the quarterback rating to the percentage of completions,
the percentage of TDs, and the percentage of interceptions.
(a) Test for significance of regression using
0.05
=
. What is the P-value for this test?
(b) Conduct the t-test for each regression coefficient. Use
0.05
=
.
1. For
1
:
2. For
2
:
3. For
3
:
SOLUTION
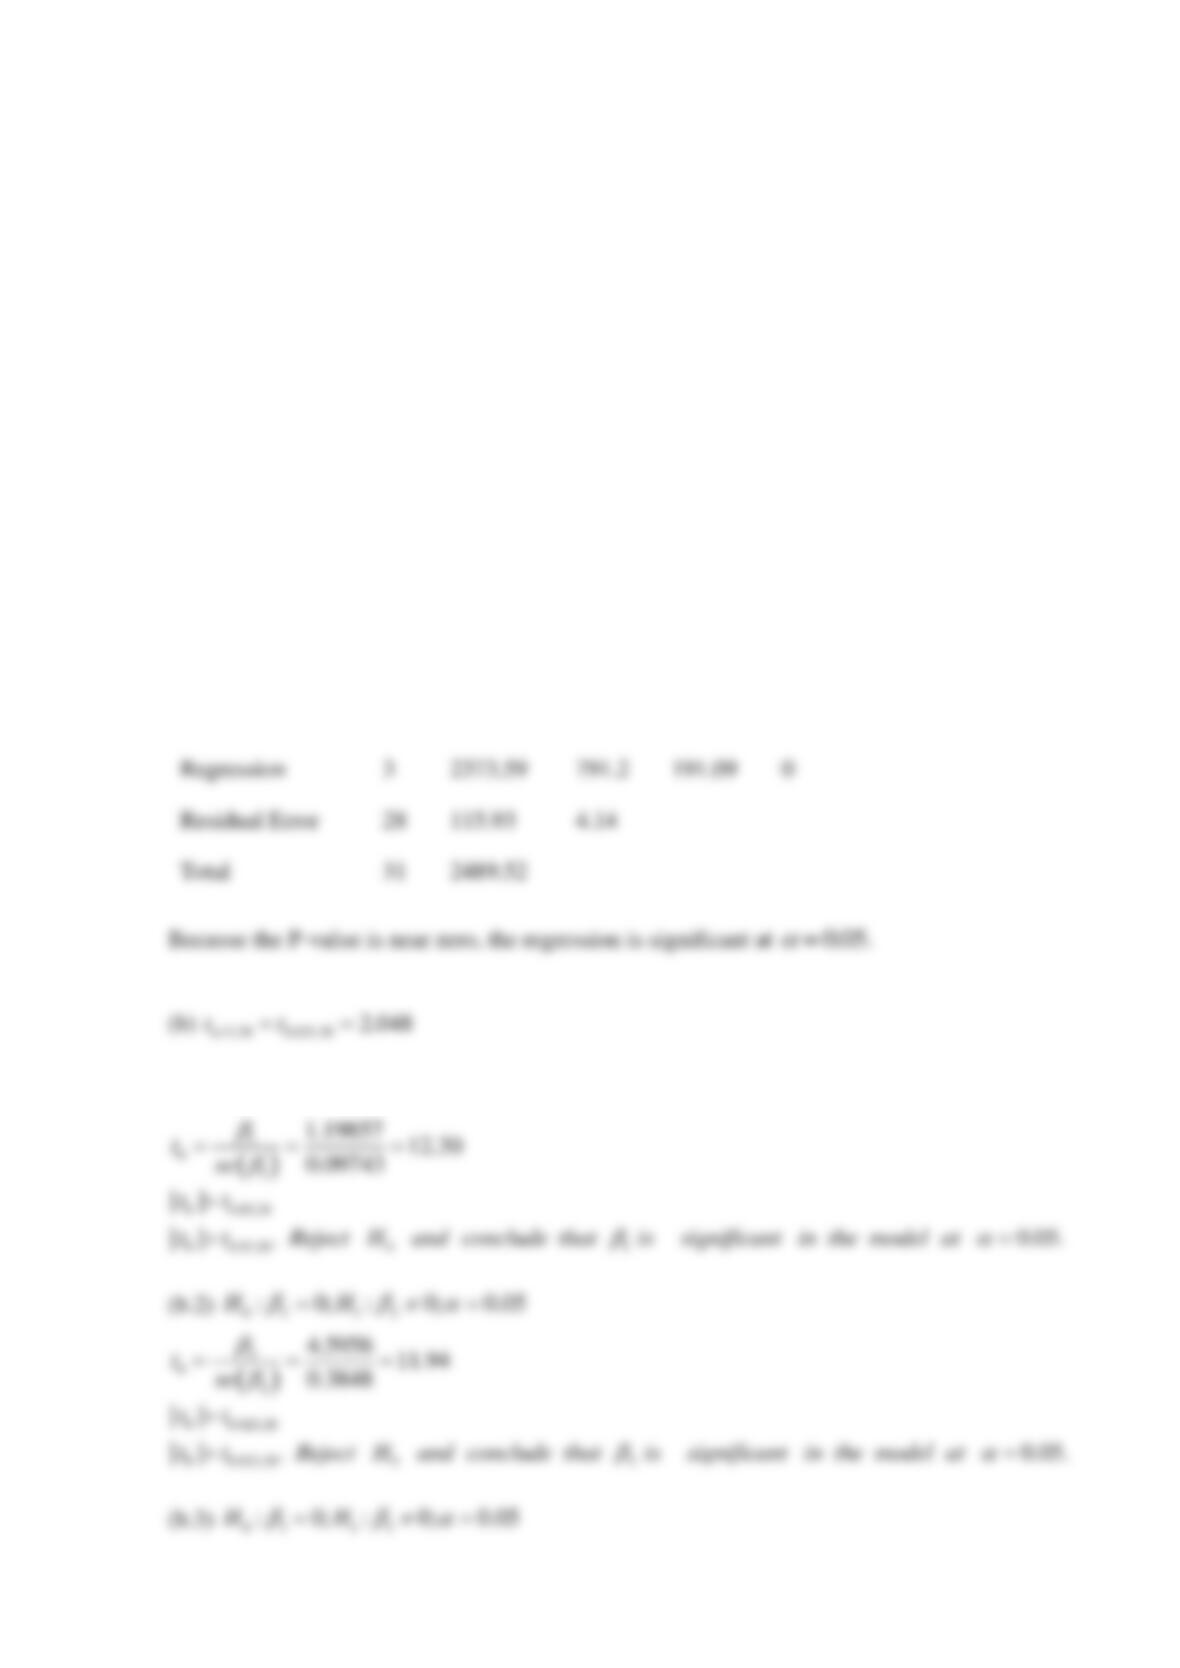
(a)
Analysis of Variance
Source
DF
SS
MS
F
P
(b.1)
0 1 1 1
: 0; : 0; 0.05HH
= =
Regression
3
2373.59
791.2
191.09
0
Residual Error
28
115.93
4.14
Total
31
2489.52
0.05
=

Reserve Problems Chapter 12 Section 2 Problem 13
The data from a patient satisfaction survey in a hospital are in Table. The possible regressor
variables are the patient’s age, an illness severity index (higher values indicate greater severity),
an indicator variable denoting whether the patient is a medical patient (0) or a surgical patient
(1), and an anxiety index (higher values indicate greater anxiety).
Table Patient Satisfaction Data
Observation
Age
Severity
Surg-Med
Anxiety
Satisfaction
1
55
50
0
2.1
68
2
46
24
1
2.8
77
3
30
46
1
3.3
96
4
35
48
1
4.5
80
5
59
58
0
2.0
43
6
61
60
0
5.1
44
7
74
65
1
5.5
26
8
38
42
1
3.2
88
9
27
42
0
3.1
75
10
51
50
1
2.4
57
11
53
38
1
2.2
56
12
41
30
0
2.1
88
13
37
31
0
1.9
88
14
24
34
0
3.1
102
15
42
30
0
3.0
88
16
50
48
1
4.2
70
17
58
61
1
4.6
52
18
60
71
1
5.3
43
19
62
62
0
7.2
46
20
68
38
0
7.8
56
21
70
41
1
7.0
59
22
79
66
1
6.2
26
23
63
31
1
4.1
52
24
39
42
0
3.5
83
25
49
40
1
2.1
75
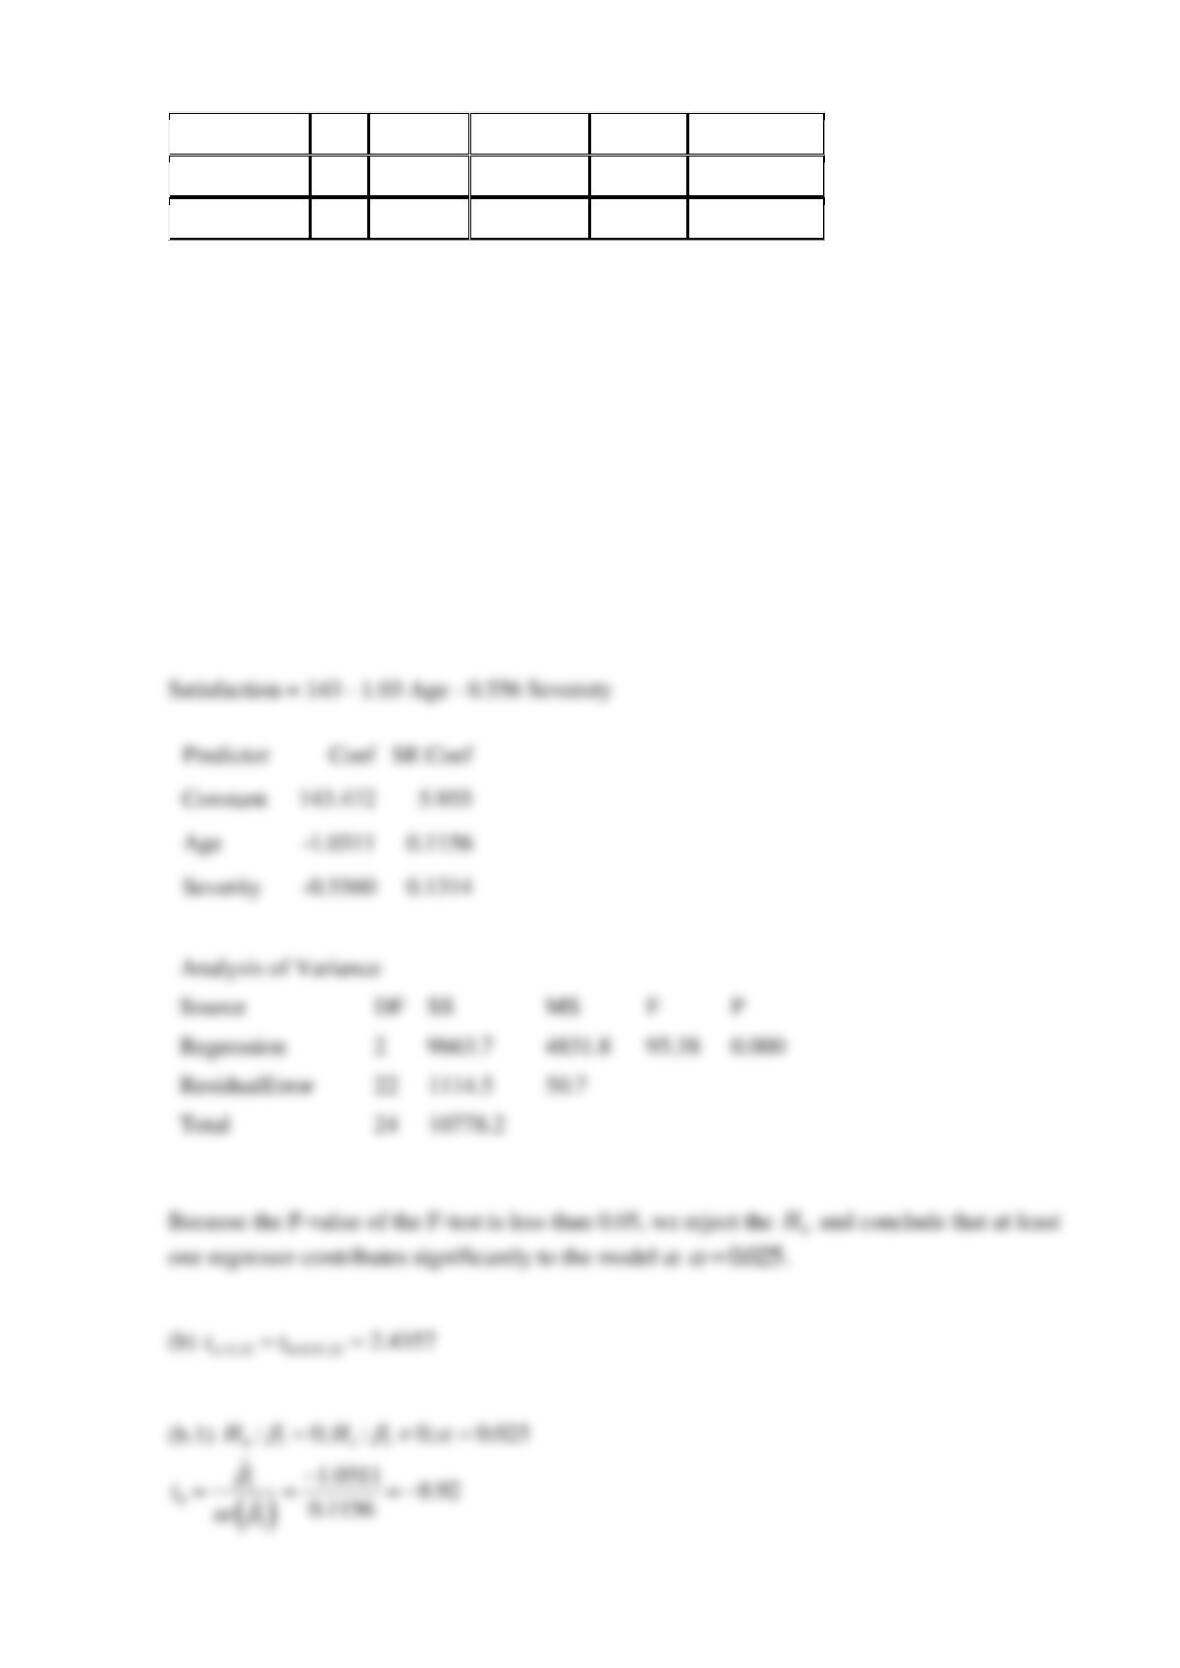
(a) Fit a regression model using only the patient age (x1) and severity (x2) regressors. Test the
model from this exercise for significance of regression. Use
0.025
=
.
(b) Test the contribution of the individual regressors using the t-test. Does it seem that all
regressors used in the model are really necessary?
1. For
1
:
2. For
2
:
SOLUTION
(a) The regression equation is

(b.2)
0 2 1 2
: 0; : 0; 0.025HH
= =
Reserve Problems Chapter 12 Section 4 Problem 1
The data about personal life satisfaction (y) levels in different country regions are represented in
the table below. The regressor variables are satisfaction with family life (x1), satisfaction with
health (x2) and the rating of how worthwhile (x3) the things people do are.
Life satisfaction
Family satisfaction
Health satisfaction
Worthwhile
45.3
86.6
59.5
34.3
43.5
86.8
60.5
32.9
46.0
87.2
59.2
35.9
45.2
86.6
58.8
35.9
43.0
86.2
59.7
33.8
40.5
87.9
57.1
32.2
44.5
87.2
60.3
34.1
39.8
82.2
60
31.8
46.8
88
60.5
35.4
45.1
88.4
59.5
35.6
42.0
86
56.8
33.8
43.0
88.4
56.4
33.1
55.9
86.5
64.5
45
(a) Find 95% confidence intervals for
1
,
2
,
3
.
(b) Find a 95% confidence interval for the mean of the life satisfaction when the rates of the
corresponding regressor variables are
185x=
,
260x=
,
335x=
.
(c) Find a 95% prediction interval for the life satisfaction when
185x=
,
260x=
,
335x=
.
SOLUTION
The regression equation is
(a) 95% CI for coefficients
1
0.127 0.820
(b)
( )
01.0,85.0,60.0,35.0
T
x=
Reserve Problems Chapter 12 Section 4 Problem 2
Consider the data of a restaurant quality survey represented in the table below. The regressor
variables are the quality of quality of cooking and the quality of service the total restaurant
rating (y) is based on these variables, but also on personal opinion of the customers.
Total rating
Cooking
Service
7.6
8.0
8.9
5.1
8.0
4.0
6.9
5.5
8.0
8.2
8.9
9.2
9.0
9.5
9.8
5.2
6.2
4.0
5.6
7.9
3.0
4.0
3.2
4.0
8.7
9.7
9.9
7.0
7.5
5.9
6.7
5.6
6.5
6.8
6.8
8.0
7.8
8.5
7.6
6.4
6.3
7.0
7.6
9.3
8.2
a) Find 95% confidence intervals for
1
,
2
.
b) Find a 95% confidence interval for the mean of the total restaurant rating when the rates of the
corresponding regressor variables are
19.0x=
,
28.5x=
.
c) Find a 95% prediction interval for the total restaurant rating
19.0x=
,
28.5x=
.
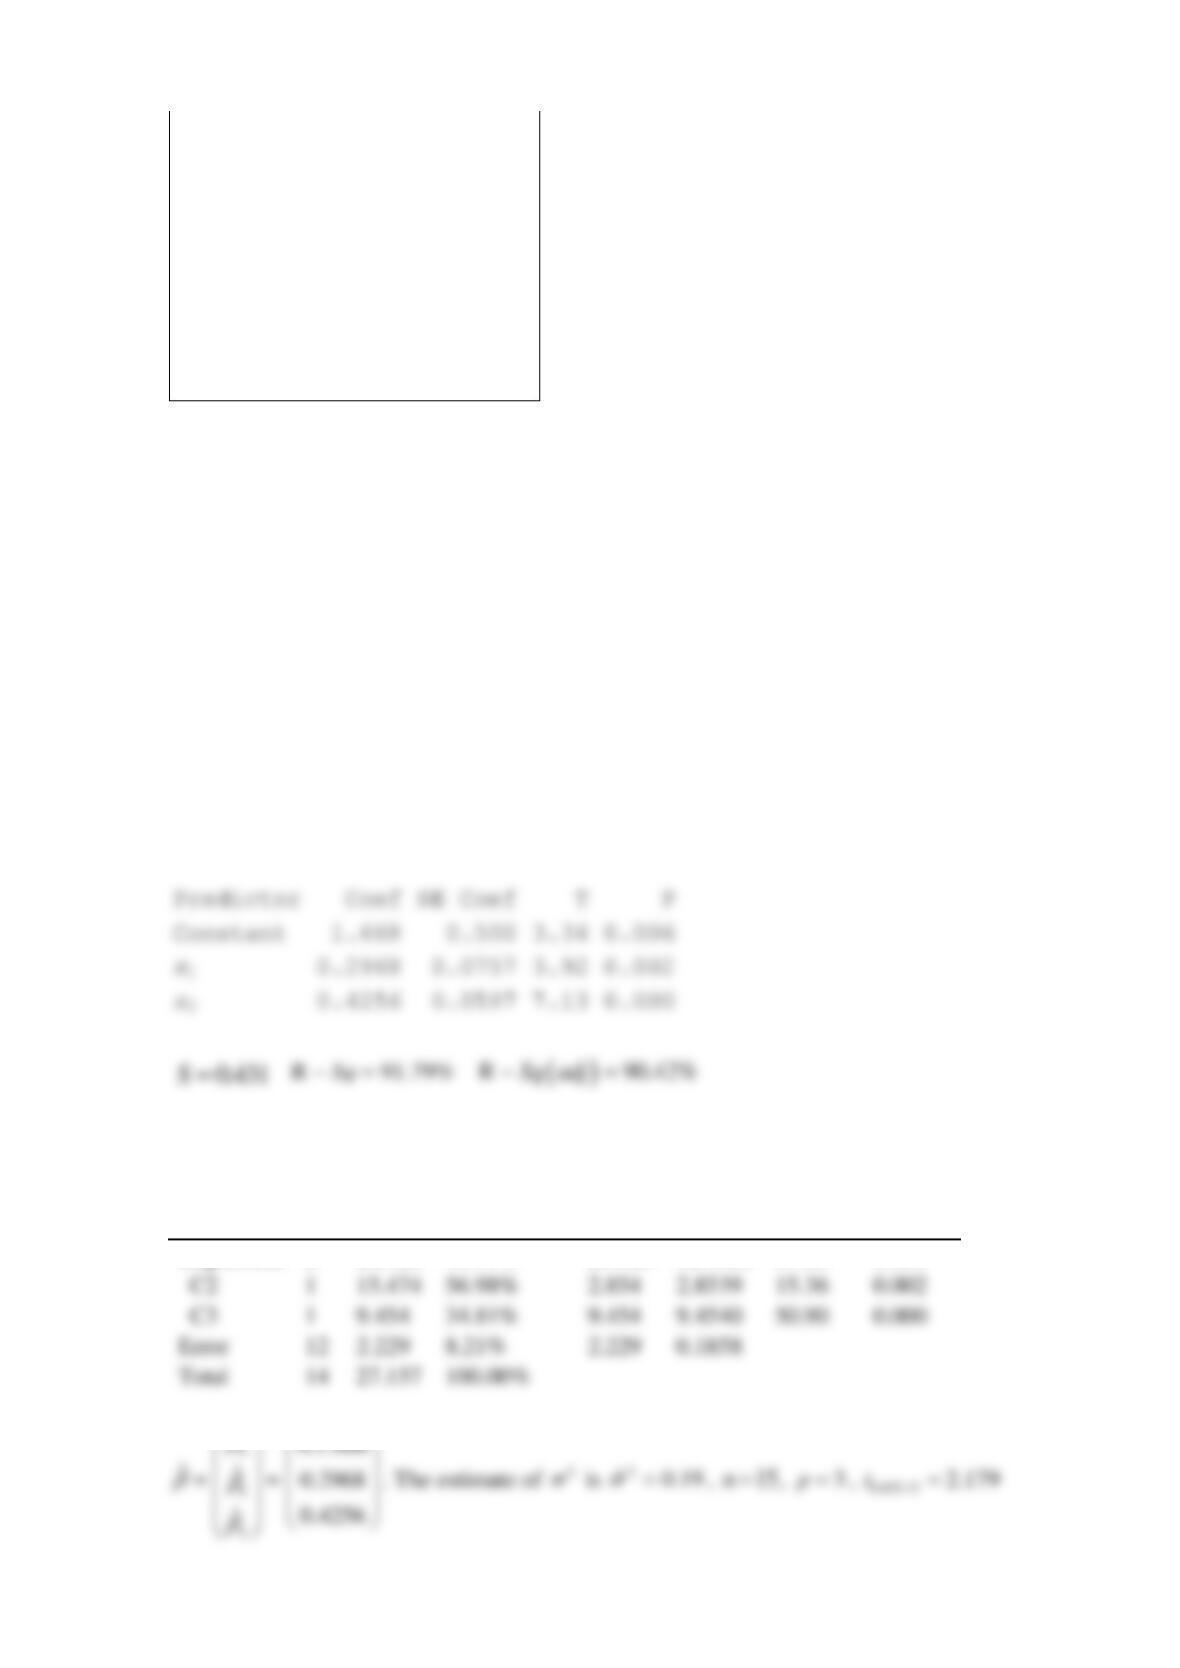
SOLUTION
The regression equation is
12
1.668 0.296
ˆ8 0.4256y x x= + +
Analysis of Variance
Analysis of Variance
Source
DF
Seq SS
Contribution
Adj SS
Adj MS
F-Value
P-Value
Regression
2
24.928
91.79%
24.928
12.4641
67.10
0.000
C2
1
15.474
56.98%
2.854
2.8539
15.36
0.002
C3
1
9.454
34.81%
9.454
9.4540
50.90
0.000
Error
12
2.229
8.21%
2.229
0.1858
ˆ

a) 95% CI for coefficients
b)
( )
01.0,9.0,8.5x=
c)
( )
21
00
(1 ) 0.4630
ˆx X X x
−
+=
Reserve Problems Chapter 12 Section 4 Problem 3
The Social Progress Index measures the well-being of a society by observing social and
environmental outcomes. The index combines many indicators, among them basic human needs
(BHN, x1 ) and foundations of well-being (FW, x2). Michael E Porter and Scott Stern with
Michael Green (“Social Progress Index”, 2015) studied the effects of these indicators on the SPI
for different countries. The following table represents the obtained data.
Country
Social Progress Index
Basic Human Needs
Foundations of Well-being
Norway
88.36
Sweden
88.06
Switzerland
87.97
Iceland
87.62
New Zealand
87.08
Canada
86.89
Finland
86.75
Denmark
86.63
Netherlands
86.5
Australia
86.42
United Kingdom
84.68
Ireland
84.66
Austria
84.45
Germany
84.04
Japan
83.15
United States
82.85
Belgium
82.83
Portugal
81.91
Slovenia
81.62
92.88
80.87
Spain
81.17
91.09
76.79
a) Calculate 99% confidence intervals for each regression coefficient
1
,
2
.
b) Calculate a 99% confidence interval for the mean of the SPI when the values of the
corresponding regressor variables are
178.42x=
,
261.14x=
(values for Iran).
c) Calculate a 99% prediction interval for the SPI for Cuba. Does the actual value of the SPI for
Iran (56.82) lies within this prediction interval?
SOLUTION
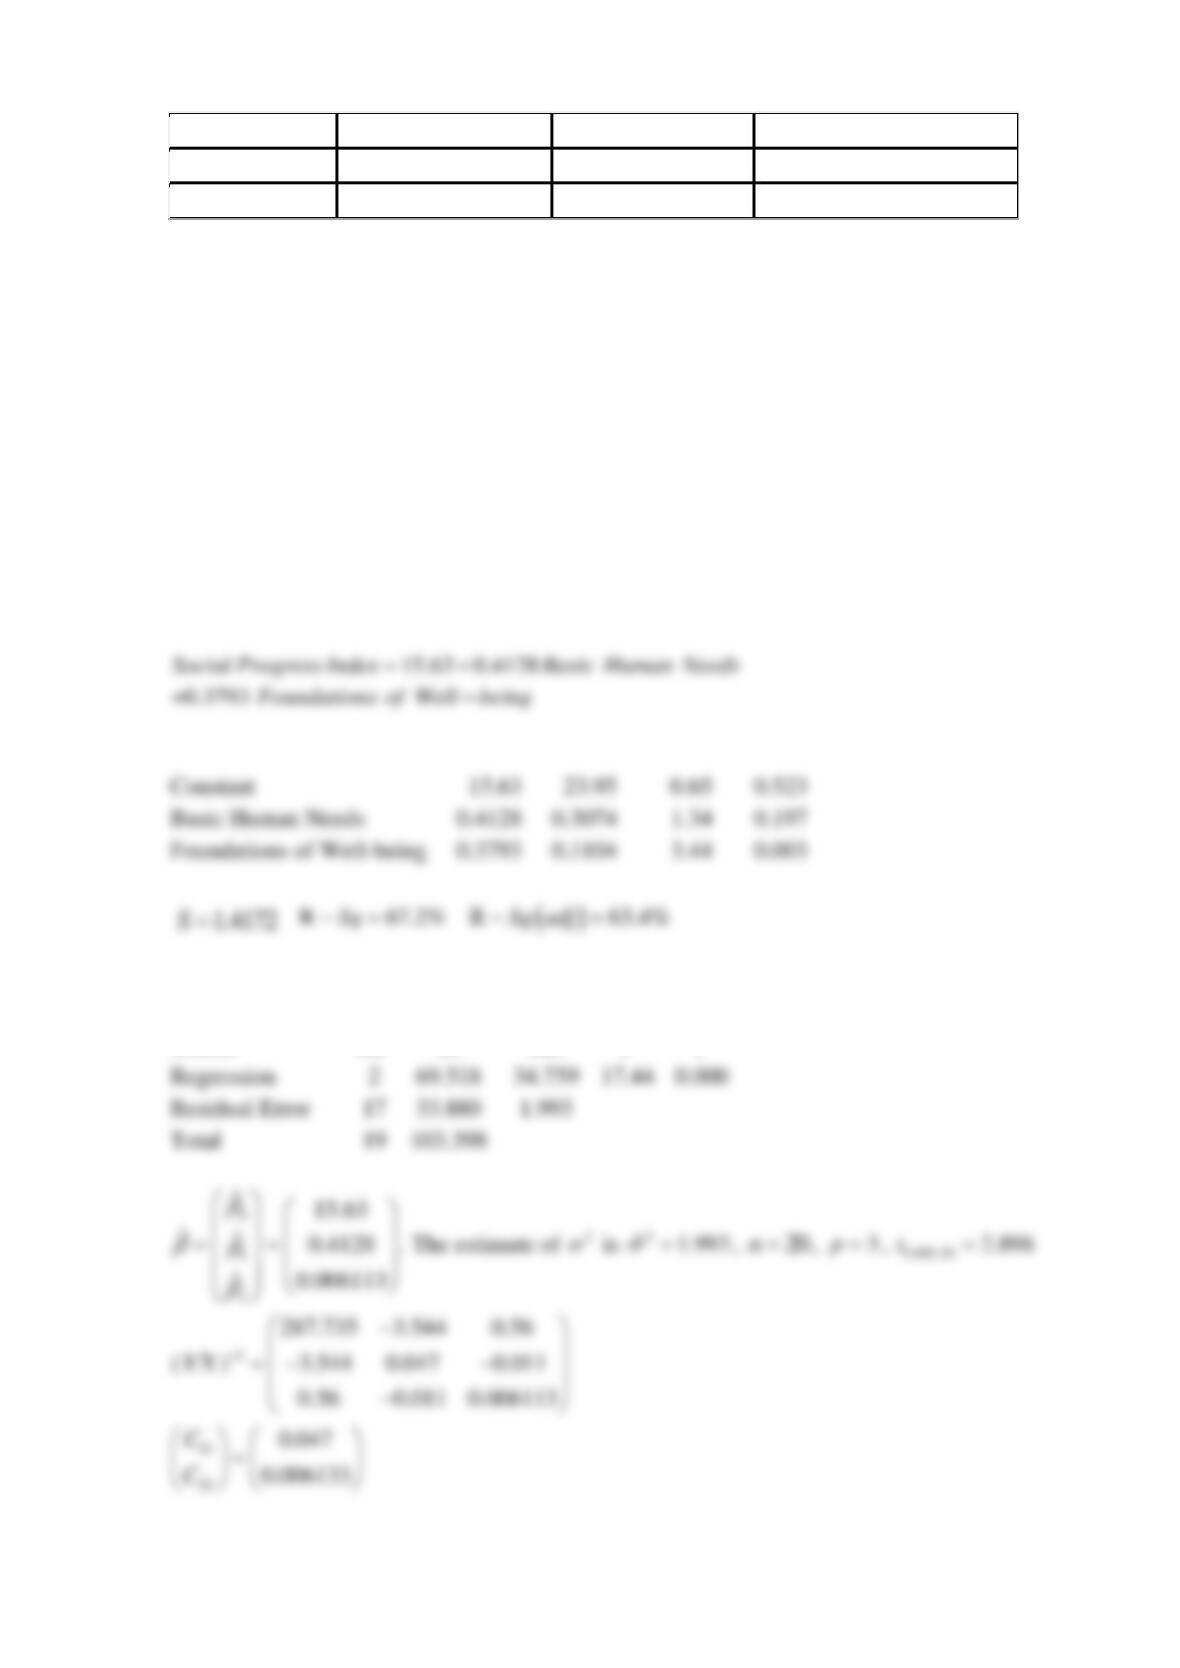
The regression equation is
Analysis of Variance
Source
DF
SS
MS
F
P
Regression
Residual Error
Total
Constant
Basic Human Needs
Foundations of Well-being

a) 99% CI for coefficients
b)
( )
T
x=
0
Y|
x
Reserve Problems Chapter 12 Section 4 Problem 4
One of the dimensions of Social Progress is Opportunity. According to Michael E Porter and
Scott Stern with Michael Green (“Social Progress Index”, 2015), it comprises a number of
specific outcome indicators, among them Personal Rights (x1), Personal Freedom and Choice
(x2), and Access to Advanced Education (x3). The table below represents the values of
Opportunity and its indicators for different countries.
Country
Opportunity
Personal
Rights
Personal
Freedom
and
Choice
Access to
Advanced
Education
Canada
86.58
87.91
88.41
85.11
New
Zealand
85.61
98.84
88.82
71.79
Australia
85.55
97.68
88.42
77.7
Ireland
83.97
86.75
85.97
77.41
Sweden
82.93
87.91
88.98
74.38
United
Kingdom
82.78
97.68
85.83
77.91
Finland
82.63
87.91
91.54
70.38
Unites
States
82.18
82.16
82.64
89.47
Luxembourg
81.95
97.68
88.89
58.01
Norway
81.82
87.91
91.38
68.69
Switzerland
81.75
87.91
91.1
70.67
Iceland
81.73
87.91
86.06
63.43
Denmark
81.23
89.07
89.87
66.63
Netherlands
80.88
87.91
89
72.14
Belgium
78.19
85.59
82.16
68.45
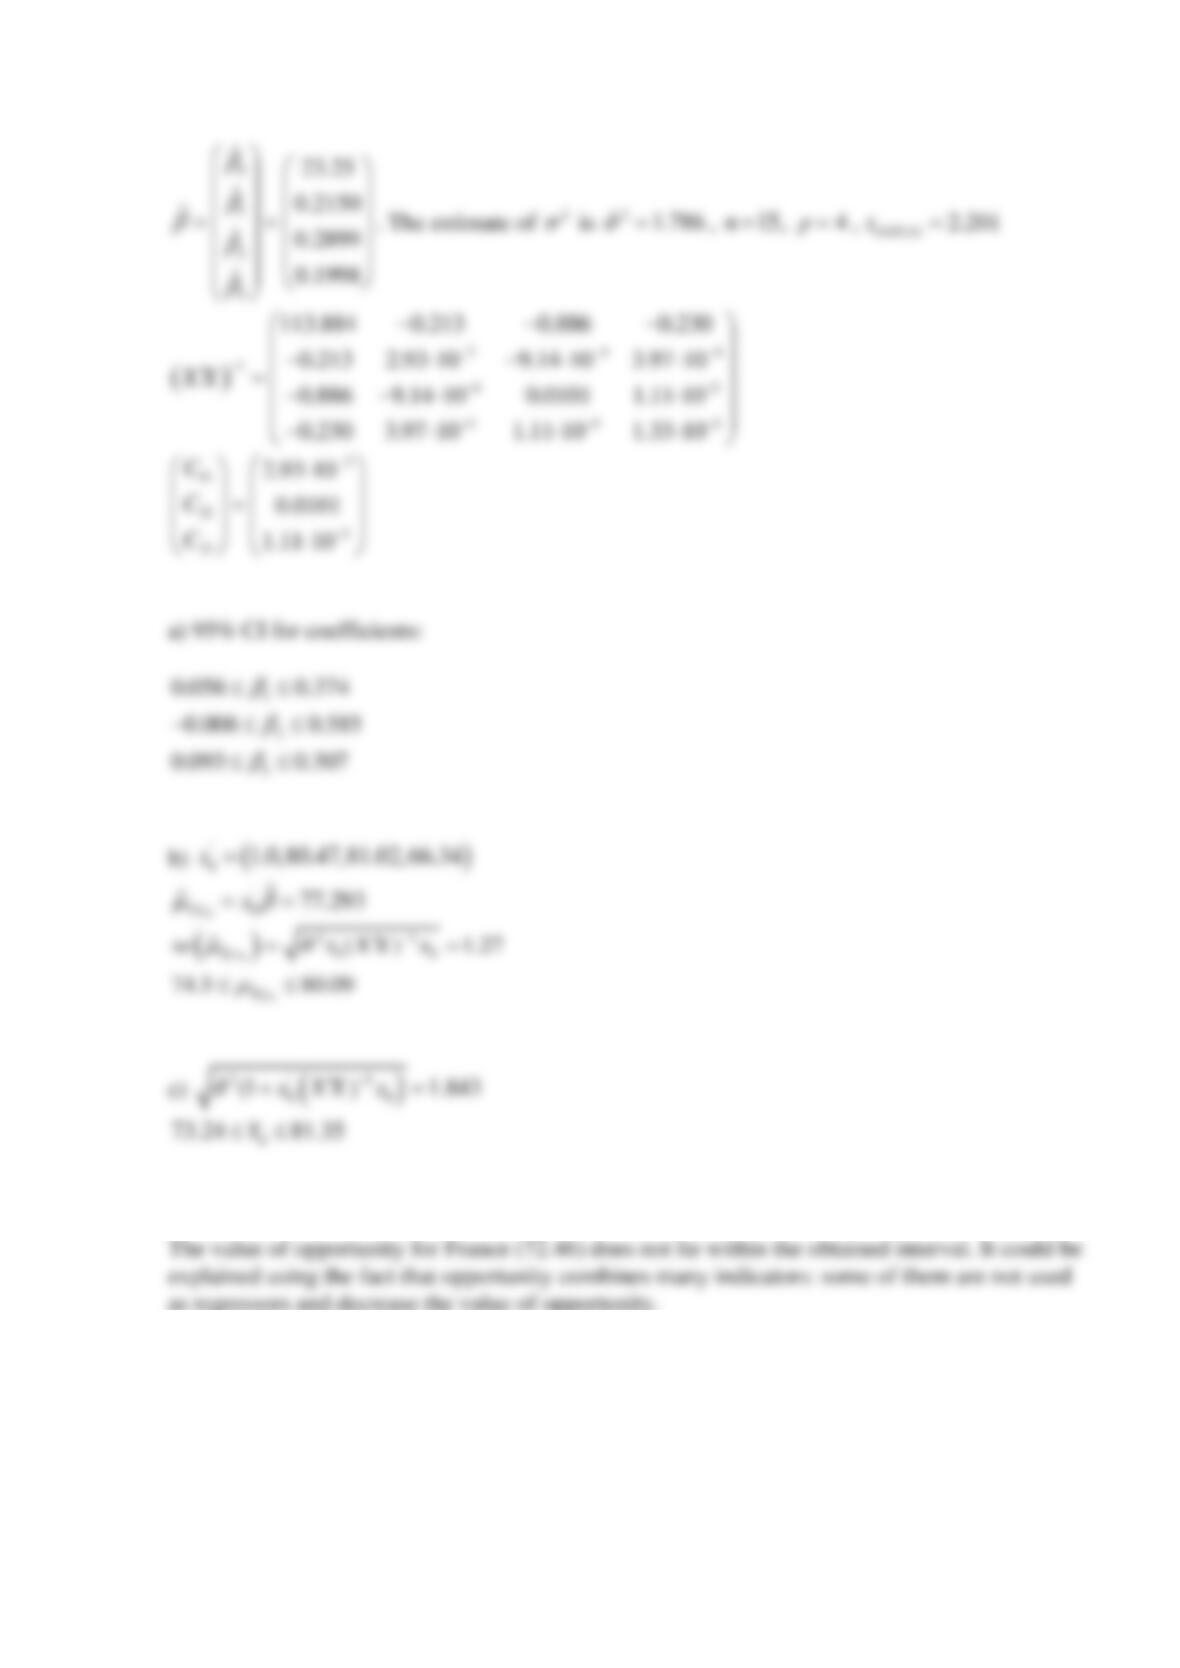
a) Calculate 95% confidence intervals for
1
,
2
,
3
.
b) Calculate a 95% confidence interval for the mean of the opportunity when the values of the
corresponding regressor variables are
180.47x=
,
281.02x=
,
366.34x=
(values for France).
c) Calculate a 95% prediction interval for the opportunity for the same values of regressors used
in part (b). Does the value of the Opportunity for France that is equal to 72.46 lies within this
prediction interval?
SOLUTION
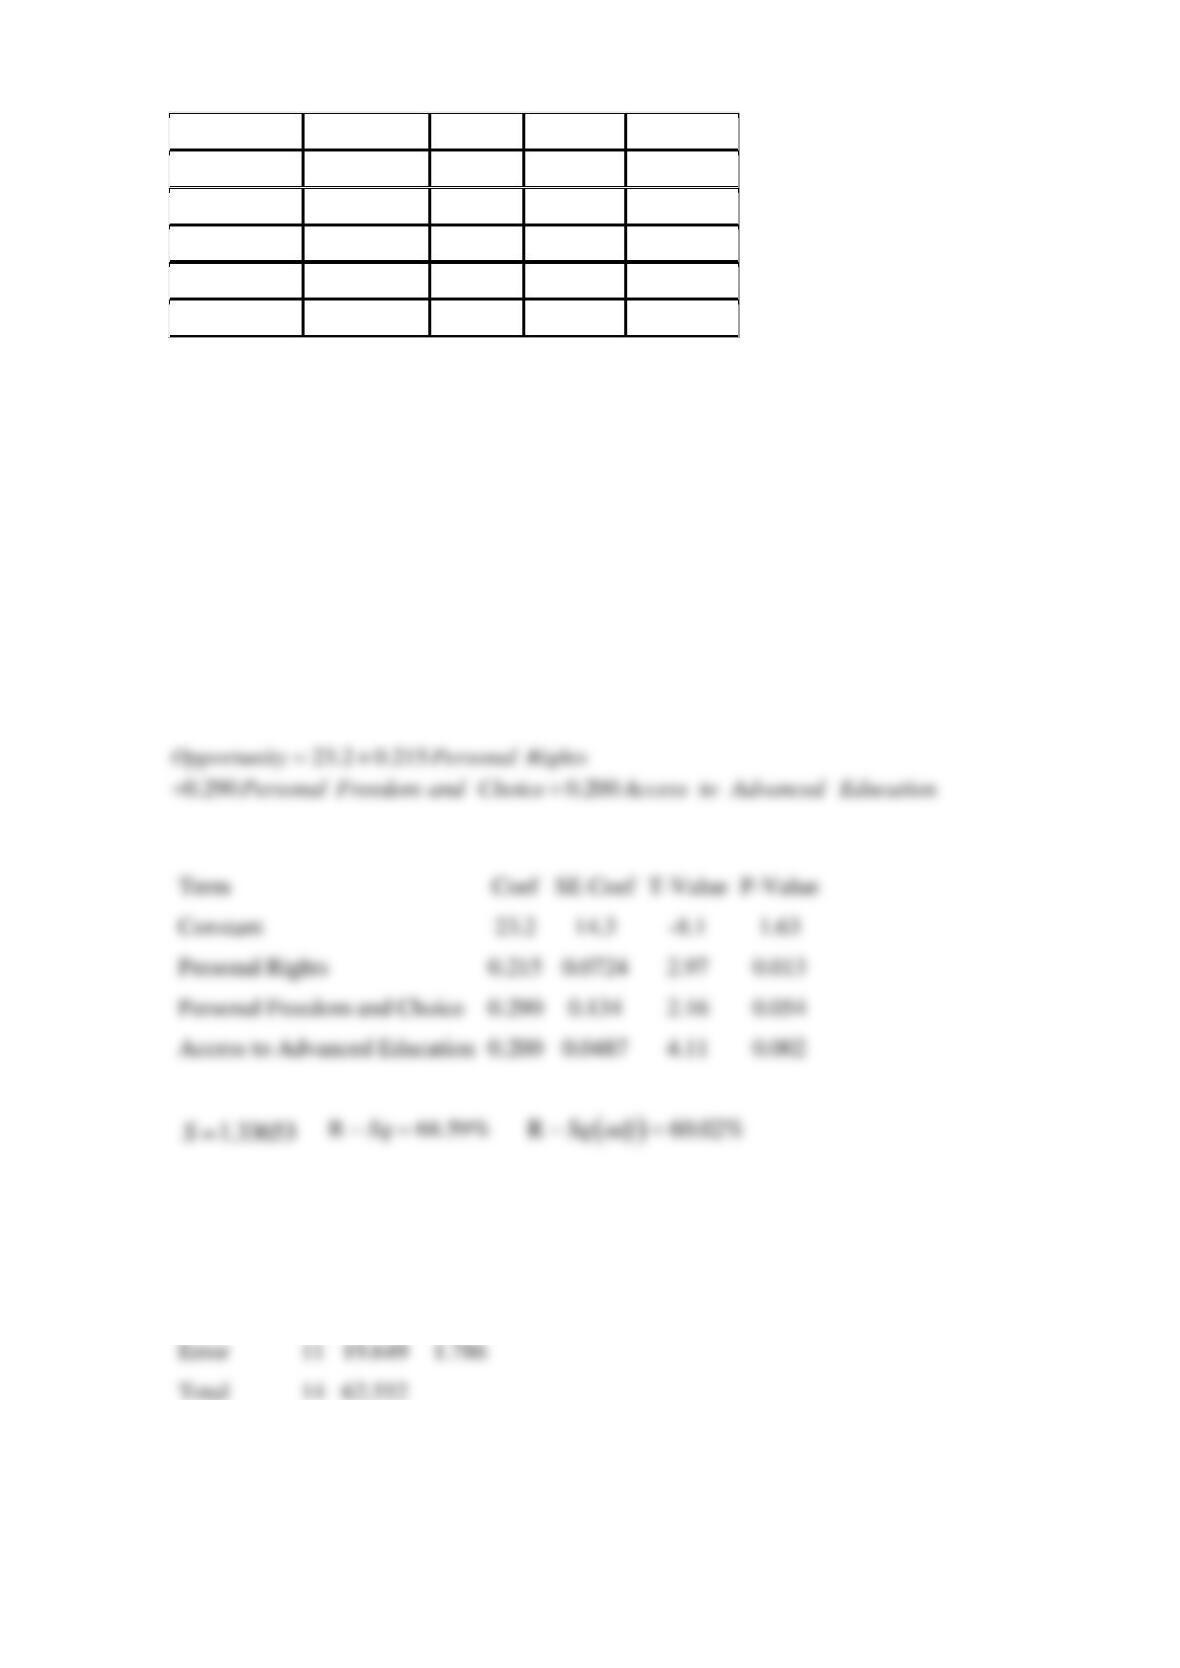
The regression equation is
Analysis of Variance
Source
DF
Seq SS
Adj MS
F-Value
P-Value
Regression
3
42.902
14.301
8.01
0.004
Error
19.649
Total
62.552
Term
SE Coef
T-Value
P-Value
Constant
14.3
1.63
Personal Rights
0.215
2.97
0.013
Personal Freedom and Choice
0.290
0.134
2.16
0.054
Access to Advanced Education
0.200
4.11
0.002
Reserve Problems Chapter 12 Section 4 Problem 5
A class of 63 students has two hourly exams and a final exam.
The regression model was constructed to predict the poerfomance on the final exam based on the
results of the two hour exams (
1
x
and
2
x
). The following are some quantities of interest:
1
0.9129168 0.00981502 0.00071118
( ) 0.00981502 1.497241 04 4.15806 05
0.00071118 4.158056 05 5.81235 05
X X e e
ee
−
−−
= − − − −
− − −
−
( )
4871.0
426011.0
367576.5
Xy
=
Assume
63
2
1
411,222.7041
i
i
y y y
=
==
.
(a) Find a 95% confidence interval for the coefficient of hourly 1 test.
(b) Find a 95% confidence interval for the mean final grade for students who score 80 on the first
test and 85 on the second.
(c) Find a 95% prediction interval for a student with the same grades as in part (b).
SOLUTION
(a)
=
, for
0.05
=
(b)
01,80,85x=
,
1
00
( ) 0.034288x X X x
−
=
Reserve Problems Chapter 12 Section 4 Problem 6

Suppose that the percentage of the workforce who are engineers in each U.S. state is predicted
by the amount of money spent on higher education (as a percent of gross domestic product), on
venture capital (dollars per $1000 of gross domestic product) for high-tech business ideas, and
state funding (in dollars per student) for major research universities? Data for all 50 states and a
software package revealed the following results:
Estimate
Std. Error
t value
Pr (>|t|)
(Intercept)
1.051e+00
1.567e-01
6.708
2.5e-08***
Venture cap
9.514e-02
3.910e-02
2.433
0.0189*
State funding
4.106e-06
1.437e-05
0.286
0.7763
Higher.eD
-1.673e-01
0.505e-
-0.645
0.5223
Residual standard error: 0.3007 on 46 degrees of freedom
Multiple R-squared: 0.1622, Adjusted R-squared: 0.1075
F-statistic: 2.968 on 3 and 46 DF, p-value: 0.04157
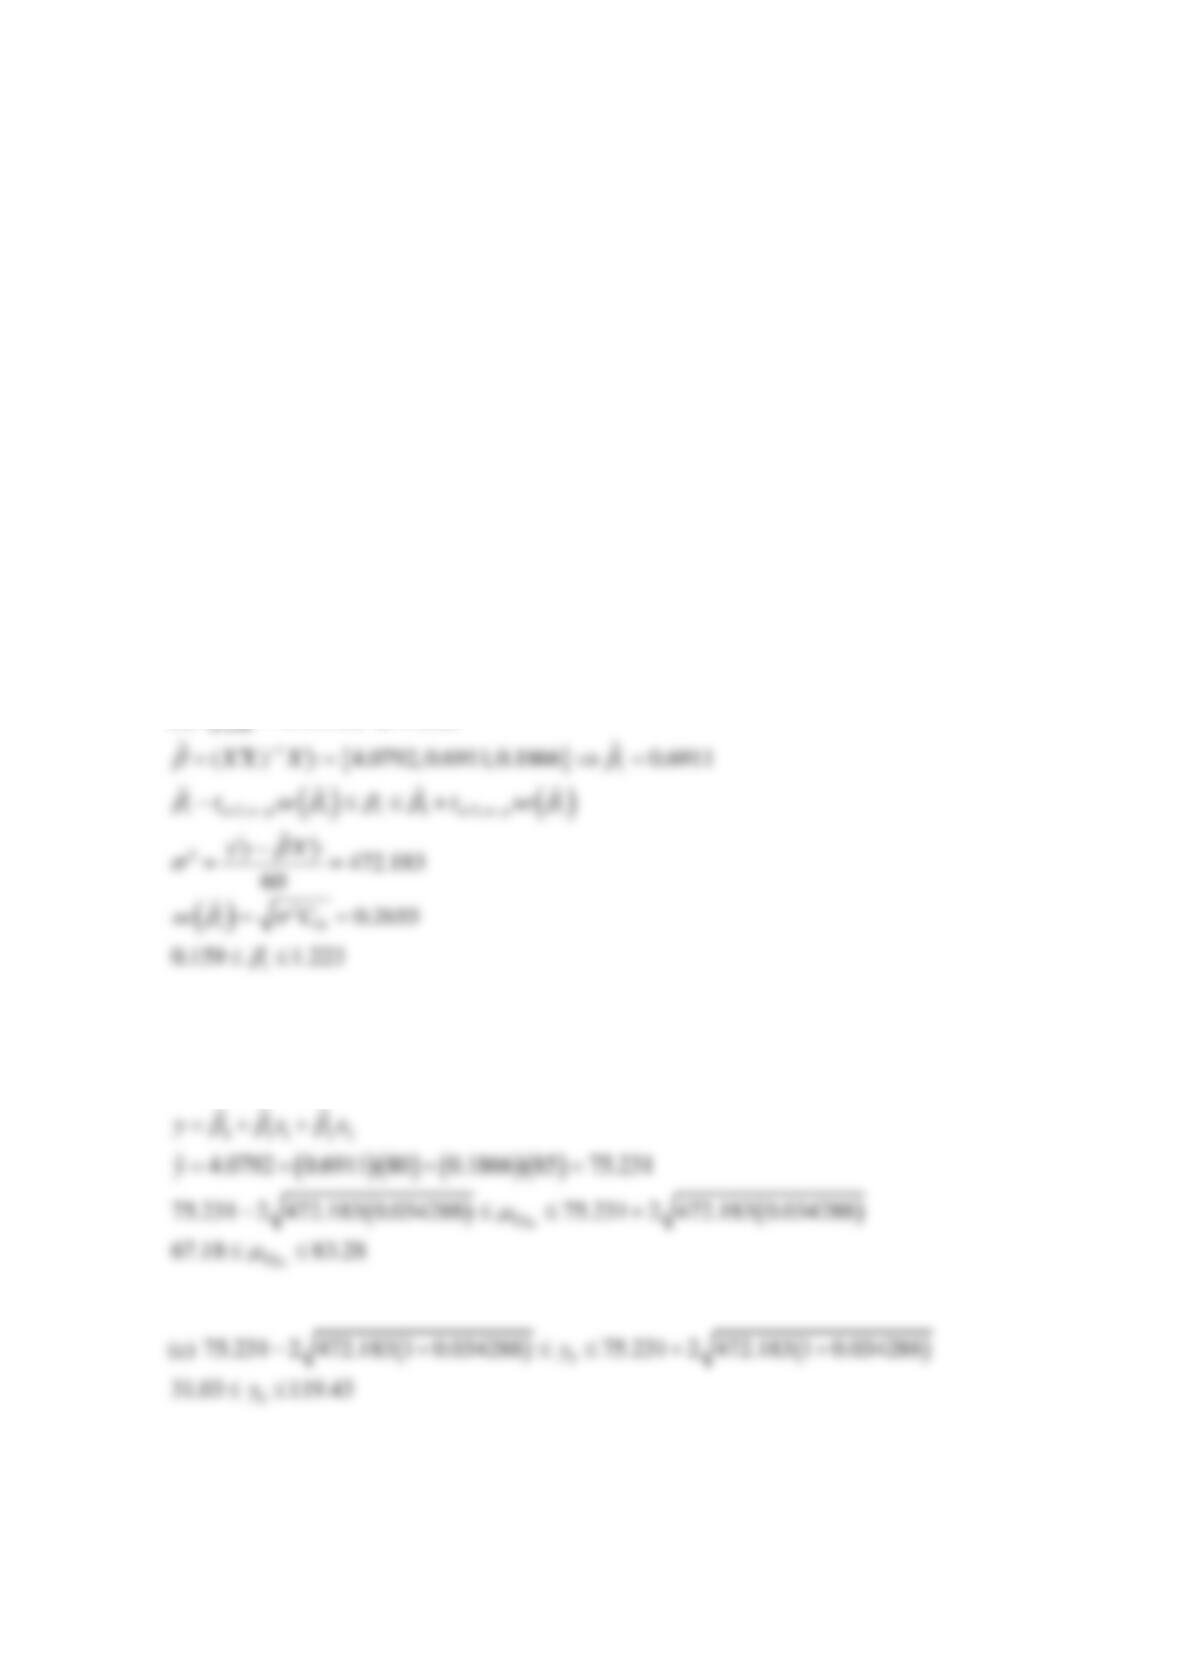
(a) Find a 95% confidence interval for the coefficient of spending on higher education.
(b) Is zero in the confidence interval you found in part (a)?
SOLUTION
(a)
/2,46 2.013t
=
, for
0.05
=
Reserve Problems Chapter 12 Section 4 Problem 7
A study was performed to investigate the shear strength of soil (y) as it related to depth in feet
1
( )x
and percent of moisture content
2
( )x
. Ten observations were collected, and the following
summary quantities obtained:
10n=
,
1223
i
x=
,
2553
i
x=
,
1,916
i
y=
,
2
15,200.9
i
x=
,
2
231,729
i
x
=
,
12 12,352
ii
xx=
,
143,550.8
ii
xy=
,
2104,736.8
ii
xy=
, and
2371,541.6.
i
y
=
(a) Calculate 95% confidence intervals on each regression coefficient.
(b) Calculate a 95% confidence interval on mean strength when
118 ftx=
and
243%x=
.
(c) Calculate 95% prediction interval on strength for the same values of the regressors used in
the previous part.
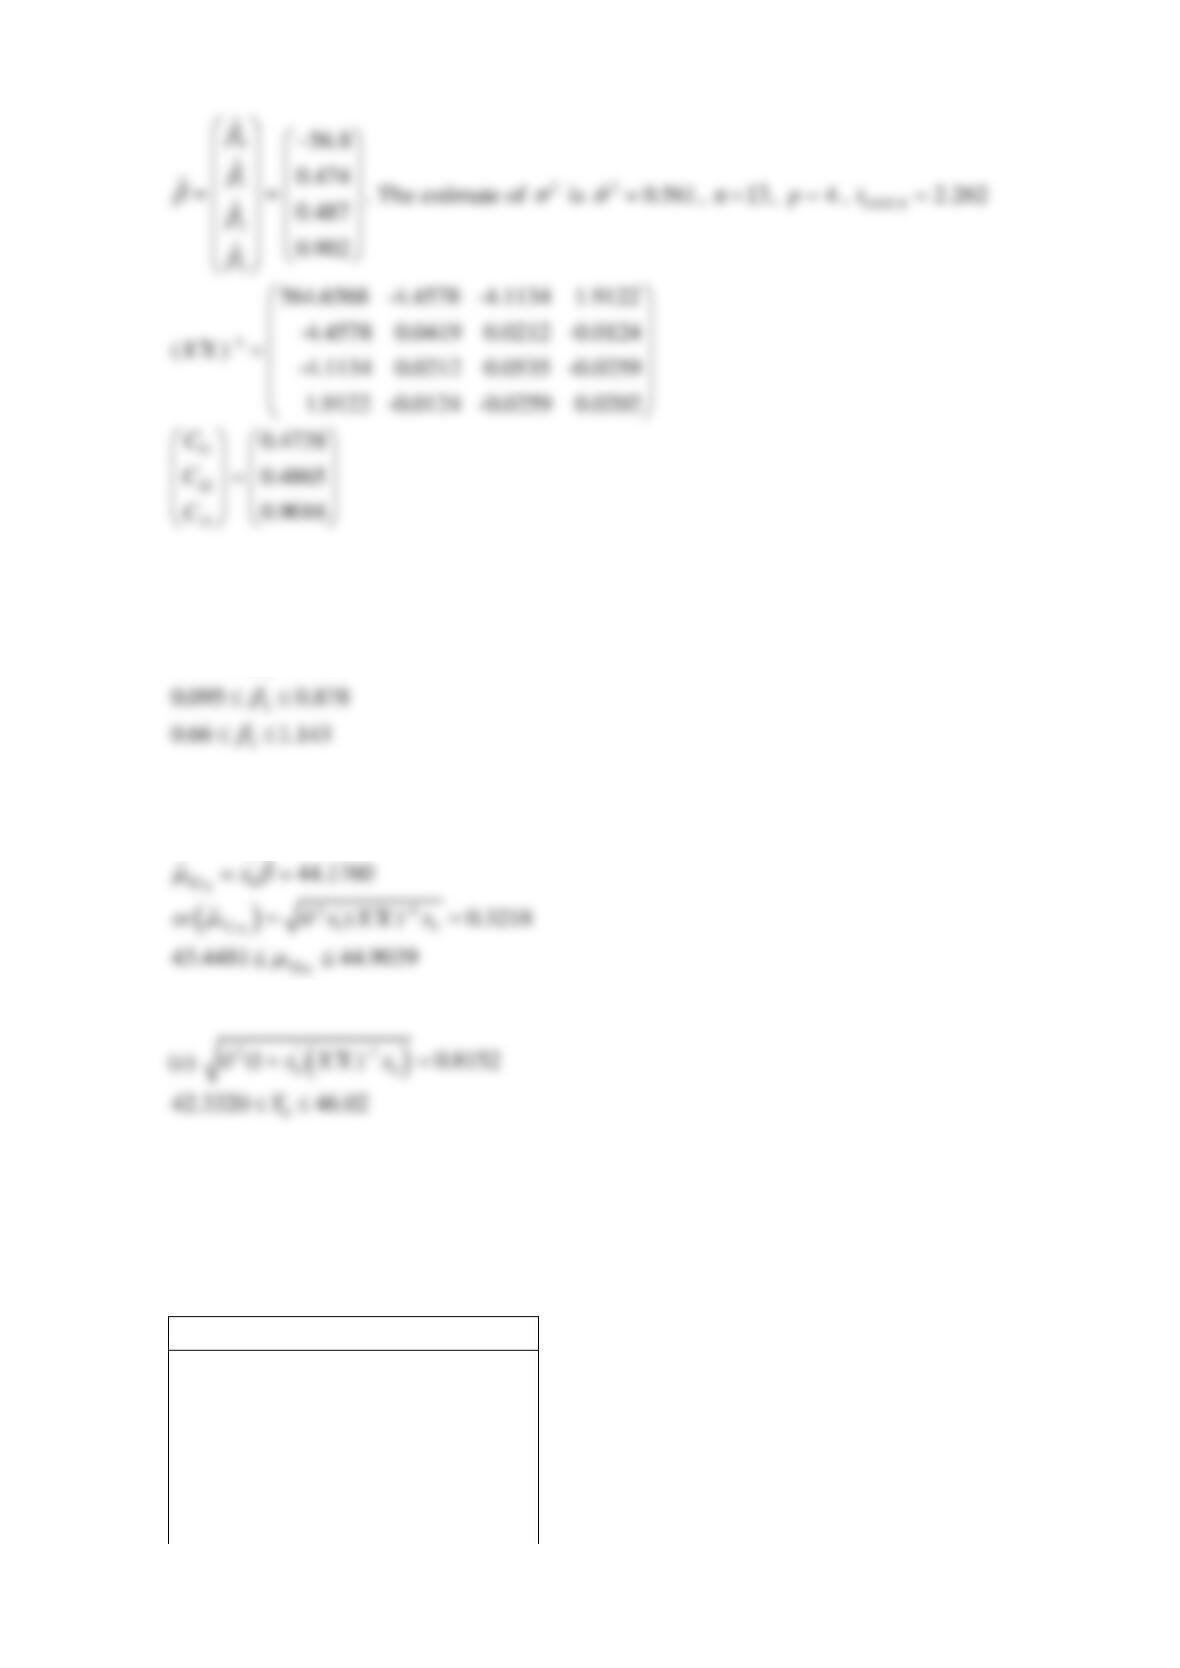
SOLUTION
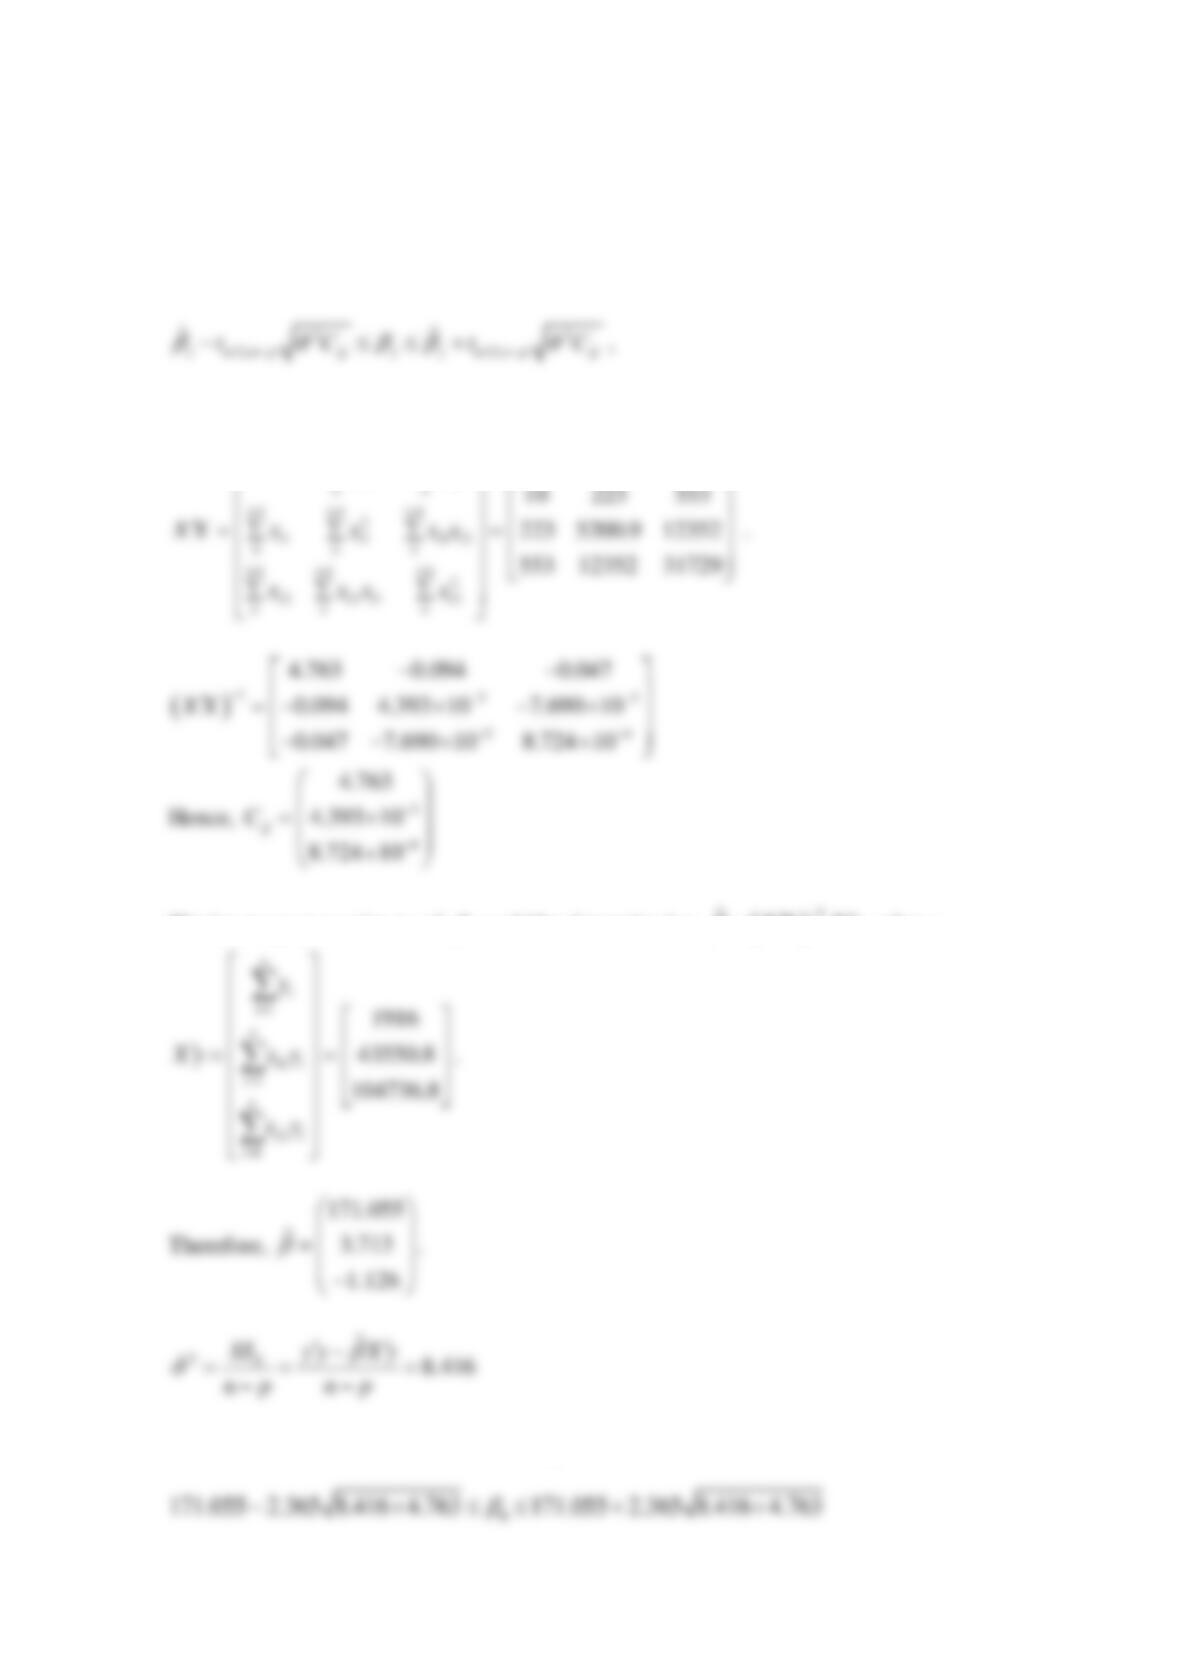
(a) A
( )
100 1 %
−
confidence interval on the regression coefficient
j
is
where
/2, 0.025,7 2.365
np
tt
−==
,
jj
C
is the jjth element of the
( )
1
XX −
matrix and
11
12
ii
ii
n x x
==
The least squares estimate of
could be determined as
( )
1
ˆX X X y
−
=
, where
So, 95% confidence intervals on each regression coeffient are
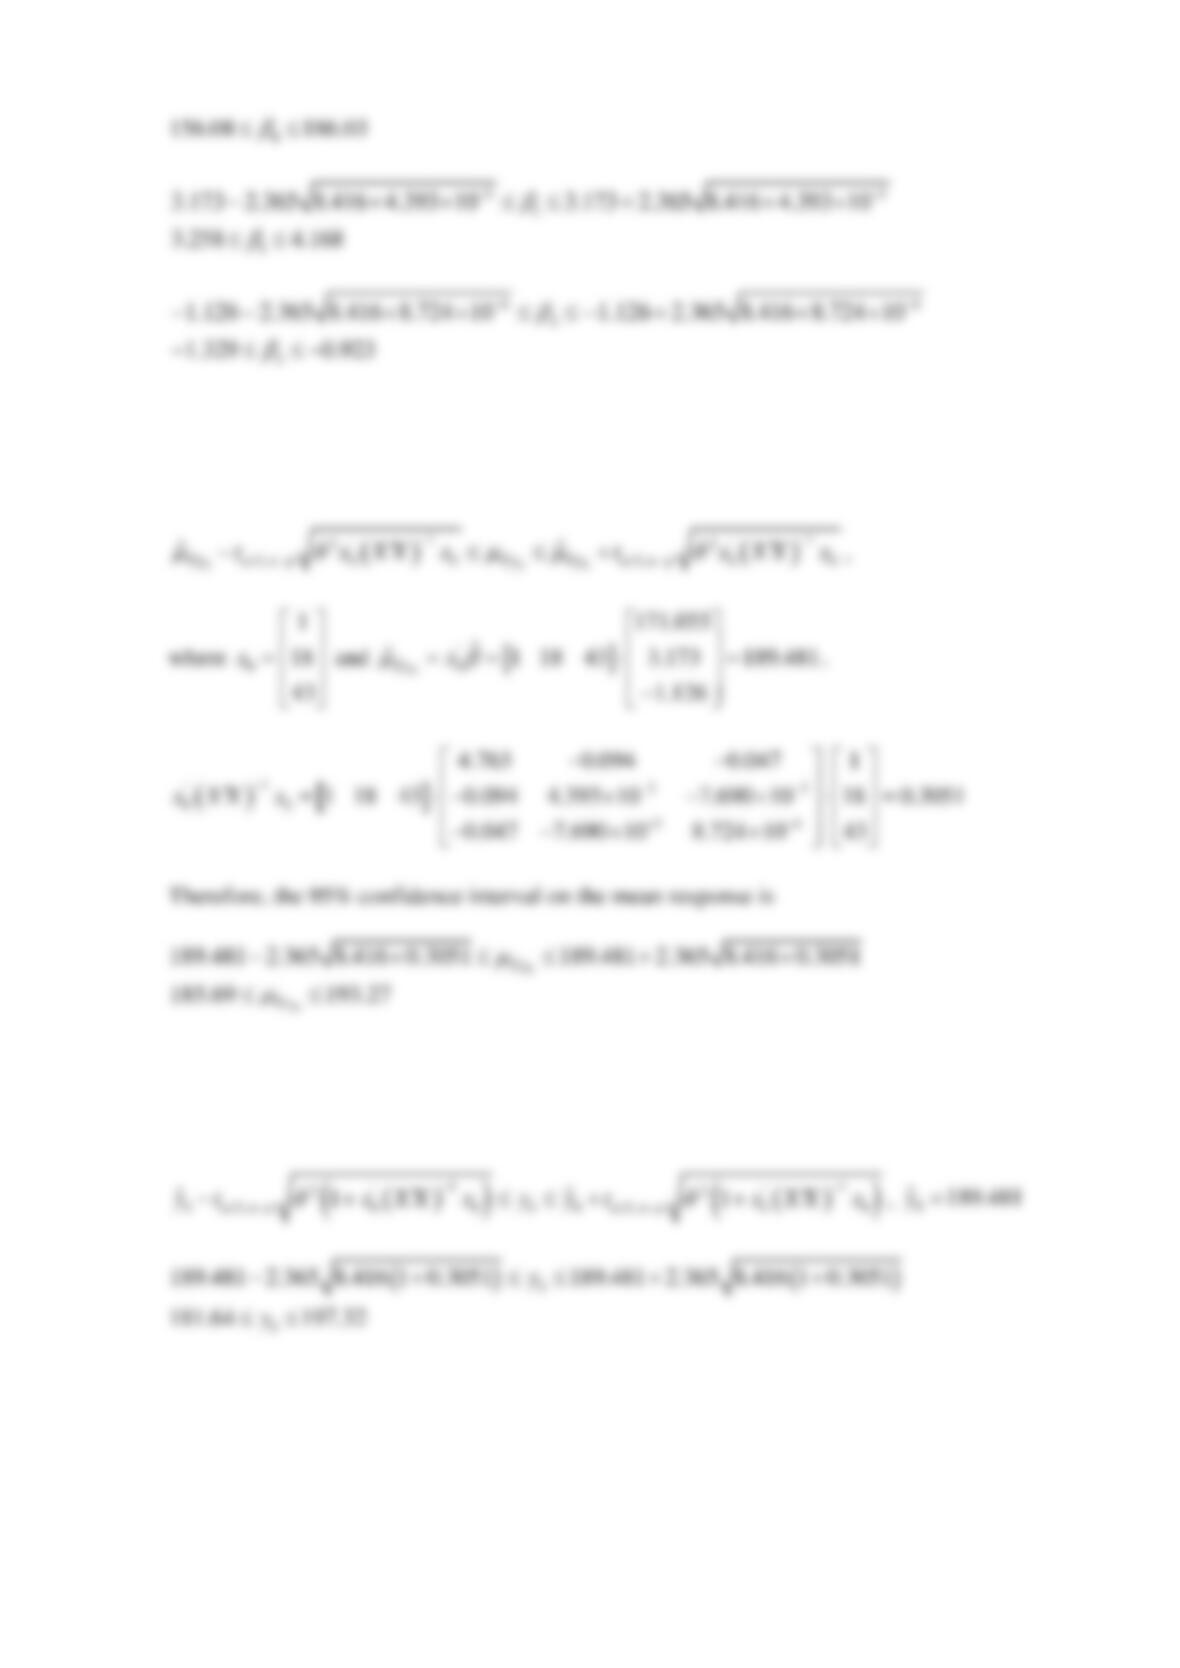
(b) A
( )
100 1 %
−
confidence interval on the mean response is
(c) A
( )
100 1 %
−
prediction interval on the future observation is
Reserve Problems Chapter 12 Section 4 Problem 8
An engineer at a semiconductor company wants to model the relationship between the device
HFE (y) and three parameters: Emitter-RS (
1
x
), Base-RS (
2
x
), and Emitter-to-Base RS (
3
x
).
The data are shown below.

1
x
Emitter-RS
2
x
Base-RS
3
x
E-B-RS
y
HFE-1M-5V
14.620
226.00
7.000
128.40
15.630
220.00
3.375
52.62
14.620
217.40
6.375
113.90
15.000
220.00
6.000
98.01
14.500
226.50
7.625
184.9
15.250
224.10
6.000
102.60
16.120
220.50
3.375
48.14
15.130
223.50
6.125
154.6
15.500
217.60
5.000
82.68
15.130
228.50
6.625
112.60
15.500
230.20
5.750
97.52
16.120
226.50
3.750
59.06
15.130
226.60
6.125
156.8
15.630
225.60
5.375
89.09
15.380
229.70
5.875
101.00
14.380
234.00
8.875
216.9
15.500
230.00
4.000
66.80
14.250
224.30
8.000
157.10
14.500
240.50
10.870
253.4
14.620
223.70
7.375
133.40
(a) Find 99% confidence intervals on the regression coefficients.
(b) Find a 99% prediction interval on HFE when
114.5x=
,
2220x=
, and
35.0x=
.
(c) Find a 99% confidence interval on mean HFE when
114.5x=
,
2220x=
, and
35.0x=
.
SOLUTION
Predictor
Coef
SE Coef
Constant
47.17
49.73
2
0.43
0.22
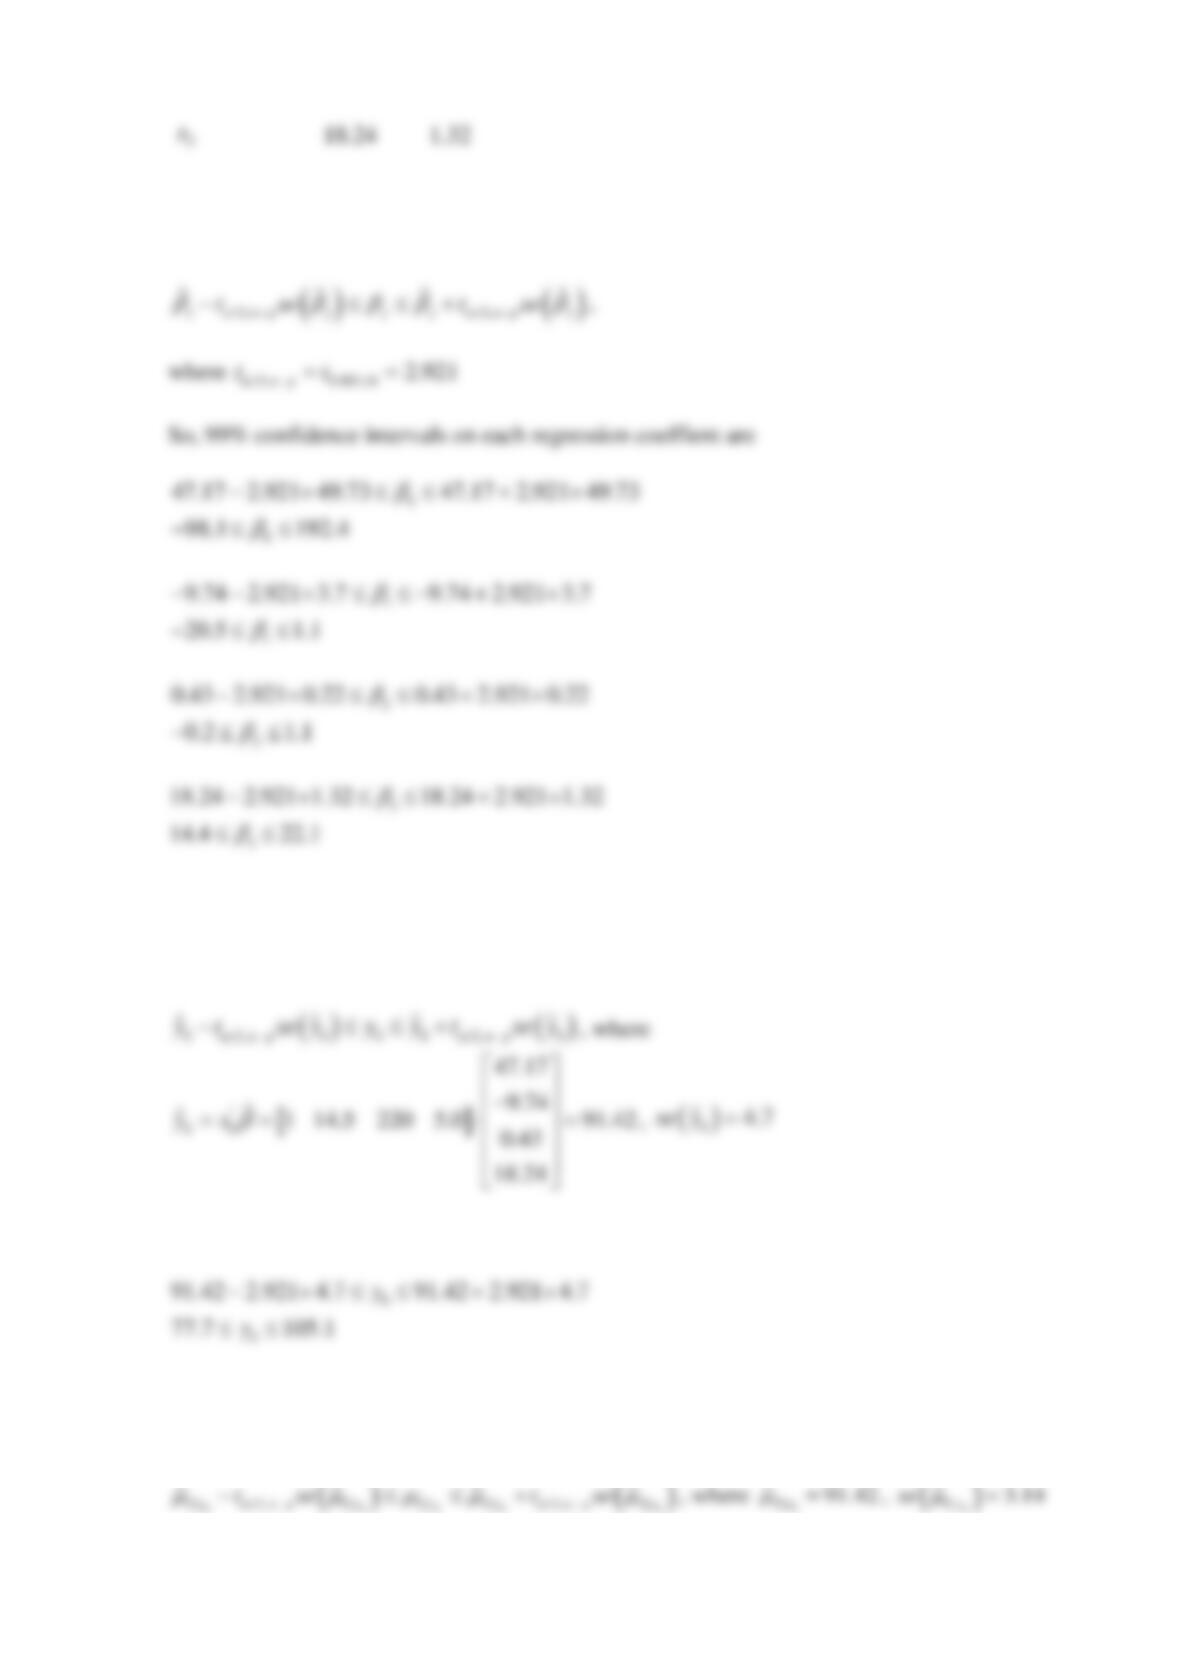
(a) A
( )
100 1 %
−
confidence interval on the regression coefficient
j
is
(b) A
( )
100 1 %
−
prediction interval on the future observation is
Therefore, a 99% prediction interval on HFE is
(c) A
( )
100 1 %
−
confidence interval on the mean response is

Therefore, a 99% confidence interval on mean HFE is
Reserve Problems Chapter 12 Section 4 Problem 9
A study was performed on wear of a bearing and its relationship to oil viscosity (
1
x
) and load (
2
x
). The following data were obtained.
y
1
x
2
x
298
1.6
851
232
15.5
816
175
22.0
1058
96
43.0
1201
113
33.0
1357
125
40.0
1115
(a) Find 99% confidence intervals on
1
and
2
.
(b) Recompute the confidence intervals in part (a) after the interaction term
12
xx
is added to the
model. Compare the lengths of these confidence intervals with those computed in part (a).
These part (b) intervals are ______.
Do the lengths of these intervals provide any information about the contribution of the
interaction term in the model?
____, the addition of this term ________ the standard error of the regression coefficient
estimators.
SOLUTION
Coefficients
Term
Coef
SE Coef
T-Value
P-Value
VIF
Constant
390.0
35.9
10.85
0.002
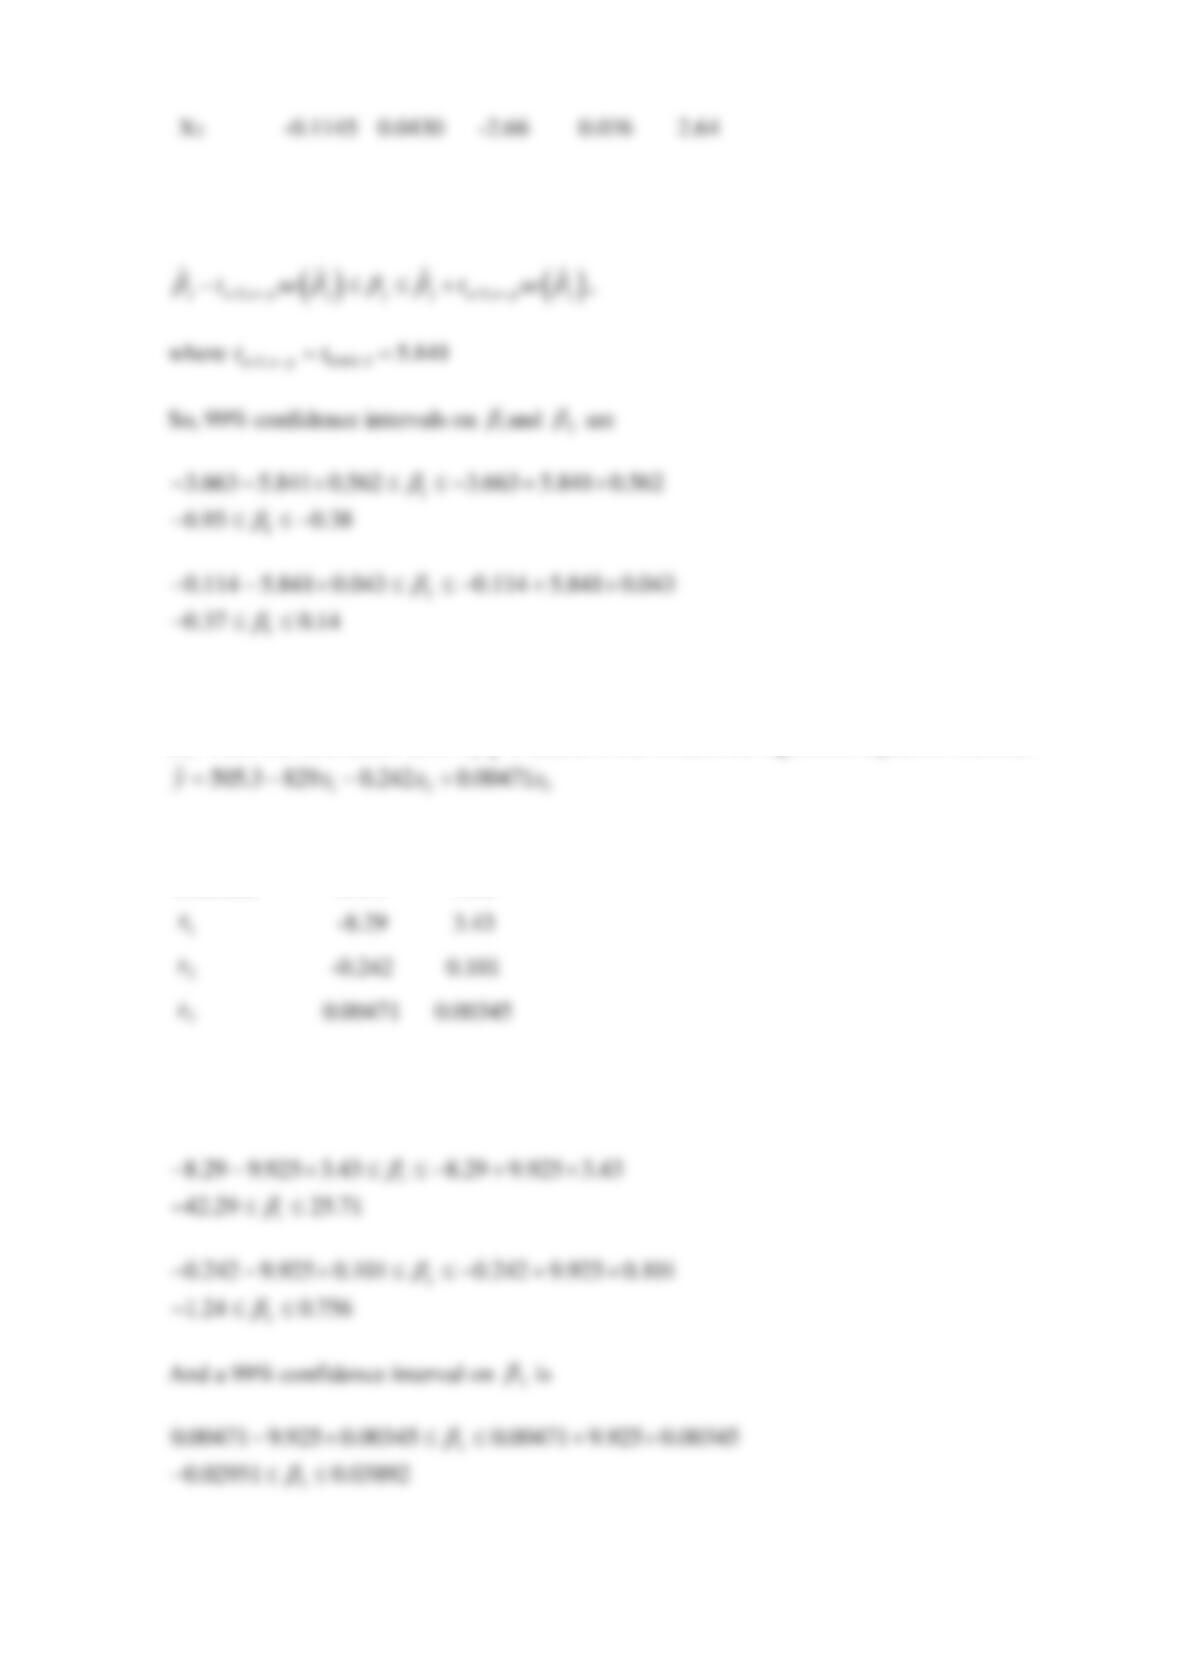
(a) A
( )
100 1 %
−
confidence interval on the regression coefficient
j
is
(b) When the interaction term
12
xx
is added to the model, the regression equation becomes
Predictor
Coef
SE Coef
Constant
505.3
90.2
So, 99% confidence intervals on
1
and
2
are

Reserve Problems Chapter 12 Section 4 Problem 10
An article in Technometrics (1974, Vol. 16, pp. 523–531) considered the following stack-loss
data from a plant oxidizing ammonia to nitric acid. Twenty-one daily responses of stack loss (the
amount of ammonia escaping) were measured with air flow
1
x
, temperature
2
x
, and acid
concentration
3
x
.
y
1
x
2
x
3
x
42
80
27
89
37
80
27
88
37
75
25
90
28
62
24
87
18
62
22
87
18
62
23
87
19
62
24
93
20
62
24
93
15
58
23
87
14
58
18
80
14
58
18
89
13
58
17
88
11
58
18
82
12
58
19
93
8
50
18
89
7
50
18
86
8
50
19
72
8
50
19
79
9
50
20
80
15
56
20
82
15
70
20
91
(a) Calculate 95% confidence intervals on each regression coefficient.