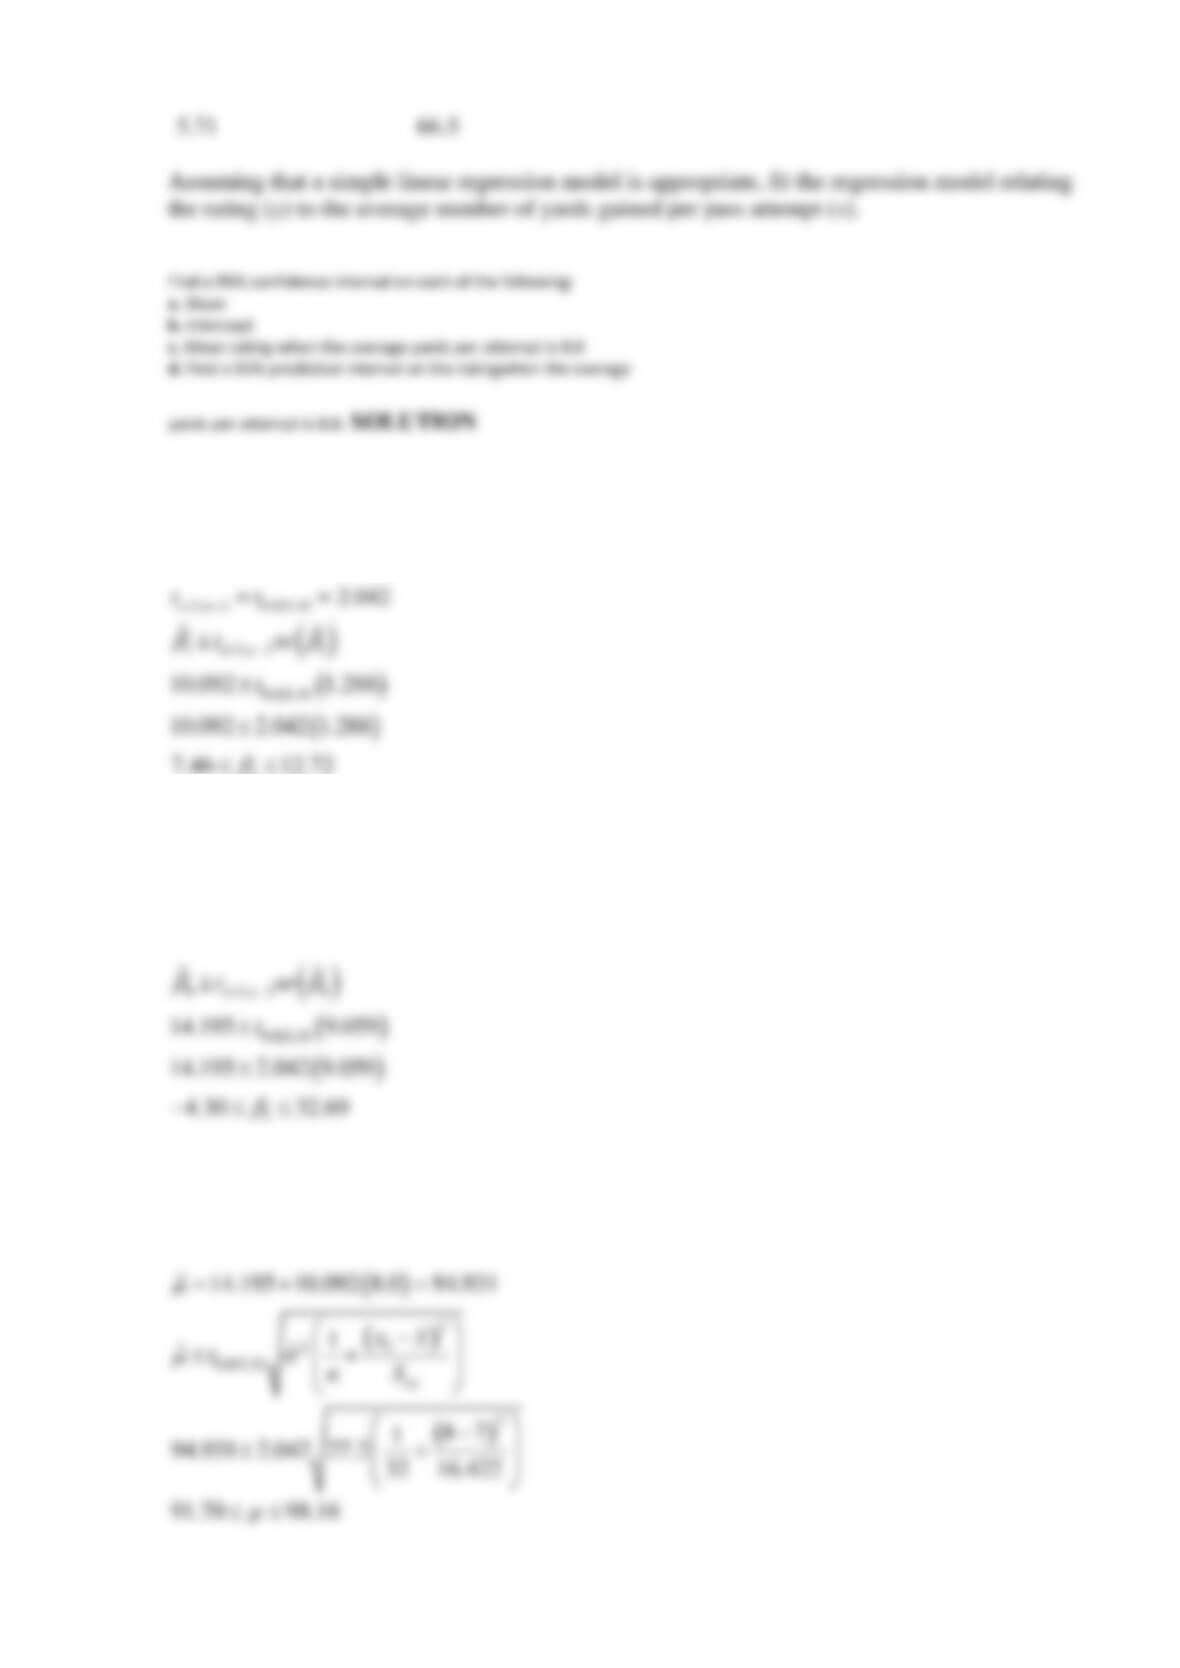
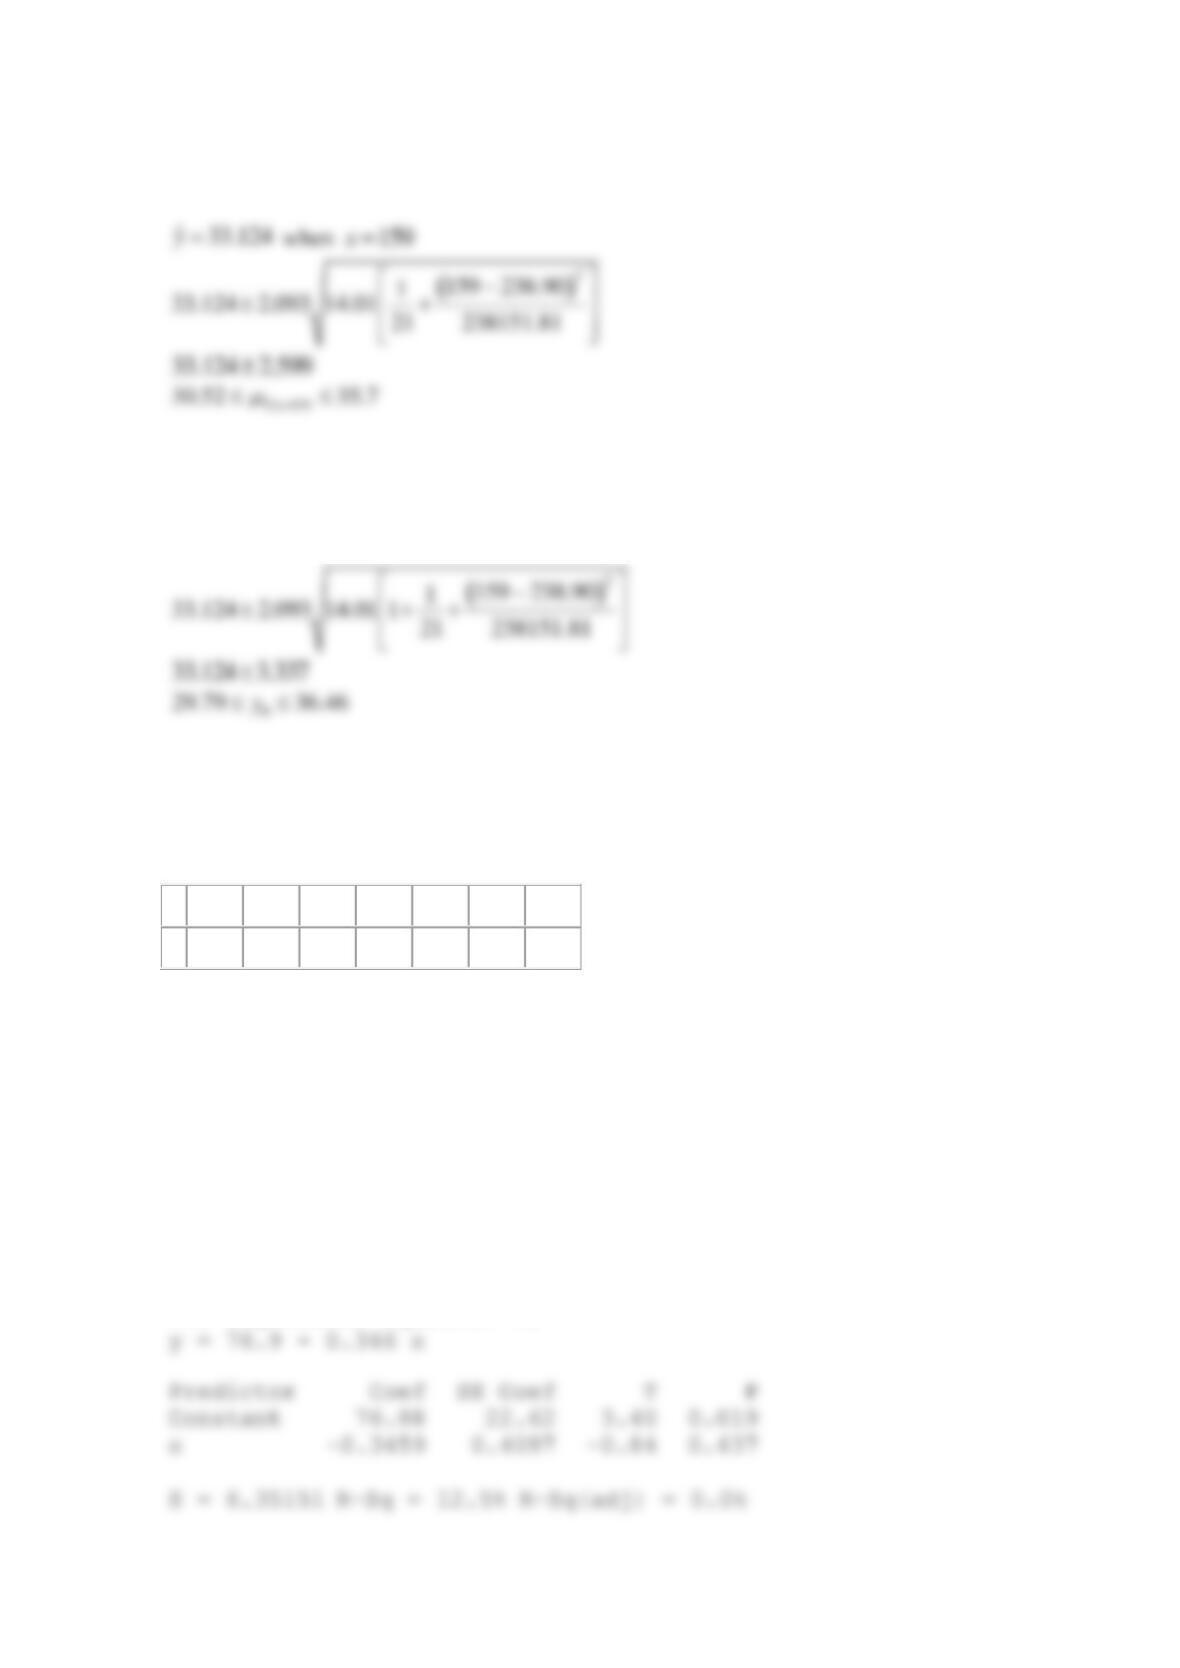
(a)
95% confidence interval on
1
1
(b)
95% confidence interval on
0
(c)
95% confidence interval for the mean rating when the average yards per attempt is 8.0
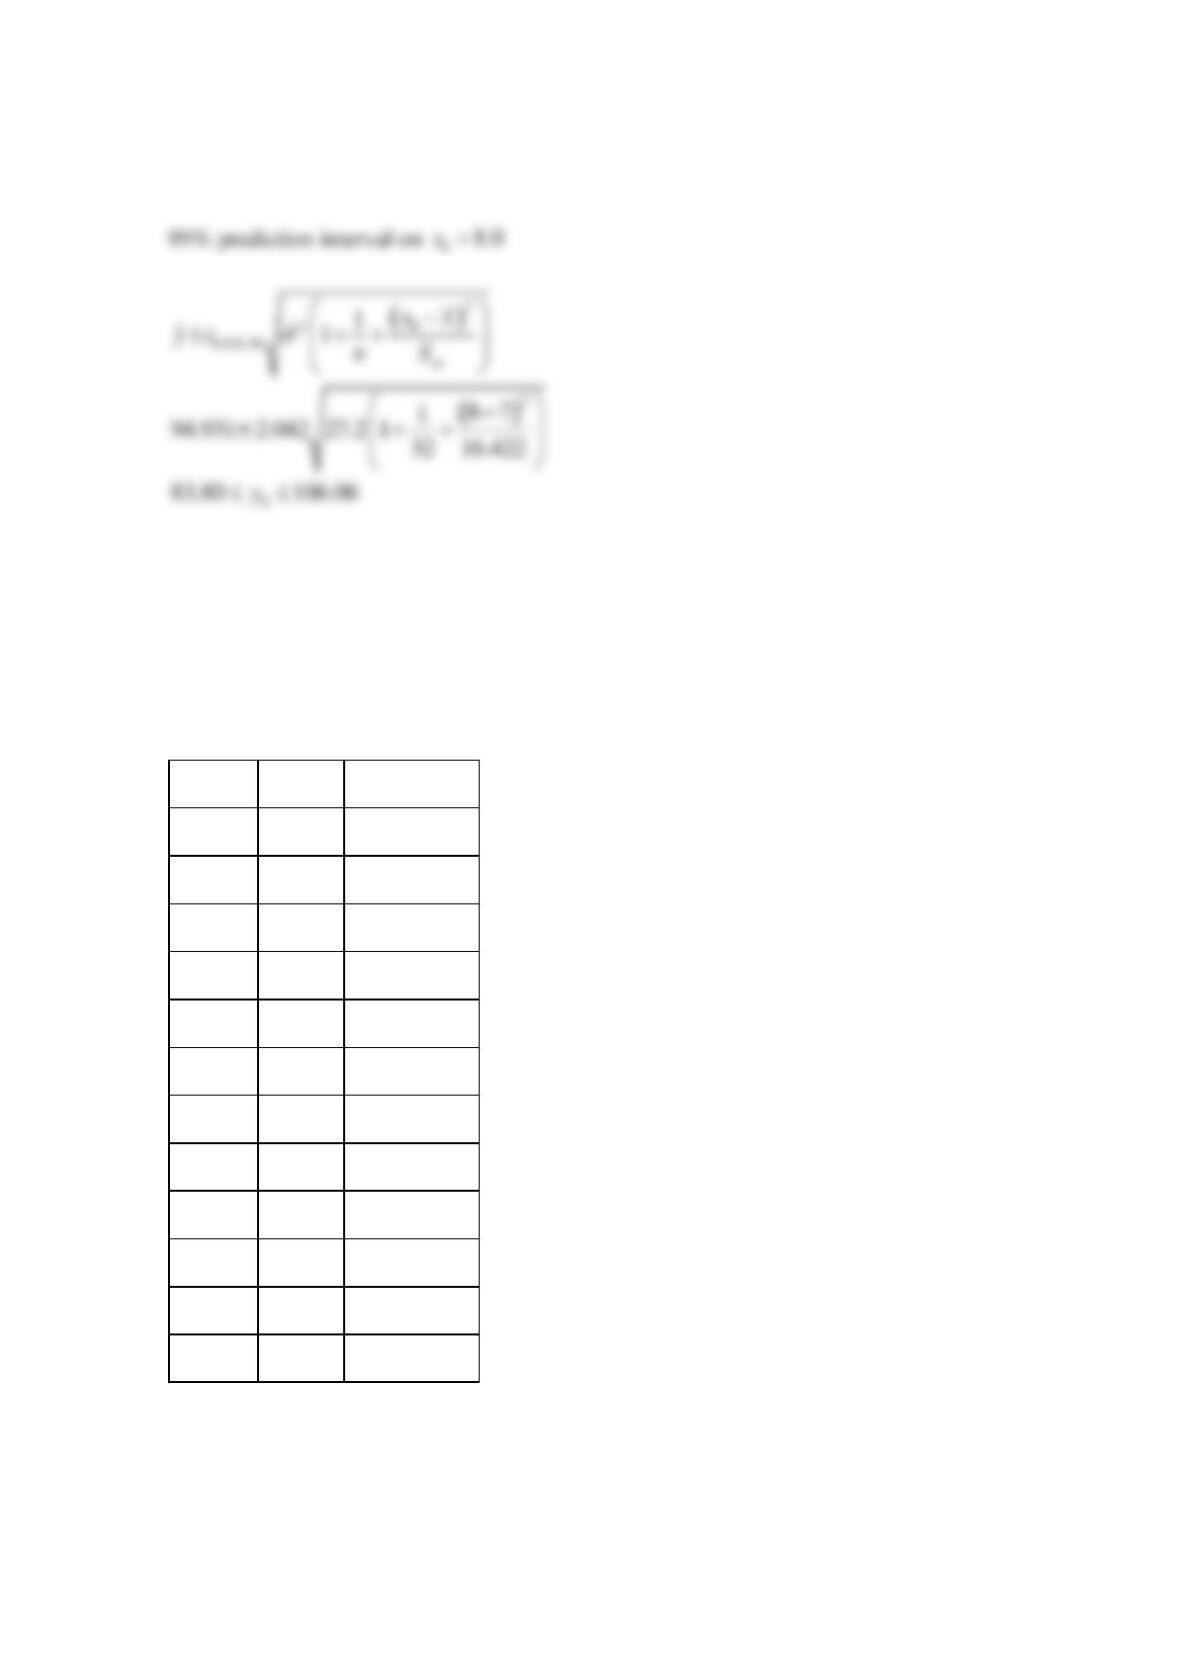
(d)
Reserve Problems Chapter 11 Sections 5 and 6 Problem 2
The number of pounds of steam used per month by a chemical plant is thought to be related to
the average ambient temperature (in °F) for that month. The past year’s usage and temperatures
are in the following table:
Month
Temp.
Usage/1000
Jan.
21
185.79
Feb.
24
214.47
Mar.
32
288.03
Apr.
47
424.84
May
50
454.58
June
59
539.03
July
68
621.55
Aug.
74
675.06
Sept.
62
562.03
Oct.
50
452.93
Nov.
41
369.95
Dec.
30
273.98
Assuming that a simple linear regression model is appropriate, fit the regression model relating
steam usage (y) to the average temperature (x).
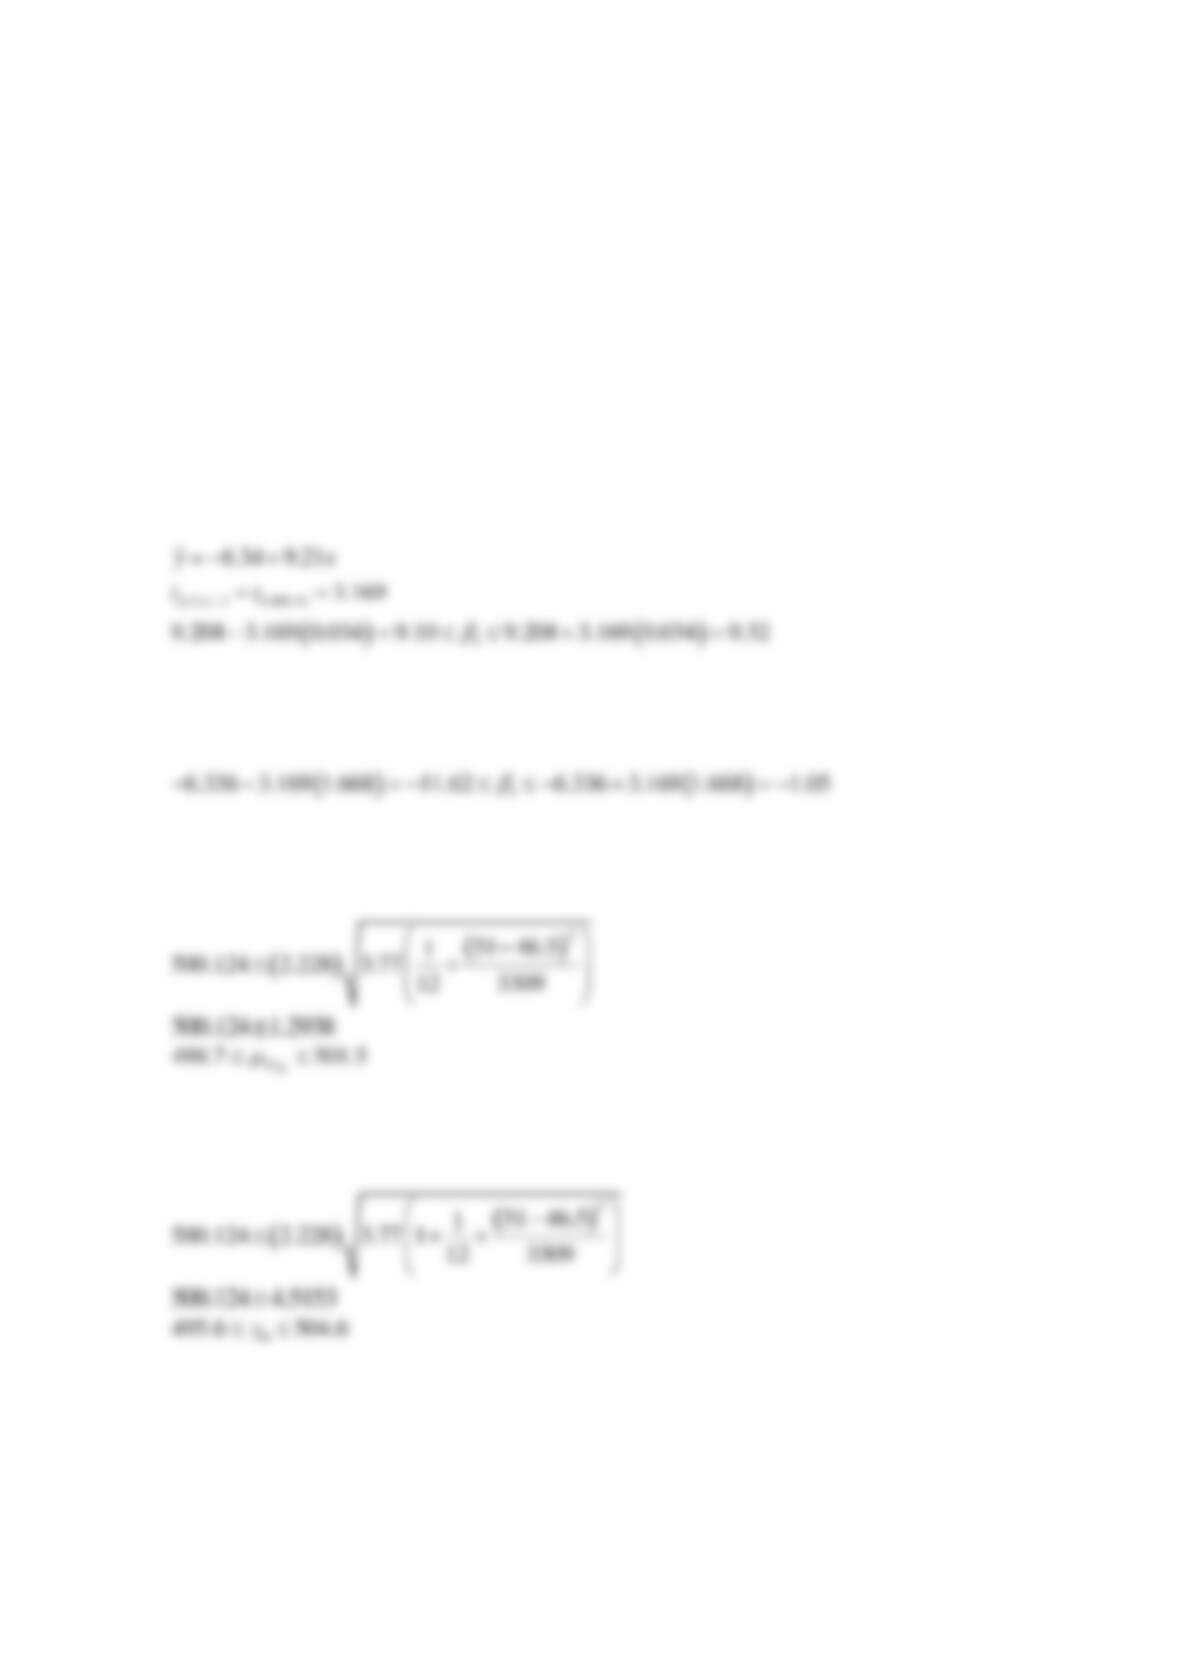
(a) Find a 99% confidence interval for
1
.
(b) Find a 99% confidence interval for
0
.
(c) Find a 95% confidence interval on mean steam usage when the average temperature is 51°F.
(d) Find a 95% prediction interval on steam usage when the temperature is 51°F.
SOLUTION
(a)
The regression equation is
(b)
(c)
(d)
Reserve Problems Chapter 11 Sections 5 and 6 Problem 3
The table presents the highway gasoline mileage performance and engine displacement for
DaimlerChrysler vehicles for model year 2005 (U.S. Environmental protection Agency).
Engine Displacement (in3)
MPG (highway)
215
30.8
201
32.5
196
35.4
226
28.1
226
24.4
348
24.1
226
28.5
348
24.2
148
32.8
226
28
122
41.3
215
30.0
215
28.2
148
34.1
500
18.7
348
20.3
165
35.1
148
37.9
148
33.8
500
25.9
148
26.4
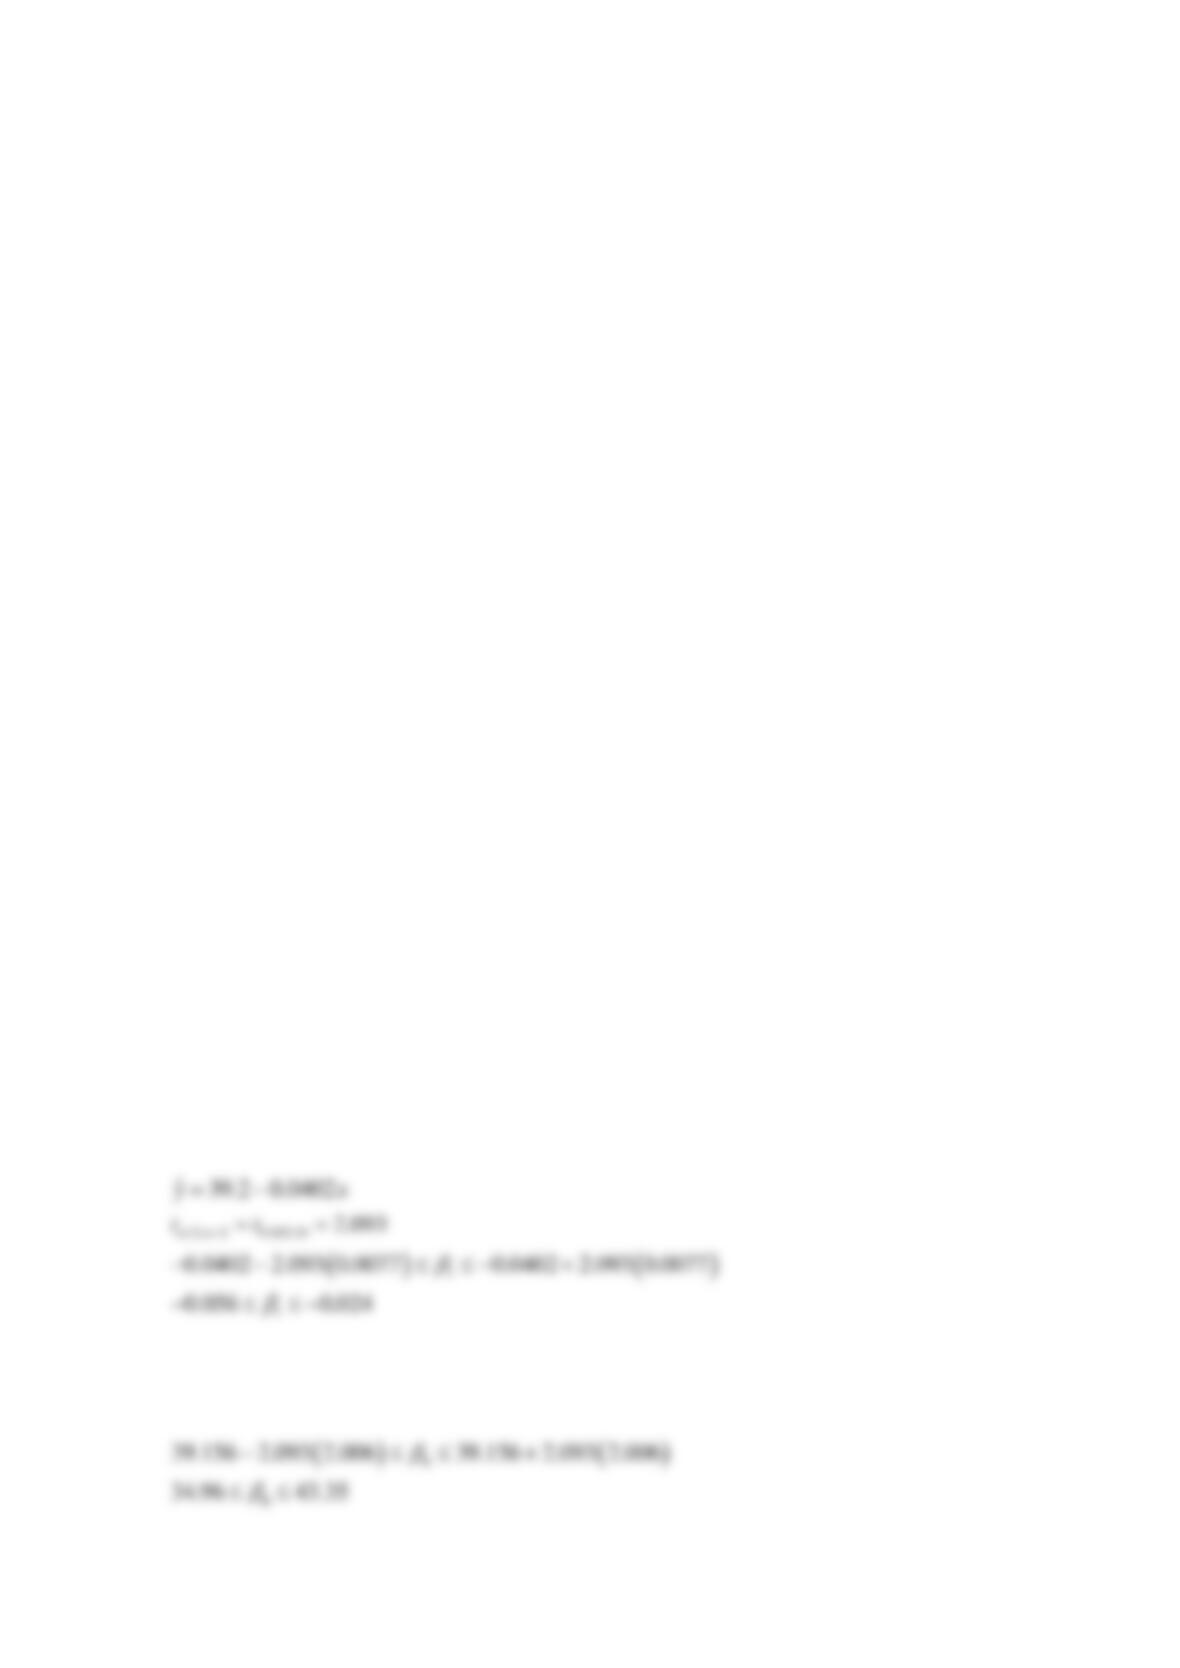
Find a 95% confidence interval on each of the following:
a. Slope
b. Intercept
c. Mean highway gasoline mileage when the engine displacement
is x = 159 in3
(d) Construct a 95% prediction interval on highway gasoline mileage when the engine
displacement is x = 159 in3.
SOLUTION
(a)
The regression equation is
(b)
(c)
(d)
33 24
ˆ.1y=
when
159x=
Reserve Problems Chapter 11 Section 7 Problem 1
The following table contains the values of the average annual salary in thousands of dollars (x)
and the food expenses percentage (y) in seven regions of a country.
x
45.1
59.0
57.2
61.8
58.8
47.2
55.2
y
68.8
61.2
59.9
56.7
55.0
54.3
49.3
(a) What proportion of the total variability in the food expenses percentage is accounted for by
the simple linear regression model?
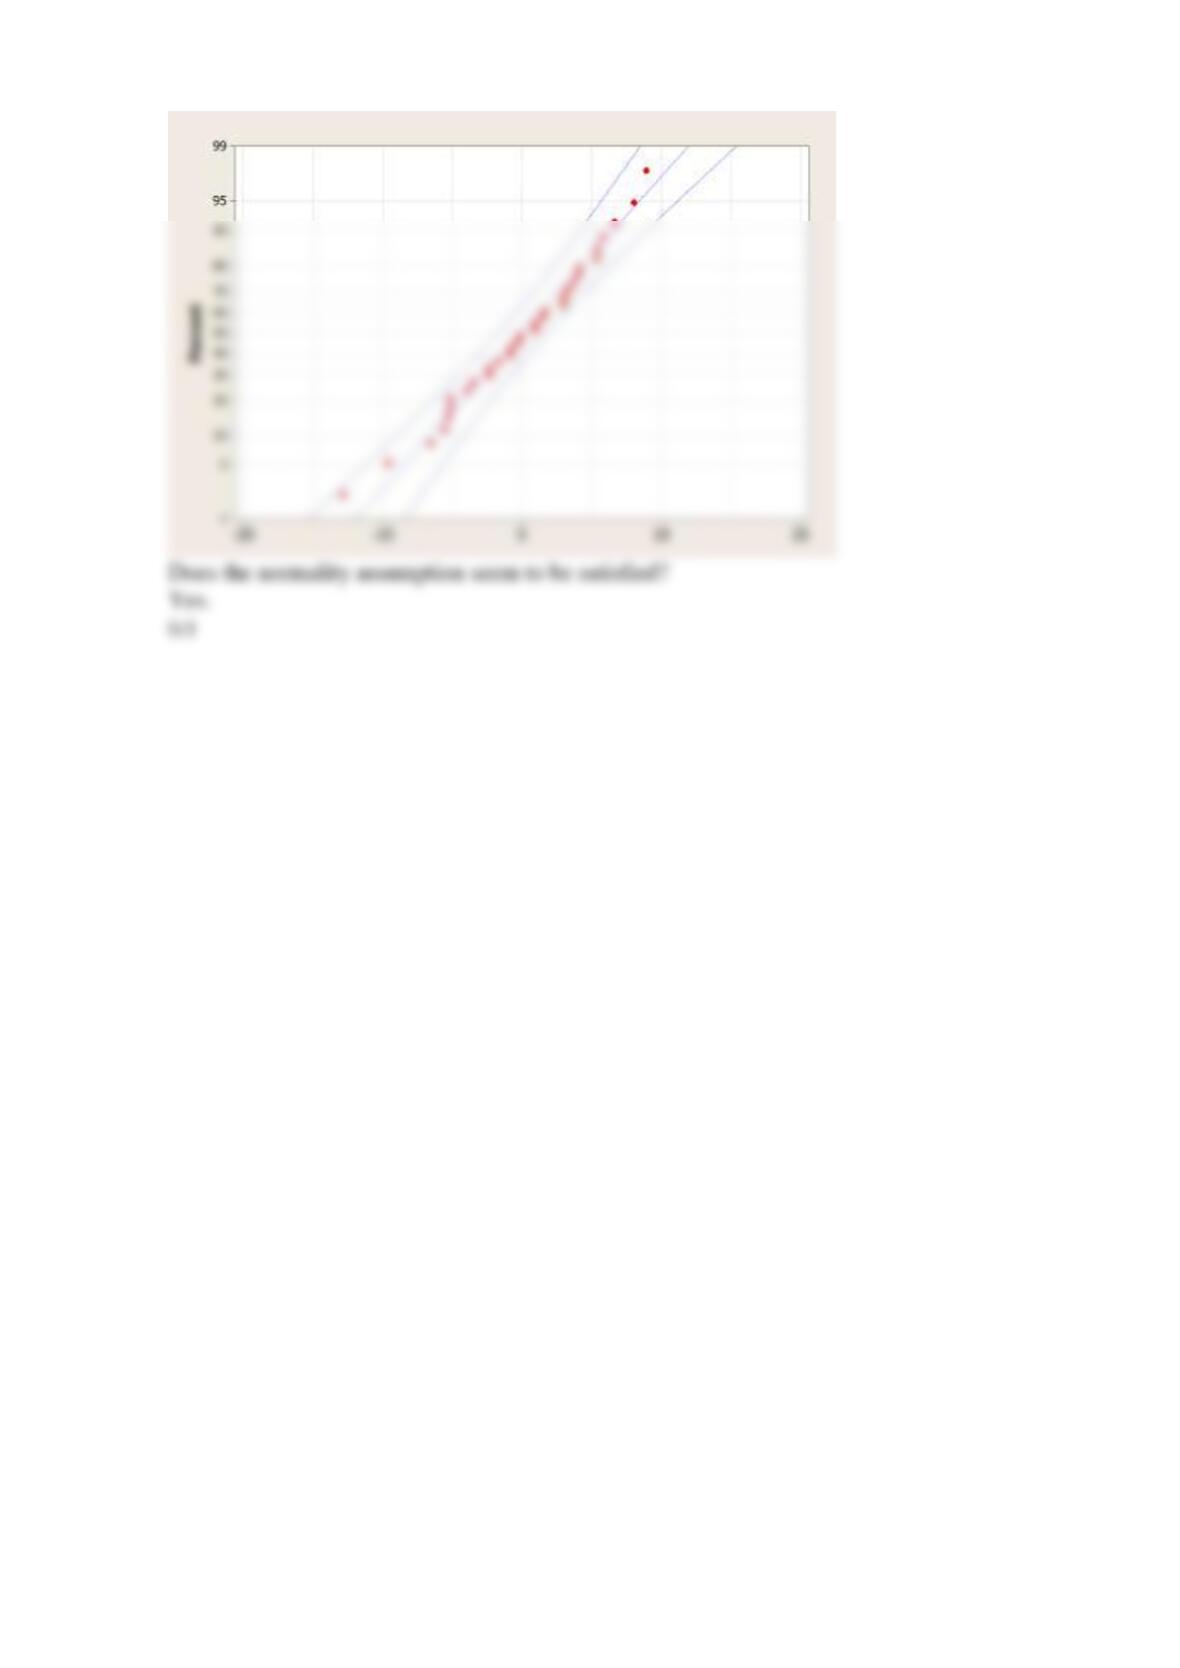
(b) Prepare a normal probability plot of the residuals from the least squares model. Does the
normality assumption seem to be satisfied?
SOLUTION
(a)
The regression equation is
33 24
159x=
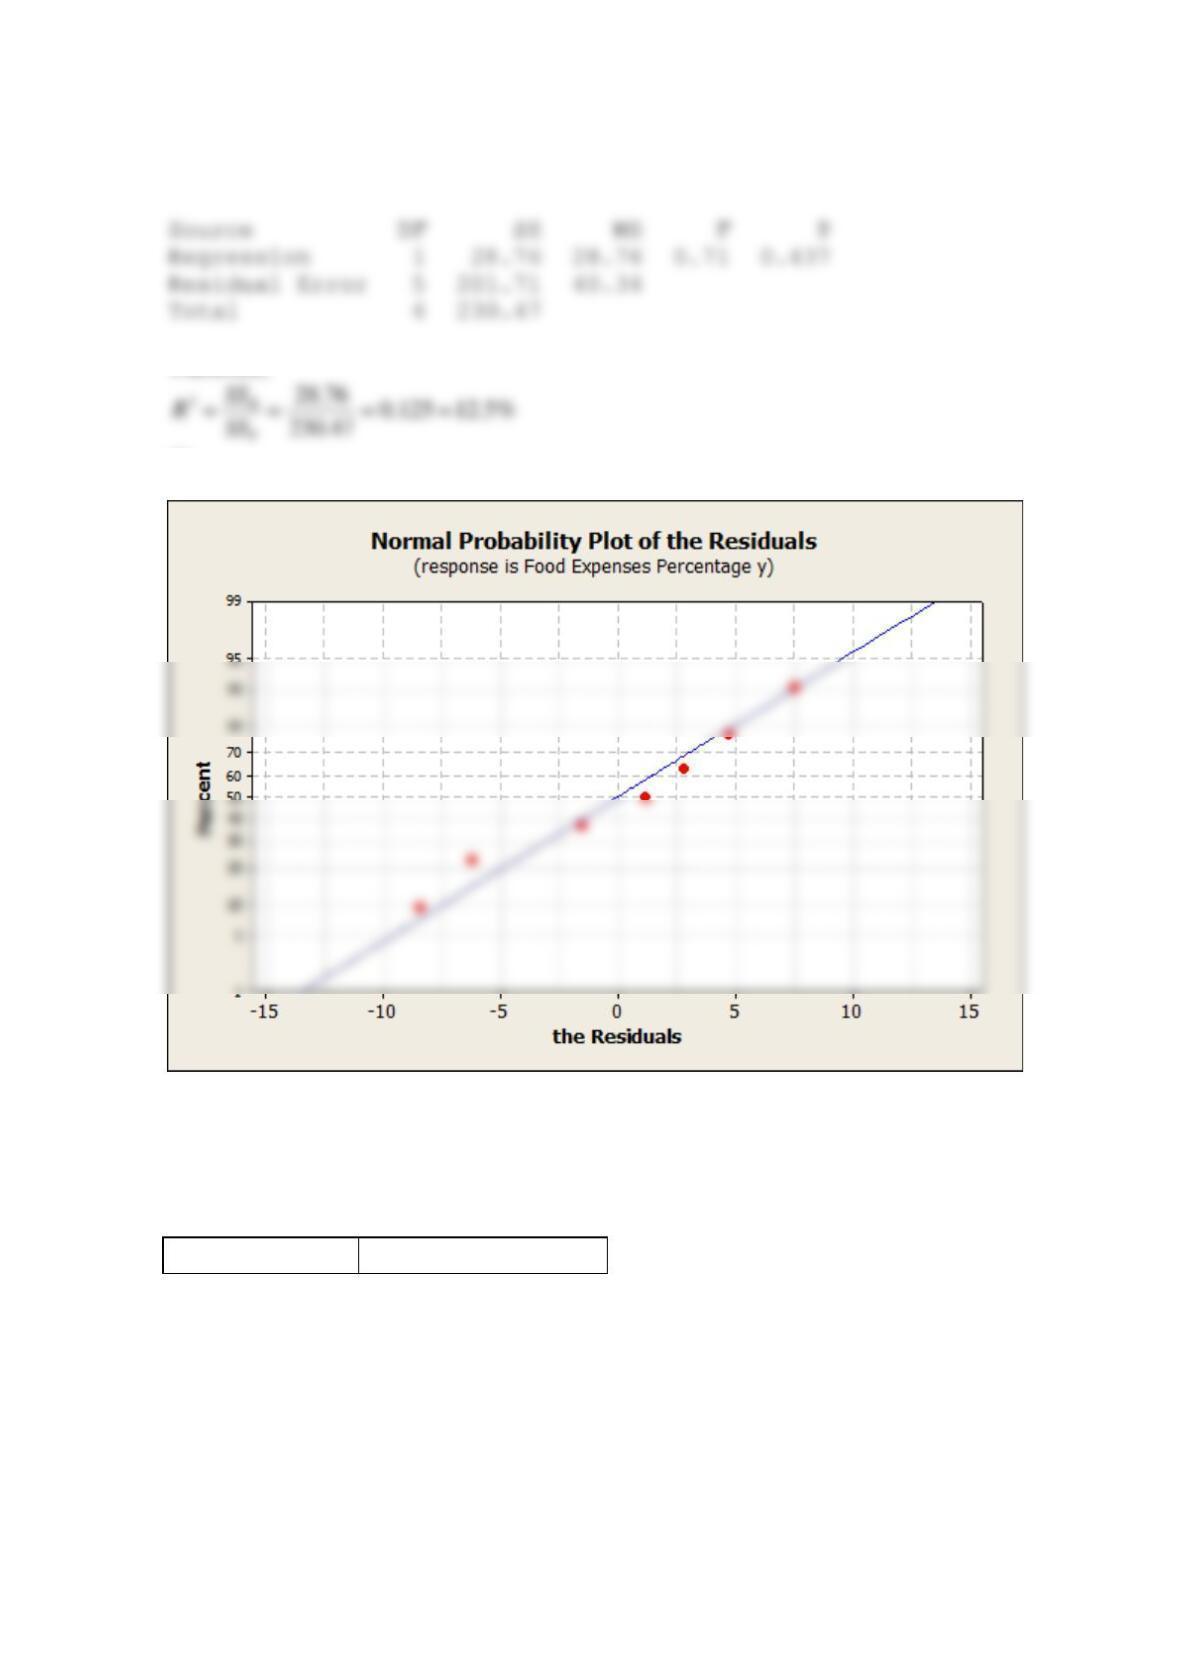
Analysis of Variance
Therefore,
(b)
There is no major departure from the normality assumption in the following graph.
Reserve Problems Chapter 11 Section 7 Problem 2
The following table presents data about the annual sales volume (y in millions of dollars) and the
square footage (x in thousands of square feet) of 14 stores.
x
y
1.8
3.3
1.6
3.7
2.6
6.5
5.1
9.7
0.9
3.3
0.7
5.2
2
3.3
1.2
2.6
3.2
5.3
1.1
2.9
5.4
10.6
4.6
7.5
6.2
11.8
3
4.3
What proportion of the total variability in the sales volume is accounted for by the simple linear
regression model?
SOLUTION
The regression equation is
y = 1.37 + 1.54 x
Analysis of Variance
Therefore,
Reserve Problems Chapter 11 Section 7 Problem 3
It is known that carbon monoxide has a great influence on health. The following data are the
carbon monoxide concentration (x in milligrams per cubic meter) and allergic morbidity (y).
x
y
8.52
14.9
9.73
16.9
8.63
17.2
9.48
16.9
5.98
13.8
9.44
15.3
6.44
15.7
5.71
14.2
4.24
10.7
3.52
11.6
6.23
13.2
(a) Fit the linear regression model by least squares, find the estimates of the slope and intercept.
(b) Find the value of
2
R
.
SOLUTION
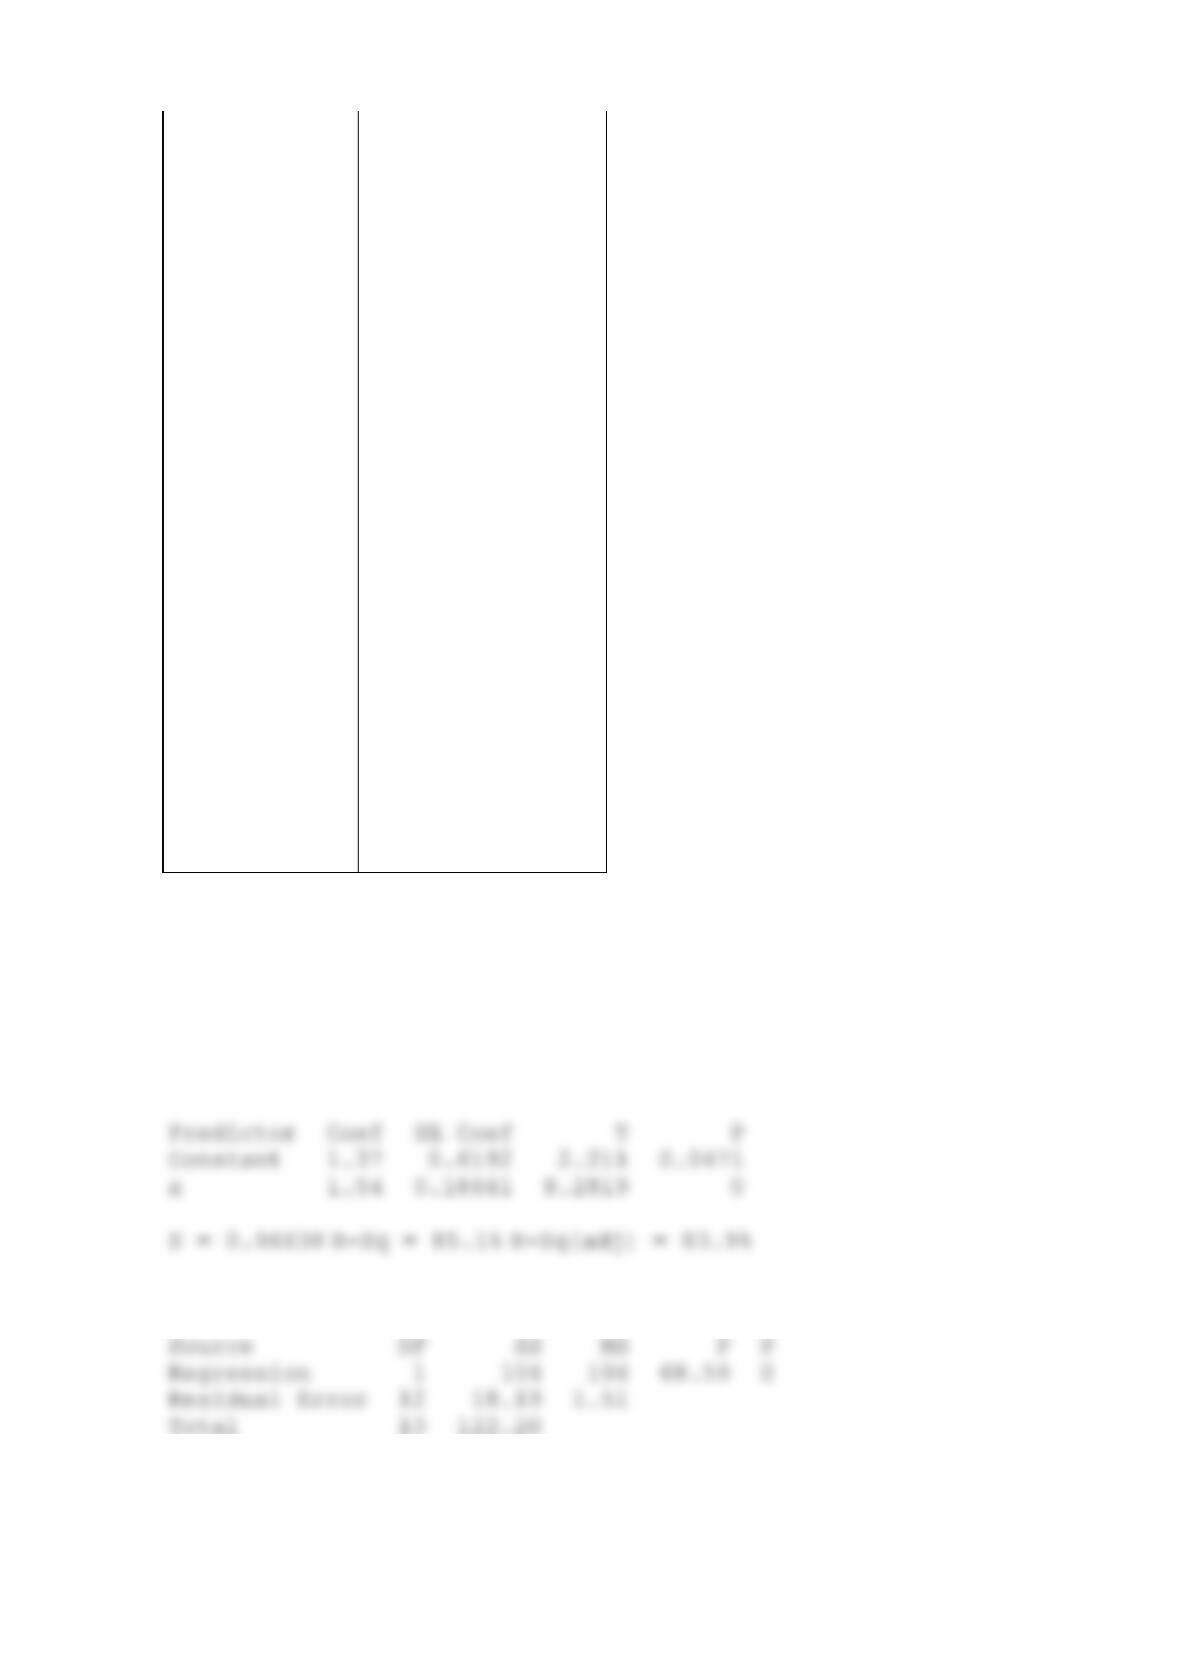
(a)
The regression equation is
Predictor
Constant
7.4157
0.86635
0.15423
5.6174
0.0003
Analysis of Variance
Source
DF
SS
MS
F
P
(b)
Reserve Problems Chapter 11 Section 7 Problem 4
A company wants to test the effectiveness of their product advertising. It provides different
marketing strategies in 10 regions. The following table contains advertising expenses (x in
millions of dollars) and the number of sales (y in millions of units).
x
0
0.5
1
1.5
2
2.5
3
3.5
4
4.5
y
37.5
38.4
38.6
39
41.8
41.2
44.3
45.5
46.6
48.2
(a) Fit the linear regression model by least squares.
(b) Calculate
2
R
for this model.
(c) Estimate
2
for this model.
SOLUTION
(a)
The regression equation is
Predictor
Coef
SE Coef
T
P
Constant
71.962
0.0
2.4667
0
S = 0.796945
Analysis of Variance
Source
DF
Regression
125.4917
125.4917
167.9567
Total
131.4690
Regression
35.8667
35.8667
31.55
0.0003
Residual Error
10.2296
Total
10
46.0964
Therefore,
(c)
=
Reserve Problems Chapter 11 Section 7 Problem 5
See the table for data on the ratings of quarterbacks for the 2008 National Football League
season (The Sports Network).
Yards per attempt
Rating points
8.39
105.5
7.67
97.4
7.66
96.9
7.98
96.2
7.21
95
7.53
93.8
8.01
92.7
7.66
91.4
7.21
90.2
7.16
89.4
7.93
87.7
7.10
87.5
6.33
87
6.76
86.4
6.86
86.4
7.35
86
7.22
85.4
7.94
84.7
6.41
84.3
6.77
81.7
6.65
81
6.94
80.3
6.45
80.2
7.04
80.1
6.39
79.6
6.58
77.1
6.21
76
7.17
73.7
6.34
72.6
6.18
71.4
5.12
70
5.71
66.5
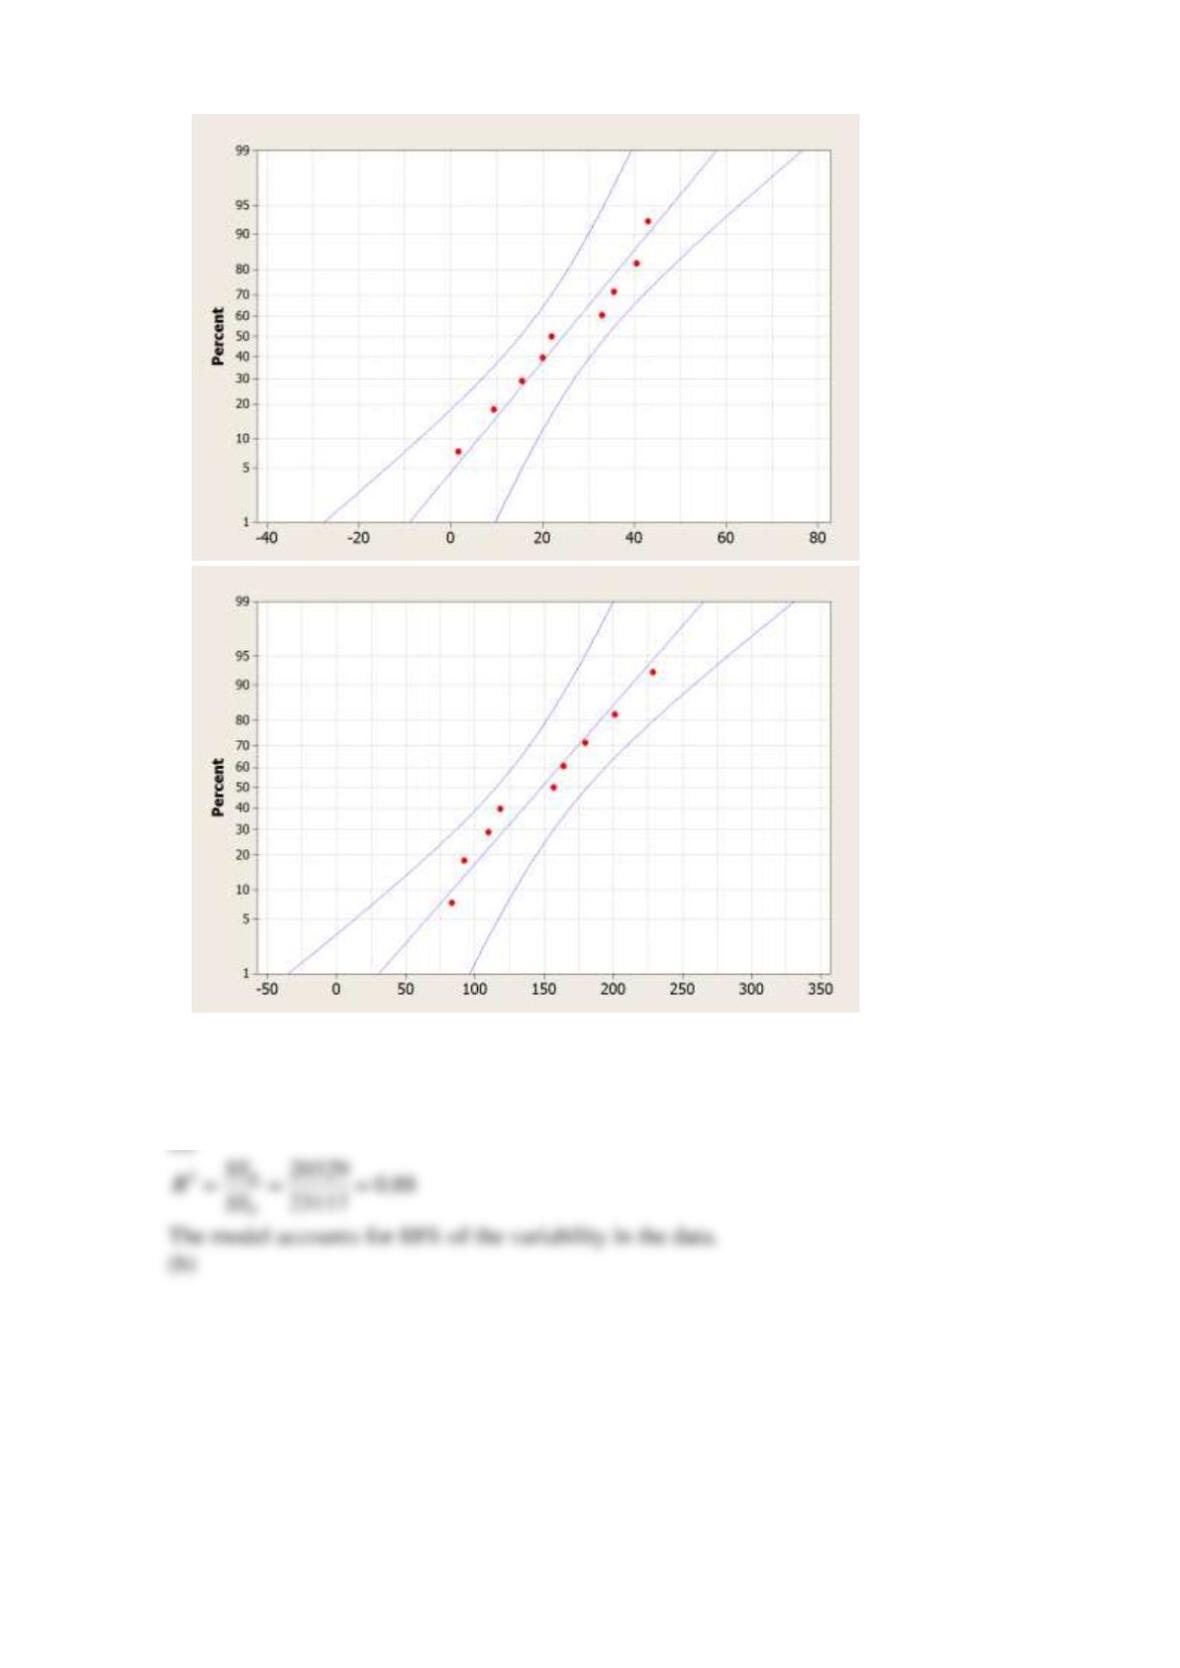
Assuming that a simple linear regression model is appropriate, fit the regression model relating
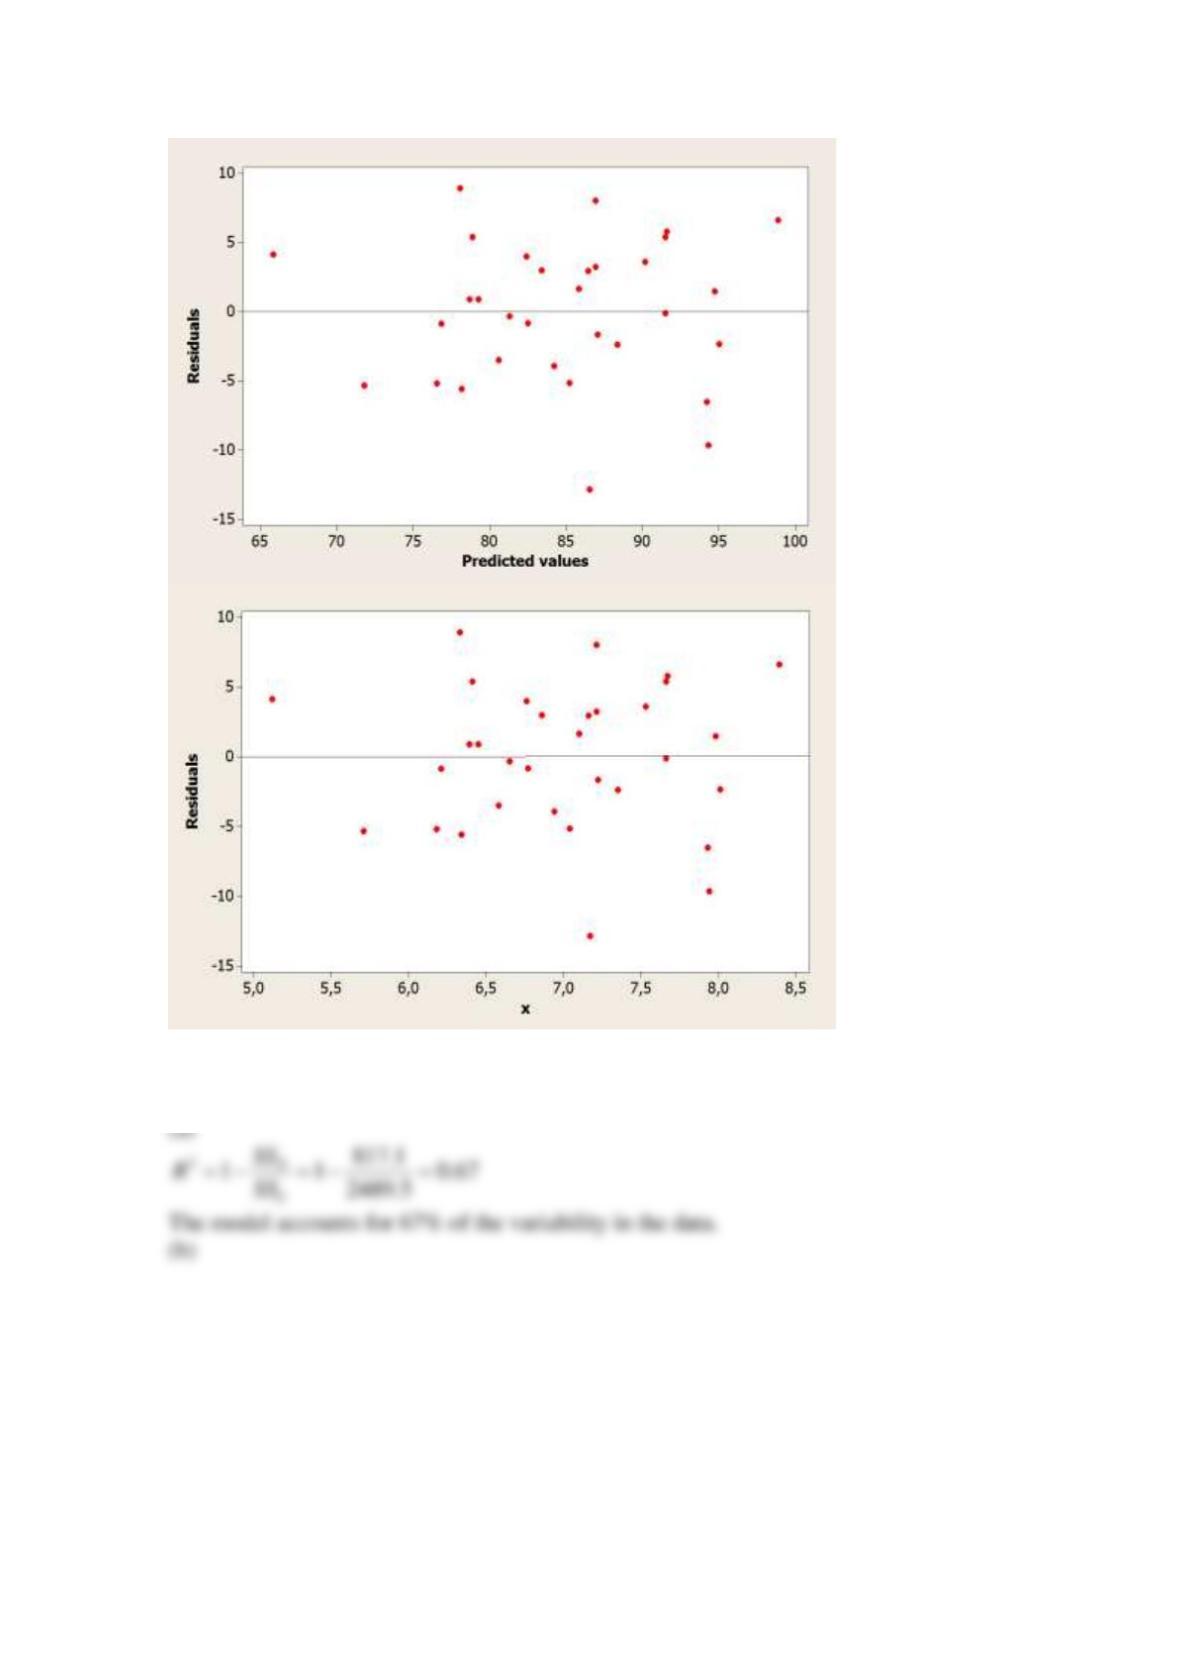
the rating (y) to the average number of yards gained per pass attempt (x).
(a) Calculate
2
R
for this model and provide a practical interpretation of this quantity.
The model accounts for _____ percent of the variability in the data.
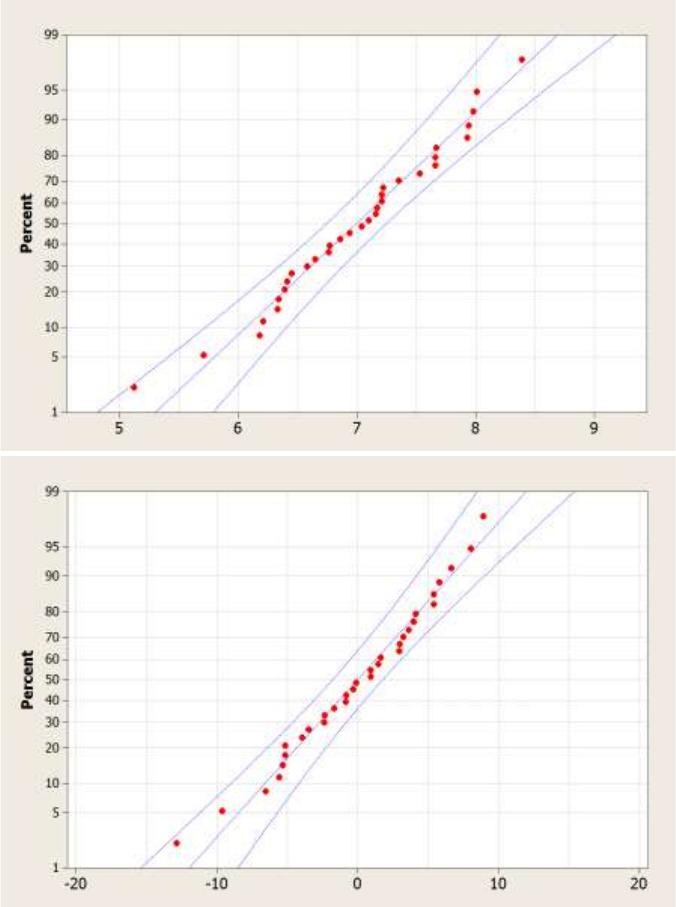
(b) Select the correct normal probability plot of the residuals from the least squares model.
A
B
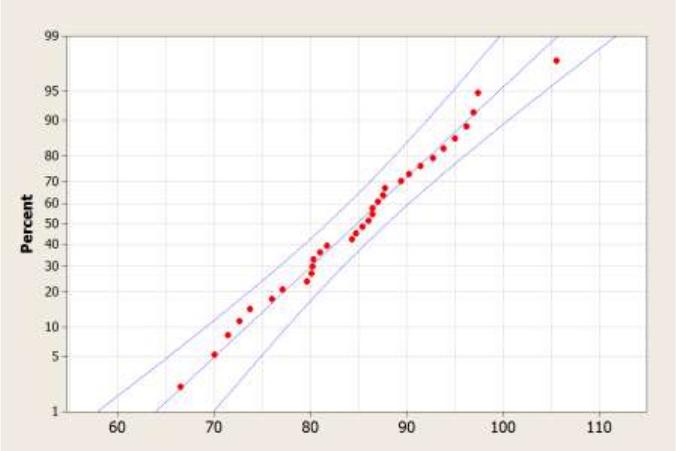
C
Does the normality assumption seem to be satisfied?
(c) Look at the plots of residuals versus the fitted values and against x. Interpret these graphs.
SOLUTION
Reserve Problems Chapter 11 Section 7 Problem 6
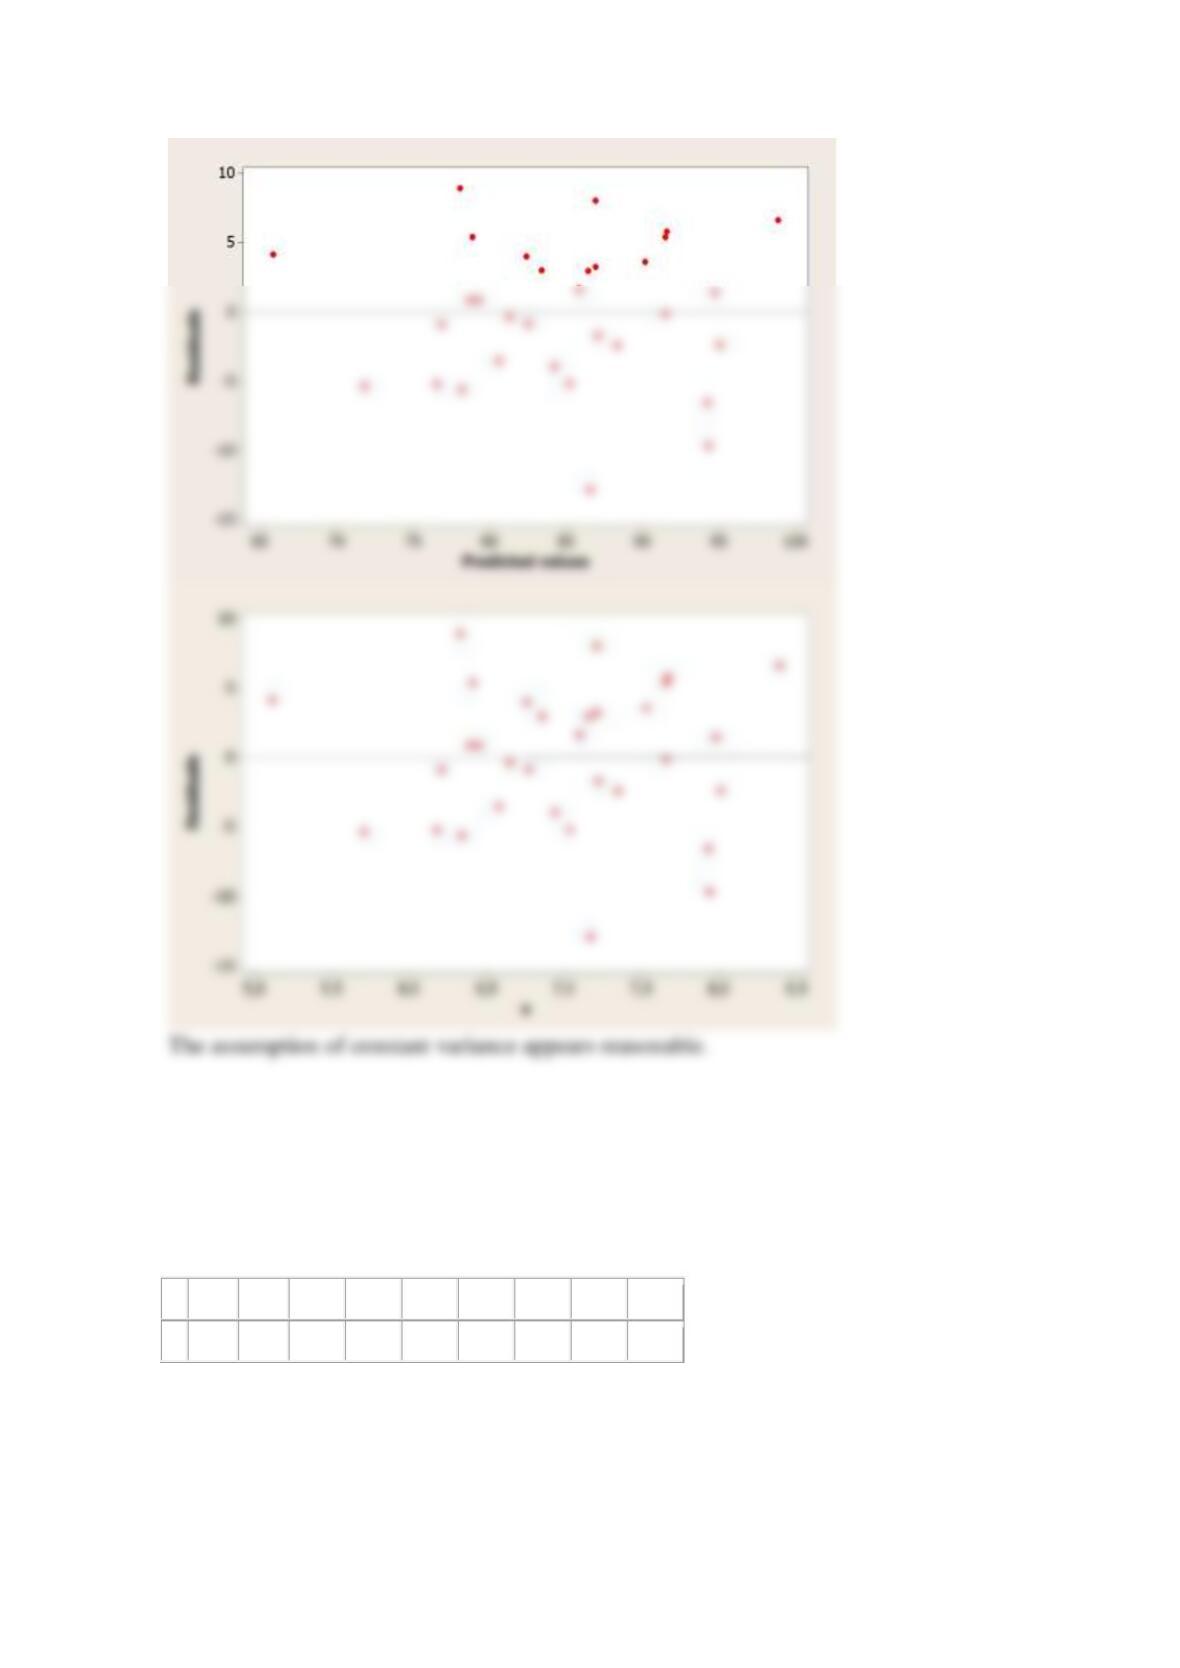
An article in Wear (1992, Vol. 152, pp. 171-181) presents data on the fretting wear of mild steel
and oil viscosity. Representative data follow with x = oil viscosity and y = wear volume (10–4
cubic millimeters).
y
240
181
193
155
172
110
113
75
94
x
1.6
9.4
15.5
20.0
22.0
35.5
43.0
40.5
33.0
(a) Calculate
2
R
for the simple linear regression model and provide an interpretation of this
quantity. The model accounts for _____ percent of the variability in the data.
(b) Look at the plots of the residuals from this model versus
ˆ
y
and versus x. Interpret these plots.
(c) Select the corret normal probability plot of the residuals.
A
B
C
Does the normality assumption appear to be satisfied?
SOLUTION
(a)
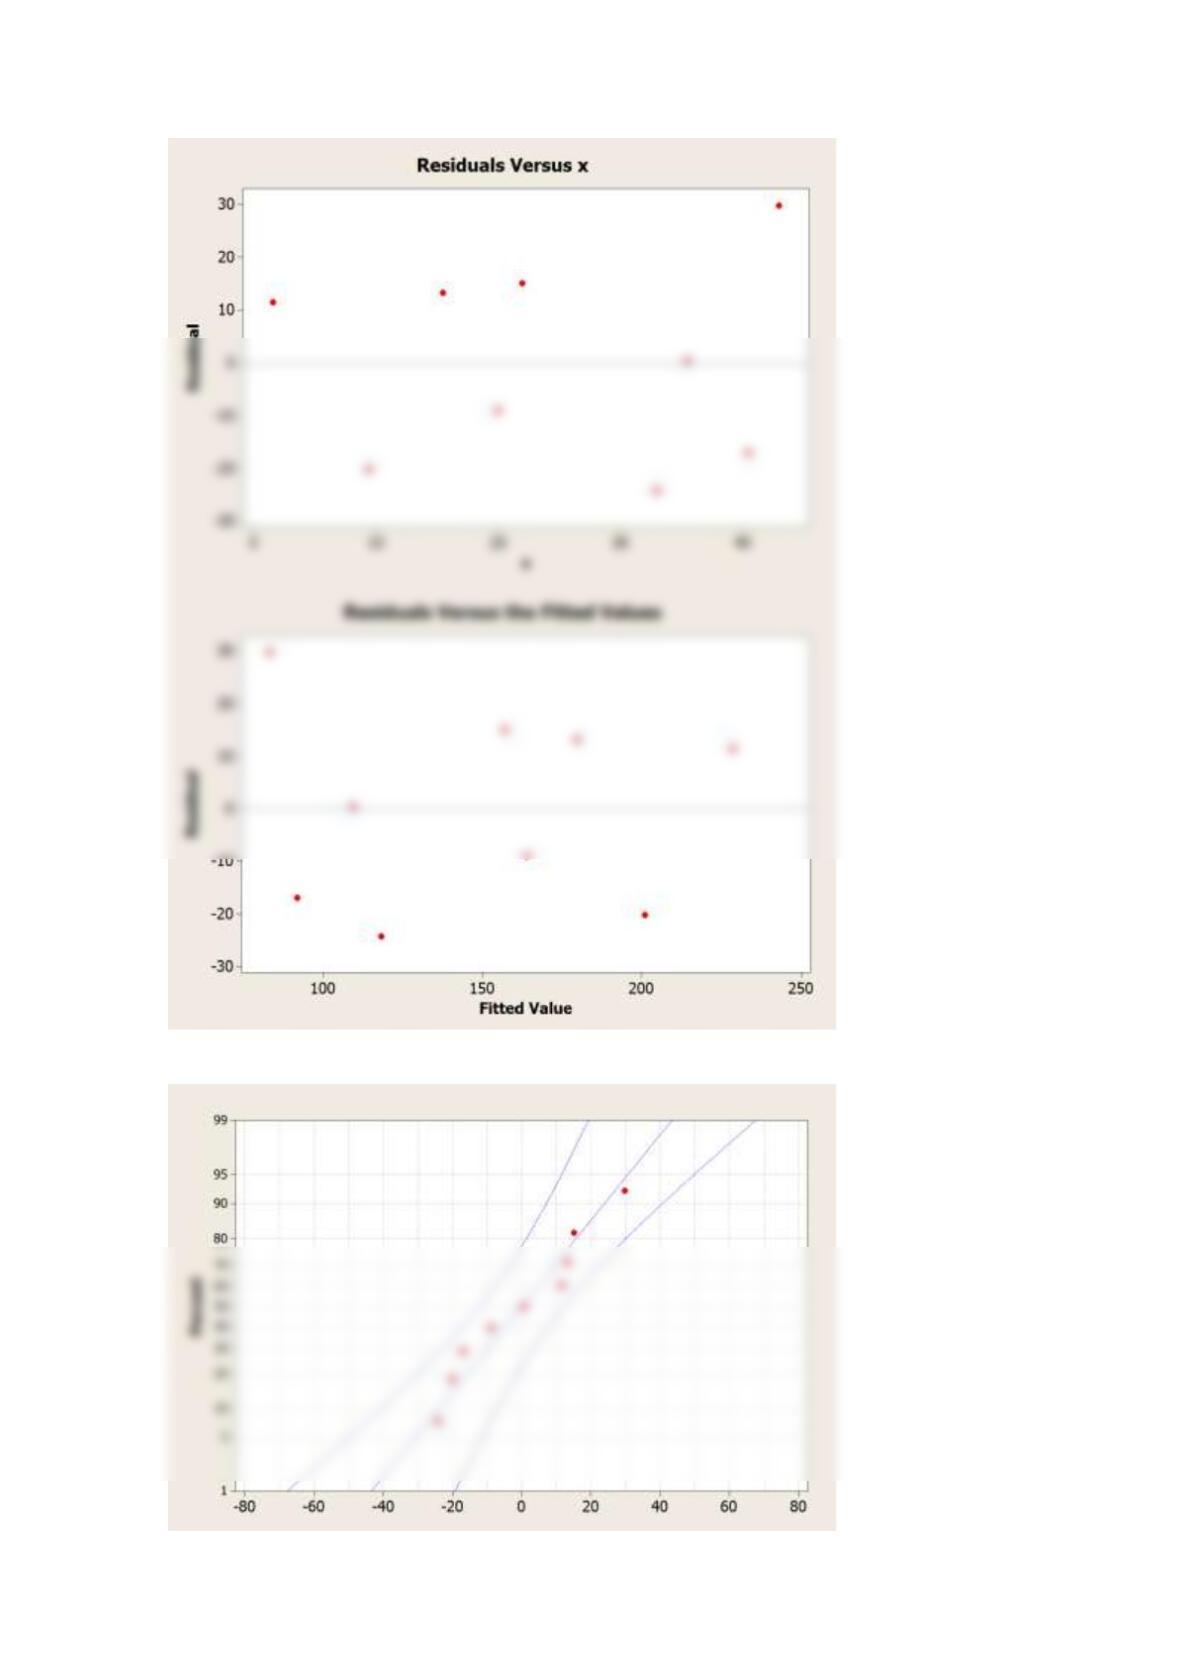
The assumption of constant variance appears reasonable.
(c)
Reserve Problems Chapter 11 Section 7 Problem 7
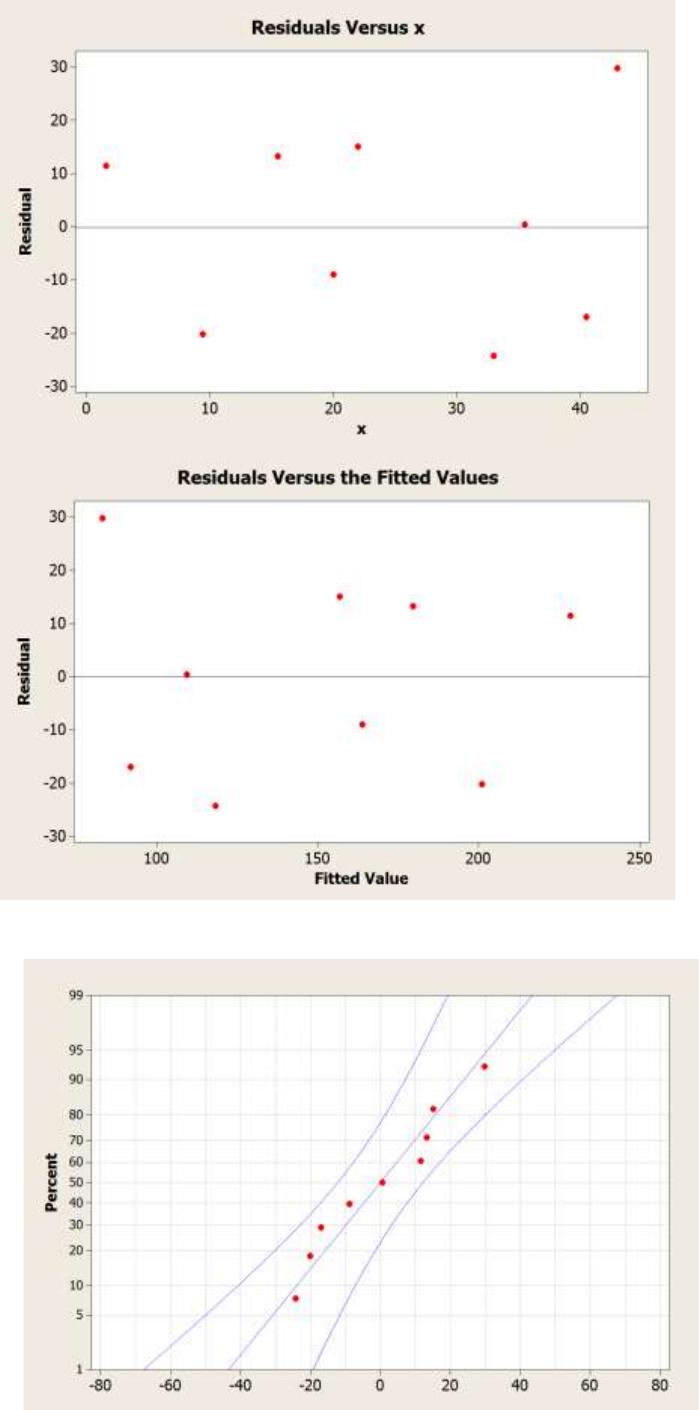
A rocket motor is manufactured by bonding together two types of propellants, an igniter and a
sustainer. The shear strength of the bond y is thought to be a linear function of the age of the
propellant x when the motor is cast. The following table provides 20 observations.
Observation
number
Strength y (psi)
Age x (weeks)
1
2158.70
15.50
2
1678.15
23.75
3
2316.00
8.00
4
2061.30
17.00
5
2207.50
5.00
6
1708.30
19.00
7
1784.70
24.00
8
2575.00
2.50
9
2357.90
7.50
10
2277.70
11.00
11
2165.20
13.00
12
2399.55
3.75
13
1779.80
25.00
14
2336.75
9.75
15
1765.30
22.00
16
2053.50
18.00
17
2414.40
6.00
18
2200.50
12.50
19
2654.20
2.00
20
1753.70
21.50
(a) Calculate
2
R
for
the simple linear regression model and provide
an interpretation of this quantity.
The model accounts for ____
percent
of the variability in the data.
(b) Select the correct graph of the residuals on a normal probability scale.
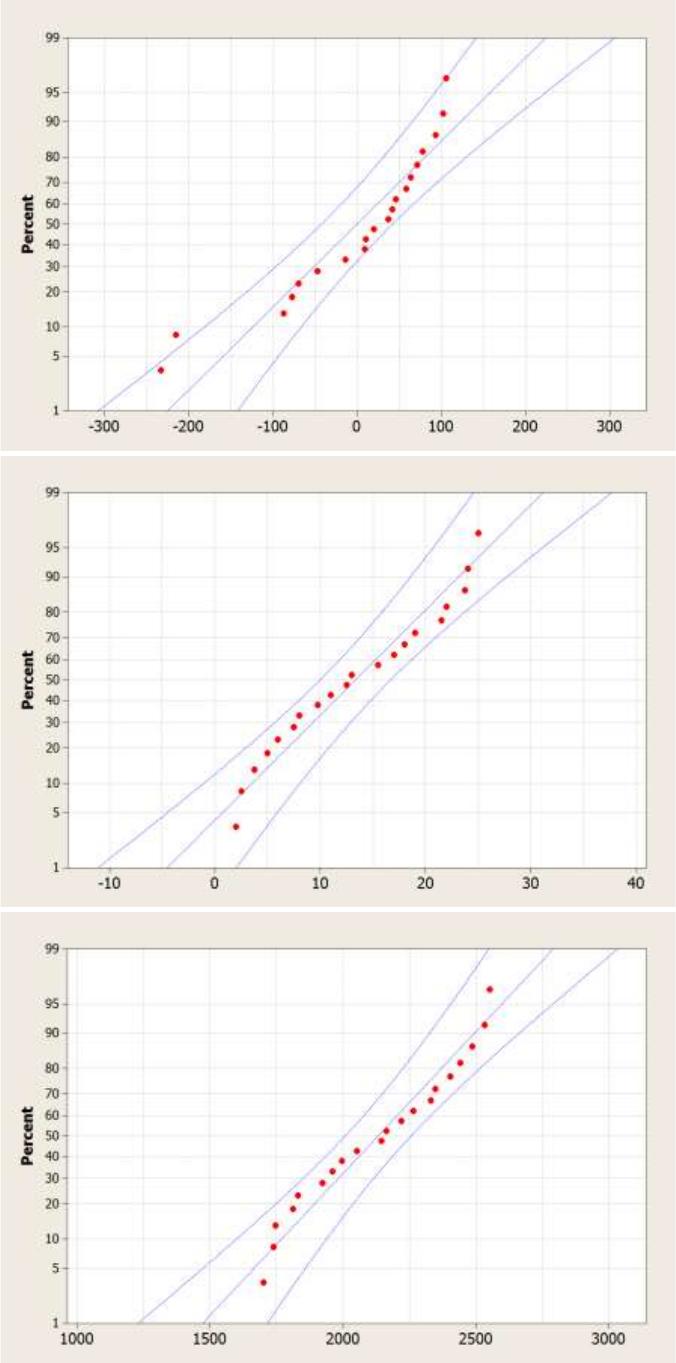
A
B
C
Do any points seem unusual on this plot?