CHAPTER 11 RESERVE PROBLEMS
The following problems have been reserved for your use in assignments and testing and do not
appear in student versions of the text.
Reserve Problems Chapter 11 Section 2 Problem 1
The department of health studied the number of patients who need liver transplantation. The
following data are the Liver Transplantation Waiting List (LTWL), where y is the size (in
number of patients) and x is the corresponding year:
y
1319
1861
2980
4048
5065
7048
7935
7844
8081
8845
8731
8882
9350
x
2004
2005
2006
2007
2008
2009
2010
2011
2012
2013
2014
2015
2016
(a) Fit the simple linear regression model using the method of least squares. Find the estimate of
2
.
(b) How does the LTWL size change in average for a year?
(c) Estimate the number of patients in the list in 2019.
(d) Calculate the fitted value of y corresponding to
2013x=
. Find the corresponding residual.
SOLUTION
(a)
81989
i
y=
,
26130
i
x=
6306.85y=
,
2010x=
,
Therefore, the estimated regression line is
(d)
Reserve Problems Chapter 11 Section 2 Problem 2
The peanut crop was harvested from five fields of various area. The following data are the mass
of the crop from each field y (in kilograms) and the field area x (in hectares).
y
7480
15530
13400
20070
12950
x
2.26
3.72
3.61
4.02
2.84
(a) Fit the simple linear regression model using the method of least squares. Find the estimate of
2
.
(b) What change in the mean mass is expected when the field area changes by 1 hectare?
(c) Calculate the fitted value of y corresponding to
2.26x=
. Find the corresponding residual.
(d) Estimate the mean mass of the crop harvested from 2.5 hectares.
SOLUTION
(a)
69430
i
y=
,
16.45
i
x=
13886y=
,
3.29x=
,
(b)
15800.11
(c)
( )
kg
Reserve Problems Chapter 11 Section 2 Problem 3
Consider the simple linear regression model
01
Yx
= + +
. How will the least squares
estimates change in case of a new regressor variable
50 19zx=+
?
SOLUTION
50 19 50z x x= + =
Reserve Problems Chapter 11 Section 2 Problem 4
Consider the regression model given below.
3772.94 5023.1
ˆ67 ha
yx= − +
Suppose that the field area is measured in acres instead of hectares. Note that 1 hectare = 2.471
acres.
(a) Estimate new regression model coefficients.
(b) What change in the mean mass is expected when the field area increases by 1 acre?
SOLUTION
(a)
The regression model when the field area is measured in hectares is
3772.94 5023.1
ˆ67 ha
yx= − +
(b)
Question Title: Reserve Problems Chapter 11 Section 2 Problem 5
On average, do people gain weight as they age? We provide some summary statistics for both
age (x) and weight (y).
250N=
1
11211.00
n
i
i
x
=
=
2
1543503.00
n
i
i
x
=
=
144520.80
n
i
i
y
=
=
2
18110405.02
n
i
i
y
=
=
11996904.15
n
ii
i
xy
=
=
(a) Calculate the least squares estimates of the slope and intercept.
(b) Use the equation of the fitted line to predict the weight that would be observed, on average,
for a man who is 25 years old.
(c) Suppose that the observed weight of a 25-year-old man is 170 lbs. Find the residual for that
observation.
(d) Was the prediction for the 25-year-old in part (c) an overestimate or underestimate?
SOLUTION
(a)
01i i i
yx
= + +
(b)
(c)
(d)

Reserve Problems Chapter 11 Section 2 Problem 6
The number of pounds of steam used per month by a chemical plant is thought to be related to
the average ambient temperature (in °F) for that month. The past year’s usage and temperatures
are in the following table:
Month
Temp.
Usage/1000
Jan.
21
185.79
Feb.
24
214.47
Mar.
32
288.03
Apr.
47
424.84
May
50
454.58
June
59
539.03
July
68
621.55
Aug.
74
675.06
Sept.
62
562.03
Oct.
50
452.93
Nov.
41
369.95
Dec.
30
273.98
(a) Assuming that a simple linear regression model is appropriate, fit the regression model
relating steam usage (y) to the average temperature (x). What is the estimate of
2
?
(b) What is the estimate of expected steam usage when the average temperature is 55°F?
(c) What change in mean steam usage is expected when the monthly average temperature
changes by 1°F?
(d) Suppose that the monthly average temperature is 47°F. Calculate the fitted value of y and the
corresponding residual.
SOLUTION
(a)
(b)

(c)
(d)
Reserve Problems Chapter 11 Section 2 Problem 7
An article in Wear (1992, Vol. 152, pp. 171-181) presents data on the fretting wear of mild steel
and oil viscosity. Representative data follow with x = oil viscosity and y = wear volume (10–4
cubic millimeters).
y
240
181
193
155
172
110
113
75
94
x
1.6
9.4
15.5
20.0
22.0
35.5
43.0
40.5
33.0
(a) Construct a scatter plot of the data. Does a simple linear regression model appear to be
plausible?
(b) Fit the simple linear regression model using least squares. Find an estimate of
2
.
(c) Predict fretting wear when viscosity x = 30.
(d) Obtain the fitted value of y when x = 22.0 and calculate the corresponding residual.
SOLUTION
(a)
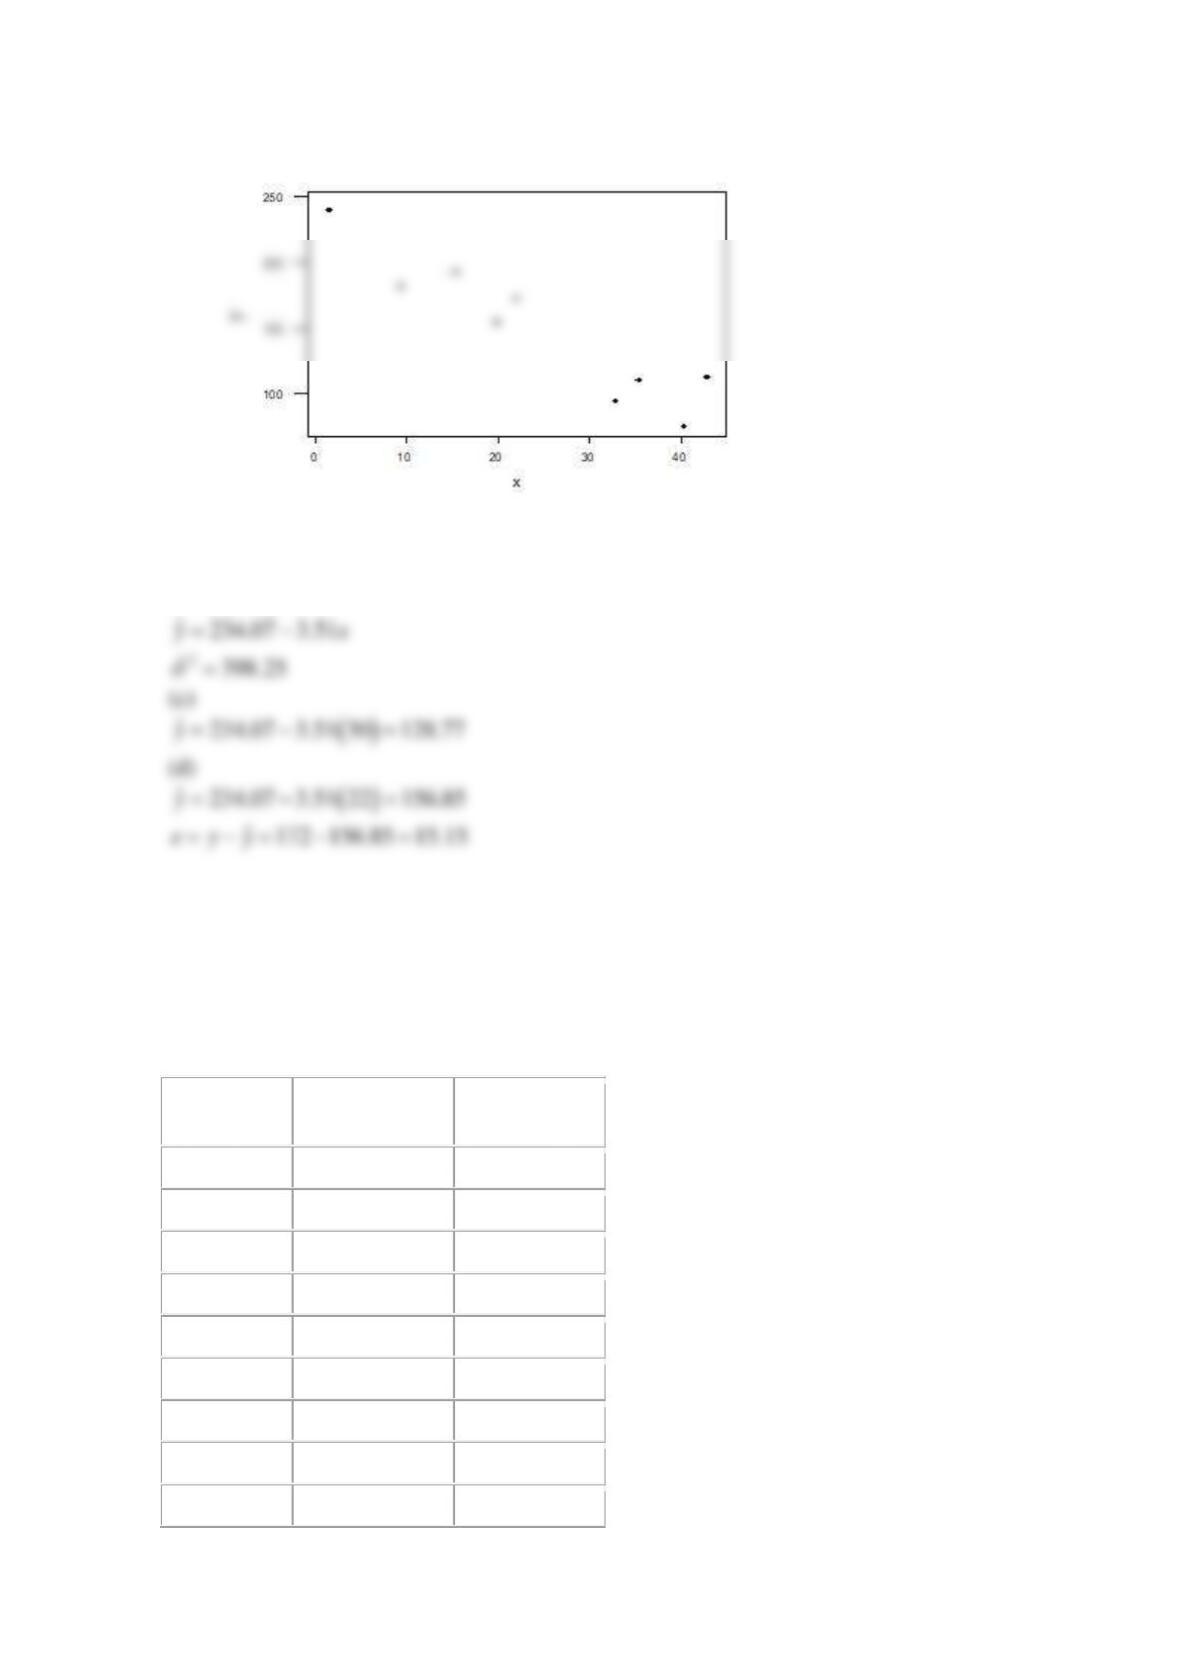
Yes, a linear regression model appears to be plausible.
(b)
01
ˆˆ
ˆ
yx
=+
Reserve Problems Chapter 11 Section 2 Problem 8
A rocket motor is manufactured by bonding together two types of propellants, an igniter and a
sustainer. The shear strength of the bond y is thought to be a linear function of the age of the
propellant x when the motor is cast. The following table provides 20 observations.
Observation
number
Strength y (psi)
Age x (weeks)
1
2158.70
15.50
2
1678.15
23.75
3
2316.00
8.00
4
2061.30
17.00
5
2207.50
5.00
6
1708.30
19.00
7
1784.70
24.00
8
2575.00
2.50
9
2357.90
7.50
10
2277.70
11.00
11
2165.20
13.00
12
2399.55
3.75
13
1779.80
25.00
14
2336.75
9.75
15
1765.30
22.00
16
2053.50
18.00
17
2414.40
6.00
18
2200.50
12.50
19
2654.20
2.00
20
1753.70
21.50
(a) Draw a scatter diagram of the data. Does the straight-line regression model seem to be
plausible?
(b) Find the least squares estimates of the slope and intercept in the simple linear regression
model.
Find an estimate of
2
.
(c) Estimate the mean shear strength of a motor made from propellant that is 20 weeks old.
SOLUTION
(a)
Yes, a simple linear regression model seems plausible for this situation.
(b)

(c)
Reserve Problems Chapter 11 Section 2 Problem 9
In an article in Statistics and Computing [“An Iterative Monte Carlo Method for Nonconjugate
Bayesian Analysis” (1991, pp. 119-128)], Carlin and Gelfand investigated the age (x) and length
(y) of 27 captured dugongs (sea cows).
x
y
1.0
1.80
1.5
1.85
1.5
1.87
1.5
1.77
2.5
2.02
4.0
2.27
5.0
2.15
5.0
2.26
7.0
2.47
8.0
2.19
8.5
2.26
9.0
2.40
9.5
2.39
9.5
2.41
10.0
2.50
12.0
2.32
12.0
2.32
13.0
2.43
13.0
2.47
14.5
2.56
15.5
2.65
15.5
2.47
16.5
2.64
17.0
2.56
22.5
2.70
29.0
2.72
31.5
2.57
(a) Find the least squares estimates of the slope in the simple linear regression model.
Find the least squares estimates of the intercept in the simple linear regression model.
Find an estimate of
2
.
(b) Estimate the mean length of dugongs at age 11.
(c) Plot
ˆi
y
versus
i
y
, is the linear relationship between length and age deterministic (low error)?
SOLUTION
(a)
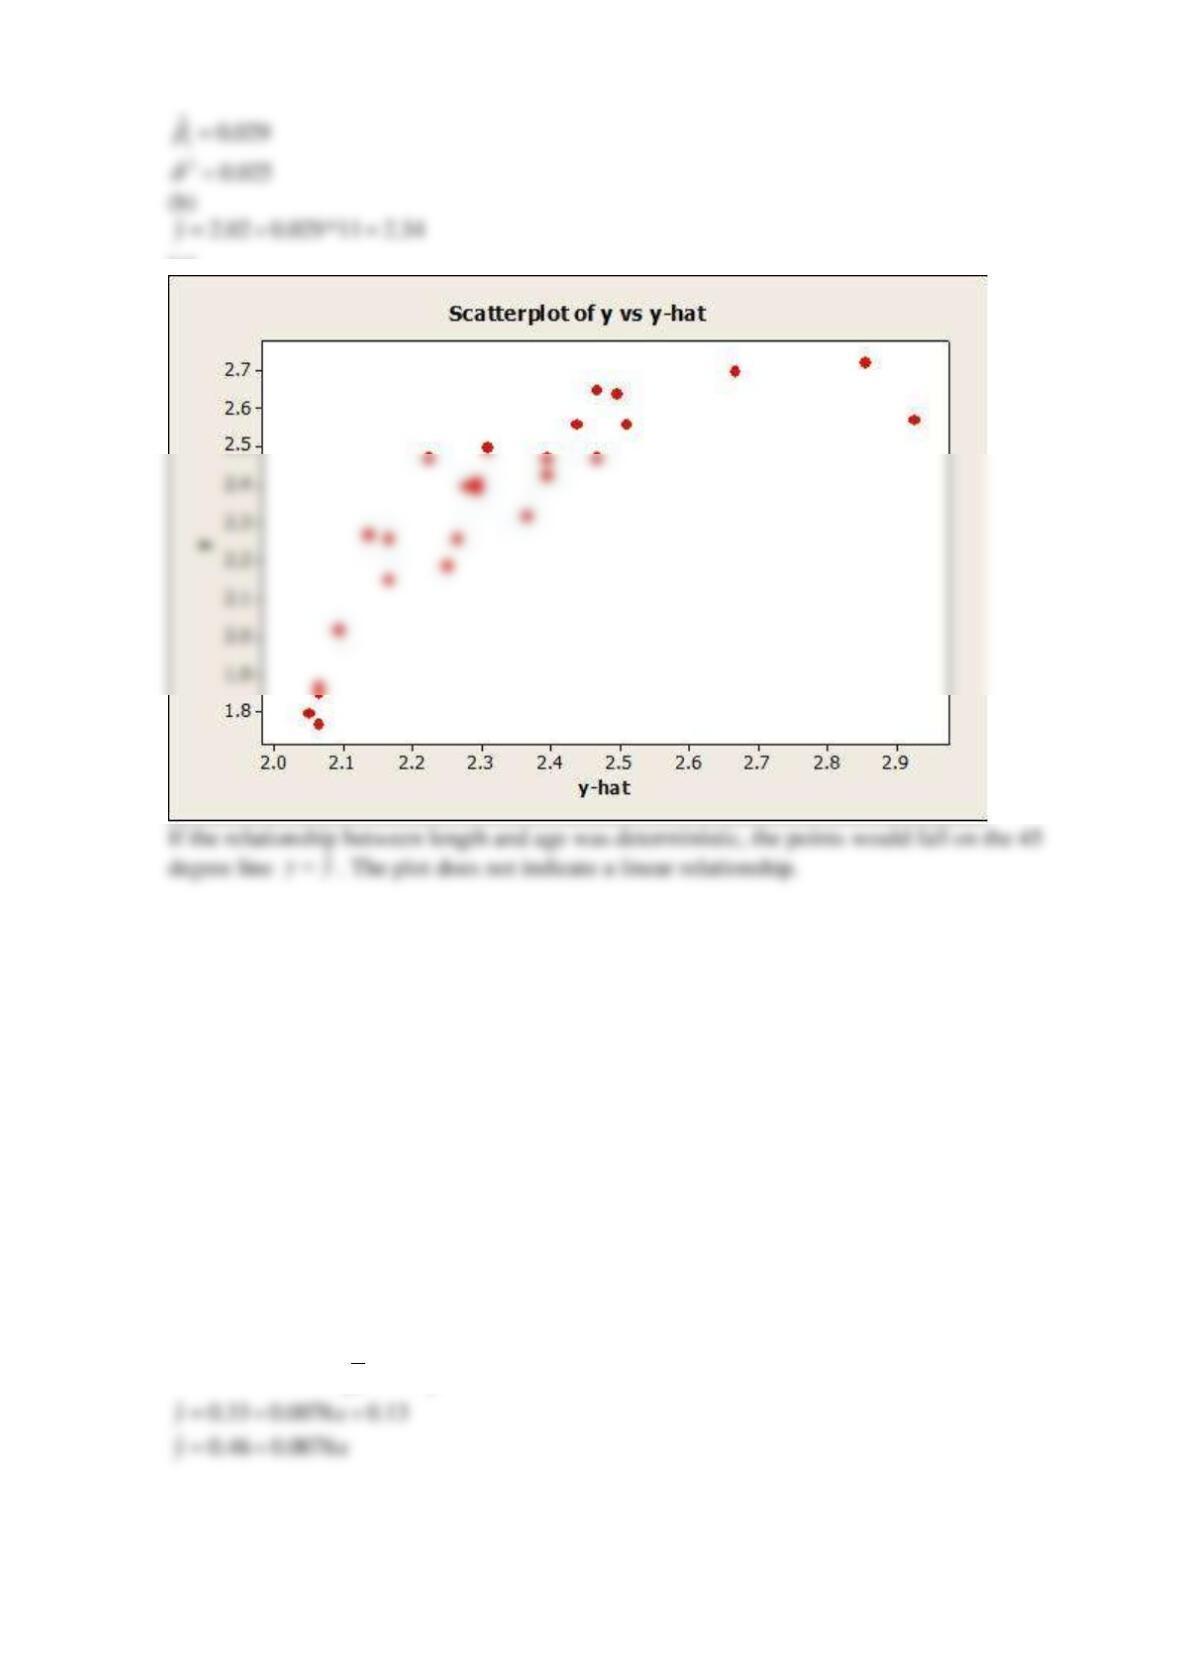
(c)
Reserve Problems Chapter 11 Section 2 Problem 10
Regression methods were used to analyze the data from a study investigating the relationship
between roadway surface temperature (x) and pavement deflection (y). The simple linear
regression model is
ˆ0.33 0.0042yx=+
.
(a) Suppose that temperature is measured in °C rather than °F. Write the new regression model.
(b) What change in expected pavement deflection is associated with a 1°C change in surface
temperature?
SOLUTION
(a)
9
0.33 0.0042 32
ˆ5
yx
= + +
(b)

Reserve Problems Chapter 11 Section 2 Problem 11
Suppose that we wish to fit a regression model for which the true regression line passes through
the point (0, 0). The appropriate model is
Yx
=+
. Assume that we have n pairs of data
( ) ( ) ( )
1 1 2 2
, , , ,…, ,
nn
x y x y x y
.
(a) Find the least squares estimate of
.
(b) An article in the Journal of Environmental Engineering (1989, Vol. 115(3), pp. 608-619)
reported the results of a study on the occurrence of sodium and chloride in surface streams in
central Rhode Island. The following data are chloride concentration y (in milligrams per liter)
and roadway area in the watershed x (in percentage).
y
x
4.4
0.19
6.6
0.15
9.7
0.57
10.6
0.70
10.8
0.67
10.9
0.63
11.8
0.47
12.1
0.70
14.3
0.60
14.7
0.78
15.0
0.81
17.3
0.78
19.2
0.69
23.1
1.30
27.4
1.05
27.7
1.06
31.8
1.74
39.5
1.62
Fit the model
Yx
=+
to these data.
SOLUTION
(a)
The least squares estimate mimimizes
( )
2
ii
iyx
−
. Upon setting the derivative equal to zero,
(b)
Reserve Problems Chapter 11 Section 4 Problem 1
According to the nutrition research, recommendation on the consumption of fiber for children
and teenagers is the following (y is the amount of fiber per day (in grams), x is the age):
y
21
24
26
28
29
31
33
37
37
x
2
4
6
8
10
12
14
16
18
(a) Test for the significance of regression using the analysis of variance with
0.01
=
. Can you
conclude that the model specifies a useful linear relationship between these two variables?
(b) Estimate
2
.
(c) Estimate the standard error of the slope and intercept in this model.
SOLUTION
(a)
266
i
i
y=
,
90
i
i
x=
,
29.56y=
,
10x=
,
8) Because
397.89 12.25
, we reject the null hypothesis at
0.01
=
. We can therefore conclude
that the model specifies a useful linear relationship at
0.01
=
.
Reserve Problems Chapter 11 Section 4 Problem 2
A runner was tested on a treadmill. During the test, his speed x (in km/h) and his heart rate y
were measured. The results are shown in the table.
y
122
132
145
161
178
190
x
8
10
12
14
16
18
(a) Test for the significance of regression using the analysis of variance with
0.05
=
. Find the
P-value for this test. Can you conclude that the model specifies a useful linear relationship
between these two variables?
(b) Estimate
2
.
(c) Estimate the standard error of the slope and intercept in this model.
(d) Test the hypothesis that the increase in the speed of 1 km/h results in the runner’s heart rate
average increase of 7 points at
0.05
=
. Suppose that the alternative hypothesis is that the
average increase of the runner’s heart rate in this situation does not equal 7 points.
SOLUTION
(a)
928
i
y=
,
77
i
x=
,
154.66y=
,
12.83x=
,
(b)
(c)
(d)
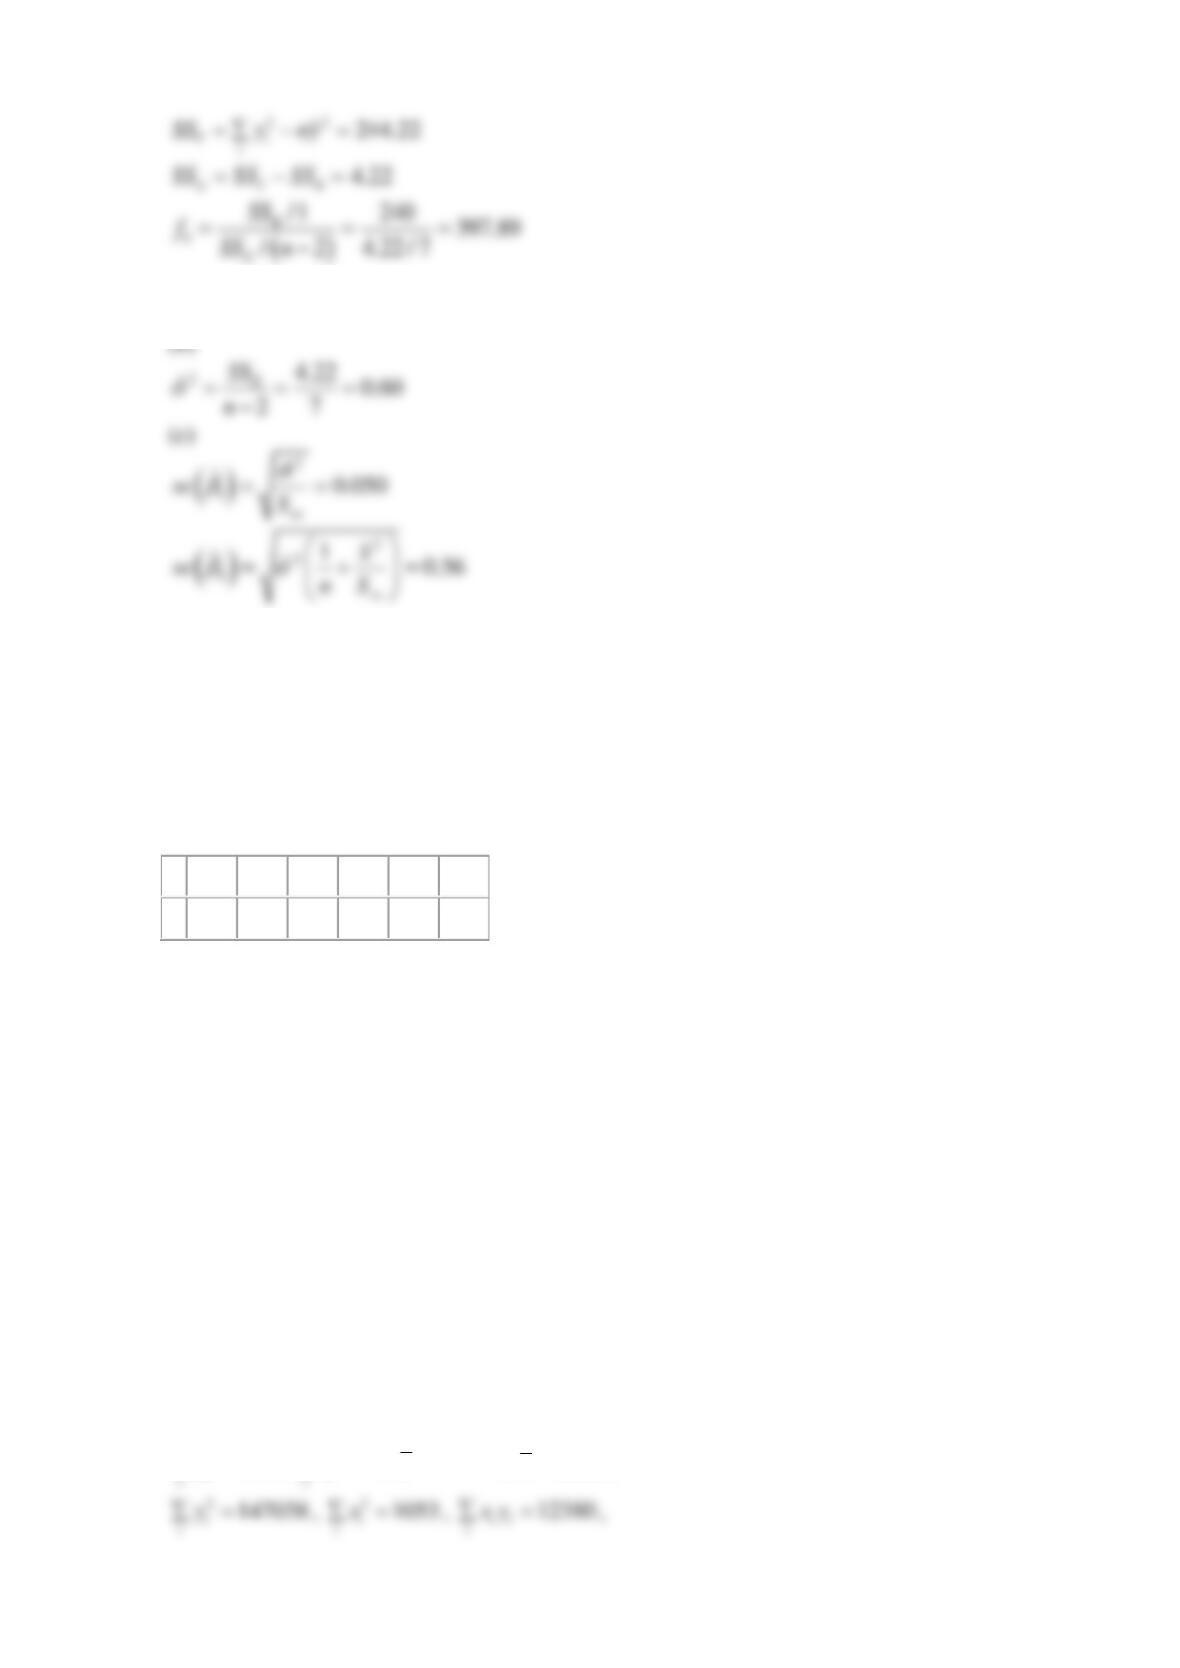
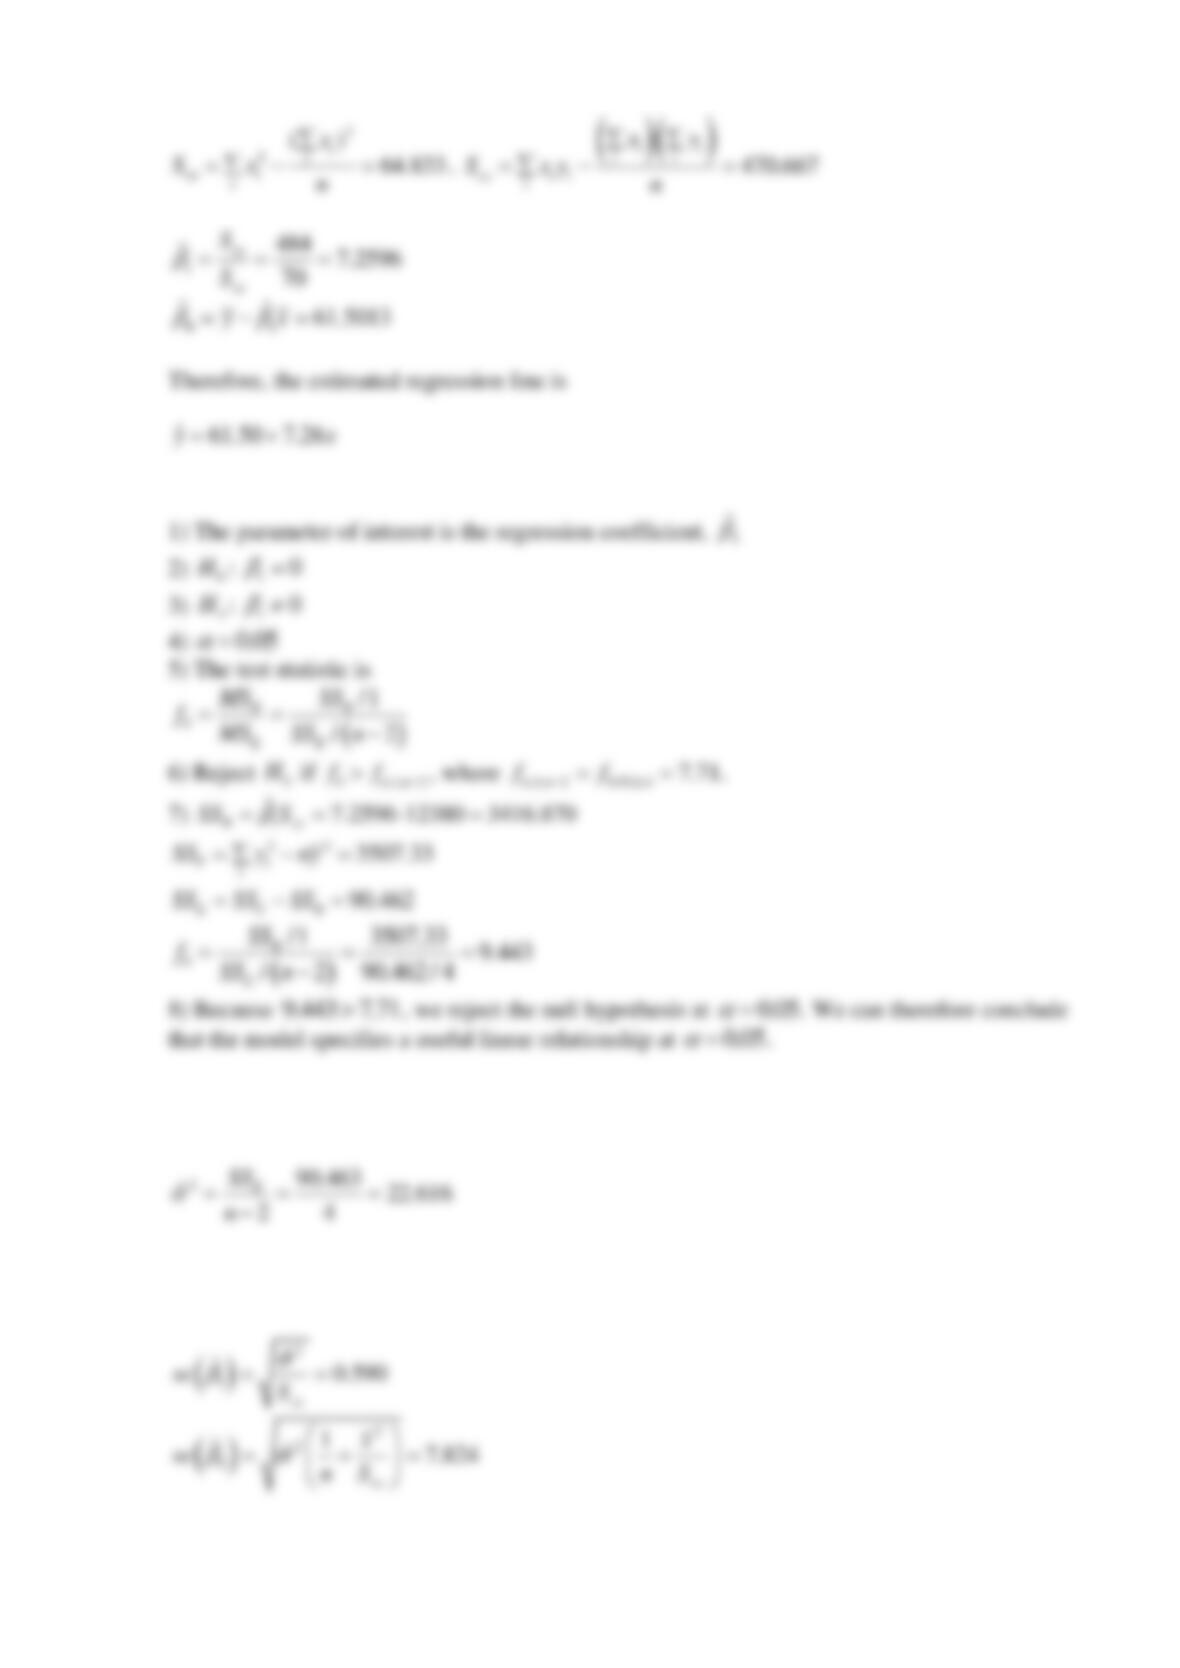
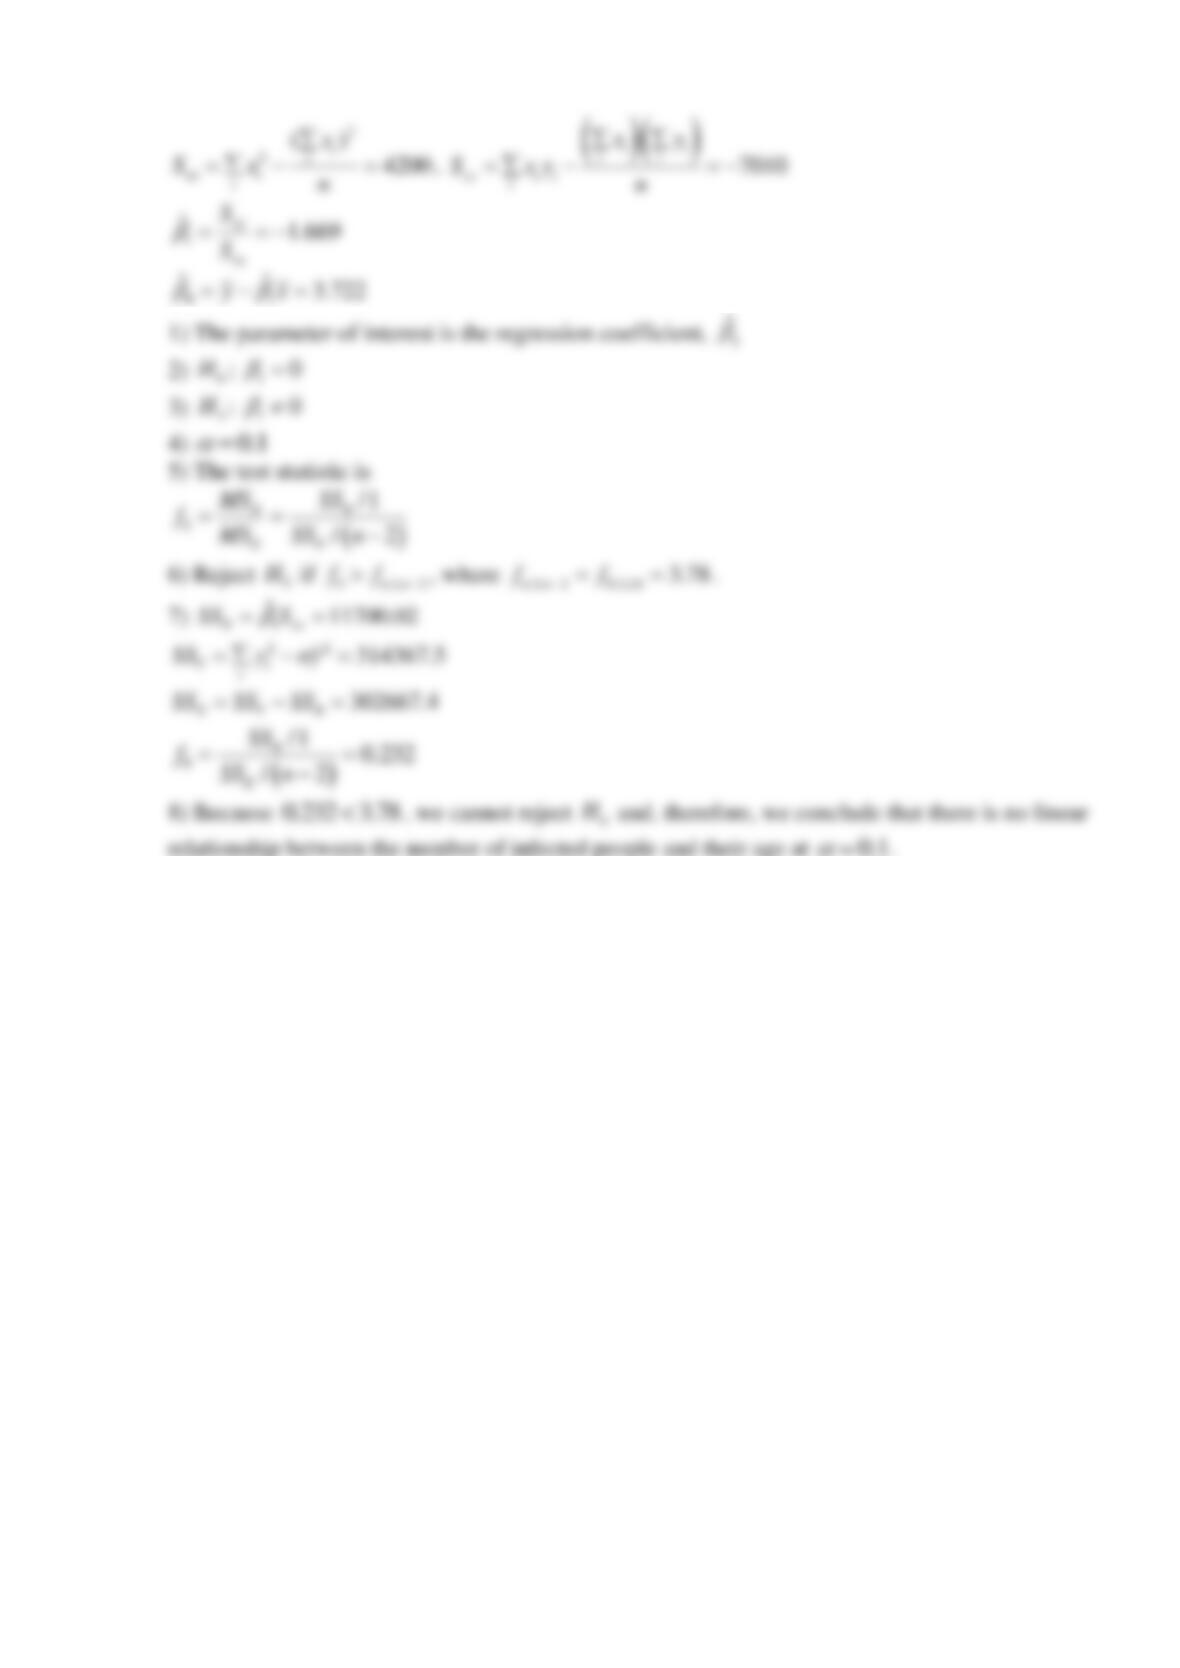
1) The parameter of interest is the regression coefficient,
1
ˆ
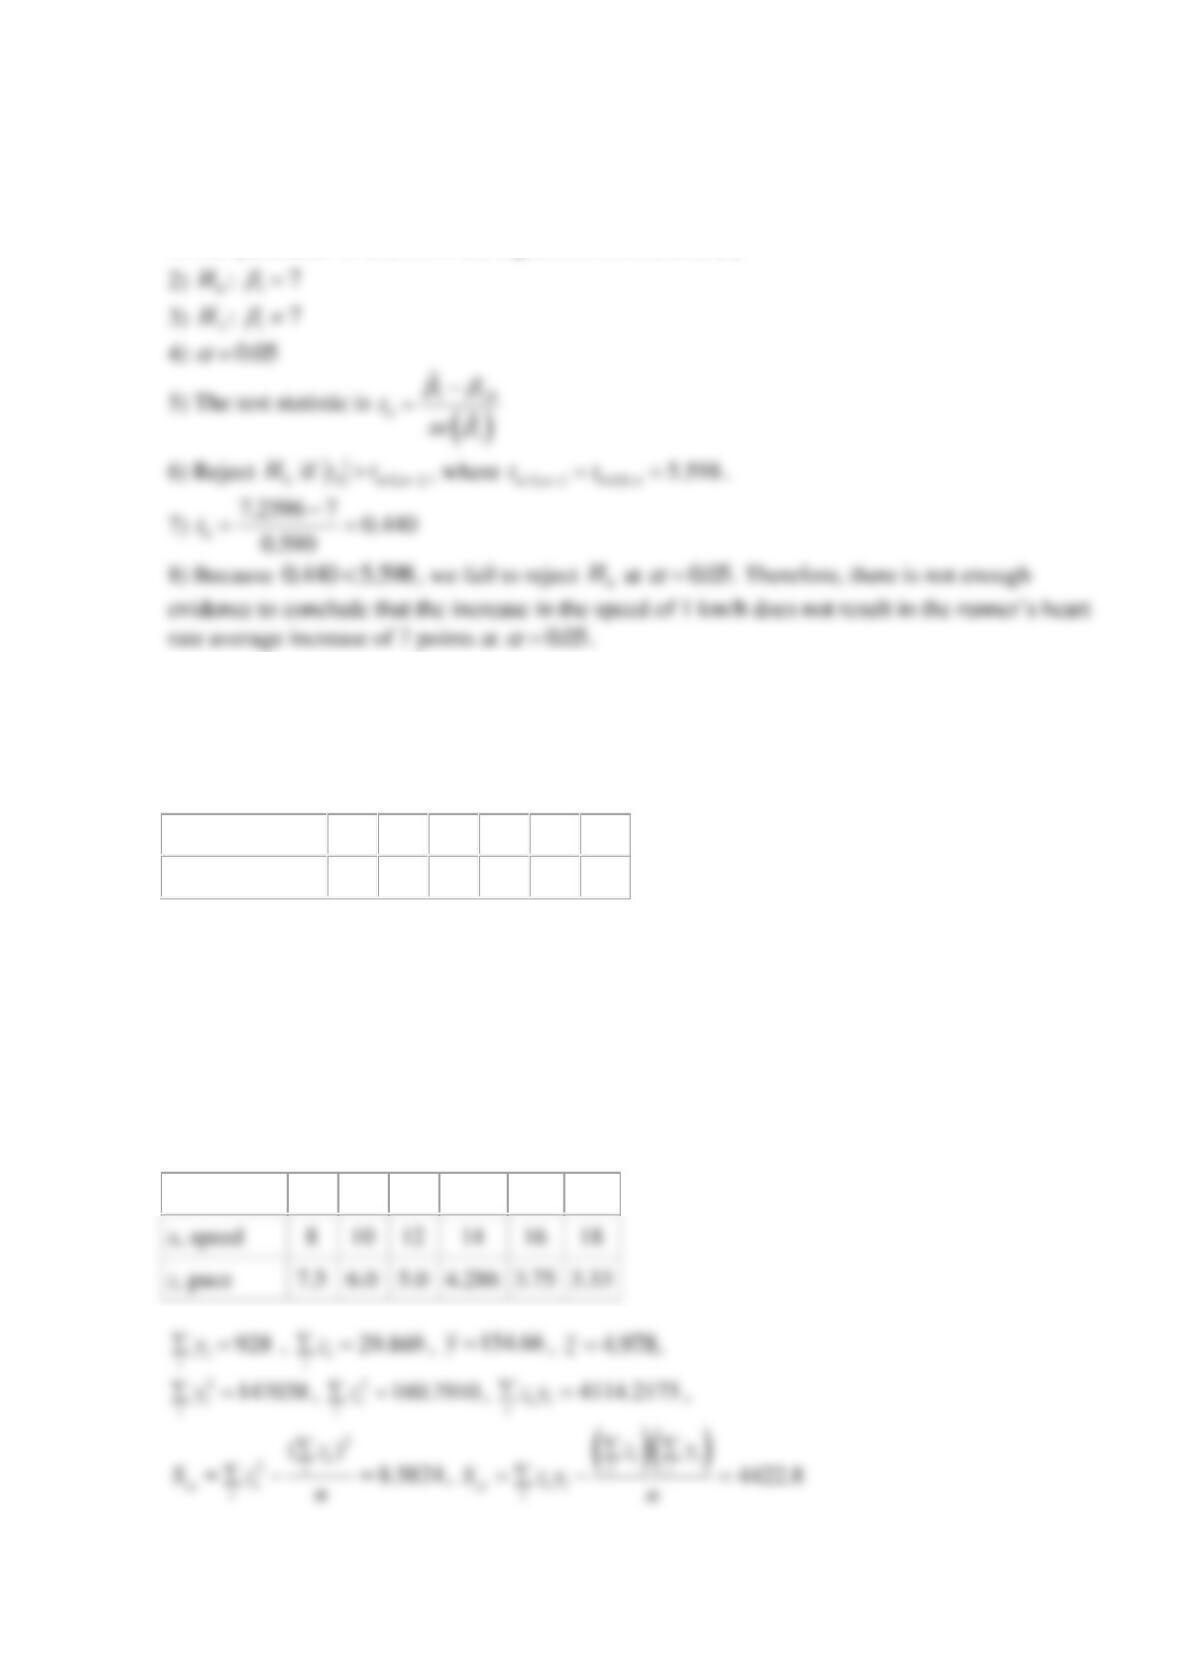
Reserve Problems Chapter 11 Section 4 Problem 3
Consider the runner’s treadmill test. Suppose that his pace (the inverse value of speed, the units
are minutes per kilometer) was measured instead of speed.
Heart rate, y
122
132
145
161
178
190
Speed, x (km/h)
8
10
12
14
16
18
At which level of significance can we conclude that the increase in the pace of 1 minute per
kilometer results in the runner’s heart rate average decrease of 13 points? Suppose that the
alternative hypothesis is that the average decrease in the runner’s heart rate in this situation does
not equal 13 points.
SOLUTION
The new table with the calculated values of pace is represented below.
y, heart rate
122
132
145
161
178
190
x, speed
8
10
12
16
18
7.5
6.0
5.0
4.286
3.75
3.33
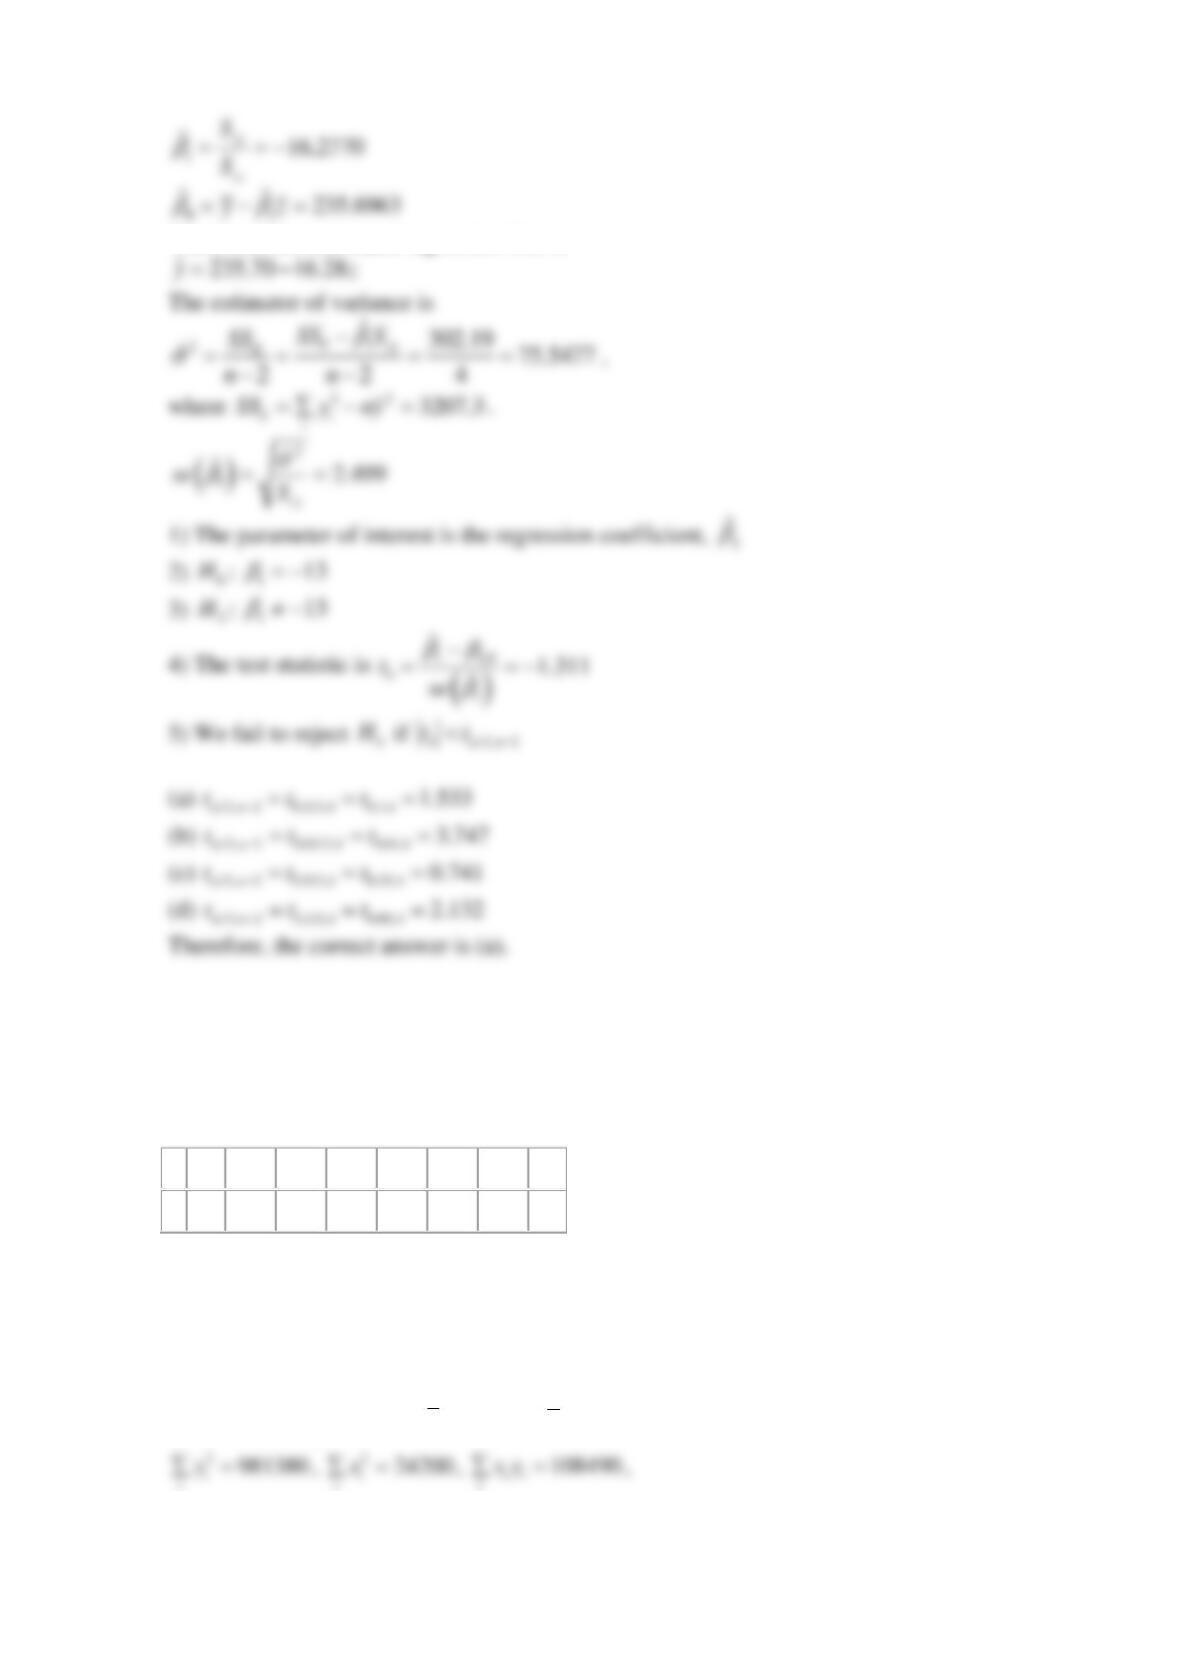
Therefore, the estimated regression line is
Reserve Problems Chapter 11 Section 4 Problem 4
The department of health studied the amount of reported hepatitis C cases in a country. The
following data are the number of infected people y in the sample and their age x:
y
9
308
512
549
470
285
139
39
x
15
25
35
45
55
65
75
85
Test for the significance of regression using the analysis of variance at
0.1
=
.
Find the test statistic. Find the critical value for the test statistic.
SOLUTION
2310
i
i
y=
,
400
i
i
x=
,
288.75y=
,
50x=
,
Reserve Problems Chapter 11 Section 4 Problem 5
The regression of weight (y) in lbs on age (x) is
177.63 0
ˆ.01yx=+
,
ˆ27.09
=
,
1.3
ˆ0 1 4se
=
.
Suppose that weight is measured in kg instead of lbs.
(a) How will the estimates of the slope and intercept change?
(b) Estimate the error standard deviation.
(c) Estimate the standard deviation of the slope.
(d) What is the value of the t-statistic for the slope?
(e) Test the hypothesis that
10
=
at
0.05
=
. What is the P-value for this test?
SOLUTION
(a)
Because the y‘s are divided by 2.20462 pounds, the intercept and slope are divided by the same
value.
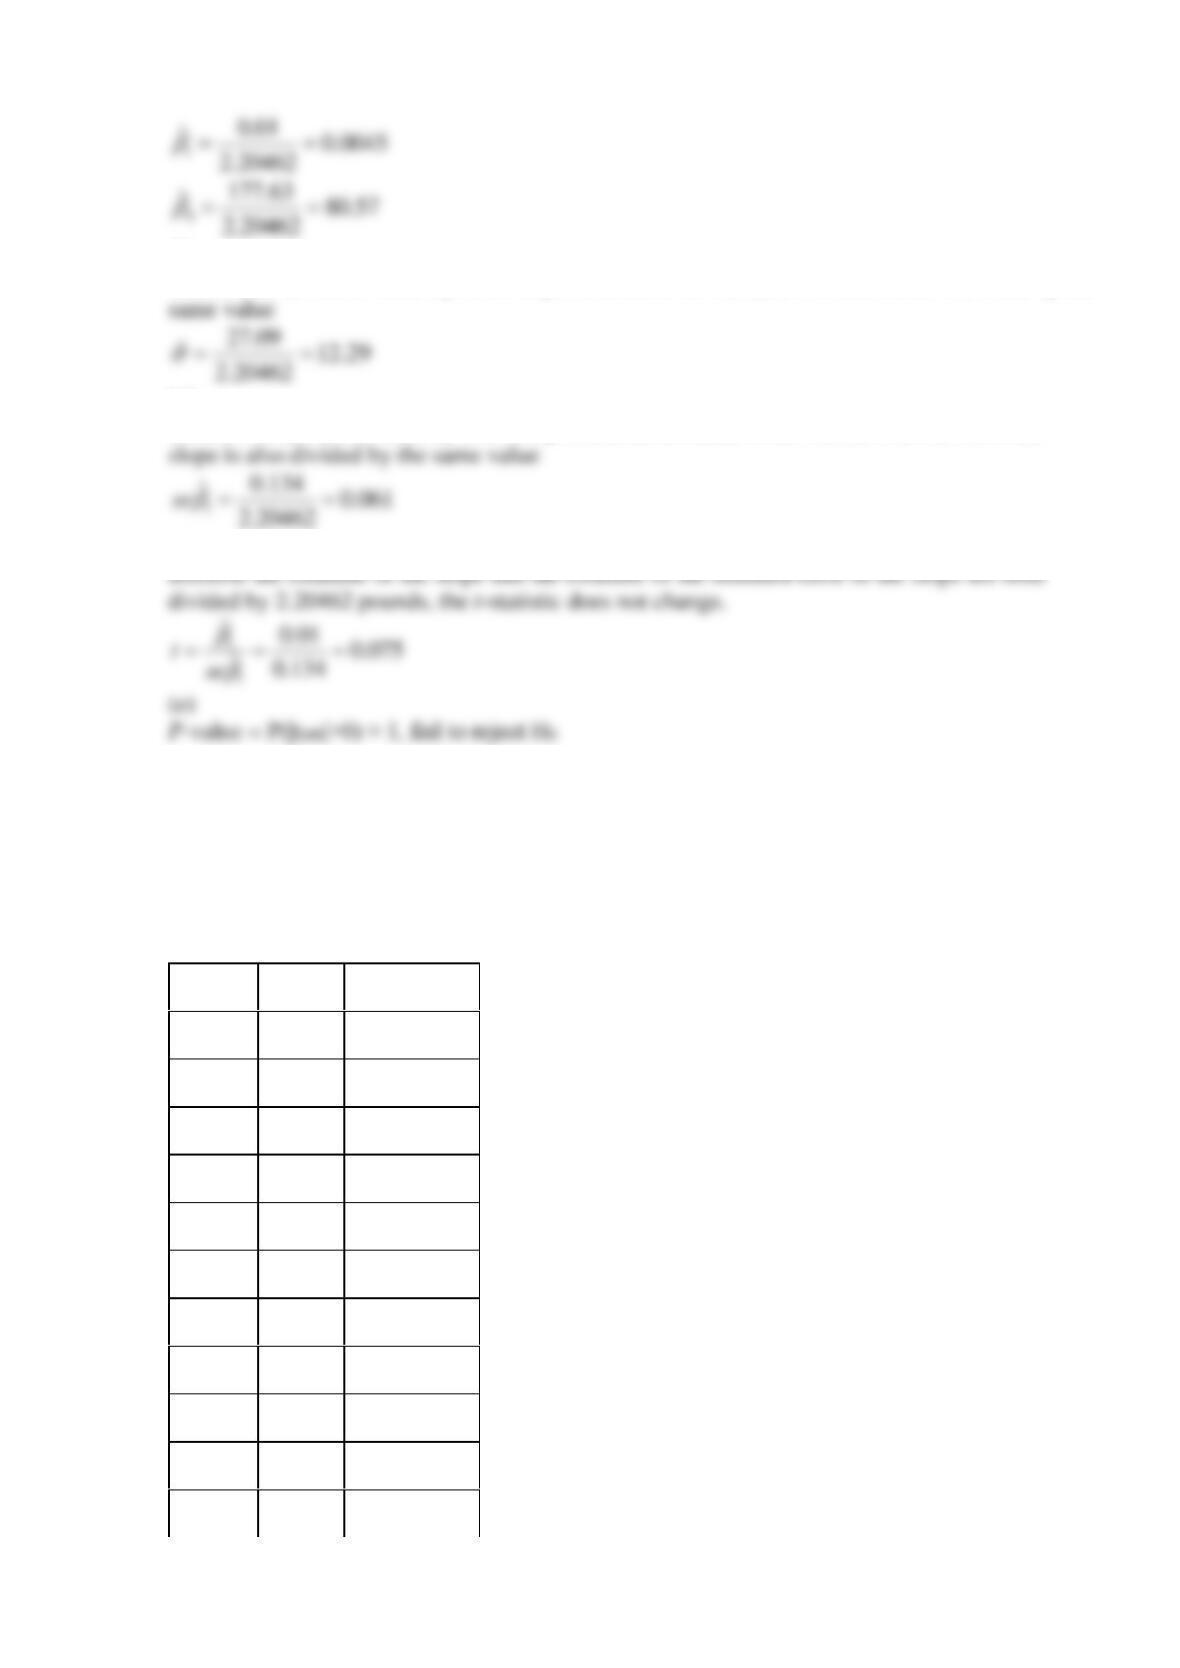
(b)
Because the y‘s are divided by 2.20462 pounds, the error standard deviation is also divided by the
(c)
Because the y’s are divided by 2.20462 pounds, the estimate of the standard deviation of the
(d)
Reserve Problems Chapter 11 Section 4 Problem 6
The number of pounds of steam used per month by a chemical plant is thought to be related to
the average ambient temperature (in °F) for that month. The past year’s usage and temperatures
are in the following table:
Month
Temp.
Usage/1000
Jan.
21
185.79
Feb.
24
214.47
Mar.
32
288.03
Apr.
47
424.84
May
50
454.58
June
59
539.03
July
68
621.55
Aug.
74
675.06
Sept.
62
562.03
Oct.
50
452.93
Nov.
41
369.95
Dec.
30
273.98
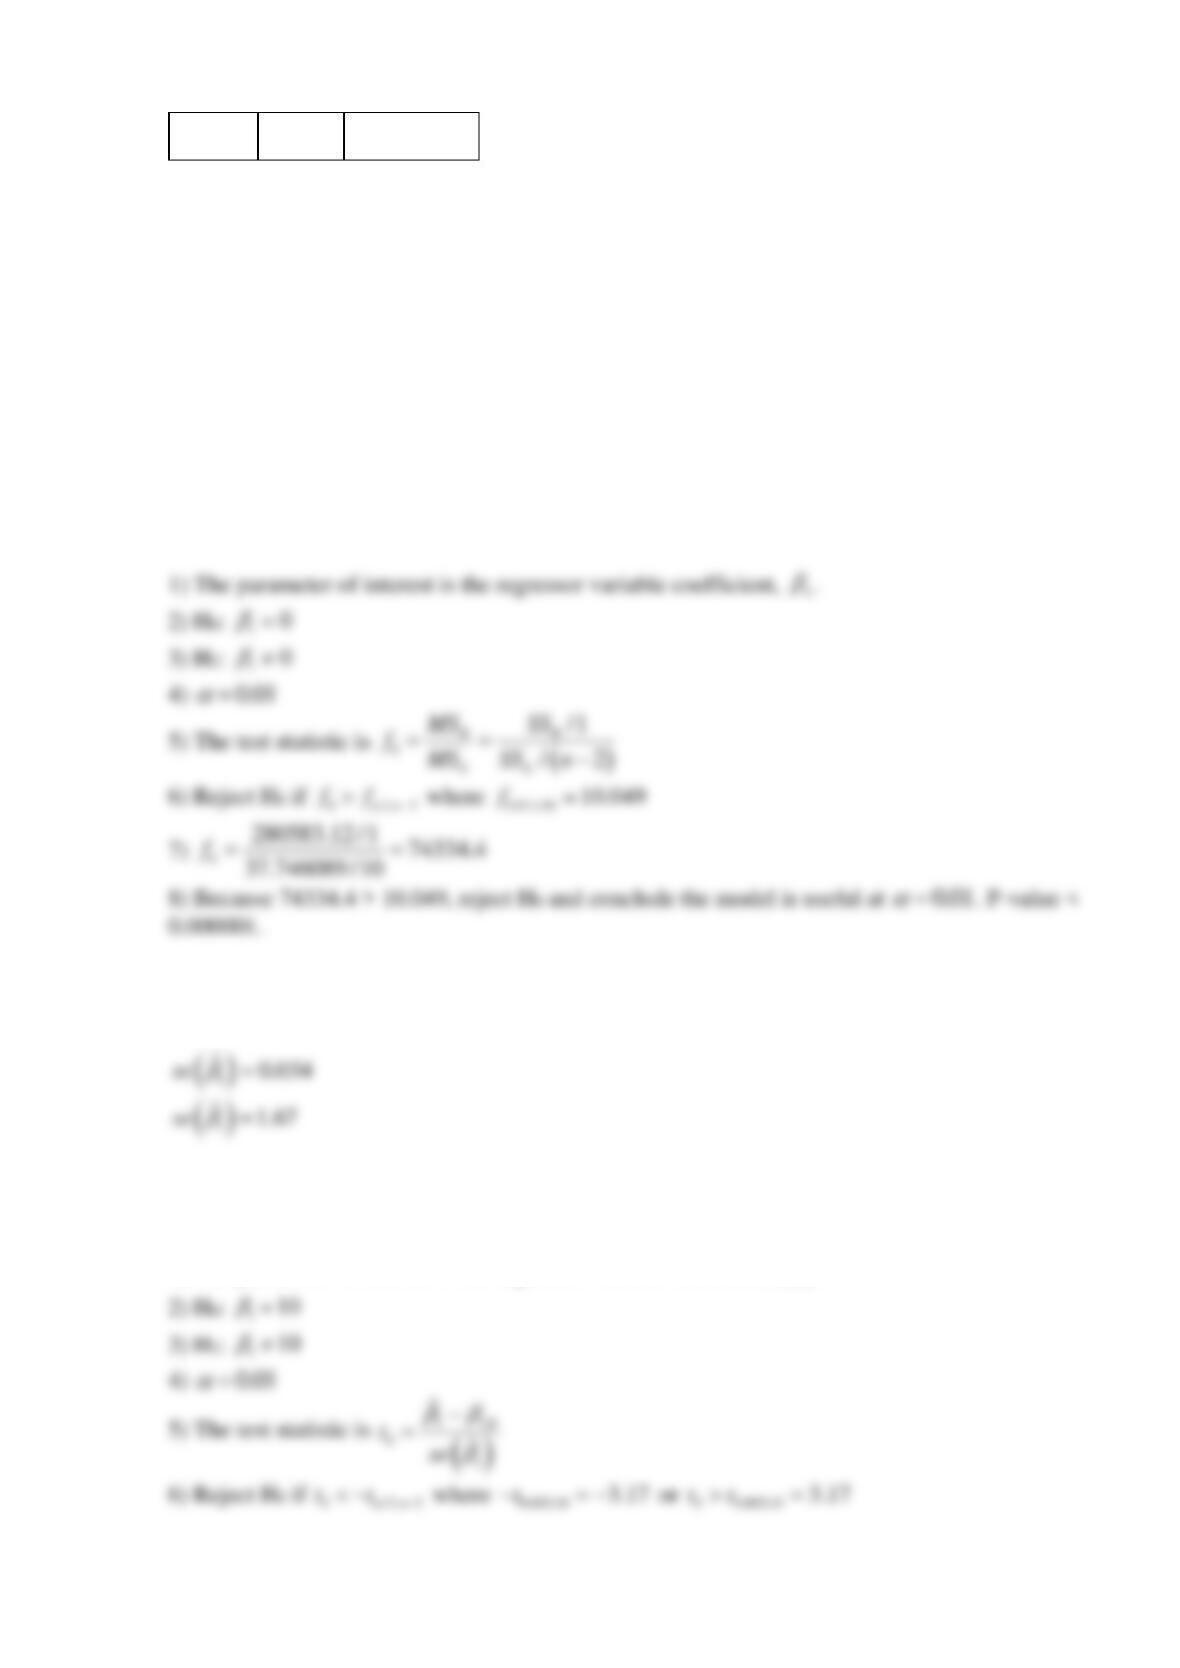
(a) Test for significance of regression using
0.01
=
. What is the P-value for this test? State the
conclusions that result from this test.
(b) Estimate the standard errors of the slope and intercept.
(c) Test the hypothesis
01
: 10H
=
versus
11
: 10H
using
0.01
=
.
(d) Test the hypothesis
00
:0H
=
versus
10
:0H
using
0.01
=
.
SOLUTION
(a)
(b)
(c)
1) The parameter of interest is the regressor variable coefficient,
1
.
0.01
=
1
0.01
=
0.01
=

Reserve Problems Chapter 11 Sections 5 and 6 Problem 1
See the table for data on the ratings of quarterbacks for the 2008 National Football League
season (The Sports Network).
Yards per attempt
Rating points
8.39
105.5
7.67
97.4
7.66
96.9
7.98
96.2
7.21
95
7.53
93.8
8.01
92.7
7.66
91.4
7.21
90.2
7.16
89.4
7.93
87.7
7.10
87.5
6.33
87
6.76
86.4
6.86
86.4
7.35
86
7.22
85.4
7.94
84.7
6.41
84.3
6.77
81.7
6.65
81
6.94
80.3
6.45
80.2
7.04
80.1
6.39
79.6
6.58
77.1
6.21
76
7.17
73.7
6.34
72.6
6.18
71.4
5.12
70