CHAPTER 10
Section 10.1
10.1.1 a)
1) The parameter of interest is the difference in means μ1 – μ2. Note that 0 = 0.
7) Conclusion: Because –1.96 < –0.9 < 1.96, do not reject the null hypothesis. There is not sufficient evidence to
c)
10.1.2 a)
4) The test statistic is
7) Conclusion: Because –1.96 < 0.801 < 1.96, fail to reject the null hypothesis. There is not sufficient evidence to
conclude that the two machine fill volumes differ at = 0.05.
c)
10.1.3 a)
1) The parameter of interest is the difference in mean burning rate, μ1 – μ2
6)
=
118x
=
224x
1= 3
2= 3
10.1.4 a)
7) Conclusion: Because − 1.90 < −1.853 reject the null hypothesis and conclude the process change has increased the
mean by less than 10.
10.1.5 1) The parameter of interest is the difference in means μ1 – μ2. Note that 0 = 0.
2) H0 : μ1 – μ2 = 0 or μ1 = μ2
Section 10.2
10.2.1 a)
=
10.94x
=
=22
=22
n1 = 12 n2 = 16
10.2.2 a) 1) The parameter of interest is the difference in mean, μ1 – μ2
7) Conclusion: Because −3.75 < −2.048, reject the null hypothesis at = 0.05.
b) 95% confidence interval: t0.025,28 = 2.048
c) ∆ = 3 Usesp as an estimate of .
10.2.3 a)
1) The parameter of interest is the difference in mean rod diameter, μ1 − μ2
5) Reject the null hypothesis if
+−
− 12
/2, 20 nn
t t
where −t0.025,30 = −2.042 or
+−
12
/2, 20 nn
t t
where t0.025,30 = 2.042 for
= 0.05
7) Conclusion: Because −2.042 < 0.230 and 0.230 < 2.042, fail to reject the null hypothesis. There is insufficient
evidence to conclude that the two machines produce different mean diameters at = 0.05.
10.2.4 a)
1) The parameter of interest is the difference in means, μ1 – μ2, with 0 = 0
6)
7) Conclusion: Because 1.93 > 1.714, reject the null hypothesis at the 0.05 level of significance.
10.2.5 a) 1) The parameter of interest is the difference in mean catalyst yield, μ1 – μ2, with 0 = 0
7) Conclusion: Because −3.11 <−2.485, reject the null hypothesis and conclude that the mean yield of catalyst 2
10.2.6 a) 1) The parameter of interest is the difference in mean impact strength, μ1 – μ2, with 0 = 0
6)
=
1290x
=
2321x
7) Conclusion: Because −4.64 <−1.714 reject the null hypothesis and conclude that supplier 2 provides gears with
higher mean impact strength at the 0.05 level of significance.
5) Reject the null hypothesis if t0 > t, = 1.714 for = 0.05 where
7) Conclusion: Because 0.898 < 1.714, fail to reject the null hypothesis. There is insufficient evidence to conclude that t
10.2.7
a)
1) The parameter of interest is the difference in mean width of the backside chip-outs for the single spindle saw process
5) Reject the null hypothesis if
+−
− 12
/2, 20 nn
t t
where −t0.025,28 = −2.048 or
+−
12
/2, 20 nn
t t
7) Conclusion: Because 7.00 > 2.048, we reject the null hypothesis at = 0.05. P-value 0
10.2.8 a)
1) The parameter of interest is the difference in mean speed, μ1 – μ2, 0 = 0
5) Reject the null hypothesis if
+−
12
0,2nn
t t
where t0.10,14 = 1.345 for = 0.10
7) Because 1.79 > 1.345 reject the null hypothesis and conclude that reducing the film thickness from 25 mils to 20
10.2.9 a)
1) The parameter of interest is the difference in mean number of periods in a sample of 200 trains for two different
levels of noise voltage, 100mv and 150mv
6)
10.2.10 a)
1) The parameter of interest is the difference in mean blood pressure between the test and control groups,
4) The test statistic is
6)
=
190x
=
2115x
7) Conclusion: Because −6.63 < −1.782 reject the null hypothesis and conclude that the test group has higher mean
arterial blood pressure than the control group at the 0.05 level of significance.
c)
1) The parameter of interest is the difference in mean blood pressure between the test and control groups, μ1 − μ2, with
5) Reject the null hypothesis if t0 < −t
,
where t0.05,12 = −1.782 for = 0.05 since
6)
=
190x
=
2115x
d) 95% confidence interval: t0.05, 12 = 1.782
10.2.11
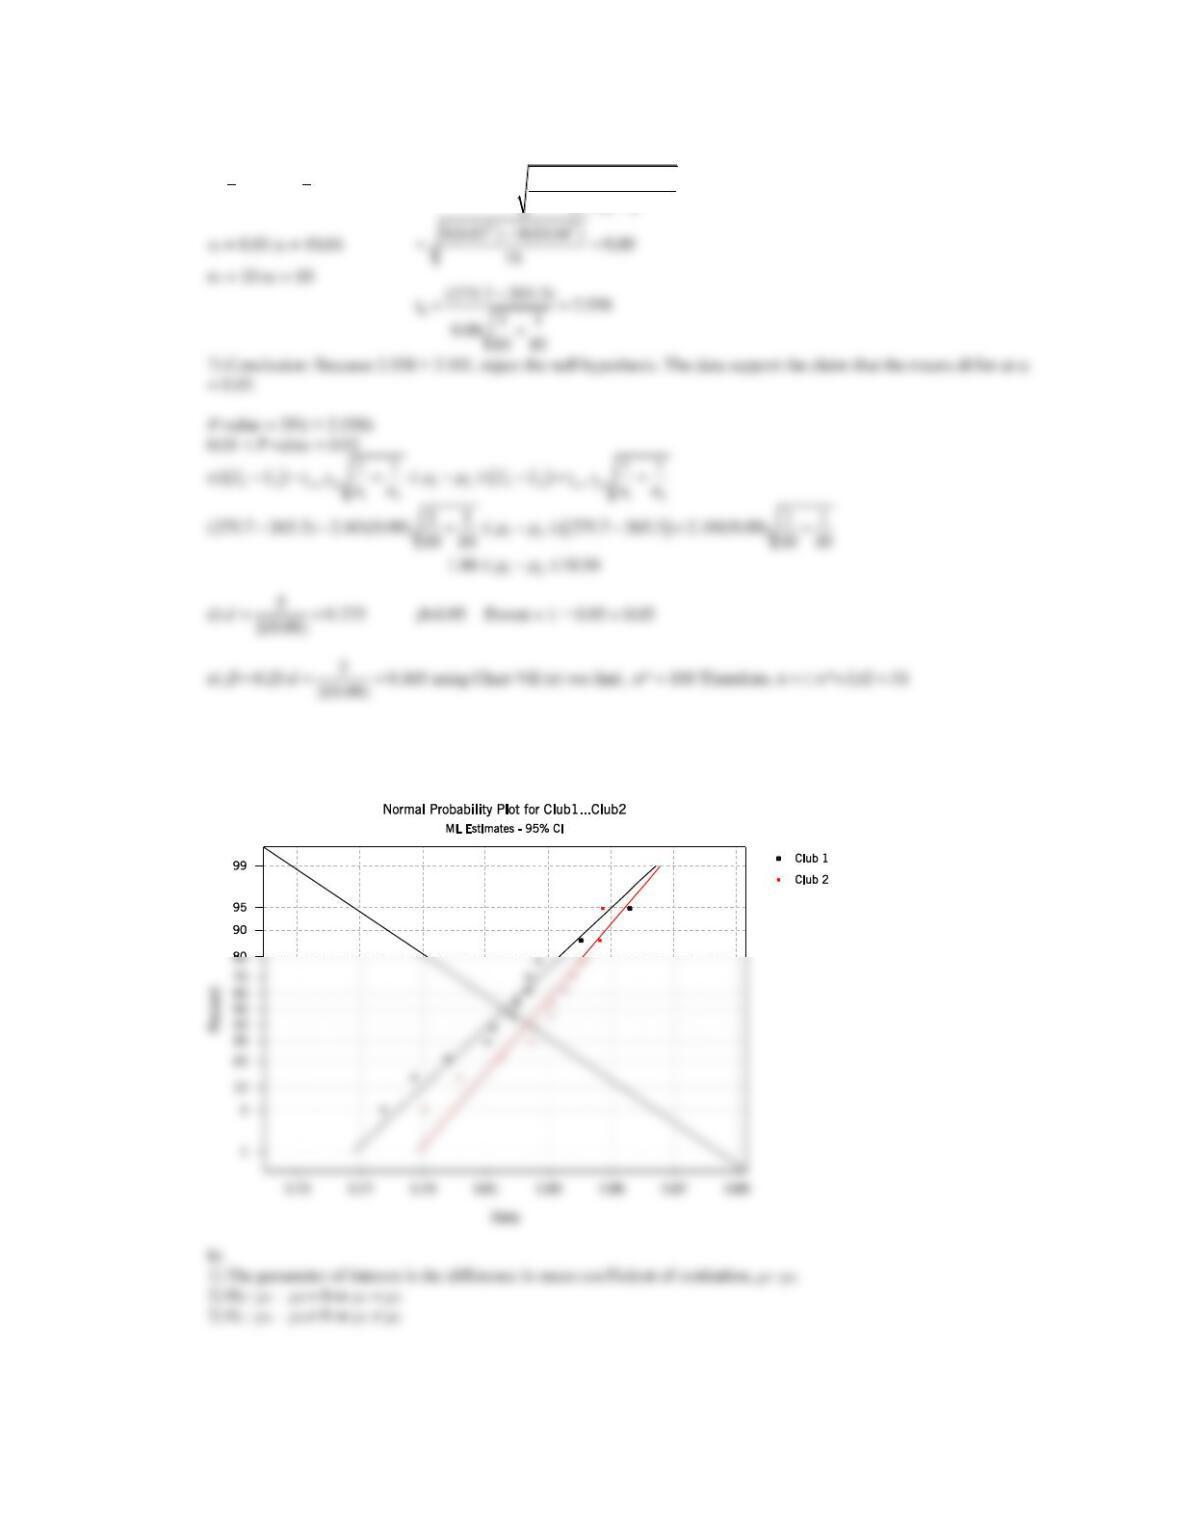
a) The data appear to be normally distributed and the variances appear to be approximately equal. The slopes of the
lines on the normal probability plots are almost the same.
b)
1) The parameter of interest is the difference in mean overall distance, μ1 − μ2, with 0 =0
5) Reject the null hypothesis if
+−
− 12
/2, 20 nn
t t
or
+−
12
/2, 20 nn
t t
where t0.025,18 = 2.101 for = 0.05
6)
=
1275.7x
=
2265.3x
− + −
=+−
22
1 1 2 2
( 1) ( 1)
2
p
n s n s
snn
10.2.12
a) The data appear to be normally distributed and the variances appear to be approximately equal. The slopes of the
lines on the normal probability plots are almost the same.
4) The test statistic is
7) Conclusion: Because –1.367 > –2.074 fail to reject the null hypothesis. The data do not support the claim that there
is a difference in the mean coefficients of restitution for club1 and club2 at = 0.05
10.2.13 a)
1) The parameter of interest is the difference in mean cycles to failure, μ1 − μ2, with 0 = 0
5) Reject the null hypothesis if
+−
− 12
/2, 20 nn
t t
where − t0.025,18 = −2.101 or
+−
12
/2, 20 nn
t t
where t0.025,18 = 2.101 for
= 0.05
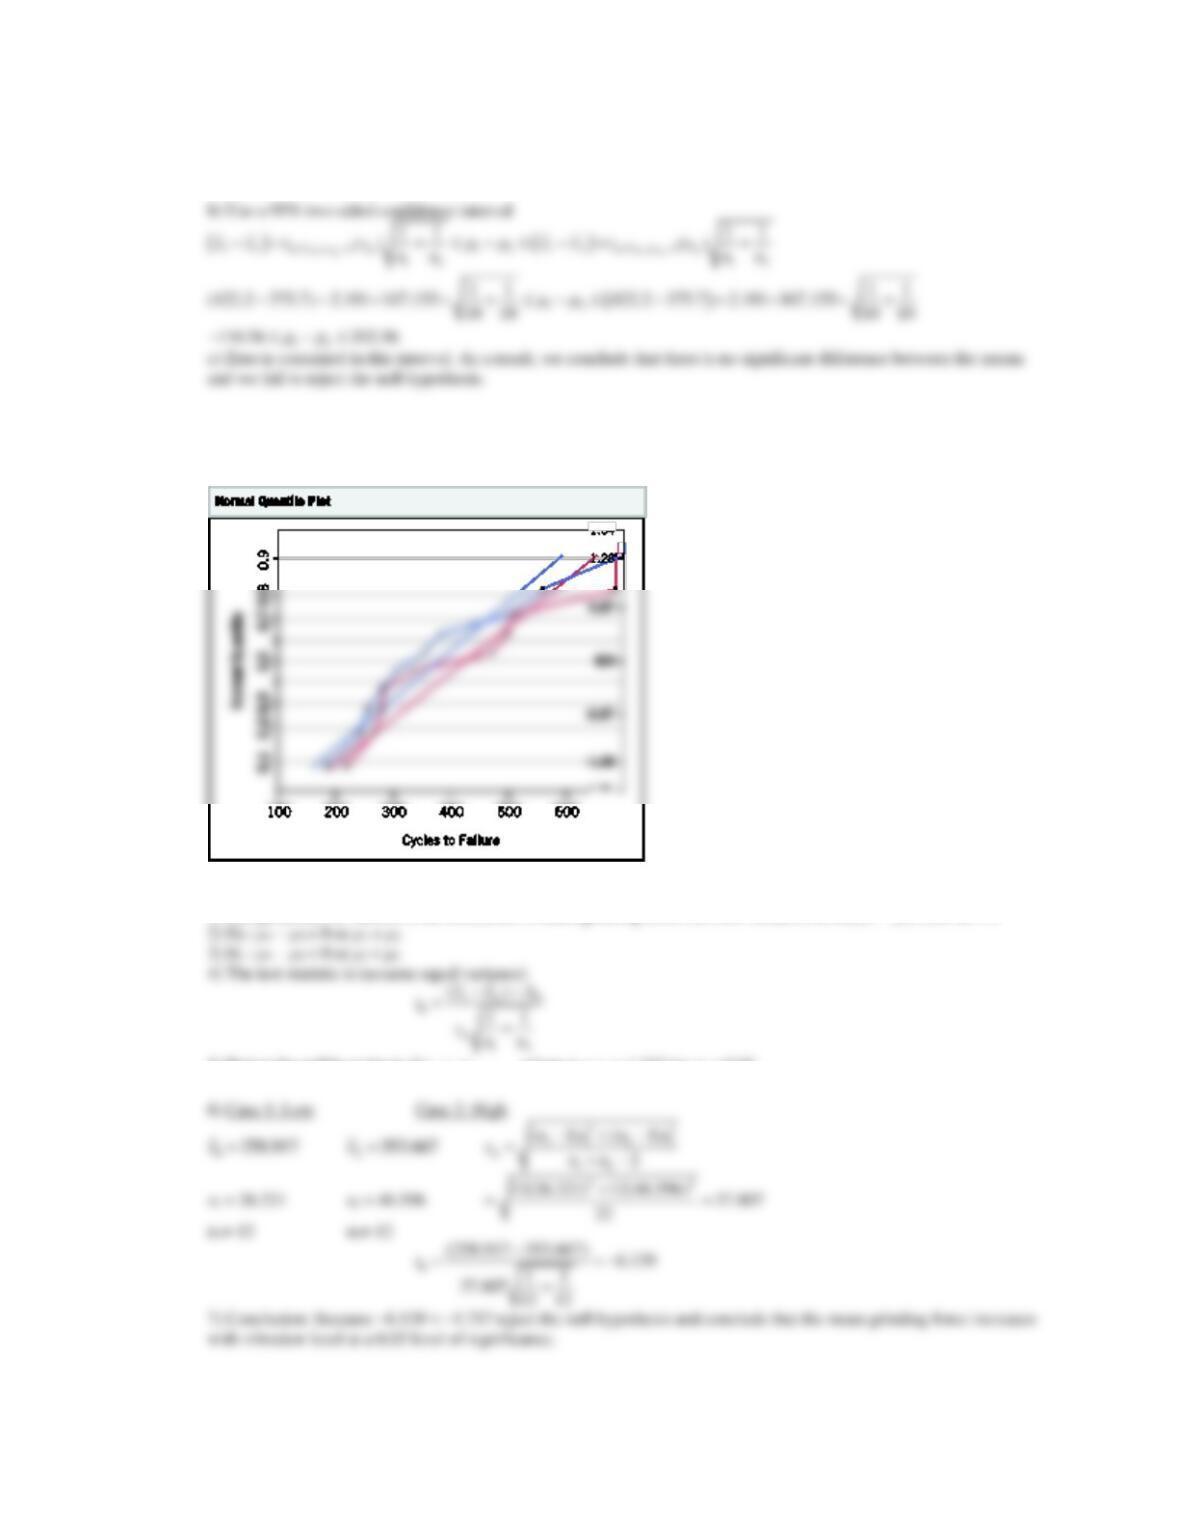
7) Conclusion: Because -2.101 < 0.622 and 0.622 < 2.101 fail to reject the null hypothesis. The temperatures do not
differ significantly in mean cycles to failure at = 0.05.
d) Normal probability plots are shown below (blue line is for 60° degrees). According to these plots, the assumption of
normality is reasonable because the data fall approximately along lines. The equality of variances does not appear to be
severely violated either , because the slopes are approximately the same for both samples.
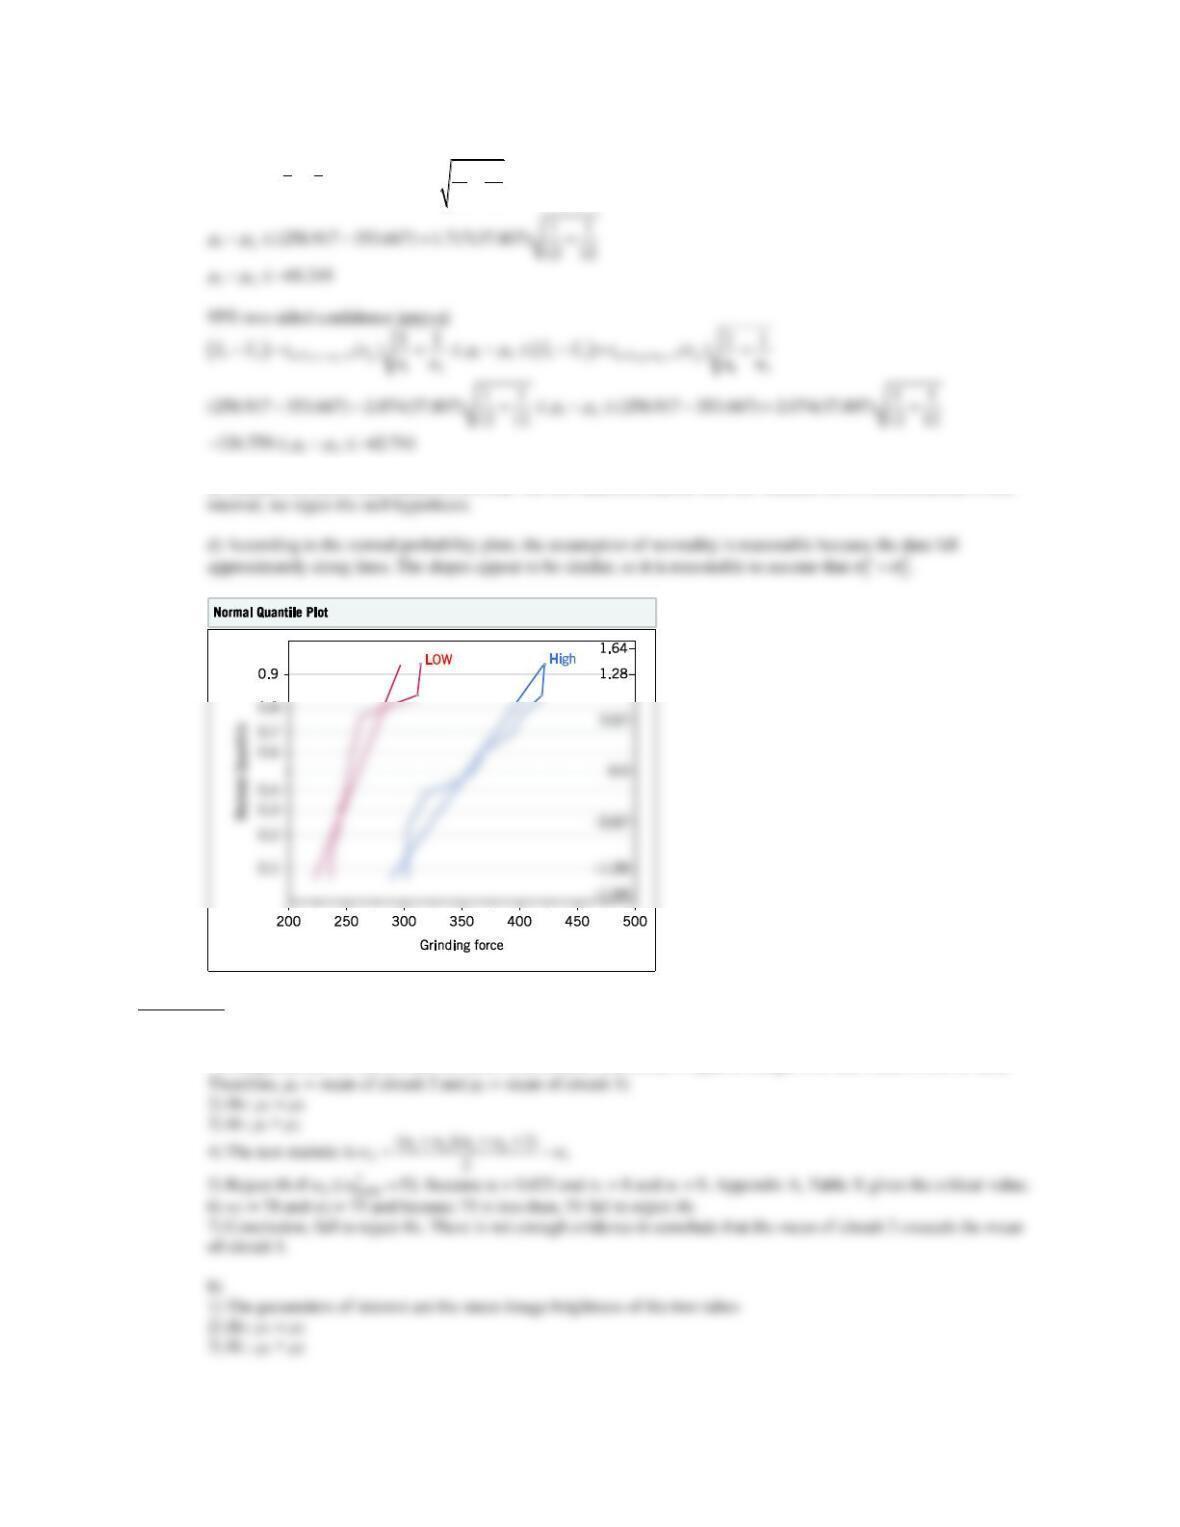
10.2.14 a)
1) The parameter of interest is the difference in mean grinding force between vibration levels, μ1 − μ2, with 0 = 0
5) Reject the null hypothesis if
+−
− 12
,0 2nn
t t
where t0.05,22 = 1.717 for = 0.05
b) 95% one-sided confidence interval: t0.05,22 = 1.717
( )
+−
− − + +
12
1 2 1 2 , 2
12
11
()
n n p
x x t s nn
c) Because the test is one-sided, we consider the one-sided confidence interval. Because zero is not contained in this
Section 10.3
10.3.1 a)
1) The parameters of interest are the mean current (note: set circuit 1 equal to sample 2 so that Table X can be used.
10.3.2 1) The parameters of interest are the mean flight delays
10.3.3 a)
1) The parameters of interest are the mean heat gains for heating units
b)
10.3.4 a)
b)
Section 10.4
10.4.1
=868.375d
10.4.2
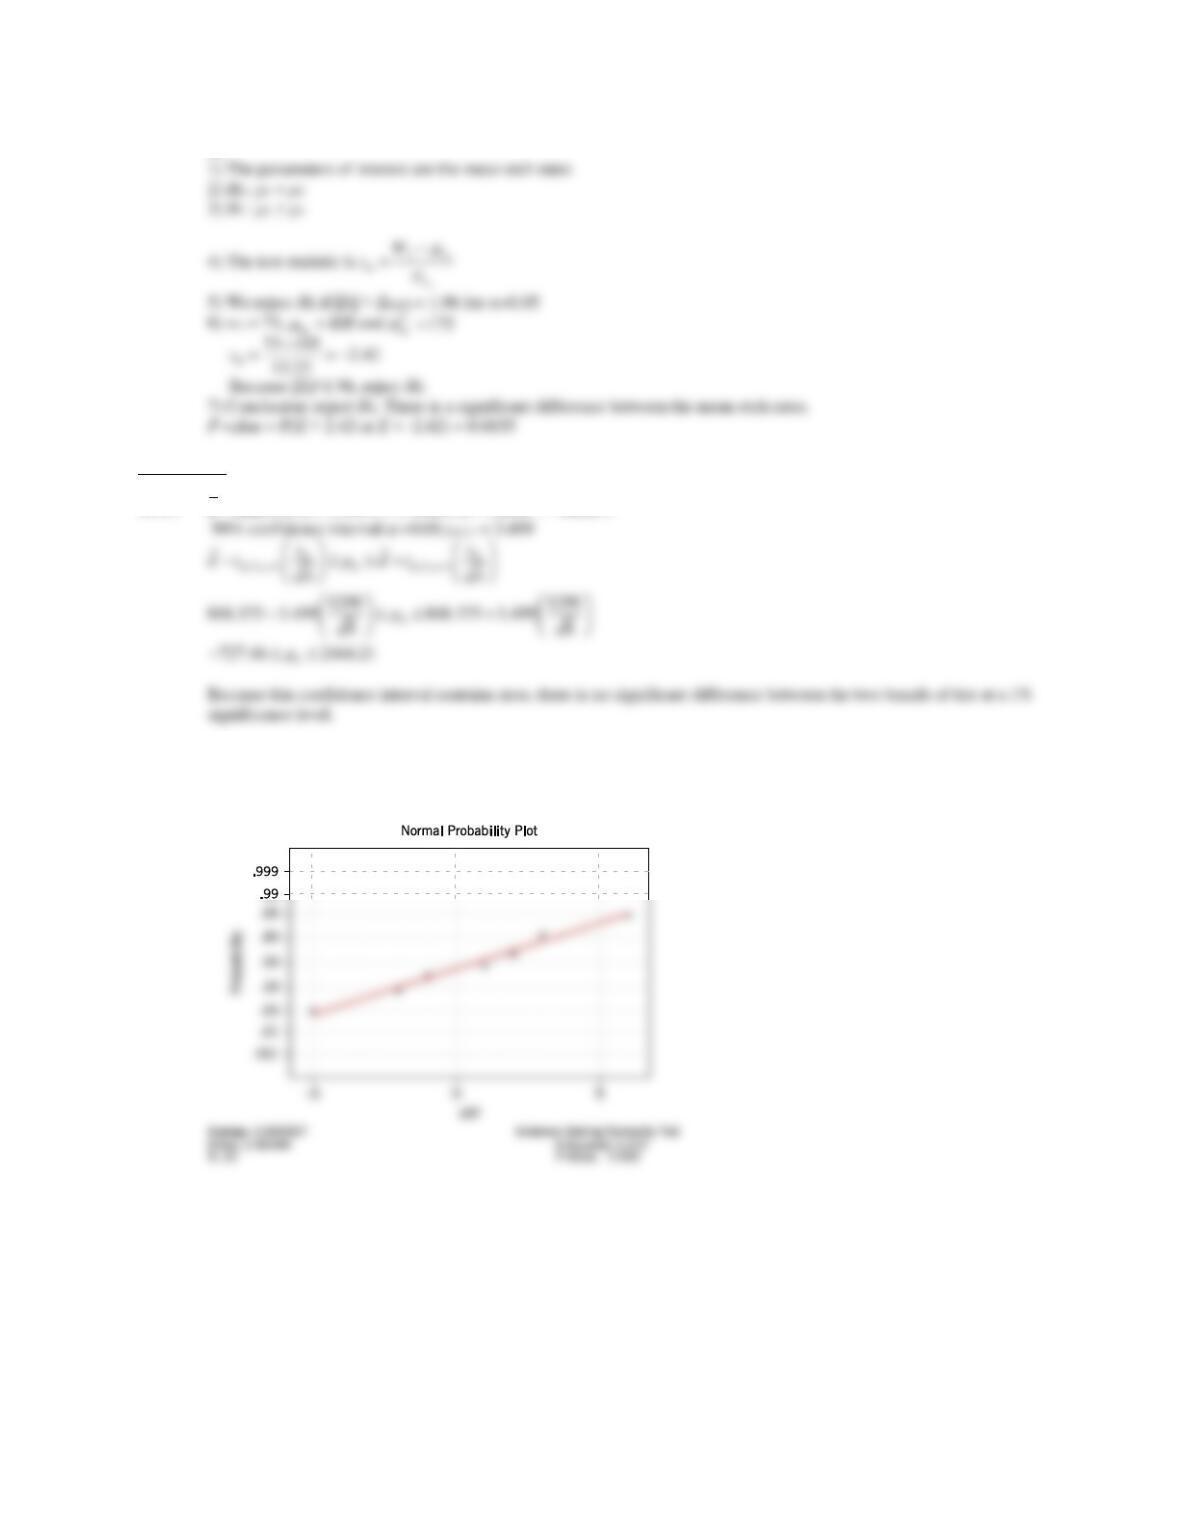
a) The data fall approximately along a line in the normal probability plots. Therefore, the assumption of normality does
not appear to be violated.