CHAPTER 10 RESERVE PROBLEMS
The following problems have been reserved for your use in assignments and testing and do not
appear in student versions of the text.
Reserve Problems Chapter 10 Section 1 Problem 1
Consider the hypothesis test
0 1 2
:0H
−=
against
1 1 2
:0H
−
samples below:
I
37
39
31
33
33
30
32
29
39
38
30
37
36
30
39
30
35
40
II
34
29
33
33
31
29
30
36
31
33
30
29
31
33
33
35
Variances:
14.1
=
,
20.4
=
. Use
0.05
=
.
(a) Test the hypothesis and find the P-value.
Find the test statistic.
(b) Explain how this test could be conducted with a confidence interval.
(c) What is the power of the test for the true difference in means of 2?
SOLUTION
(a)
1) The parameter of interest is the difference in means
12
−
. Note that
00=
.
(b)
( ) ( )
2 2 2 2
1 2 1 2
1 2 /2 1 2 1 2 /2
1 2 1 2
x x z x x z
n n n n
− − + − − + +
(c)
1 1 2
:0H
−
14.1
=
20.4
=
Reserve Problems Chapter 10 Section 1 Problem 2
A group of 20 people from New York and a group of 14 people from Los Angeles passed the
same quiz. The mean grade of group A is 77 points, with the standard deviation
15
=
, the mean
grade of group B is 76 points,
24
=
. Use
0.05
=
.
Assuming that the subjects are chosen randomly, the cities’ population are independent and the
points are normally distributed:
(a) Check if there is a significant difference between the mean grades of the groups. Find the P-
value of this test.
(b) Explain how the test could be conducted with a confidence interval.
(c) What is the power of the test for the true difference in means of 3?
(d) Assume that sample sizes are equal. What group size should be considered to obtain
0.1
=
if the true difference in means is 3?
SOLUTION
(a)
1) The parameter of interest is the difference in means
12
−
. Note that
00=
.
=
24
=
=
(c)
(d)
0.05
=
,
0.1
=
,
3
=
Reserve Problems Chapter 10 Section 1 Problem 3
The time delay is measured for a city street. Variability in this value is estimated as
0.3
=
(for
time in minutes) by experience. Traffic signs and lights were recently altered to facilitate traffic
and reduce delays. Delay times in minutes for a random car sample before and after the
rearrangement are shown below.
Before
7.2
7.1
7.1
7.1
7.3
7.3
6.8
6.8
7.1
7.3
7.4
7.2
After
6.2
6.6
6.4
6.1
6.6
6.0
5.8
6.1
6.1
6.0
7.2
7.0
Assume that the time delay variability is unaffected by the traffic signs change. If the difference
in the time delay is 1 minute or less, we would like to detect it.
(a) Formulate and test an appropriate hypothesis using
0.1
=
. What is your conclusions? Find
the P-value.
1) The parameter of interest is the difference in the mean time delay before and after the
rearrangement,
12
−
.
2)
0 1 2
:H
−=
3)
1 1 2
:H
−
(b) Find a 90% confidence interval for the difference in the mean time delay.
SOLUTION
(a)
1) The parameter of interest is the difference in the mean time delay before and after the
Reserve Problems Chapter 10 Section 1 Problem 4
Blonde hair is believed to be thinner than brown hair. To check it hair thickness of two random
samples of people was tested,
122n=
with brown hair and
220n=
with blonde hair (color and
thickness are natural for all subjects). The mean hair thickness is
178xm
=
and
275xm
=
respectively,
12
13
==
.
(a) Formulate and test an appropriate hypothesis using
0.05
=
. What is your conclusions? Find
the P-value.
1) The parameter of interest is the difference in means
12
−
. Note that
00=
.
2)
0 1 2
:H
−
3)
1 1 2
:H
−
The test statistic is:
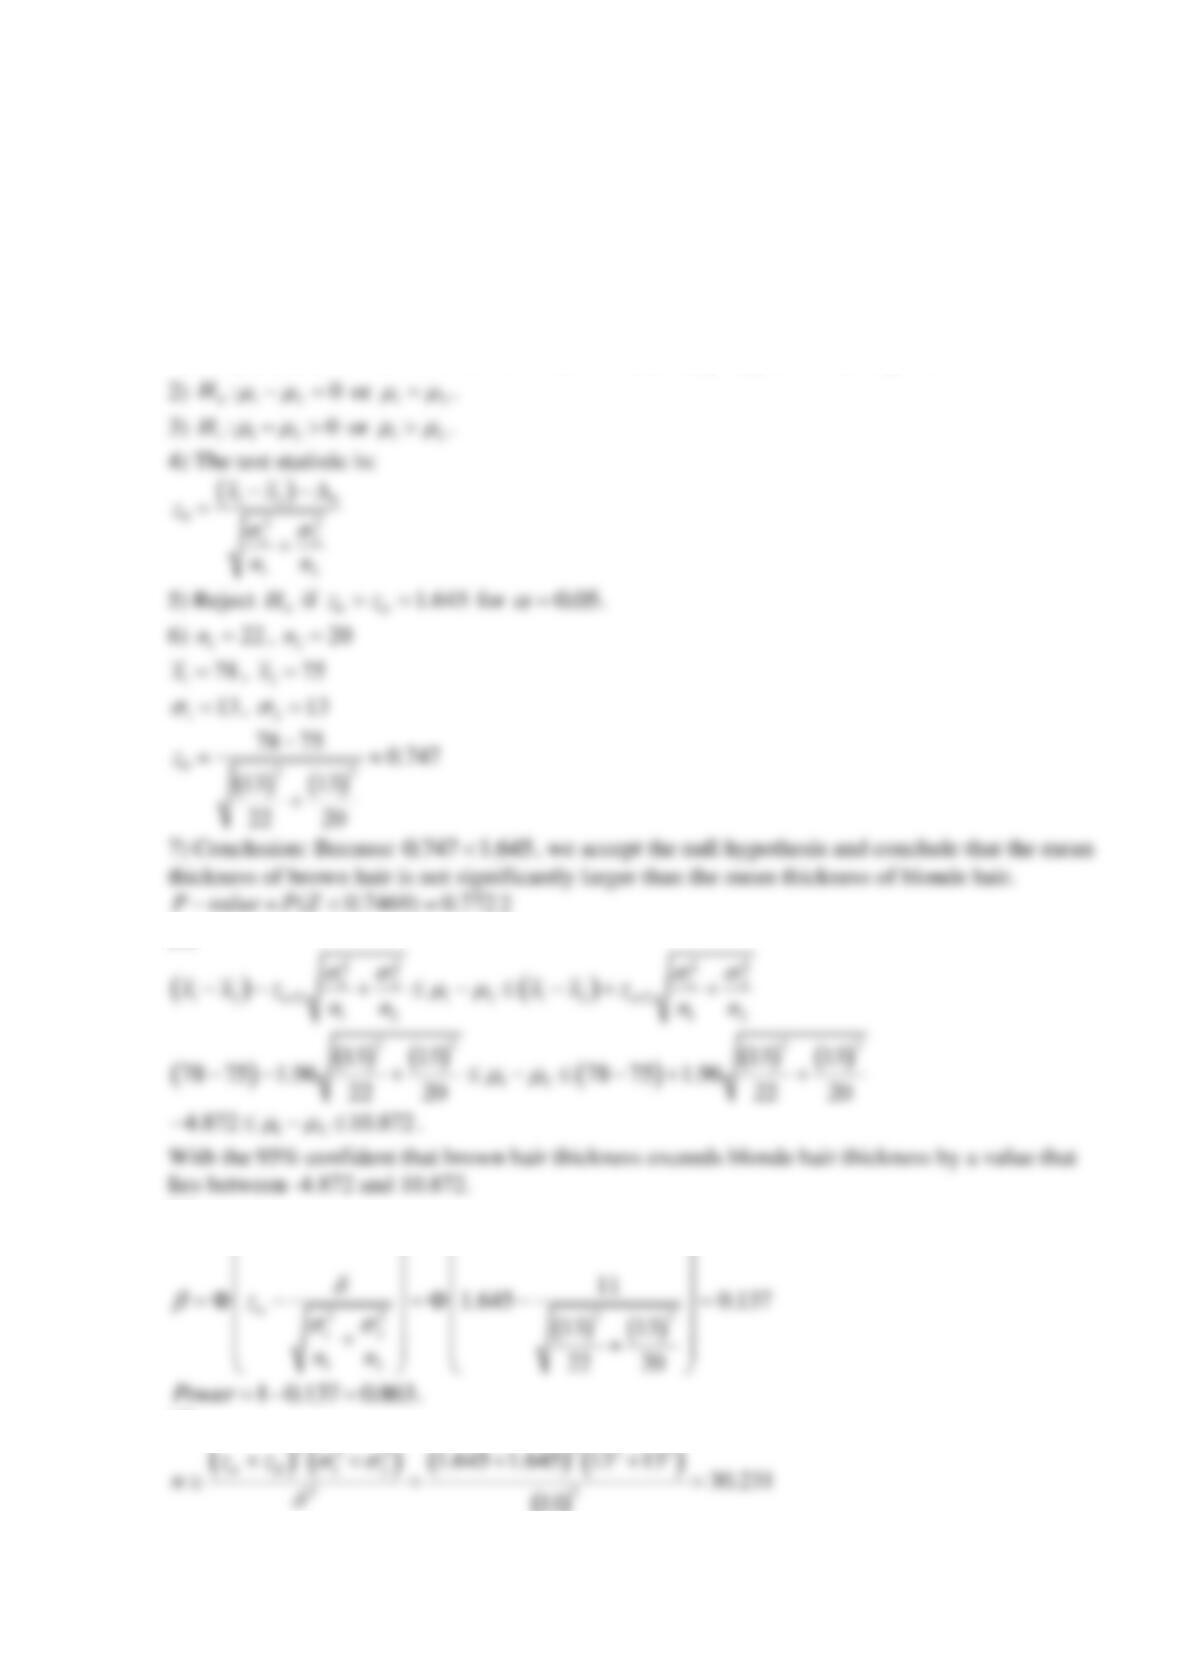
(b) Build a confidence interval for the parameter of interest using
0.05
=
.
(c) What is the power of the test for the true difference in means of 11 Use
0.05
=
.
(d) What sample size should be used to obtain
0.05
=
? Assume sample sizes are equal and
0.05
=
.
SOLUTION
(a)
1) The parameter of interest is the difference in means
12
−
. Note that
00=
.
(b)
(c)
(d)
( )
22
0.05
=
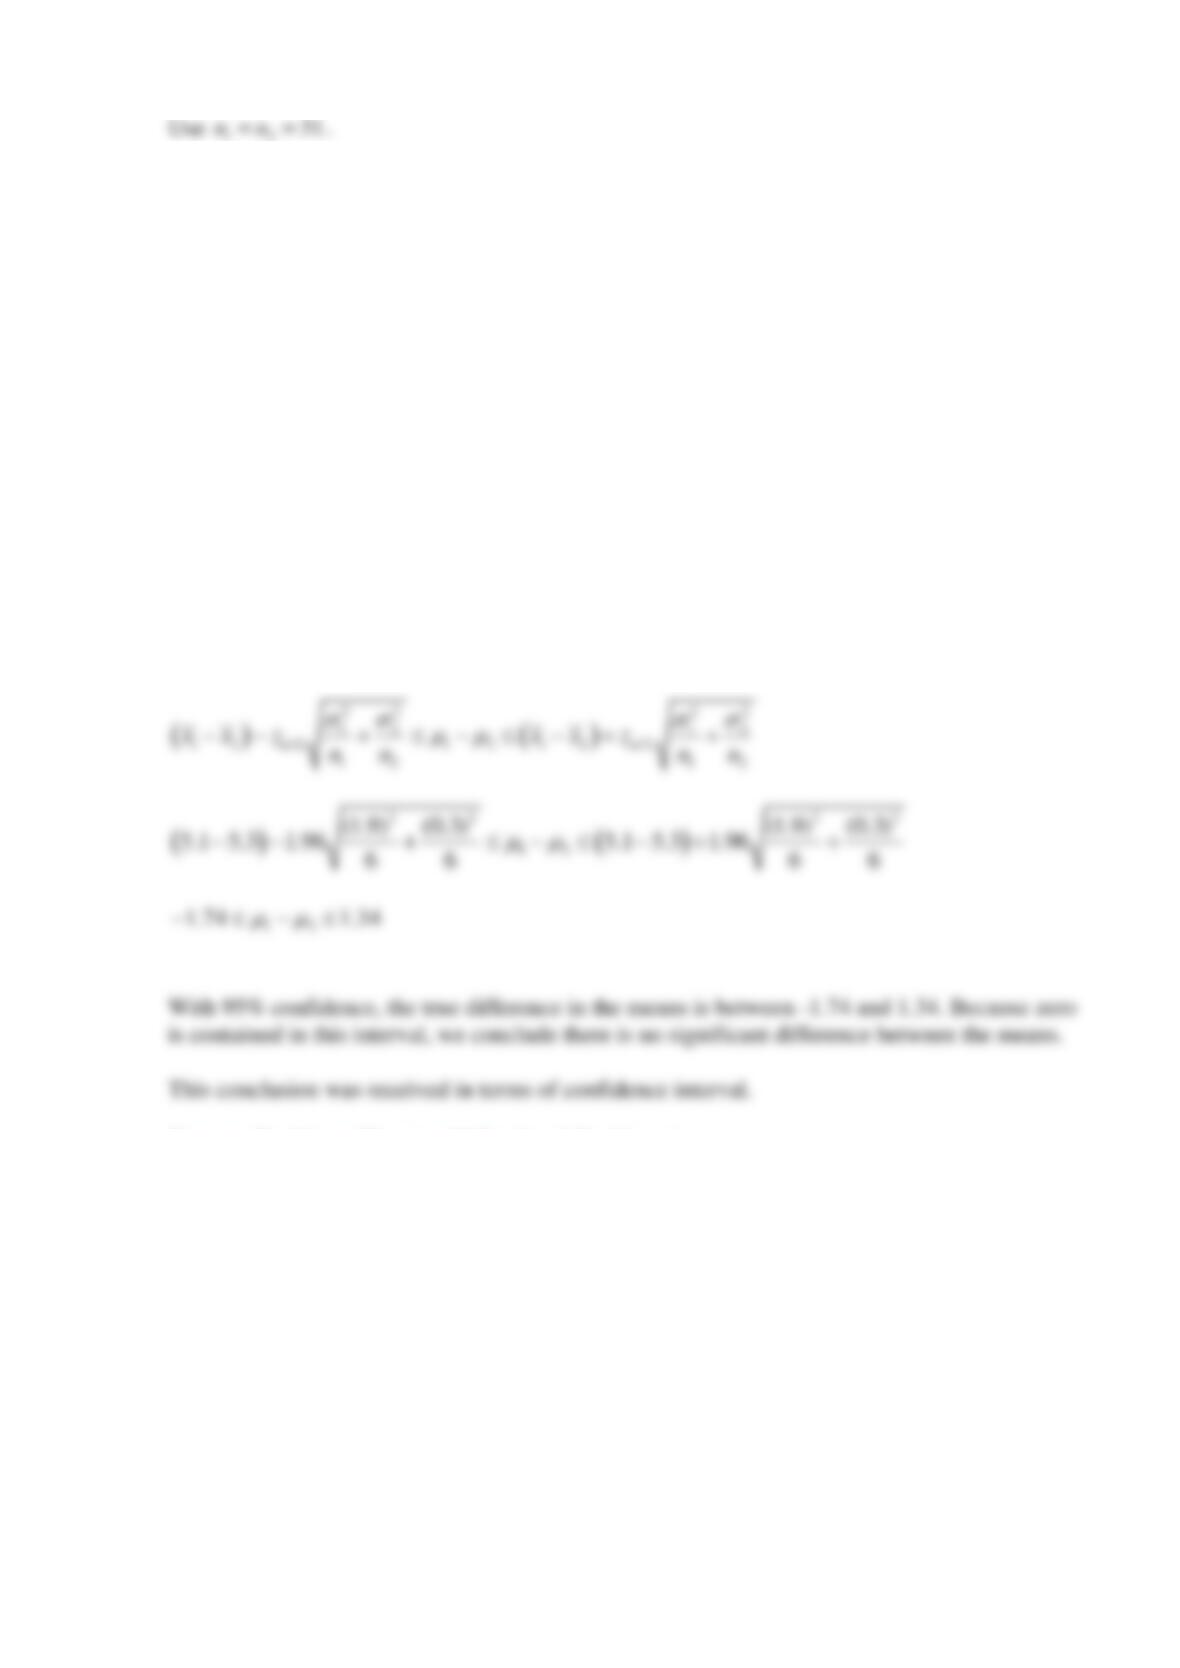
Reserve Problems Chapter 10 Section 1 Problem 5
Let us suppose we have some article reported on a study of potential sources of injury to equine
veterinarians conducted at a university veterinary hospital. Forces on the hand were measured for
several common activities that veterinarians engage in when examining or treating horses. We
will consider the forces on the hands for two tasks, lifting and using ultrasound. Assume that
both sample sizes are 6, the sample mean force for lifting was 5.1 pounds with standard
deviation 1.9 pounds, and the sample mean force for using ultrasound was 5.3 pounds with
standard deviation 0.3 pounds (data read from graphs in the article). Assume that the standard deviations
are known.
Find a 95% confidence interval on the difference in mean force on the hands for the two
activities.
How would you interpret this CI?
Is the value zero in the CI?
SOLUTION
Reserve Problems Chapter 10 Section 1 Problem 6
Let us suppose we have some article reported on a study of potential sources of injury to equine
veterinarians conducted at a university veterinary hospital. Forces on the hand were measured for
several common activities that veterinarians engage in when examining or treating horses. We
will consider the forces on the hands for two tasks, lifting and using ultrasound. Assume that
both sample sizes are 6, the sample mean force for lifting was 6.2 pounds with standard
deviation 1.3 pounds, and the sample mean force for using ultrasound was 6.4 pounds with
standard deviation 0.3 pounds (data read from graphs in the article). Assume that the standard deviations
are known.
Suppose that you wanted to detect a true difference in mean force of 0.25 pounds on the hands
for these two activities. Under the null hypothesis,
00=
. What level of type II error would you
recommend here?
What sample size would be required?
SOLUTION
The expression for probability of type II error
for a two-sided alternative hypothesis is
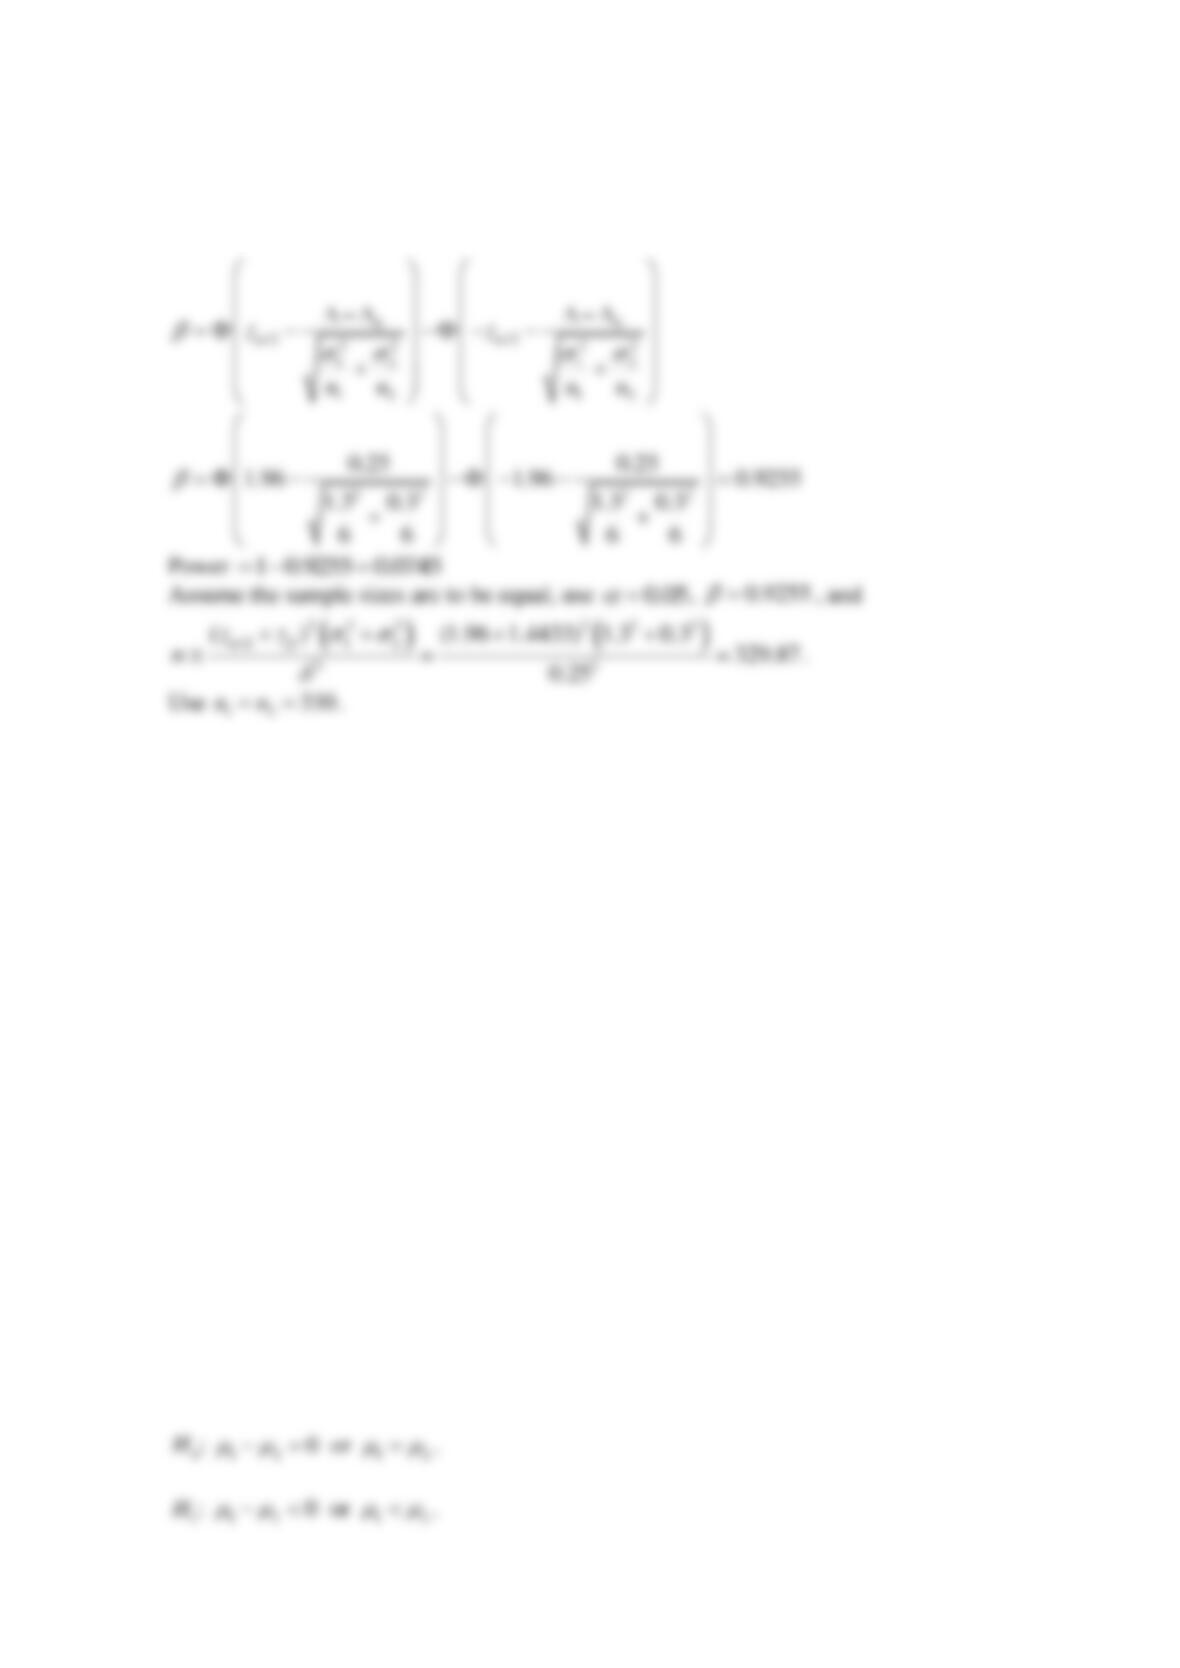
Reserve Problems Chapter 10 Section 1 Problem 7
Let us suppose that we have a book, which provides data on the absorbency of paper towels that
were produced by two different manufacturing processes. From process 1, the sample size was
10 and had a mean and standard deviation of 190 and 15, respectively. From process 2, the
sample size was 4 with a mean and standard deviation of 310 and 54 respectively.
Is there evidence to support a claim that the mean absorbency of the towels from process 2 have
higher mean absorbency than the towels from process 1? Assume that the standard deviations are
known,
0.05
=
.
Determine the value of the test statistic. Suppose that the hypotheses are
0
H
:
1 2 0 0
− = =
versus
1
H
:
12
0
−
.
Determine the condition needed to claim that the mean absorbency of the towels from process 2
exceeds that of process 1.
What level of type I error would you consider appropriate for this problem?
SOLUTION
The parameter of interest is the difference in means,
12
−
, and
00=
.
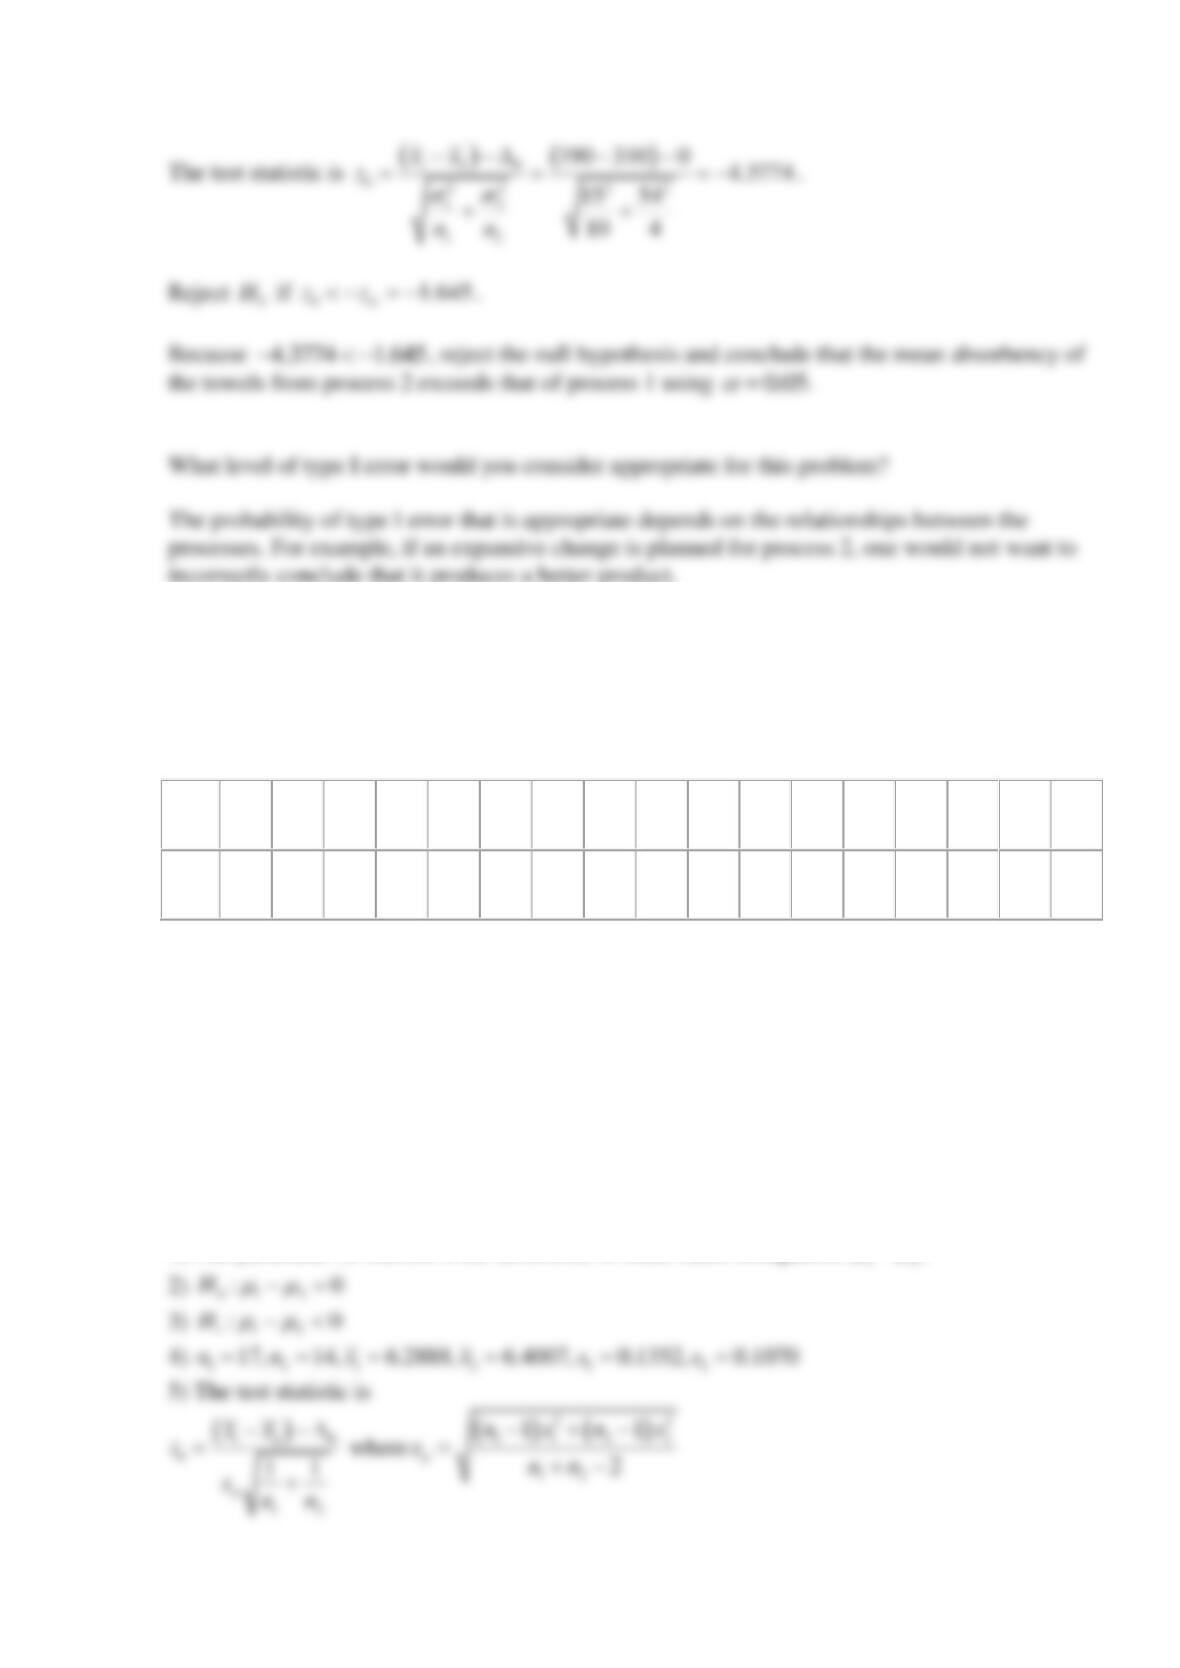
Reserve Problems Chapter 10 Section 2 Problem 1
Elasticity is an important parameter of kernmantle ropes (used in climbing, caving,
mountaineering, etc.). One of the ways of describing it is static elongation (measured under a
resting load of 80 kg). Static elongation was measured for two random rope samples of two
different types of weaving.
type
-1
6.3
4
6.1
6
6.3
2
6.2
1
6.3
6
6.4
3
6.0
2
6.2
1
6.4
7
6.2
1
6.4
9
6.2
1
6.1
6
6.1
9
6.2
9
6.3
3
6.5
1
type
-2
6.3
8
6.5
4
6.4
9
6.4
7
6.4
6
6.4
6
6.5
2
6.3
5
6.3
3
6.3
5
6.3
1
6.3
7
6.1
3
6.4
5
(a) Assume that
12
=
. Is there evidence to support the claim that type-2- ropes are more
elastic than type1? Use
0.05
=
.
(b) Find the P-value for this test.
(c) Construct a 95% confidence interval for the difference in the mean static elongation of ropes.
SOLUTION
(a)
1) The parameter of interest is the difference in mean static elongation,
−
.
0.05
=
Reserve Problems Chapter 10 Section 2 Problem 2
Hardness of water from two different water treatment facilities is investigated. Observed water
hardness (in ppm) for a random sample of faucets is as follows:
Facility 1
63
57
58
62
66
58
61
60
55
62
59
60
58
Facility 2
69
65
59
62
61
57
59
60
60
62
61
66
68
66
Use
0.05
=
.
a) Assume that
12
=
. Is there evidence to support the claim that two facilities supply water of
different hardness?
(b) Find the P-value for test (a).
(c) Assume that variances are not equal. Make the test for that assumption.
(d) Find the P-value for test (c)
(e) Compare the results from these tests.
(f) Construct a 95% confidence interval for the difference in the mean water hardness for part
(a).
(g) Construct a 95% confidence interval for the difference in the mean water hardness for part
(c).
SOLUTION
0.05
=
(a)
=
(b)
2 ( 2.012)P value P t− =
(c)
(d)
2 ( 2.03)P value P t− =
Reserve Problems Chapter 10 Section 2 Problem 3
The ballistic coefficient is a measure of body’s ability to overcome air resistance in flight. That
parameter is inversely proportional to the deceleration of a flying body and is very important for
bullets. The ballistic coefficient was measured for the bullets of two versions of 9 mm Makarov
cartridges, PM and PMM (which is a later and modified version). Sample bullets are chosen
randomly.
PM
12.
93
12.
89
13.
13
13.
11
12.
81
12.
83
13.
11
12.
67
12.
85
12.
99
13.
05
12.
75
13.
08
13.
17
13.
16
12.
64
PM
M
13.
86
13.
91
13.
94
13.
63
13.
95
13.
68
13.
52
13.
95
13.
74
13.
50
13.
96
13.
59
13.
63
13.
94
Use
0.025
=
.
(a) The ballistic coefficient of PMM-bullets is supposed to exceed the coefficient of PM-bullets
by 1. Is there evidence to support that claim?
(b) Find the P-value for this test.
(c) Find a 95% two-sided confidence interval for the mean difference in the ballistic coefficient.
SOLUTION
(a)
1) The parameter of interest is the difference in the mean ballistic coefficients for unmodified
and modified shells
12
−
with
01 = −
.
Reserve Problems Chapter 10 Section 2 Problem 4
Two Internet providers declared the data transfer rate of 5.5 MBps. But, obviously the actual
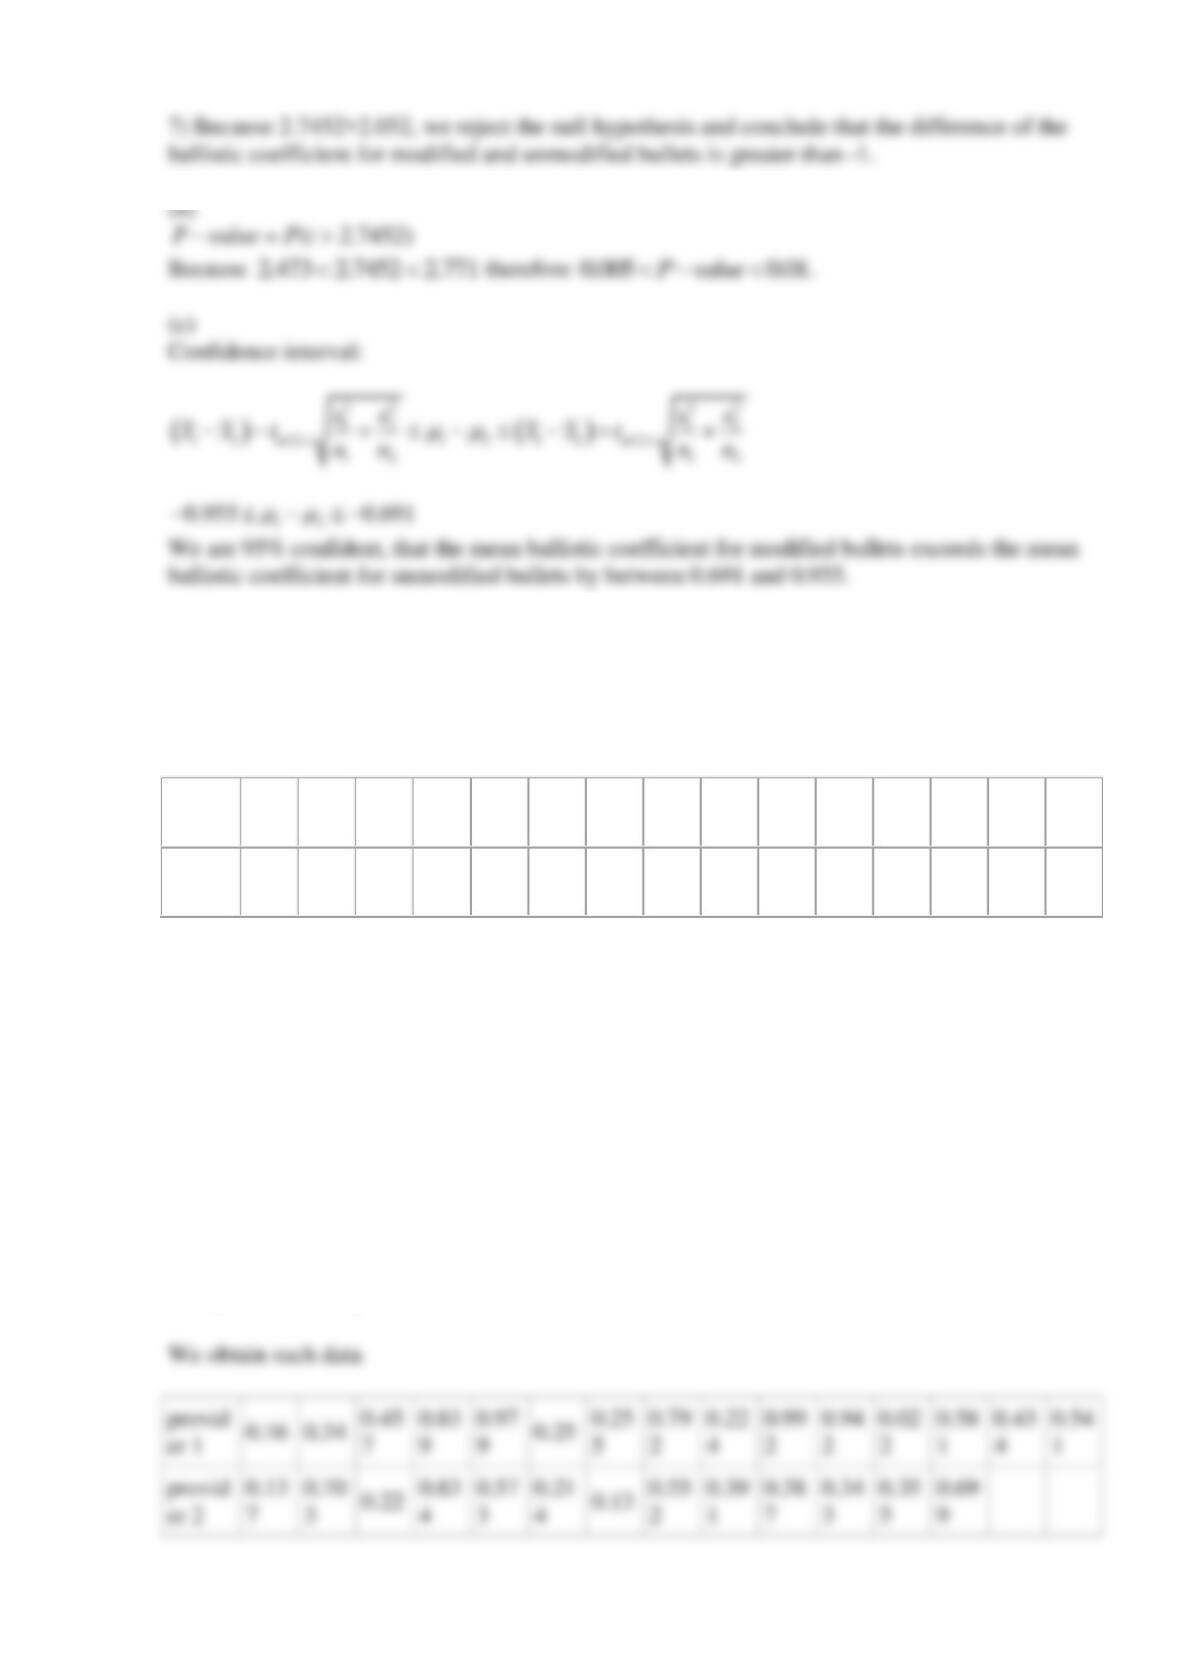
download speed is lower at almost every moment. The observed download speeds are as follows
(in MBps):
provid
er 1
5.34
5.16
5.04
3
4.66
1
4.52
1
5.25
5.24
5
4.70
8
5.27
6
4.50
8
4.55
8
5.47
8
4.91
9
5.06
6
4.95
9
provid
er 2
5.36
3
4.79
7
5.28
4.66
6
4.92
7
5.28
6
5.37
4.94
8
5.10
9
5.11
3
5.15
7
5.14
5
4.80
1
Assume that losses of the download speed are random.
(a) Is there evidence to support the claim that two providers have a different mean download
speed loss? Use
0.05
=
.
(b) Find the P-value for this test.
(c) Find a 95% confidence interval for the download speed loss.
SOLUTION
(a)
The value of interest is not the download speed, but the download speed loss
5.5
jj
Loss Speed=−
provid
er 1
0.16
0.34
0.45
7
0.83
9
0.97
9
0.25
0.25
5
0.79
2
0.22
4
0.99
2
0.94
2
0.02
2
0.58
1
0.43
4
0.54
1
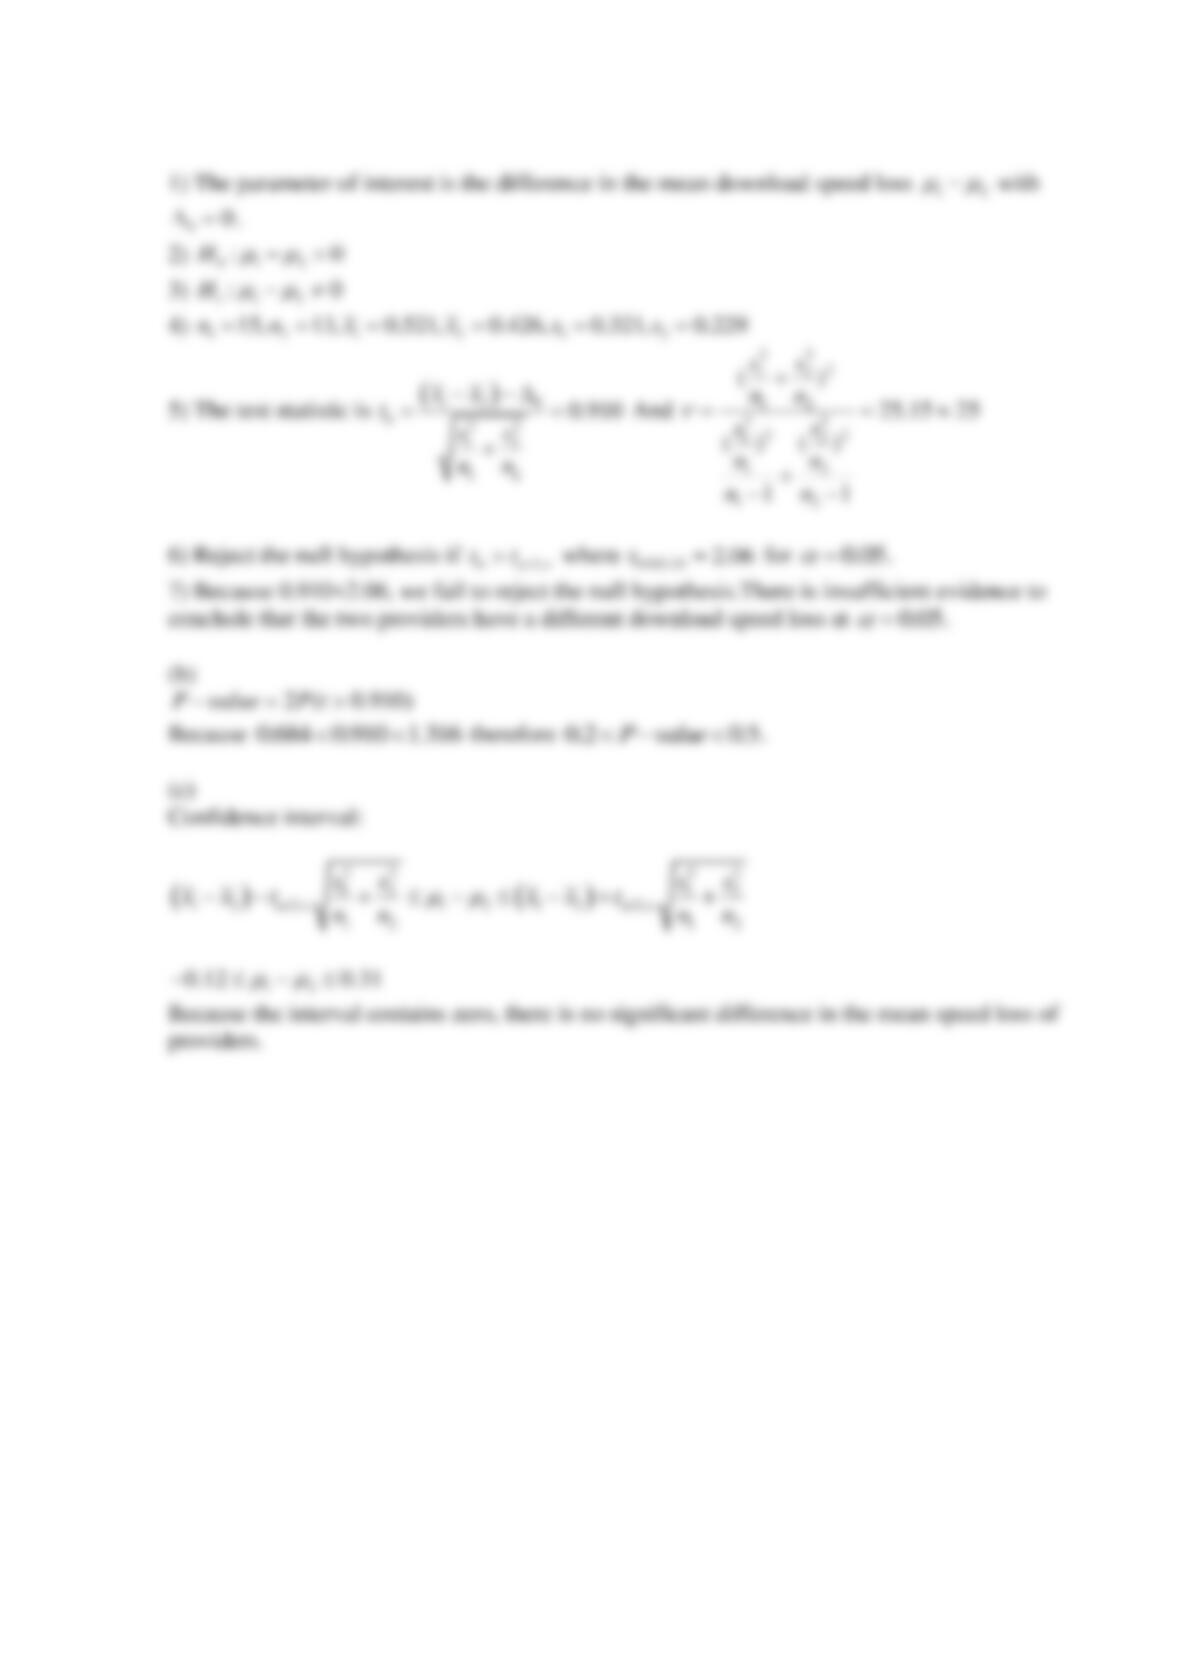
Reserve Problems Chapter 10 Section 2 Problem 5
Consider the computer output below.
Two-Sample T-Test and CI
Sample
N
Mean
StDev
SE Mean
1
15
54.87
2.13
0.55
2
20
58.66
5.28
1.2
Difference =
12
−
Estimate for difference: –3.91
12
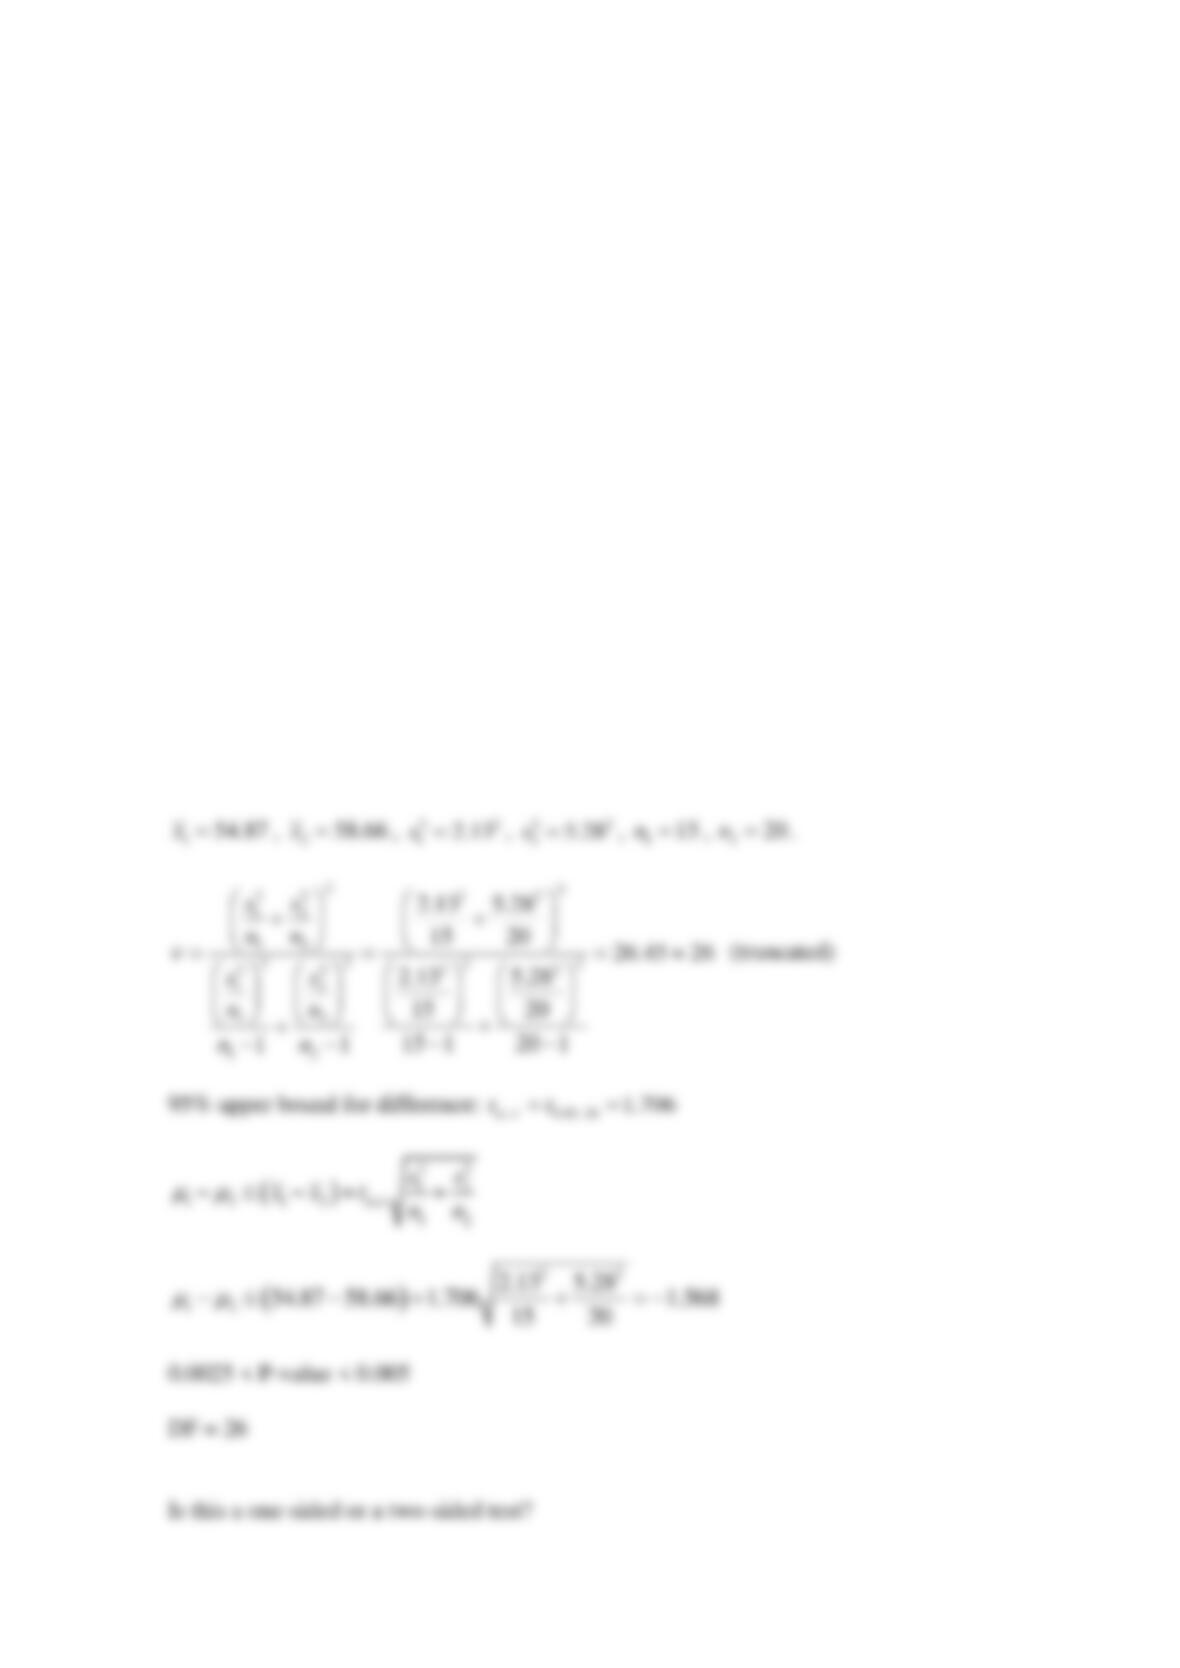
95% upper bound for difference: ?
T–test of difference = 0 (vs <): T–value = -2.91
P–value = ?
DF = ?
(a) Fill in the missing values. Use lower and upper bounds for the P-value. Suppose that the
hypotheses are
0
H
:
12
0
−=
versus
1
H
:
12
0
−
. Determine a 95% upper bound for
difference.
(b) What are your conclusions if
0.05
=
? What if
0.01
=
?
(c) This test was done assuming that the two population variances were different. Does this seem
reasonable?
(d) Suppose that the hypotheses had been
0
H
:
12
=
versus
1
H
:
12
. What would your
conclusions be if
0.05
=
?
SOLUTION
(a)
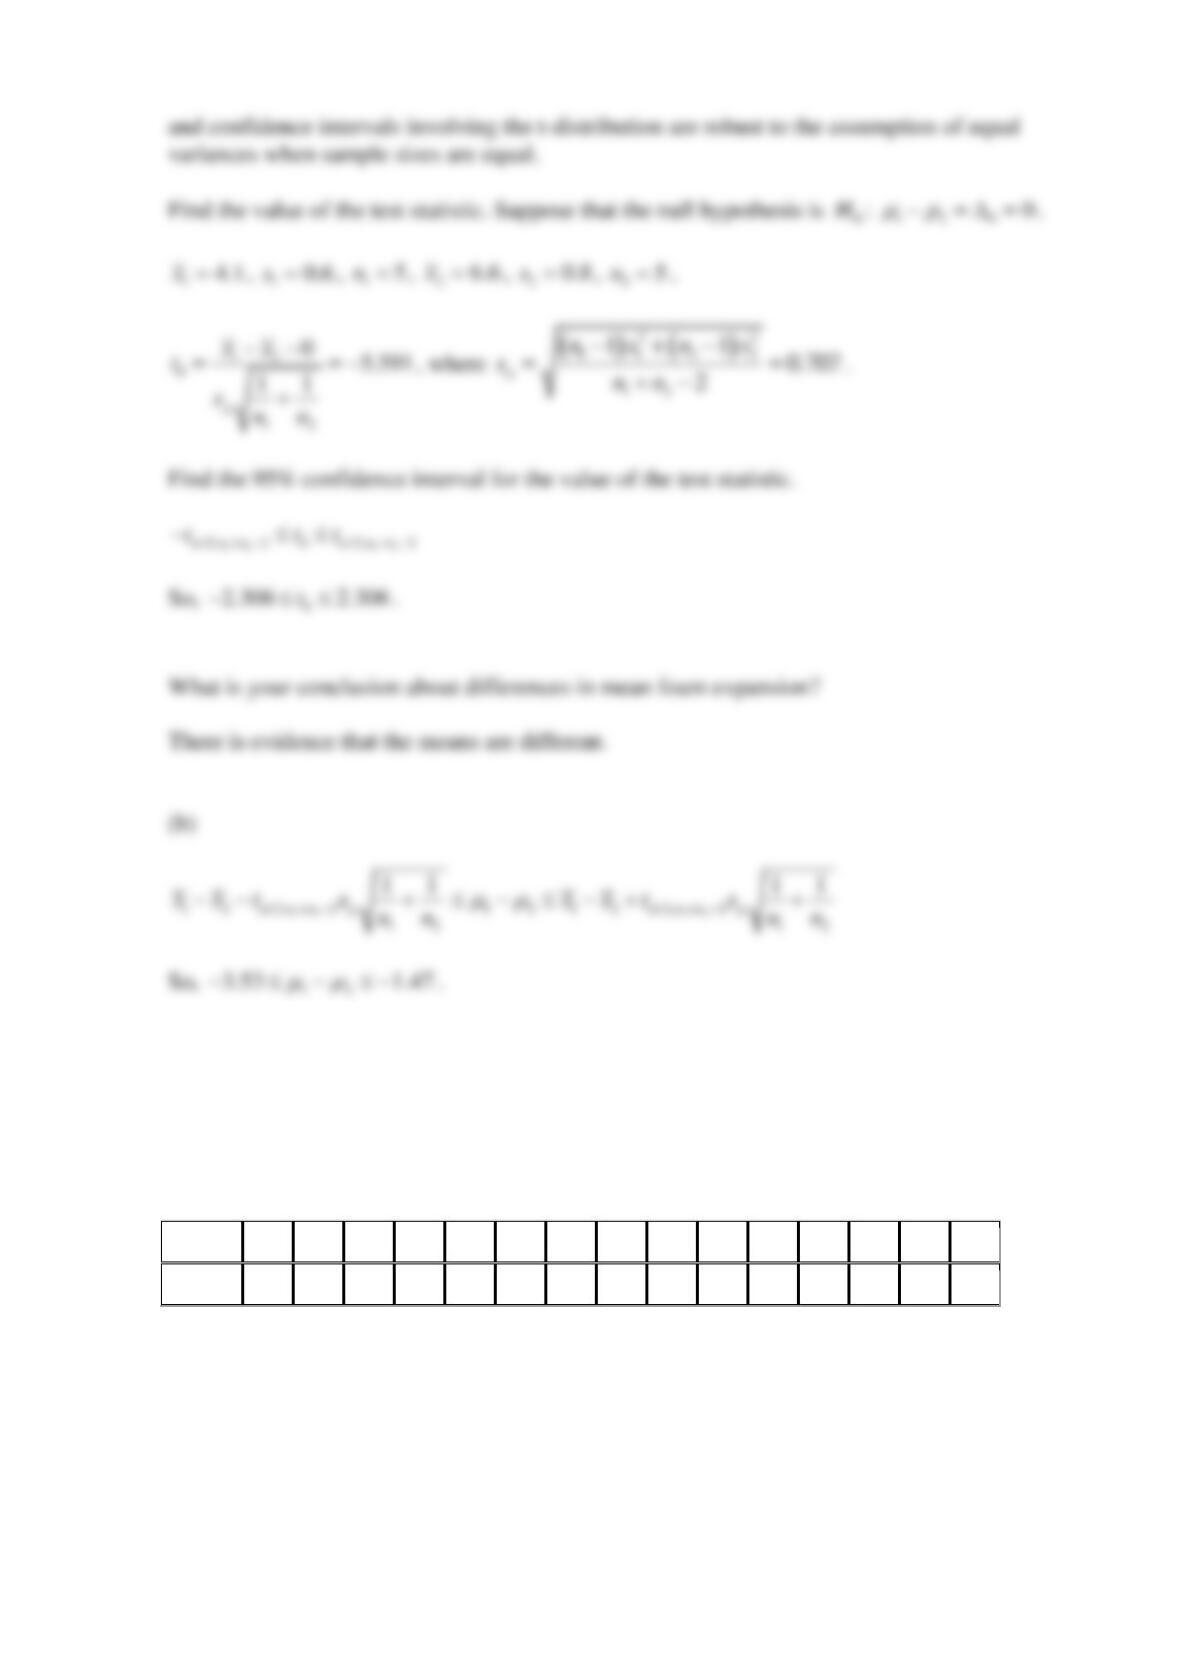
Reserve Problems Chapter 10 Section 2 Problem 6
An article in Fire Technology investigated two different foam-expanding agents that can be used
in the nozzles of fire-refighting spray equipment. A random sample of five observations with an
aqueous film-forming foam (AFFF) had a sample mean of 4.1 and a standard deviation of 0.6. A
random sample of five observations with alcohol-type concentrates (ATC) had a sample mean of
6.6 and a standard deviation 0.8.
(a) Can you draw any conclusions about differences in mean foam expansion? Use
0.05
=
.
Assume that both populations are well represented by normal distributions with the same
standard deviations.
Find the value of the test statistic. Suppose that the null hypothesis is
0
H
:
1 2 0 0
− = =
.
Find the 95% confidence interval for the value of the test statistic.
What is your conclusion about differences in mean foam expansion?
(b) Find a 95% confidence interval on the difference in mean foam expansion of these two
agents.
SOLUTION
(a)
The assumption of equal variances may be relaxed in this case because it is known that the t-test
Reserve Problems Chapter 10 Section 2 Problem 7
The deflection temperature under load for two different types of plastic pipe is being
investigated. Two random samples of 15 pipe specimens are tested, and the deflection
temperatures observed are as follows (in °F):
Type 1
214
196
213
195
202
201
215
193
197
221
200
218
202
186
213
Type 2
186
206
215
210
189
185
194
209
206
201
207
197
198
212
201
(a) Do the data support the claim that the deflection temperature under load for type 1 pipe
exceeds that of type 2? In reaching your conclusions, use
0.05
=
. Suppose that the hypotheses
are
0
H
:
12
0
−=
versus
1
H
:
12
0
−
. Calculate a P-value. Use lower and upper bounds
for the P-value. Select the correct conclusion.
0
H
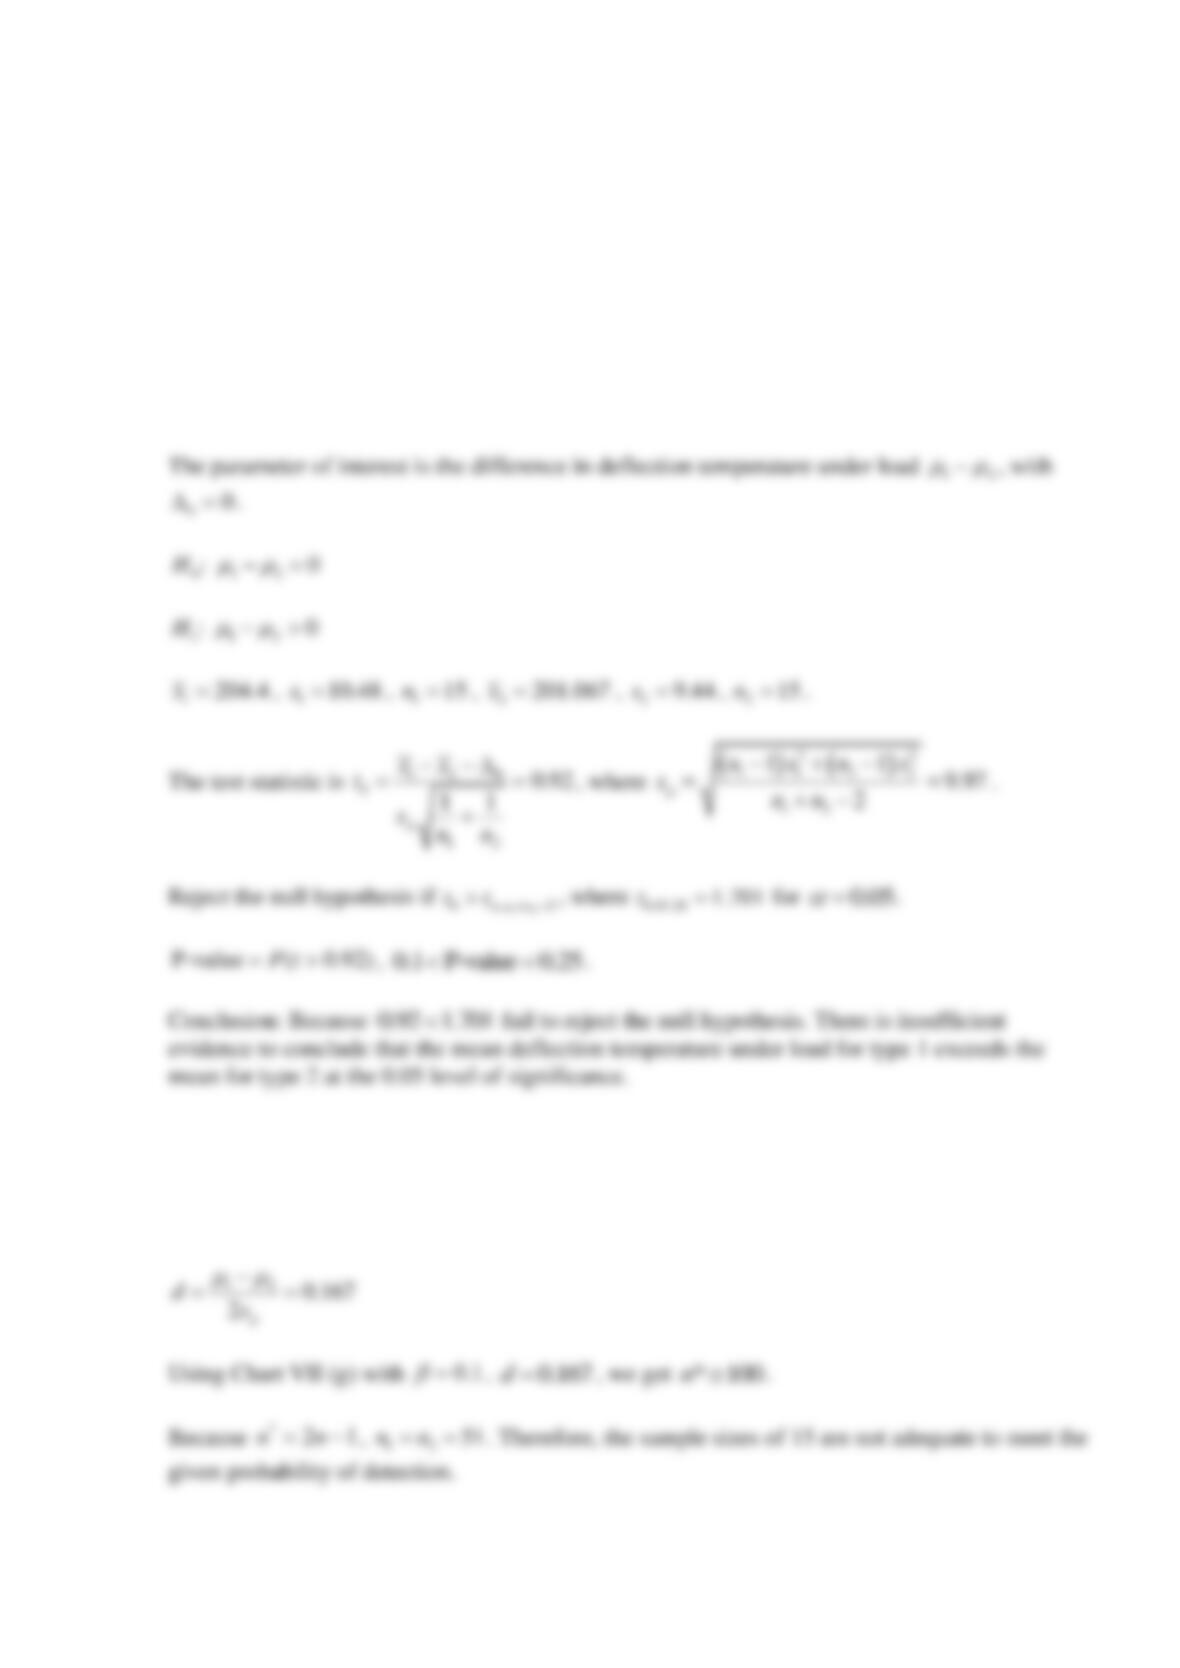
(b) If the mean deflection temperature for type 1 pipe exceeds that of type 2 by as much as 6°F, it
is important to detect this difference with probability at least 0.90. Is the choice of
12
15nn==
adequate? Use
0.05
=
.
SOLUTION
(a)
According to the normal probability plots, the assumption of normality is reasonable because the
data fall approximately along lines. The equality of variances does not appear to be severely
violated either because the slopes are approximately the same for both samples.
(b)
6=
, use
p
s
as an estimate of
:
0.05
=
Reserve Problems Chapter 10 Section 2 Problem 8
Let us suppose we got the results of an experiment studied the capability of a gauge by
measuring the weights of two sheets of paper. The data follow.
Paper
Observations
1
3.631
3.598
3.635
3.625
3.622
3.627
3.622
3.614
3.622
3.620
3.620
3.620
3.627
3.623
3.624
2
3.318
3.314
3.316
3.309
3.301
3.314
3.307
3.317
3.299
3.310
3.318
3.299
3.305
3.300
3.314
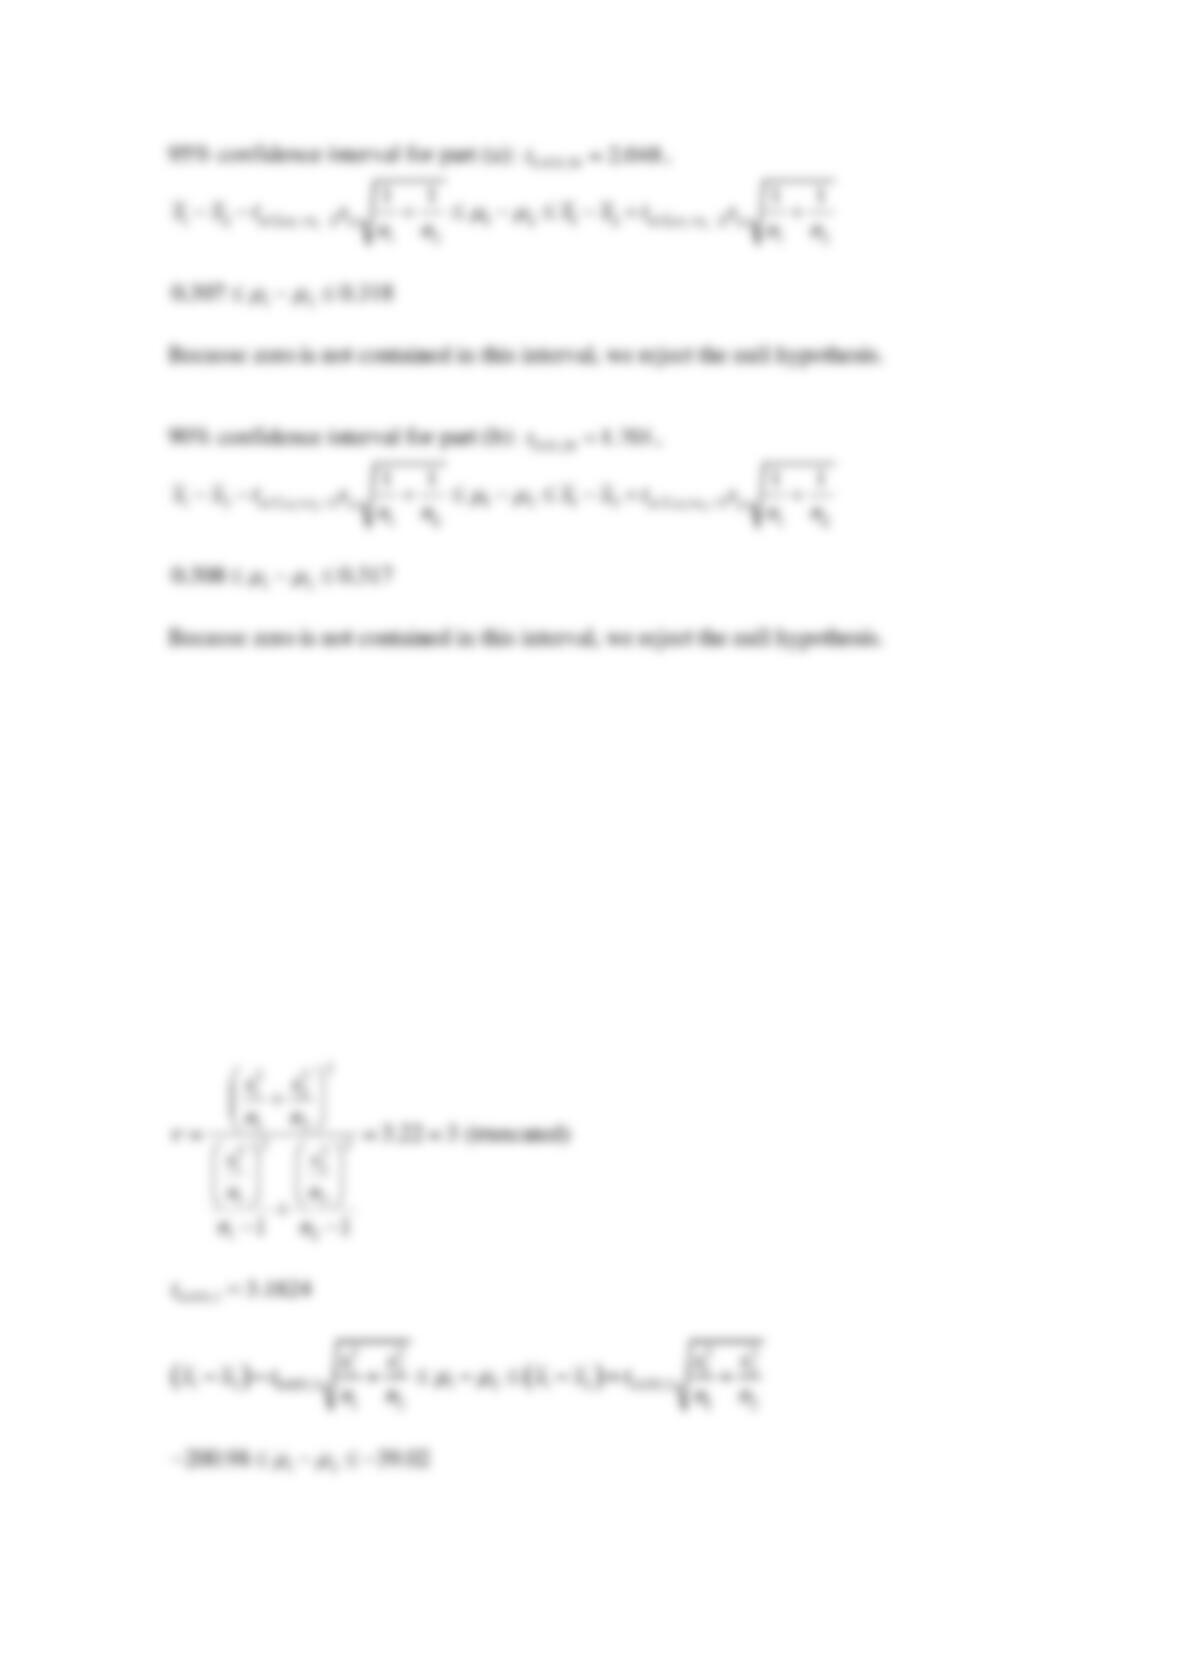
(a) Test the hypothesis that the mean weight of the two sheets is equal against the alternative that
it is not. Use
0.05
=
and assume equal variances. Find the P-value. Select the correct
conclusion.
(b) Test the hypothesis that the mean weight of the two sheets is equal against the alternative that
it is not. Use
0.10
=
and assume equal variances. Find the P-value. Select the correct
conclusion.
(c) Compare your answers for parts (a) and (b) and explain why they are the same or different.
(d) Explain how the questions in parts (a) and (b) could be answered with confidence intervals.
SOLUTION
(a)
According to the normal probability plots, the assumption of normality is reasonable because the
data fall approximately along lines.
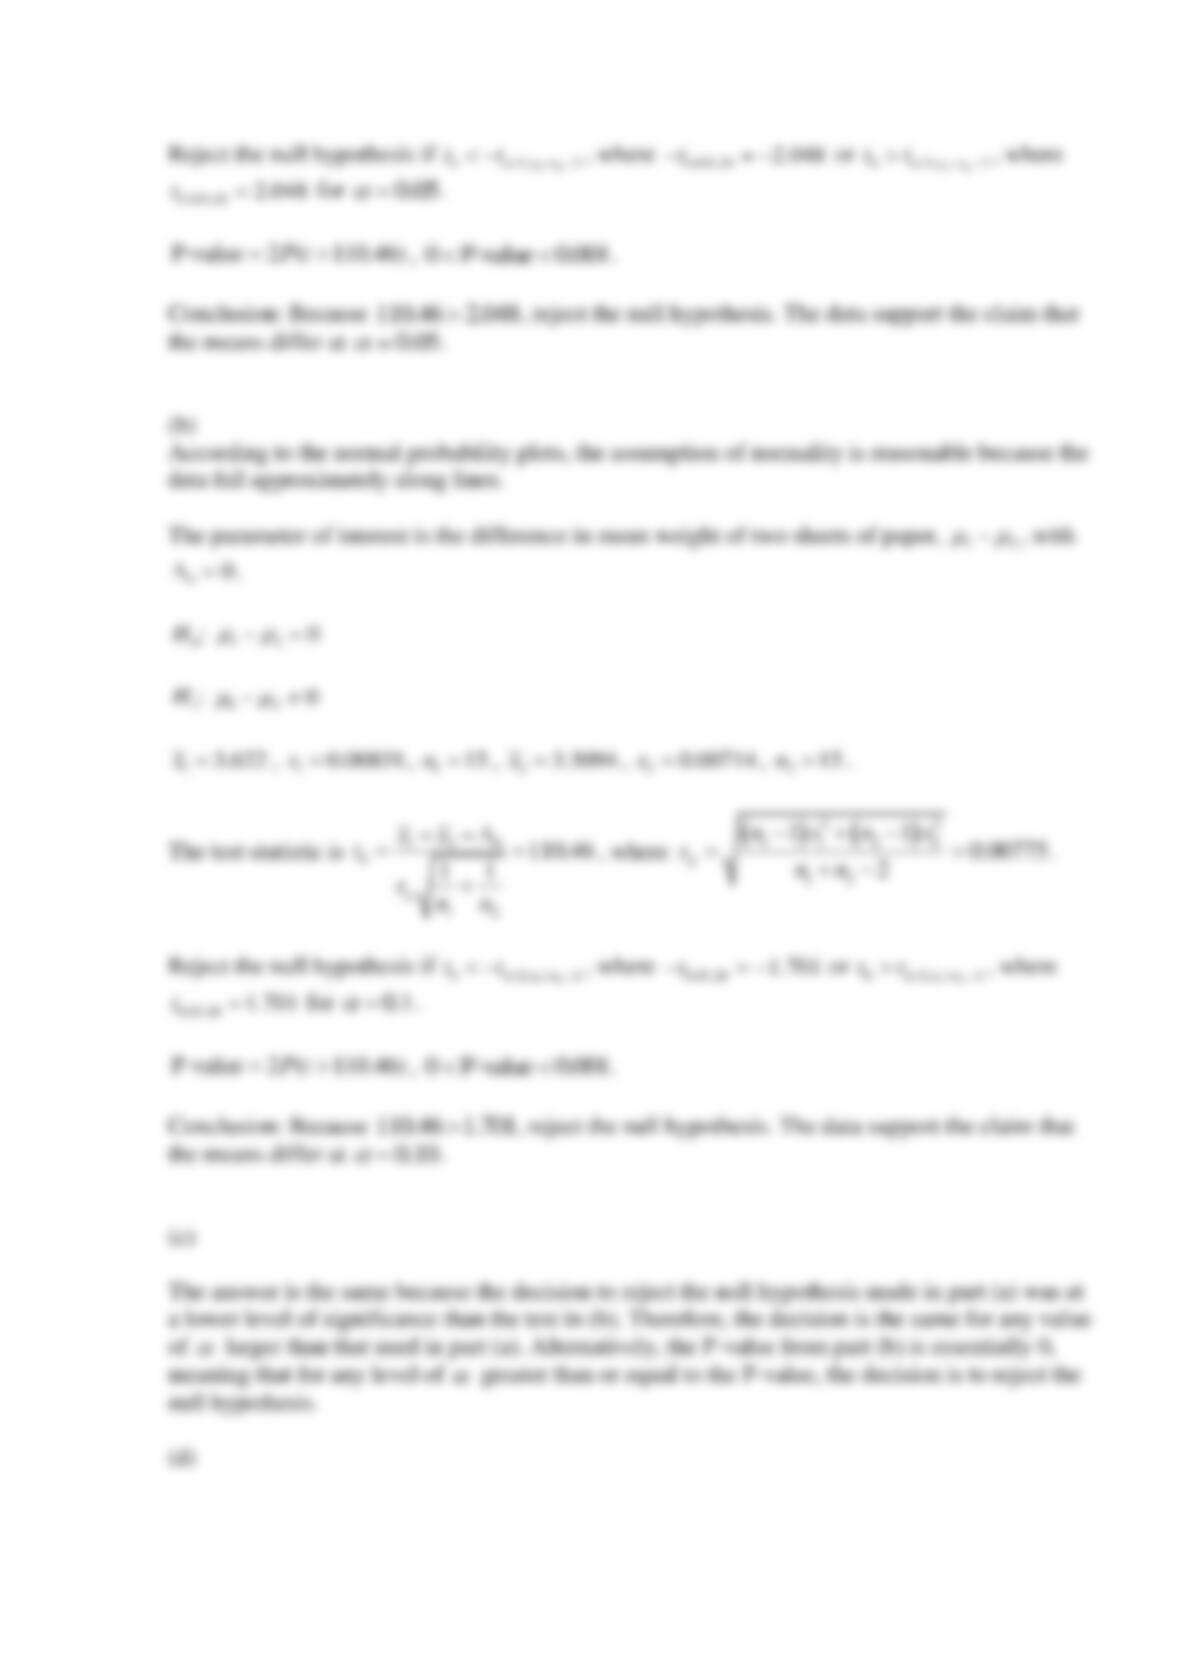
Reserve Problems Chapter 10 Section 2 Problem 9
Let us suppose we have data on the absorbency of paper towels that were produced by two
different manufacturing processes. From process 1, the sample size was 10 and had a mean and
standard deviation of 200 and 15, respectively. From process 2, the sample size was 4 with a
mean and standard deviation of 320 and 50, respectively. Find a 95% confidence interval on the
difference in the towels’ mean absorbency produced by the two processes. Assume the standard
deviations are estimated from the data. How would you interpret this CI? Is the value zero in the
CI?
SOLUTION