10.4.3 a)
1) The parameter of interest is the mean difference in natural vibration frequencies, d where di = finite element −
10.4.4 a)
4) The test statistic is
10.4.5
b) Let x67 = x7 − x6
Section 10-5
10.5.2 1) The parameters of interest are the variances of concentration,
22
12
,
4) The test statistic is
=
22
0 1 2
:H
10.5.4 1) The parameters of interest are the strength variances,
22
12
,
10.5.5 1) The parameters of interest are the overall distance standard deviations, σ1, σ2
2)
=
22
0 1 2
:H
7) Conclusion: Because 0.288 < 1.538 < 3.474, fail to reject the null hypothesis. There is not sufficient evidence that there
Section 10-6
10.6.1 a) This is a two-sided test because the hypotheses are p1 – p2 = 0 versus not equal to 0.
54
60
+
54 60
10.6.2 a)
1) The parameters of interest are the proportion of successes of surgical repairs for different tears, p1 and p2
7) Conclusion: Because 0.387 < 1.65, we fail to reject the null hypothesis at the 0.05 level of significance.
10.6.3 a)
1) The parameters of interest are the proportion of defective parts, p1 and p2
b) 95% confidence interval on the difference:
c) Power = 1 −
10.6.4 a)
1) The parameters of interest are the proportion of residents in favor of an increase, p1 and p2
10.6.5
H0 : p1 = p2
H1 : p1 < p2
10.6.6
= + =
= + =
SupplementalExercises
10.S7 a)
= = =
1
1
1
2.23
SE Mean 0.50
20
s
n
;
==
2
2
2
SE Mean 0.7133
s
n
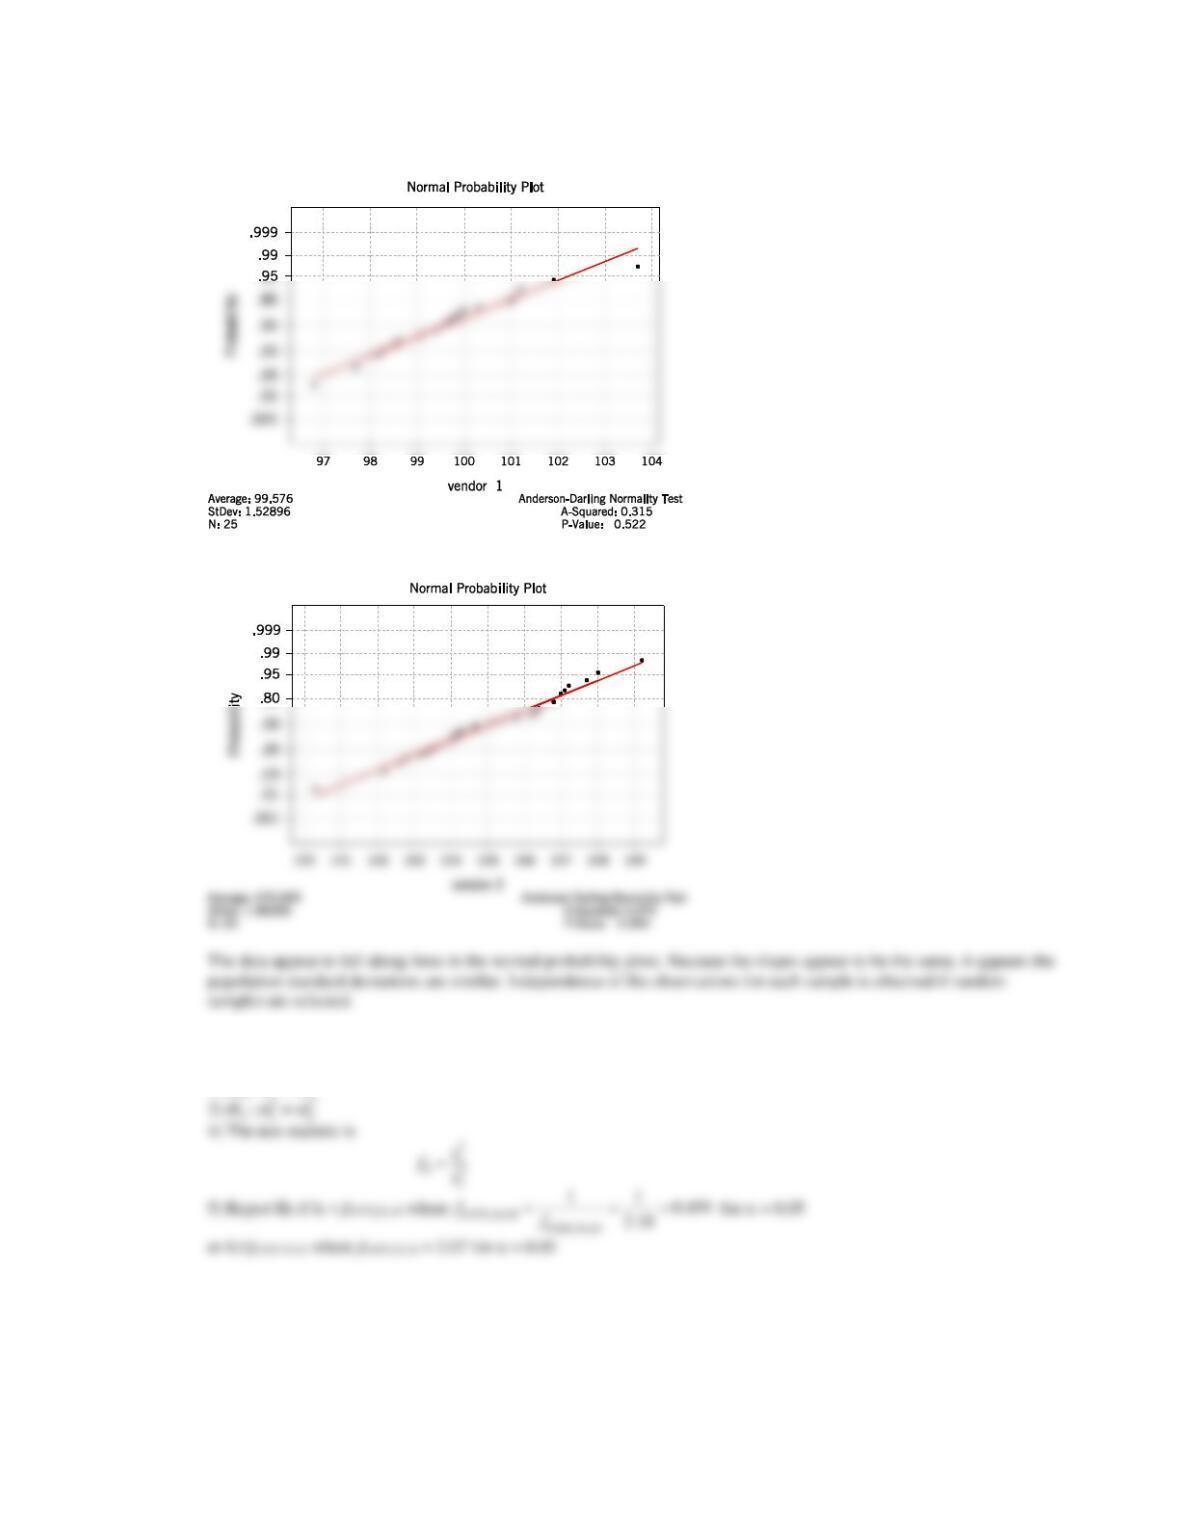
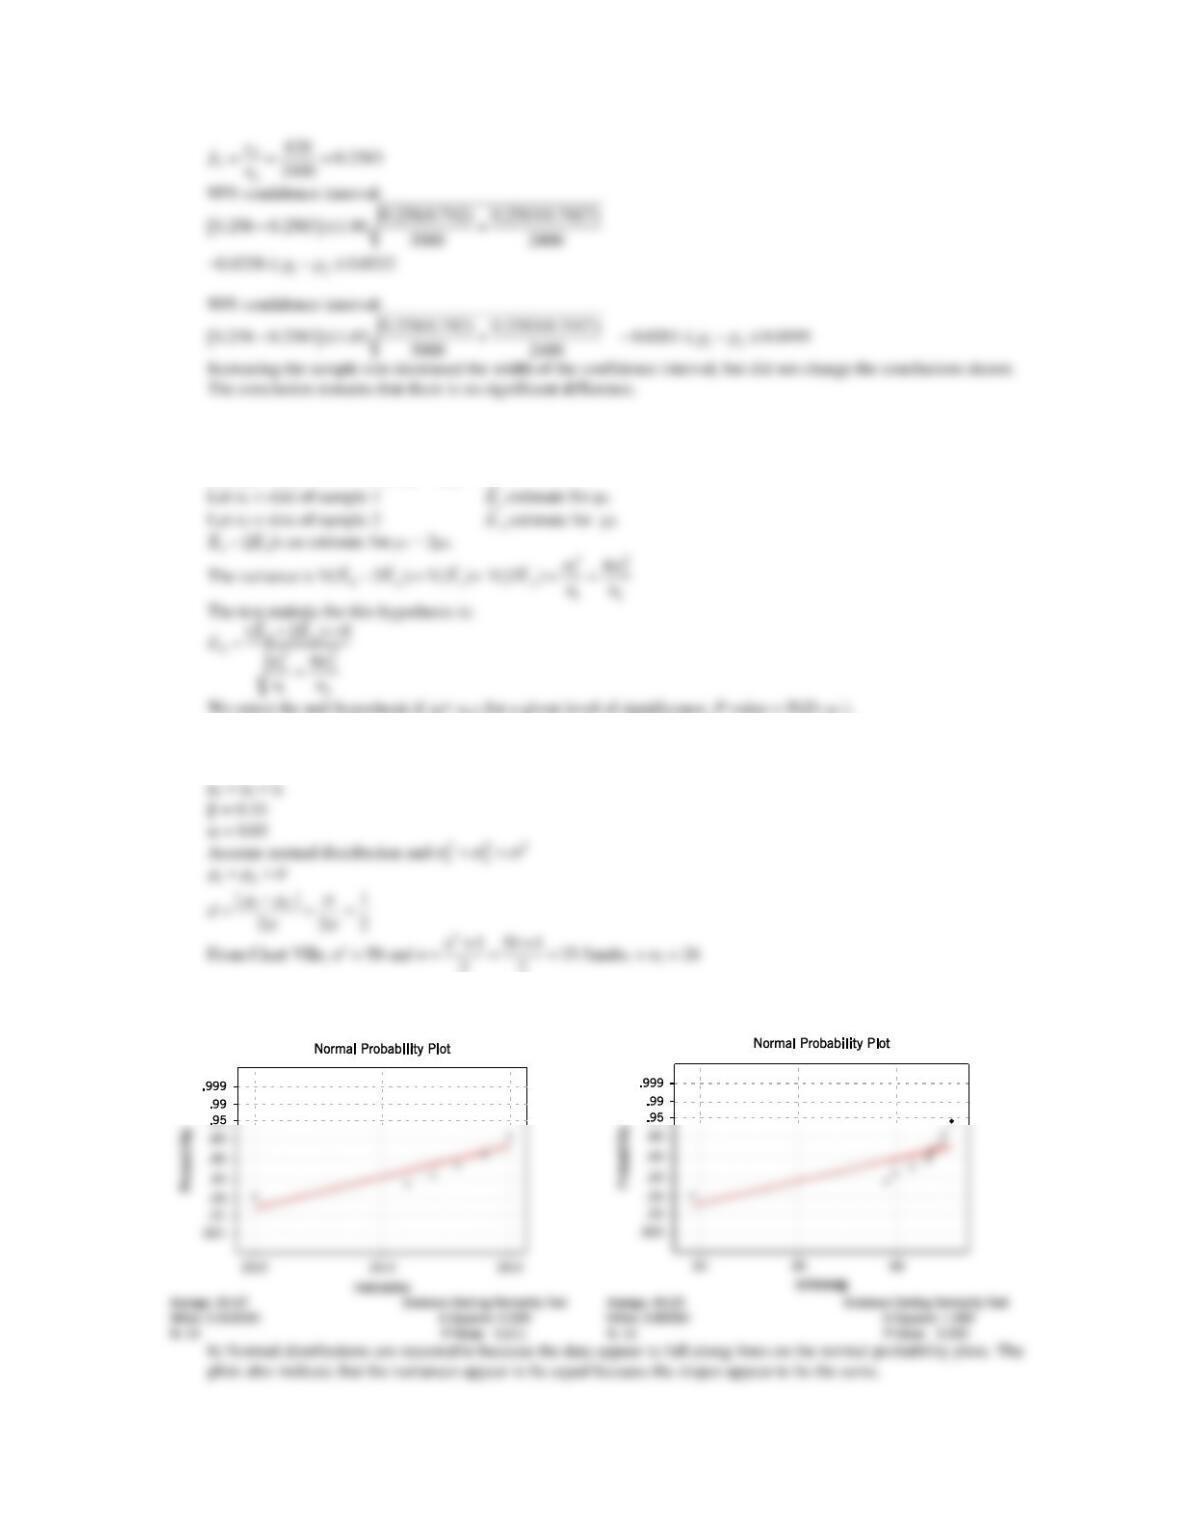
10.S8 a) Assumptions that must be met are normality and independence of the observations. Normality appears to be reasonable.
b)
1) The parameters of interest are the variances of resistance of products,
22
12
,
2)
=
22
:H
10.S9 a)
c)
4) The test statistic is
10.S10 a)
10.S11
= = =
1
1
387
ˆ0.258
x
pn
= = =
2
2
310
ˆ0.2583
x
pn
Because zero is contained in this interval, there is no significant difference between the proportions of unlisted numbers in
the two cities at a 5% significance level.
10.S12 The parameter of interest is μ1 − 2μ2
= − =
→
−
0 1 2 0 1 2
1 1 2 1 1 2
: 2 : 2 0
: 2 : 2 0
HH
HH
10.S14 H0 : μ1 = μ2
H1 : μ1 ≠ μ2
22
10.S13 a) No, since the points do not lie on the straight line
d) Consider a one-sided 95% confidence interval on the ratio of the variances,
22
/
VM
e)
22
10.S15
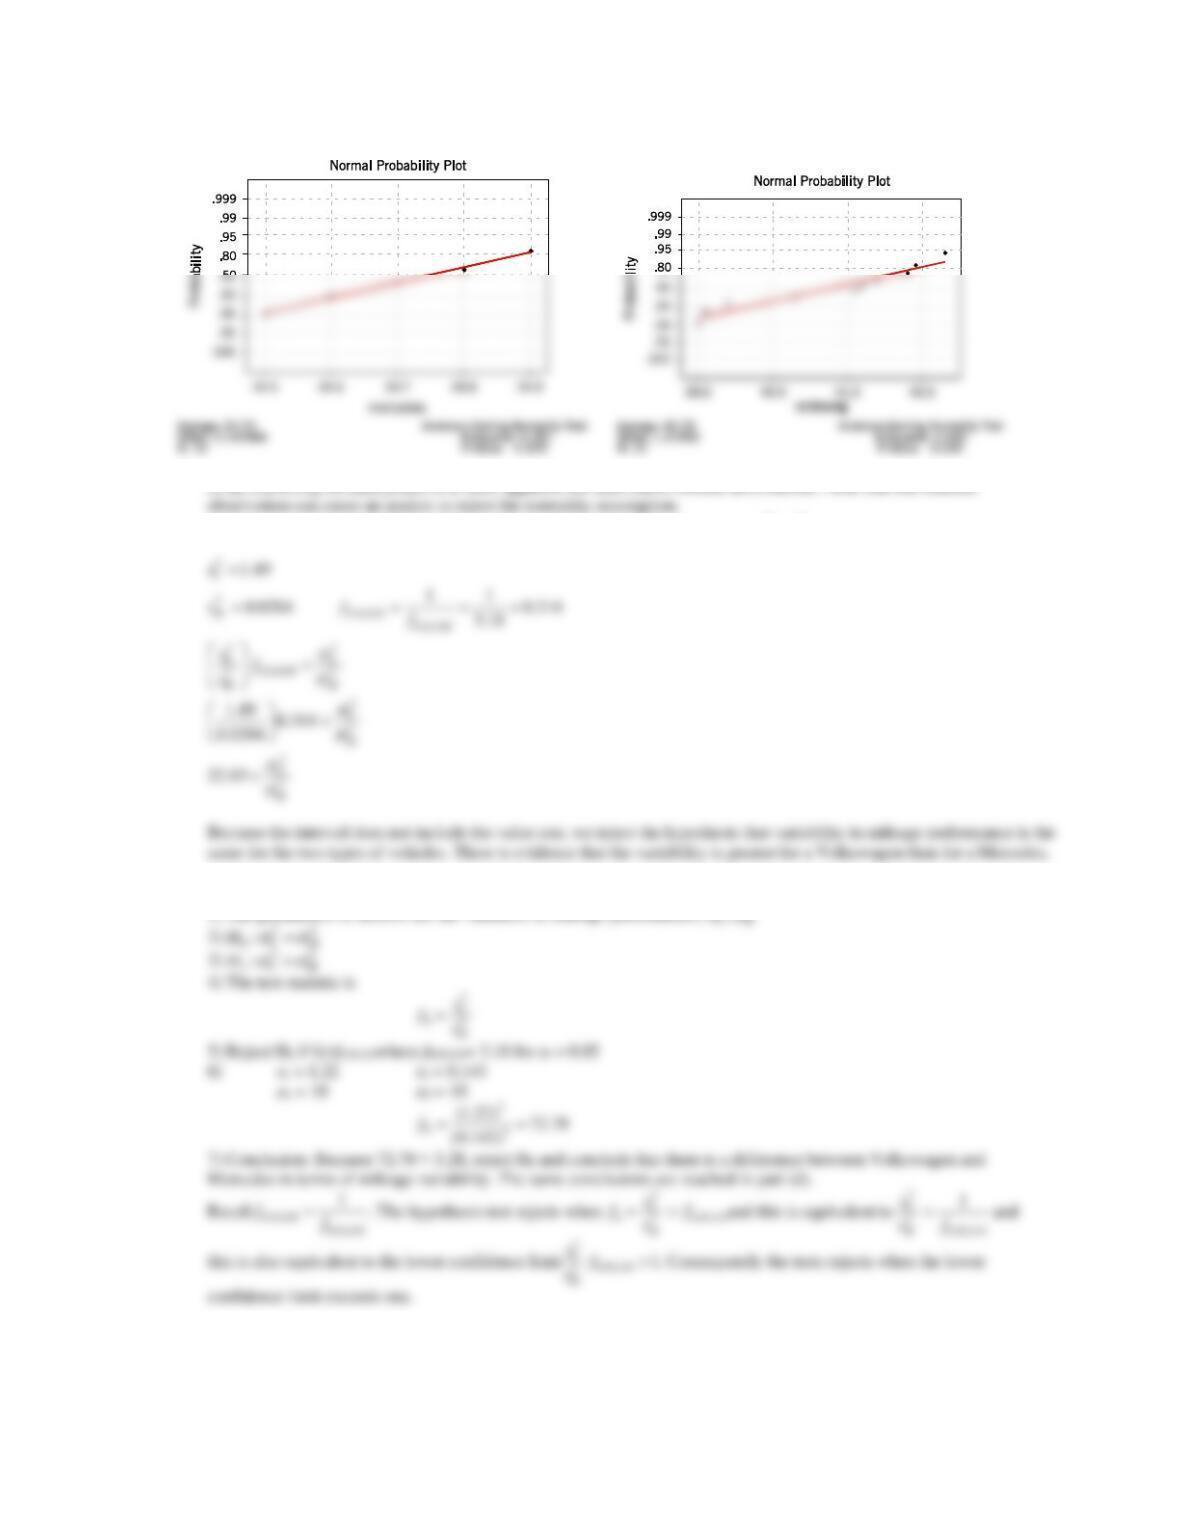
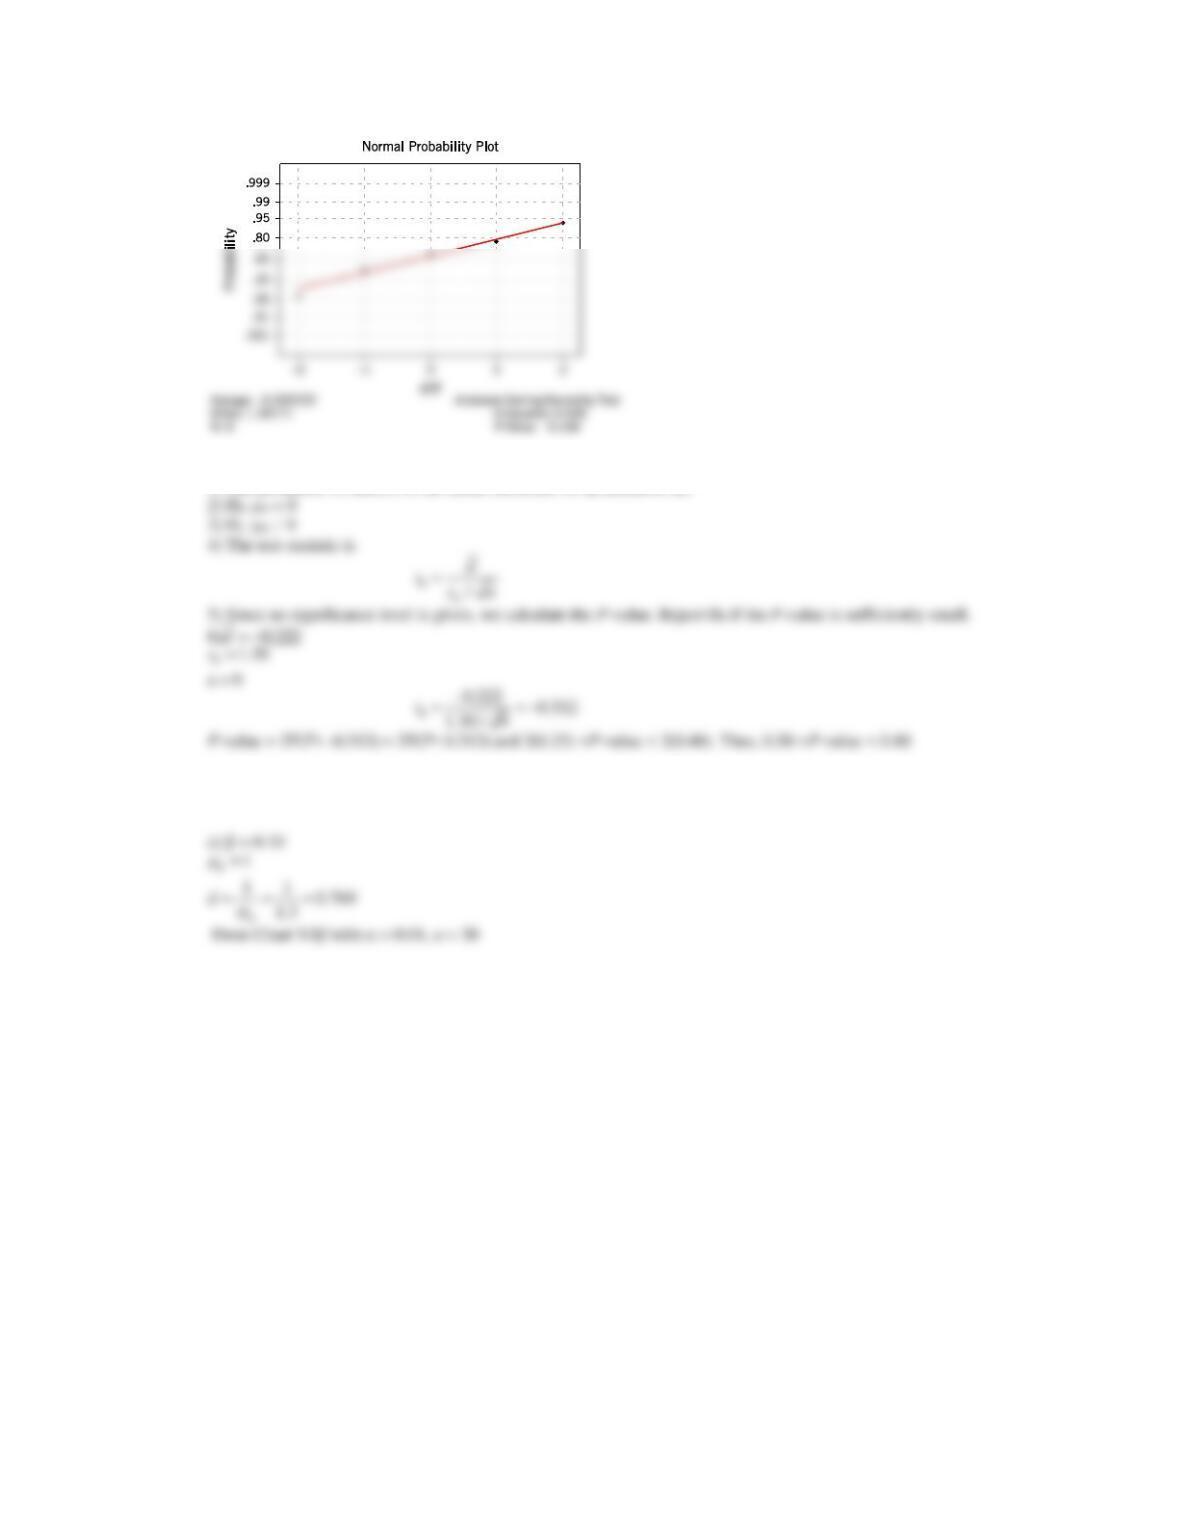
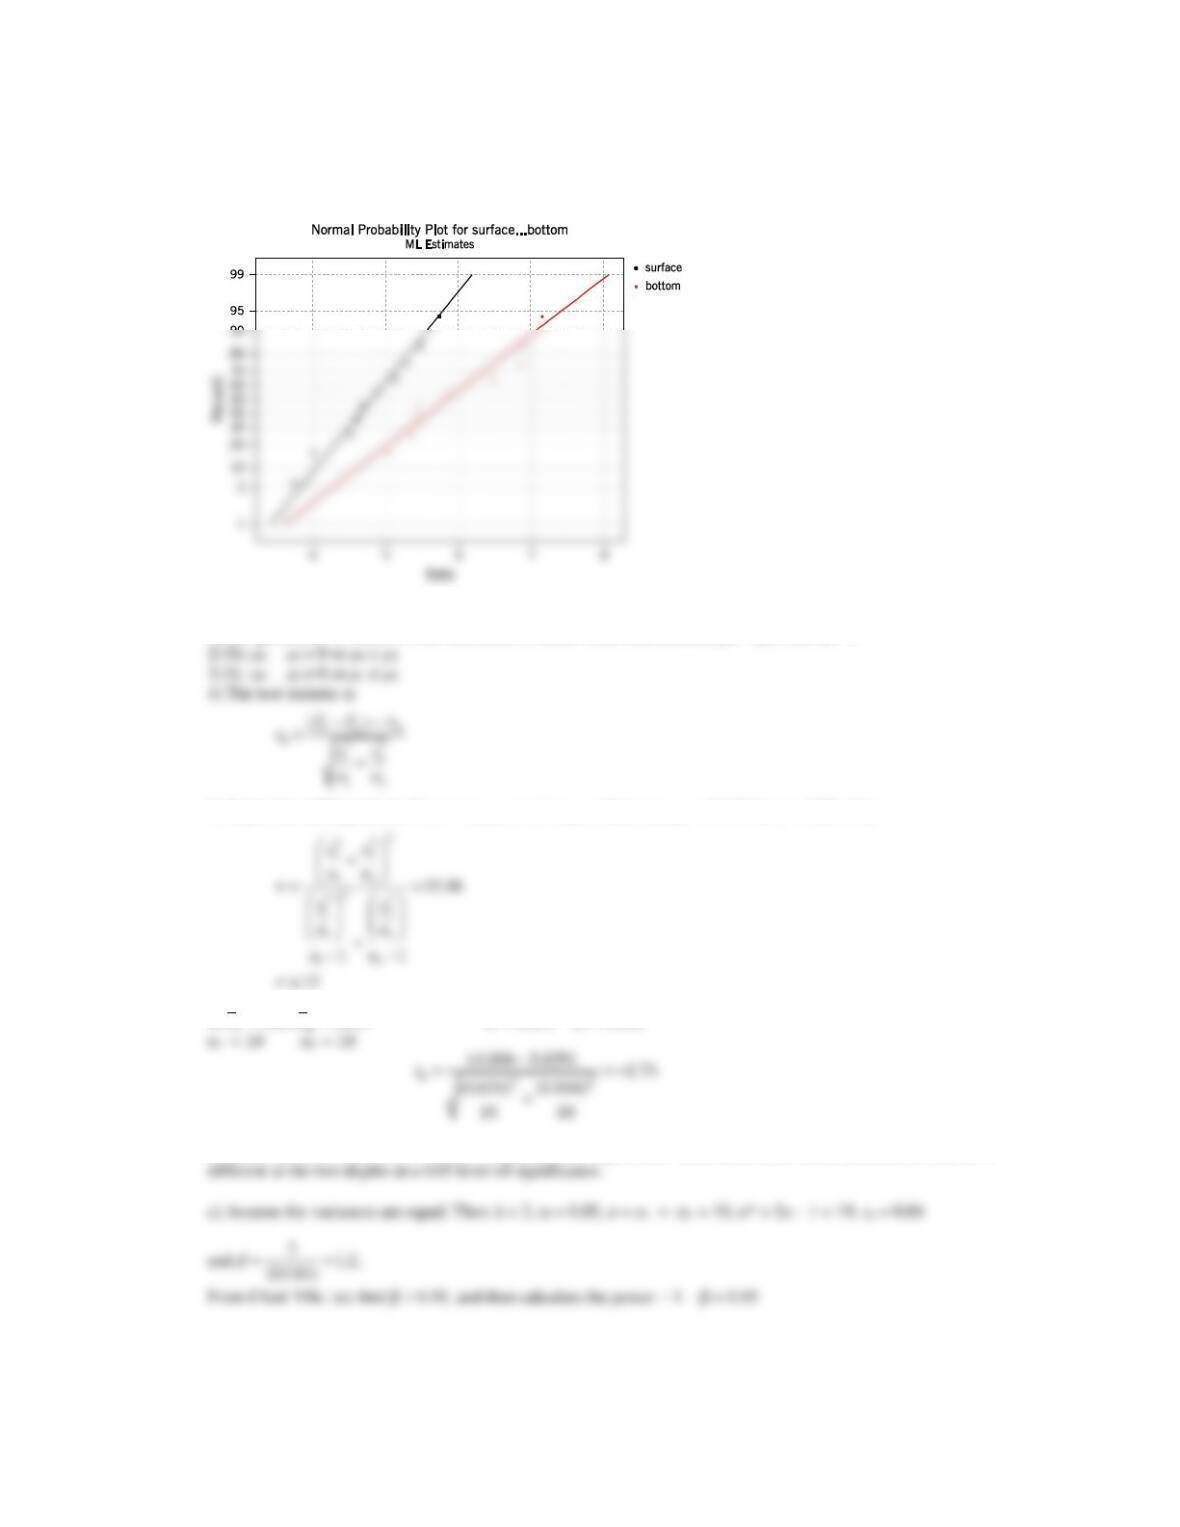
a) The assumption of normality appears to be reasonable. The data lie along a line in the normal probability plot.
b)
1) The parameter of interest is the mean difference in tip hardness, d
7) Conclusion: Because the P-value is greater than common levels of significance, fail to reject H0 and conclude there
is no difference in mean tip hardness.
10.S16
a) Because the data fall along lines, the data from both depths appear to be normally distributed, but the slopes do not
appear to be equal. Therefore, it is not reasonable to assume that
=
22
12
.
b)
1) The parameter of interest is the difference in mean HCB concentration, μ1 − μ2, with 0= 0
5) Reject the null hypothesis if t0< − t0.025,15 or t0>t0.025,15where t0.025,15 = 2.131 for = 0.05. Also
6)
=
=
s1 = 0.631 s2 = 1.014
7) Conclusion: Because –2.74 < –2.131, reject the null hypothesis. Conclude that the mean HCB concentration is
10.S17
= + =
11500 2 1502n
= + =
21200 2 1202n