Reserve Problems Chapter 10 Section 2 Problem 10
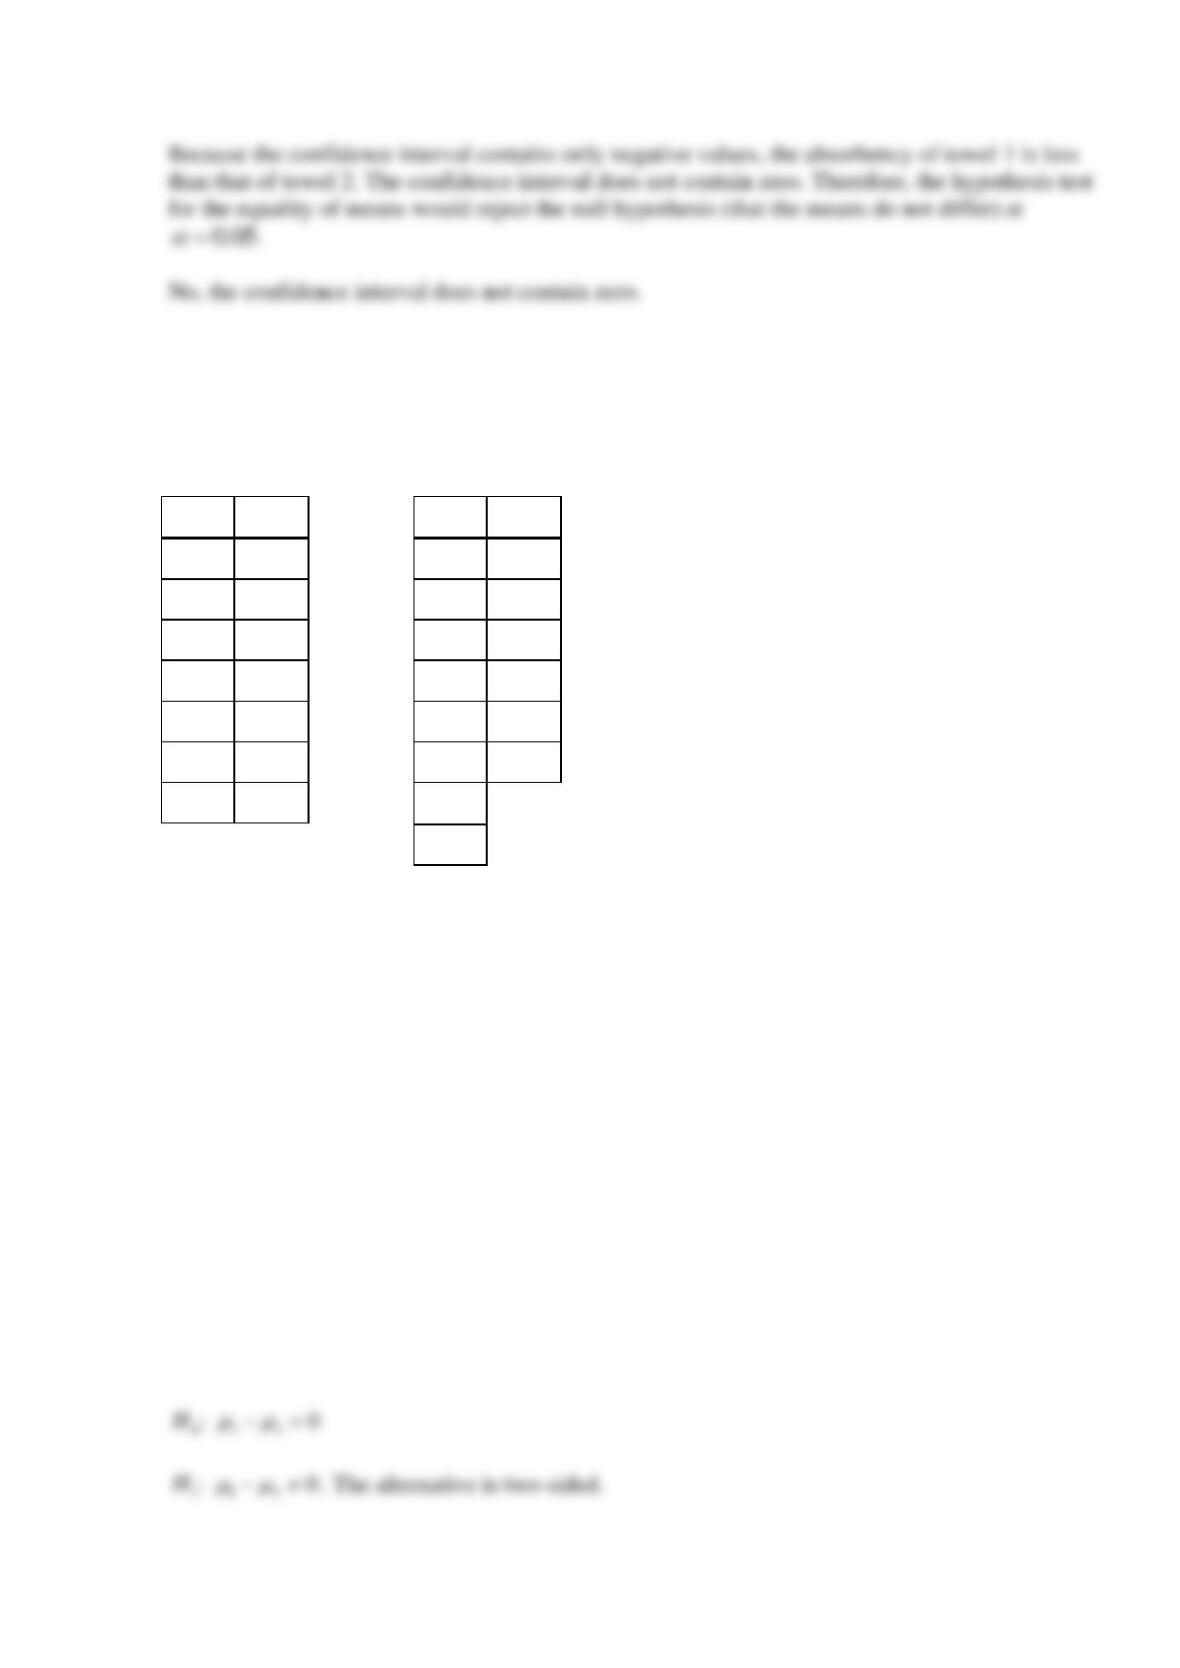
The following is a random sample of 15 measurements from high-flow rivers and 13 from low-
flow rivers of a total algae content (units are mg/L).
High
Low
High
Low
24.3
21.4
32
46.1
24.8
62.6
24.4
29
34.6
38.8
40.5
44.8
42.5
50.3
66
41.7
57
37.1
76.8
14.8
79.8
36.3
44.9
19.4
18.8
58
49.9
57.4
(a) Test the null hypothesis at
0.05
=
, that the amount of algae content is the same in both
high- and low-flow rivers. Assume that the variances are equal. Suppose that the alternative
hypothesis is
1
H
:
12
0
−
. Determine the value of test statistic. Determine the condition to
reject the null hypothesis. Select the correct conclusion. Is the alternative one- or two-sided?
(b) Find a 95% confidence interval for the difference in the mean algae content for the two flow
rates.
(c) Is the value zero contained in the 95% confidence interval? Explain the connection with the
conclusion you reached in part (a).
SOLUTION
(a)
The parameter of interest is the difference in mean algae content
12
−
, with
00=
.
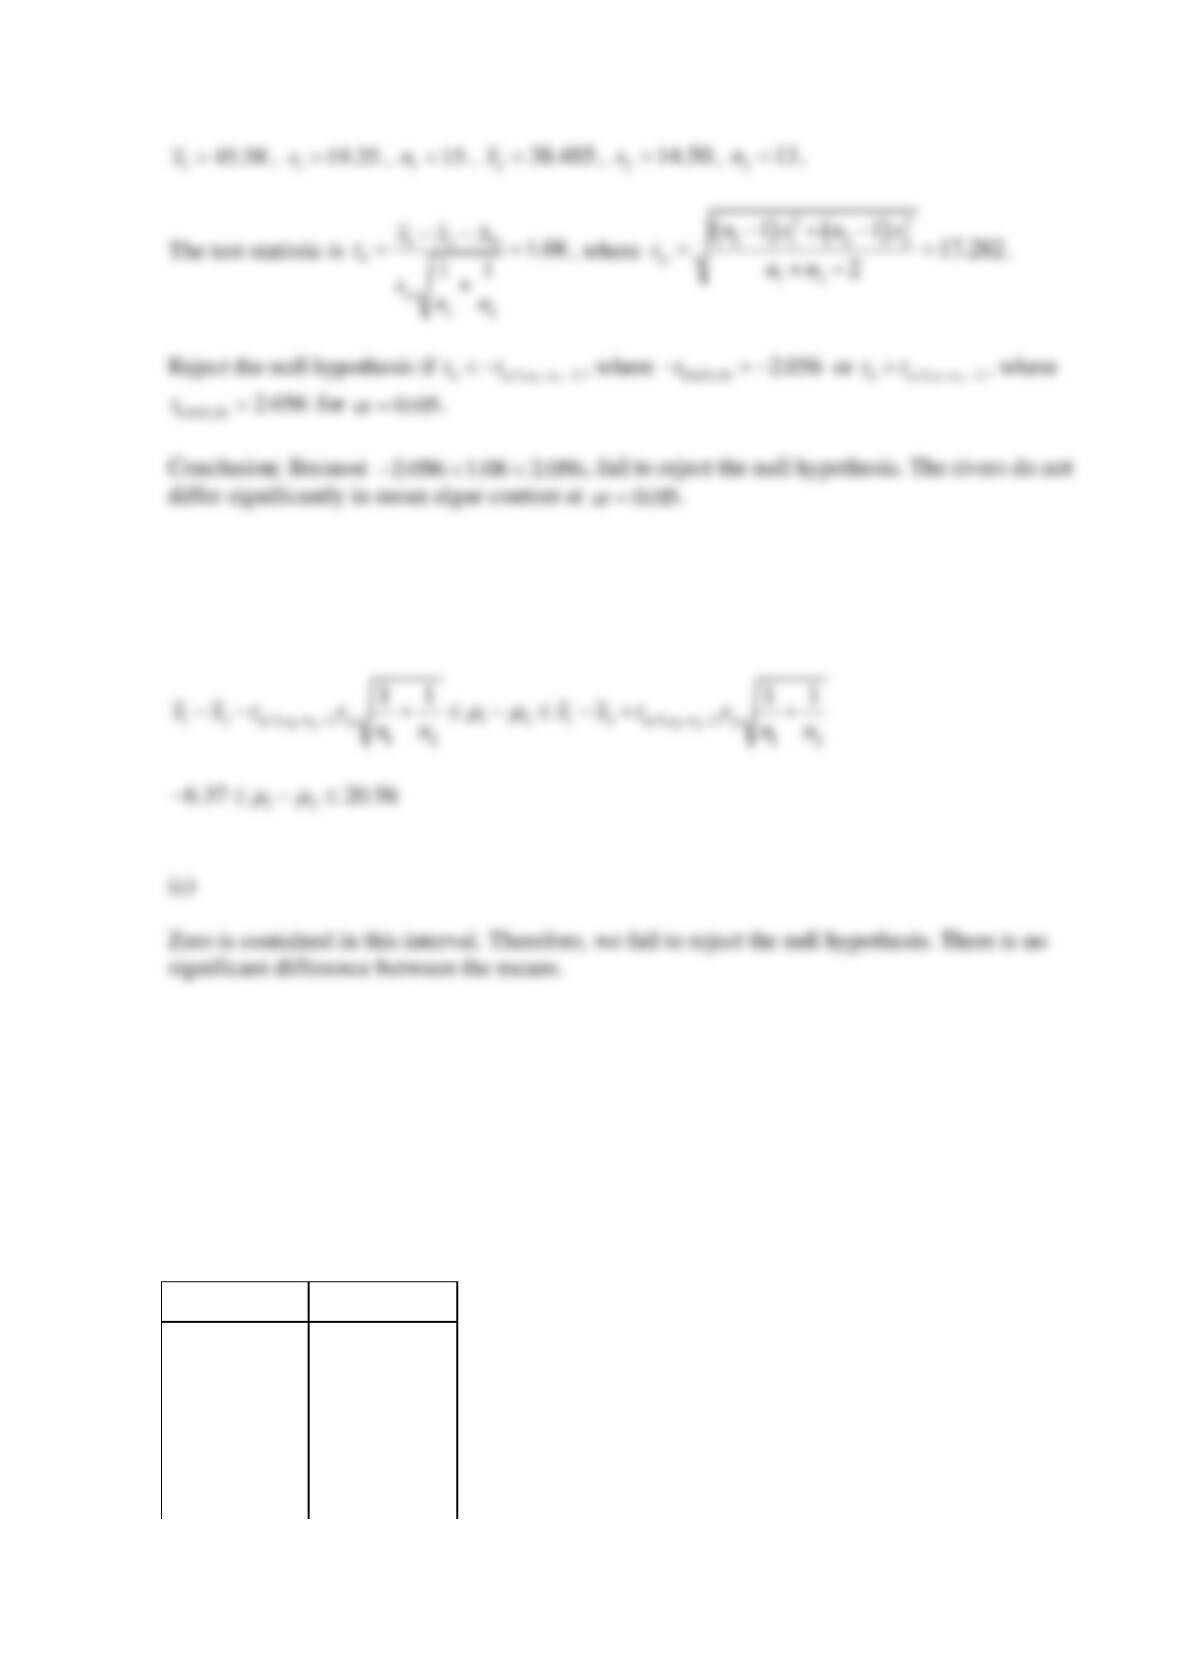
(b)
Use a 95% two-sided confidence interval
Reserve Problems Chapter 10 Section 2 Problem 11
Olympic swimmers are seeded according to their previous 12-month performances with faster
swimmers going into the later heats. The last 24 swimmers, however, are distributed among the
last three heats more evenly. So we should see large differences in times of heats one–five but
not among the last three heats. The data of times from heats five–seven are in seconds for the
100m swim. NA indicates that the swimmer did not swim.
Time
Heat
Time
Heat
49.02
5
48.67
6
49.49
5
49.18
6
49.6
5
49.2
6
49.78
5
NA
6
49.95
5
48.54
7
50.08
5
48.67
7
NA
5
48.93
7
NA
5
48.93
7
48.19
6
48.97
7
48.29
6
49.03
7
48.54
6
49.29
7
48.6
6
Is there a statistically significant difference in the mean time of swimmers in heats 6 and 7 and
the mean time of swimmers in heat 5? Assume that the variances are equal. Use
0.05
=
.
Suppose that the hypotheses are
0
H
:
12
0
−=
versus
1
H
:
12
0
−
, where heats 6 and 7
are group 1 and heat 5 is group 2. Determine the value of test statistic. Select the correct
conclusion.
Is there evidence to suggest that the means of the heats differ for slower swimmers in heat five
and the faster swimmers in heat seven? Assume that the variances are equal. Use
0.05
=
.
Suppose that the hypotheses are
0
H
:
12
0
−=
versus
1
H
:
12
0
−
, where heat 5 is group
1 and heat 7 is group 2. Determine the value of test statistic. Select the correct conclusion.
What about the means of the two sets of elite swimmers in heats six and seven? Assume that the
variances are equal. Use
0.05
=
. Suppose that the hypotheses are
0
H
:
12
0
−=
versus
1
H
:
12
0
−
, where heat 6 is group 1 and heat 7 is group 2. Determine the value of test statistic.
Determine the condition to reject the null hypothesis. Select the correct conclusion.
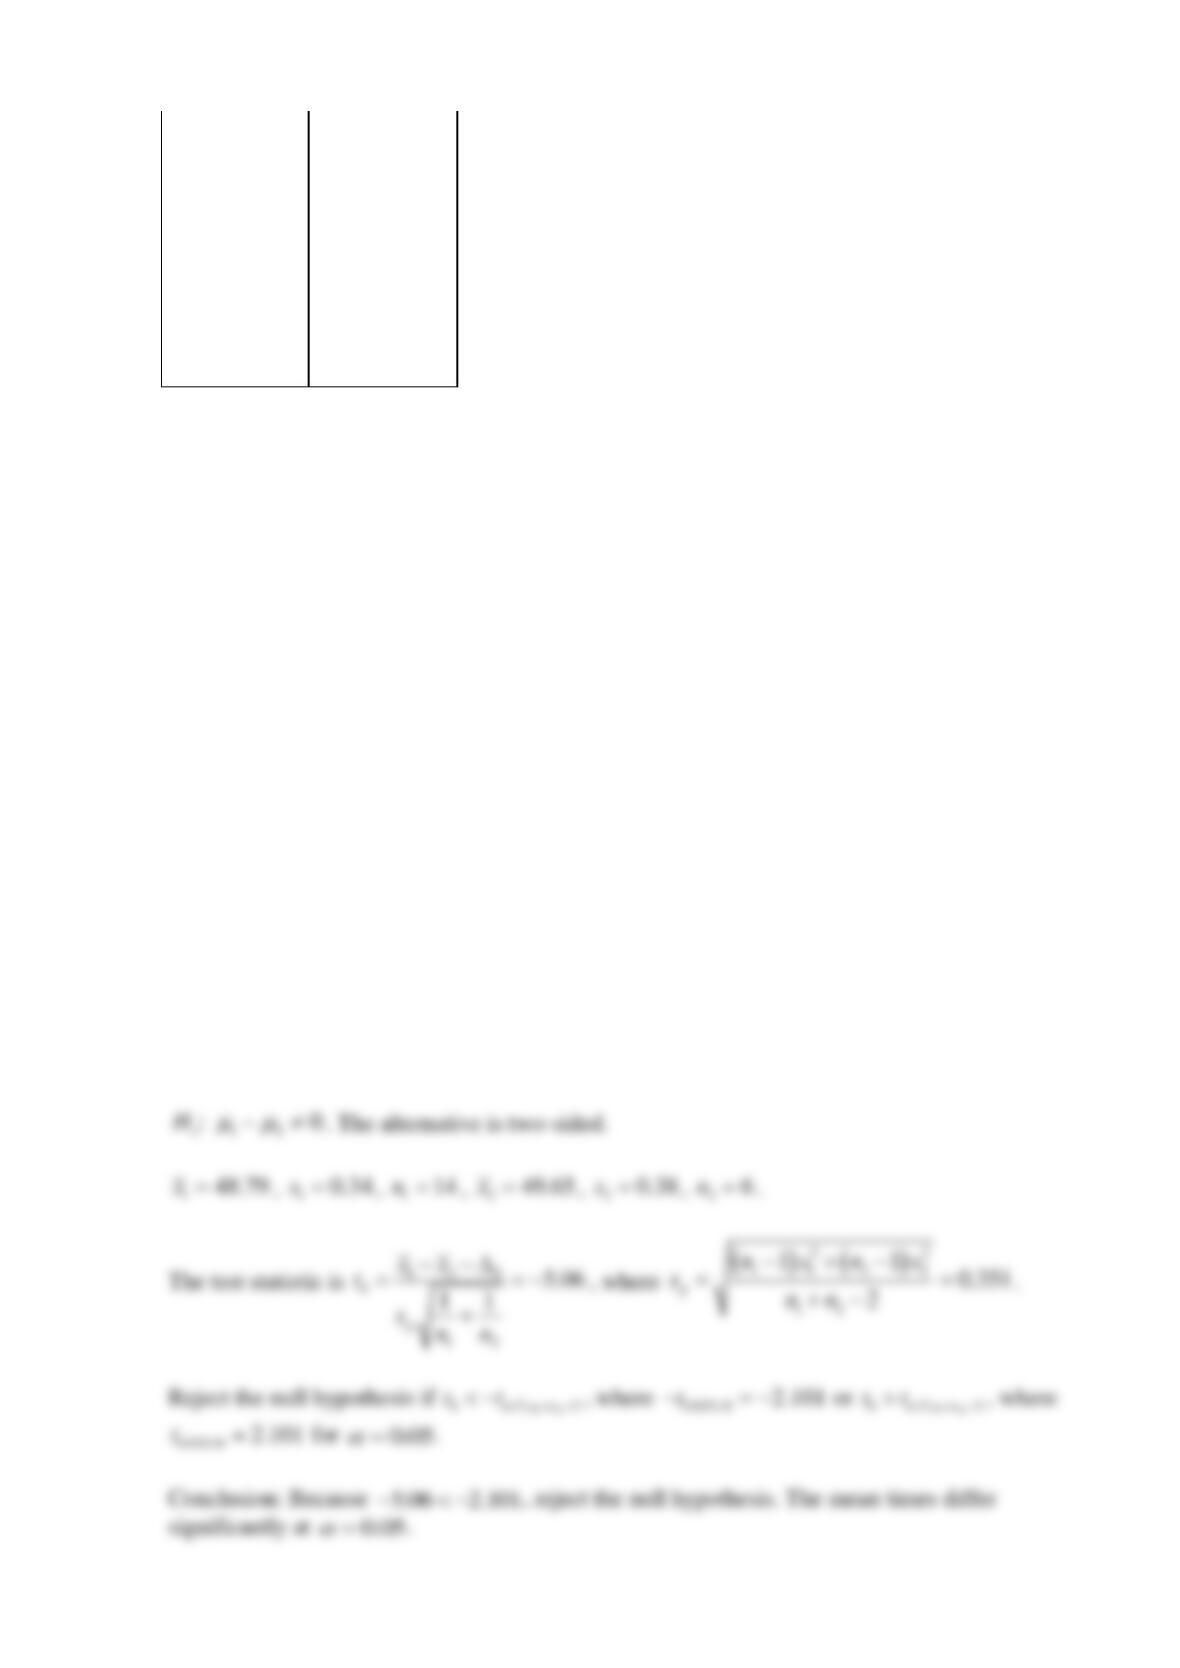
SOLUTION
Heats 6 and 7 are group 1 and heat 5 is group 2. The parameter of interest is the difference in
mean time
12
−
, with
00=
.
0 1 2
: 0H
−=
0.05
=
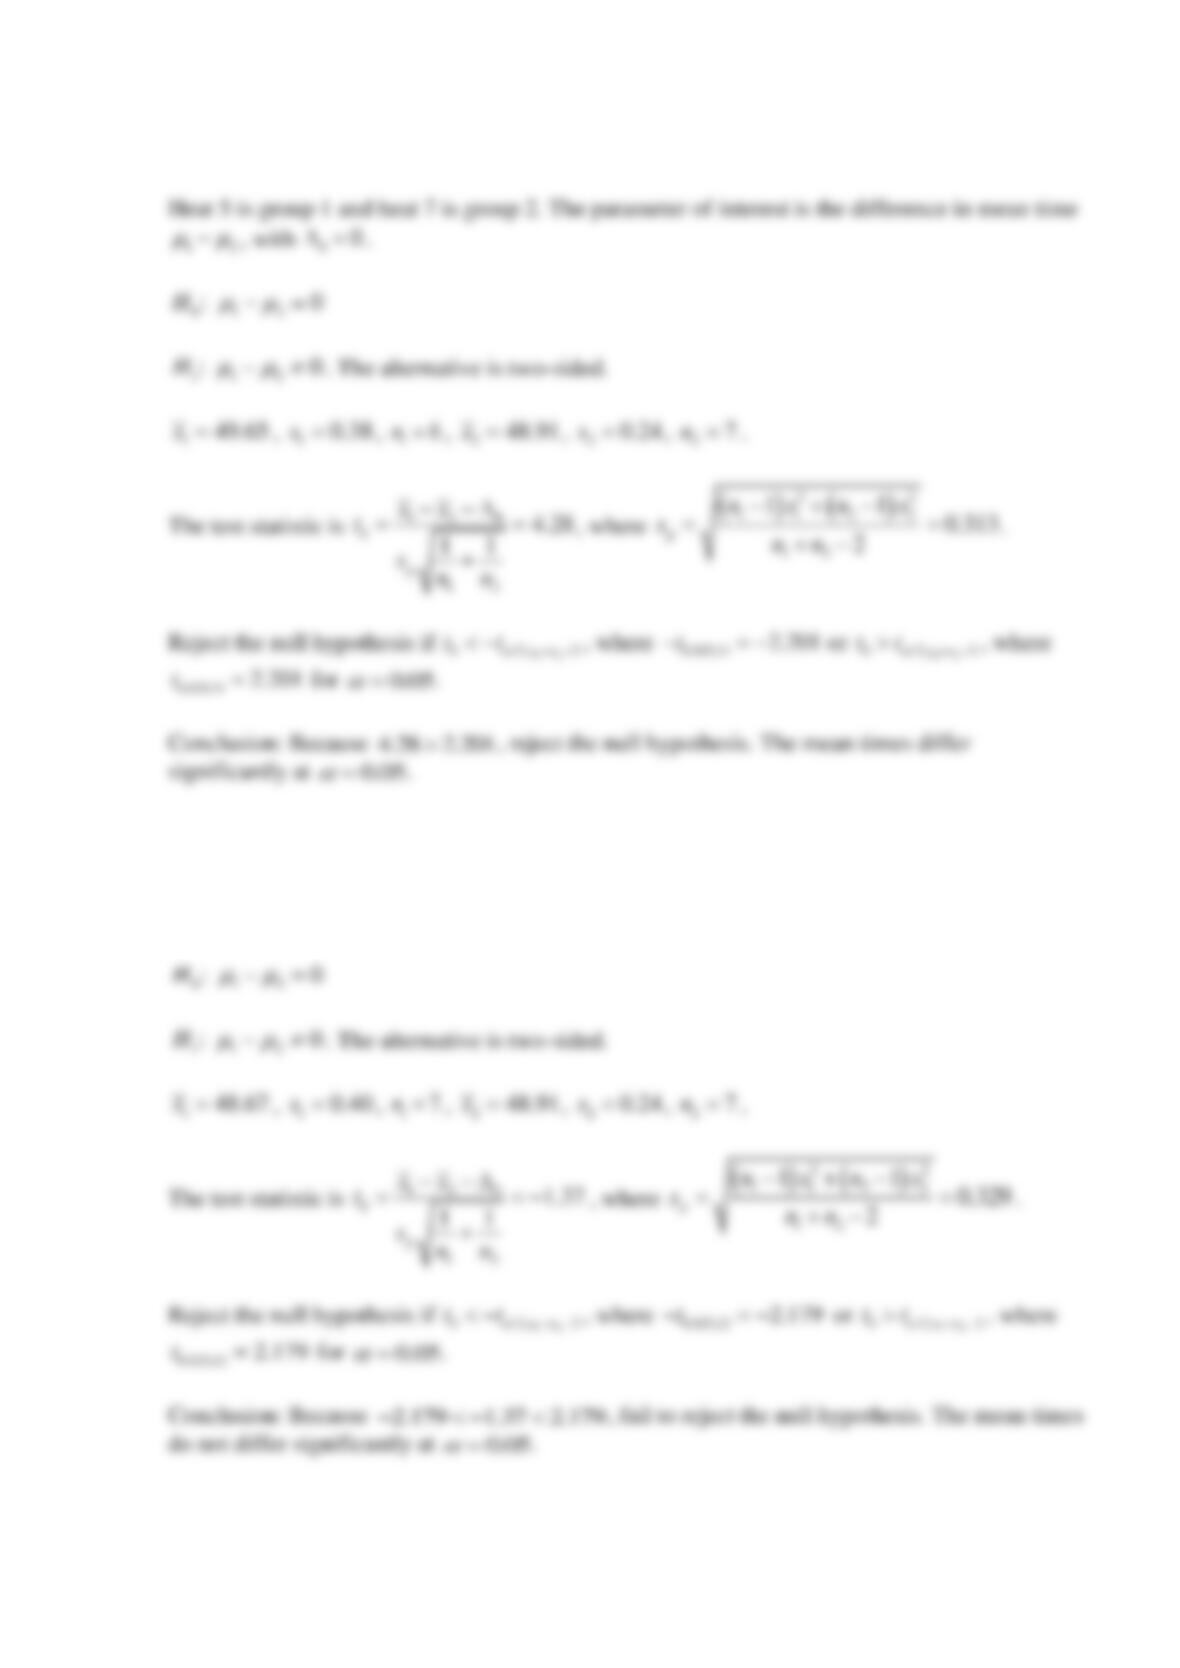
Heat 6 is group 1 and heat 7 is group 2. The parameter of interest is the difference in mean time
12
−
, with
00=
.
Reserve Problems Chapter 10 Section 2 Problem 12
12
−
00=
An article in Polymer Degradation and Stability (2006, Vol. 91) presented data from a nine-year
aging study on S537 foam. Foam samples were compressed to 50% of their original thickness
and stored at different temperatures for nine years. At the start of the experiment as well as
during each year, sample thickness was measured, and the thicknesses of the eight samples at
each storage condition were recorded. The data for two storage conditions follow.
50ºC
0.047
0.060
0.061
0.064
0.080
0.090
0.118
0.165
0.183
60ºC
0.062
0.105
0.118
0.137
0.153
0.197
0.210
0.250
0.375
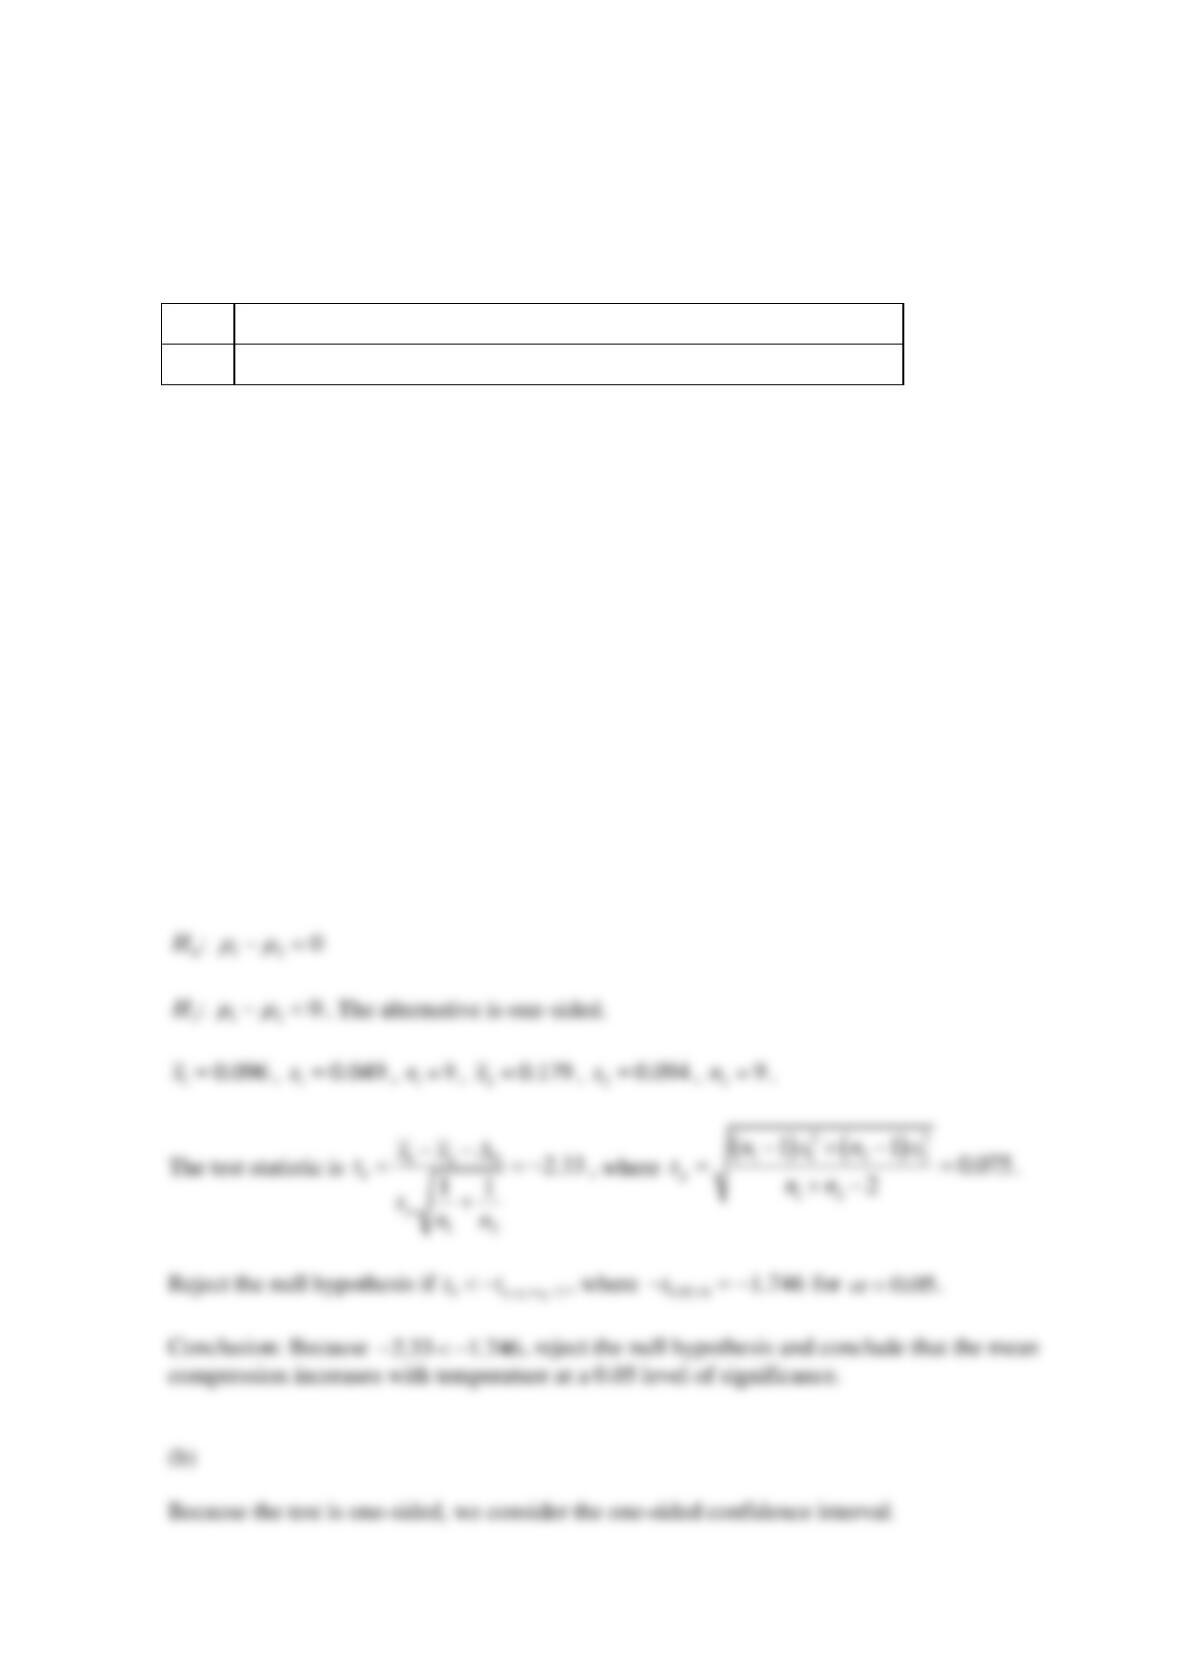
(a) Is there evidence to support the claim that mean compression increases with the temperature
at the storage condition? Assume that the variances are equal. Use
0.05
=
. Suppose that the
hypotheses are
0
H
:
12
0
−=
versus
1
H
:
12
0
−
, where 1 indicates the storage at 50°C
and 2 indicates the storage at 60°C. Determine the value of test statistic. Determine the condition
to reject the null hypothesis. Select the correct conclusion.
(b) Find a 95% confidence interval for the difference in the mean compression for the two
temperatures.
(c) Is the value zero contained in the 95% confidence interval? Explain the connection with the
conclusion you reached in part (a).
SOLUTION
(a)
The parameter of interest is the difference in mean compression between storage conditions
12
−
, with
00=
.
Reserve Problems Chapter 10 Section 3 Problem 1
Consider the days, when a promo action of type A fired price tags with a discount) on one day
and a promo action of type B (every fifth pack is free) on another day were held in the
supermarket.
The values in the following table are indicators of the promo effectiveness (sales volume in
thousand dollars).
promo action of type A
348
81
60
238
150
promo campaign of type B
359
69
40
206
166
Use the Wilcoxon rank-sum test to test
0 1 2
:H
=
against the alternative
1 1 2
:H
, where 1
indicates type A and 2 indicates type B. Use
0.01
=
.
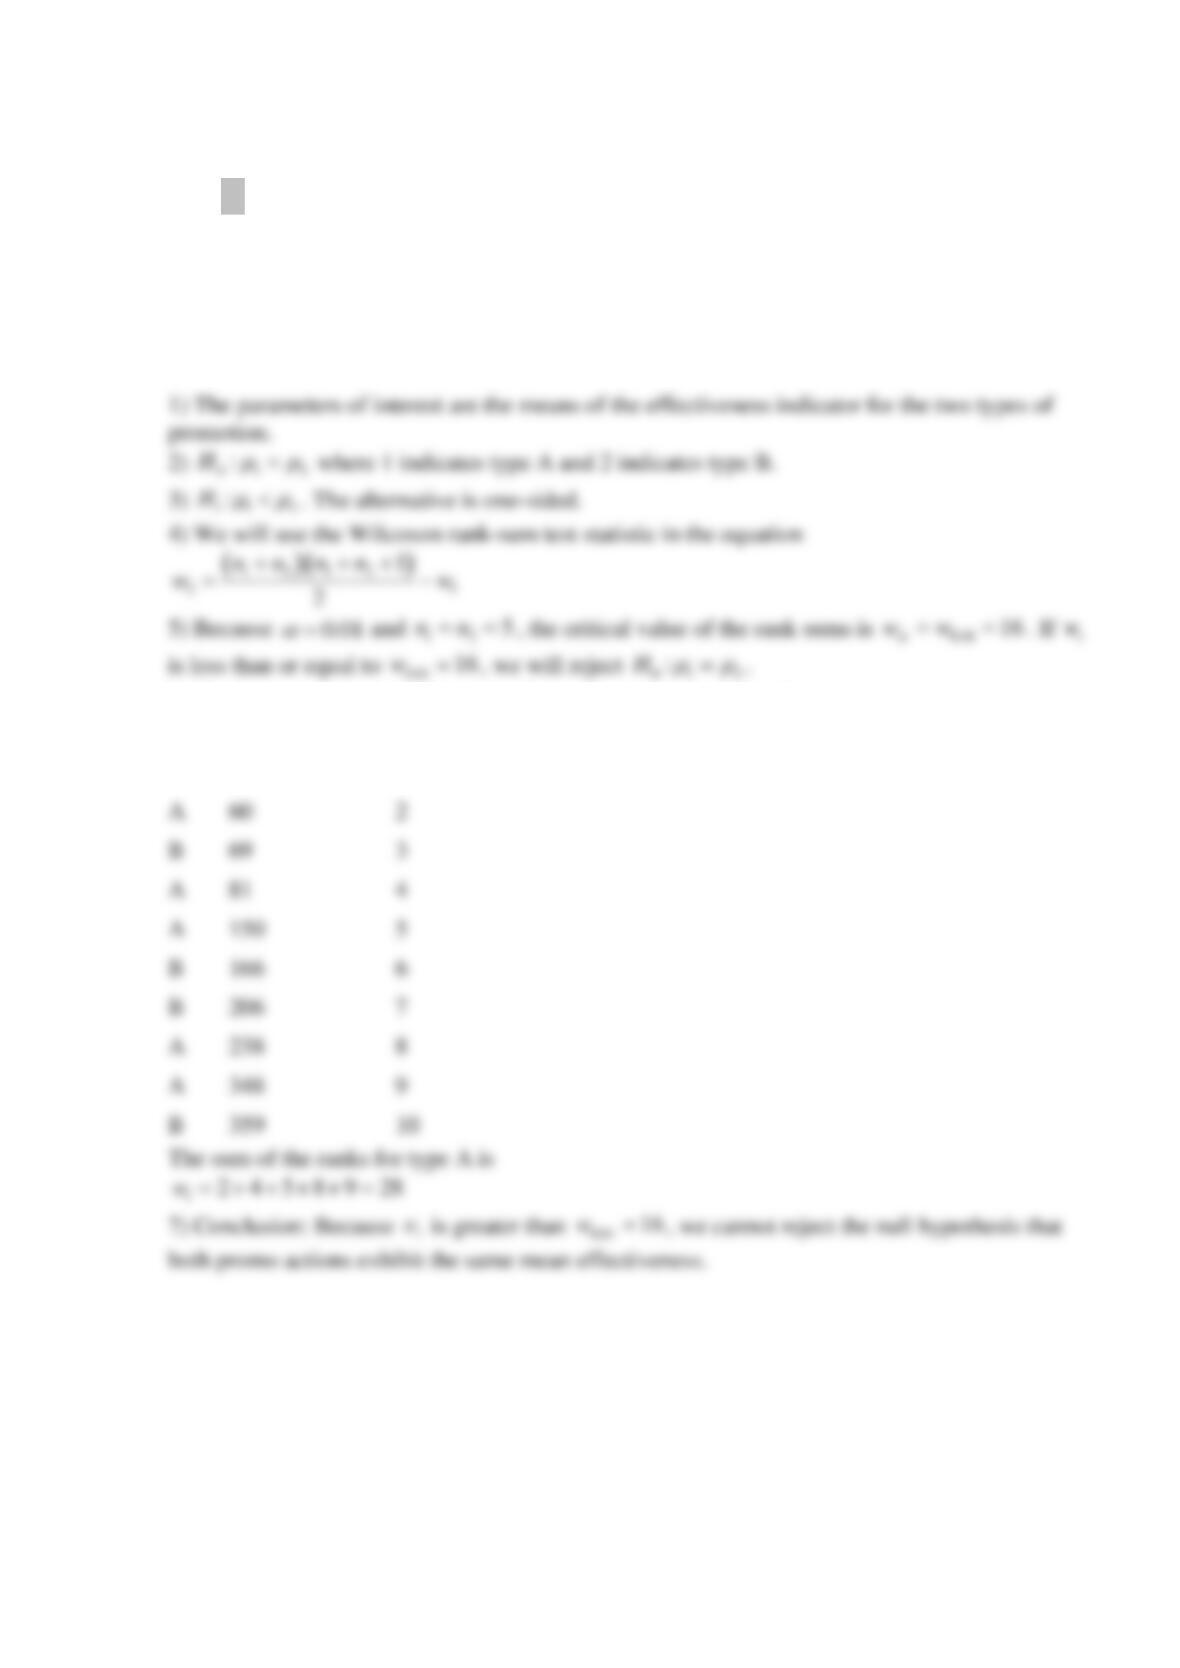
The parameters of interest are the means of the effectiveness indicator for the two types of
promotion.
0 1 2
:H
=
where 1 indicates type A and 2 indicates type B.
1 1 2
:H
. The alternative is ____-sided.
Because
0.01
=
and
12
nn==
___, the critical value of the rank sums is
0.01
ww
==
___. If
1
w
is ____
0.01
w=
____, we will reject
0 1 2
:H
=
.
The data are arranged in the ascending order and ranked as follows:
(Enter the missing values.)
Type
Volume of sales
Rank
__
___
1
A
60
2
B
69
3
A
81
4
__
___
5
__
___
6
B
206
7
A
238
8
__
___
9
B
359
10
The test statistic is
1
w=
__
Conclusion: Because
1
w
is ____
0.01
w
, we ____ reject the null hypothesis that both promo actions
exhibit the same mean effectiveness.
SOLUTION
6) The data are arranged in the ascending order and ranked as follows:
Type
Volume of sales
Rank
B
40
1
A
60
2
B
69
3
A
81
4
A
150
5
B
166
6
B
206
7
A
238
8
A
348
9
B
359
10
Reserve Problems Chapter 10 Section 3 Problem 2
The manufacturer of bicycles is interested in testing two different tires for bicycle wheels. The
tire that is the most wear-resistant would be preferable. The manufacturer obtains 10 samples of
each tire types and tests them. The data from the following table show how many kilometers the
bicycle will pass before the tire bursts.

Unit 1
954
999
1098
1090
985
1005
1009
1063
1086
998
Unit 2
1003
1053
900
997
1008
1011
972
1091
1073
1025
Use the Wilcoxon rank-sum test to test
0 1 2
:H
=
against the alternative
1 1 2
:H
. Use
0.01
=
.
The parameters of interest are the means of the effectiveness indicator for the two types of
promotion.
0 1 2
:H
=
1 1 2
:H
Because
0.01
=
and
12
nn==
___, the critical value of the rank sums is
0.01
ww
==
___. If
either
1
w
or
2
w
is ________
0.01
w=
___, we will reject
0 1 2
:H
=
.
The data are arranged in the ascending order and ranked as follows:
(Enter the missing values.)
Unit
Kilometers
Rank
2
900
1
1
954
2
_
___
3
_
___
4
2
997
5
1
998
6
_
___
7
_
___
8
1
1005
9
2
1008
10
1
1009
11
2
1011
12
2
1025
13
2
1053
14
1
1063
15
2
1073
16
1
1086
17
1
1090
18
2
1091
19
1
1098
20
The test statistics are
1
w=
___
and
2
w=
___
Conclusion: Because neither
1
w
or
2
w
is _________
0.01
w
, we _____ reject the null hypothesis
that both types of tires exhibit the same mean distance passed before the tires burst.
SOLUTION
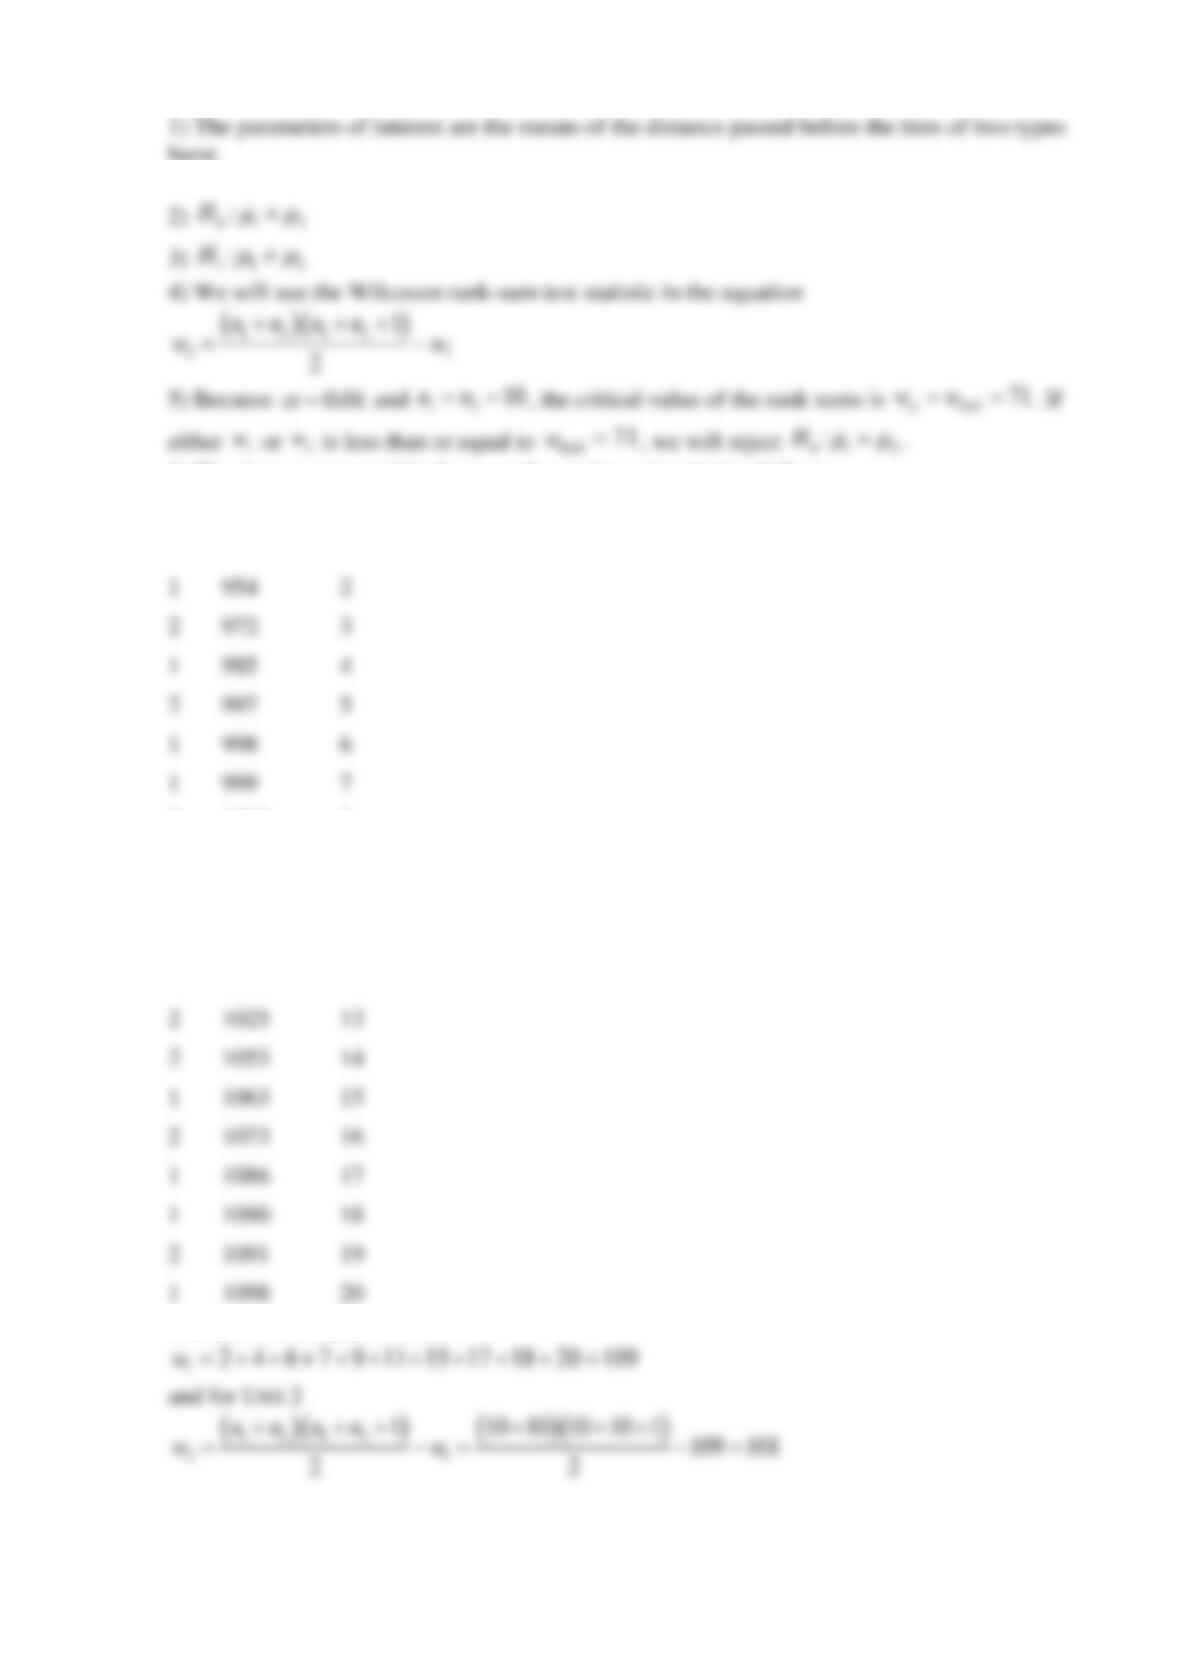
6) The data are arranged in the ascending order and ranked as follows:
Unit
Kilometers
Rank
2
900
1
1
954
2
2
972
3
1
985
4
2
997
5
1
998
6
1
999
7
2
1003
8
1
1005
9
2
1008
10
1
1009
11
2
1011
12
2
1025
13
2
1053
14
1
1063
15
2
1073
16
1
1086
17
1
1090
18
2
1091
19
1
1098
20
The sum of the ranks for Unit 1 is

Reserve Problems Chapter 10 Section 4 Problem 1
To estimate efficiency of a drug for weight loss, the clinical trial was performed. The results are
presented in the table below.
Patient number
Weight before trial, kg
Weight after trial, kg
1
85.2
83.5
2
79.6
78.1
3
75.8
73.2
4
76.2
74.0
5
91
90.2
6
89.8
87.0
7
82.0
79.9
8
81.7
78.5
9
67.3
64.0
10
68.4
65.1
11
70.0
67.8
12
74
70.0
13
66.8
64.6
14
60
58.6
15
94
92.9
16
88.2
88.0
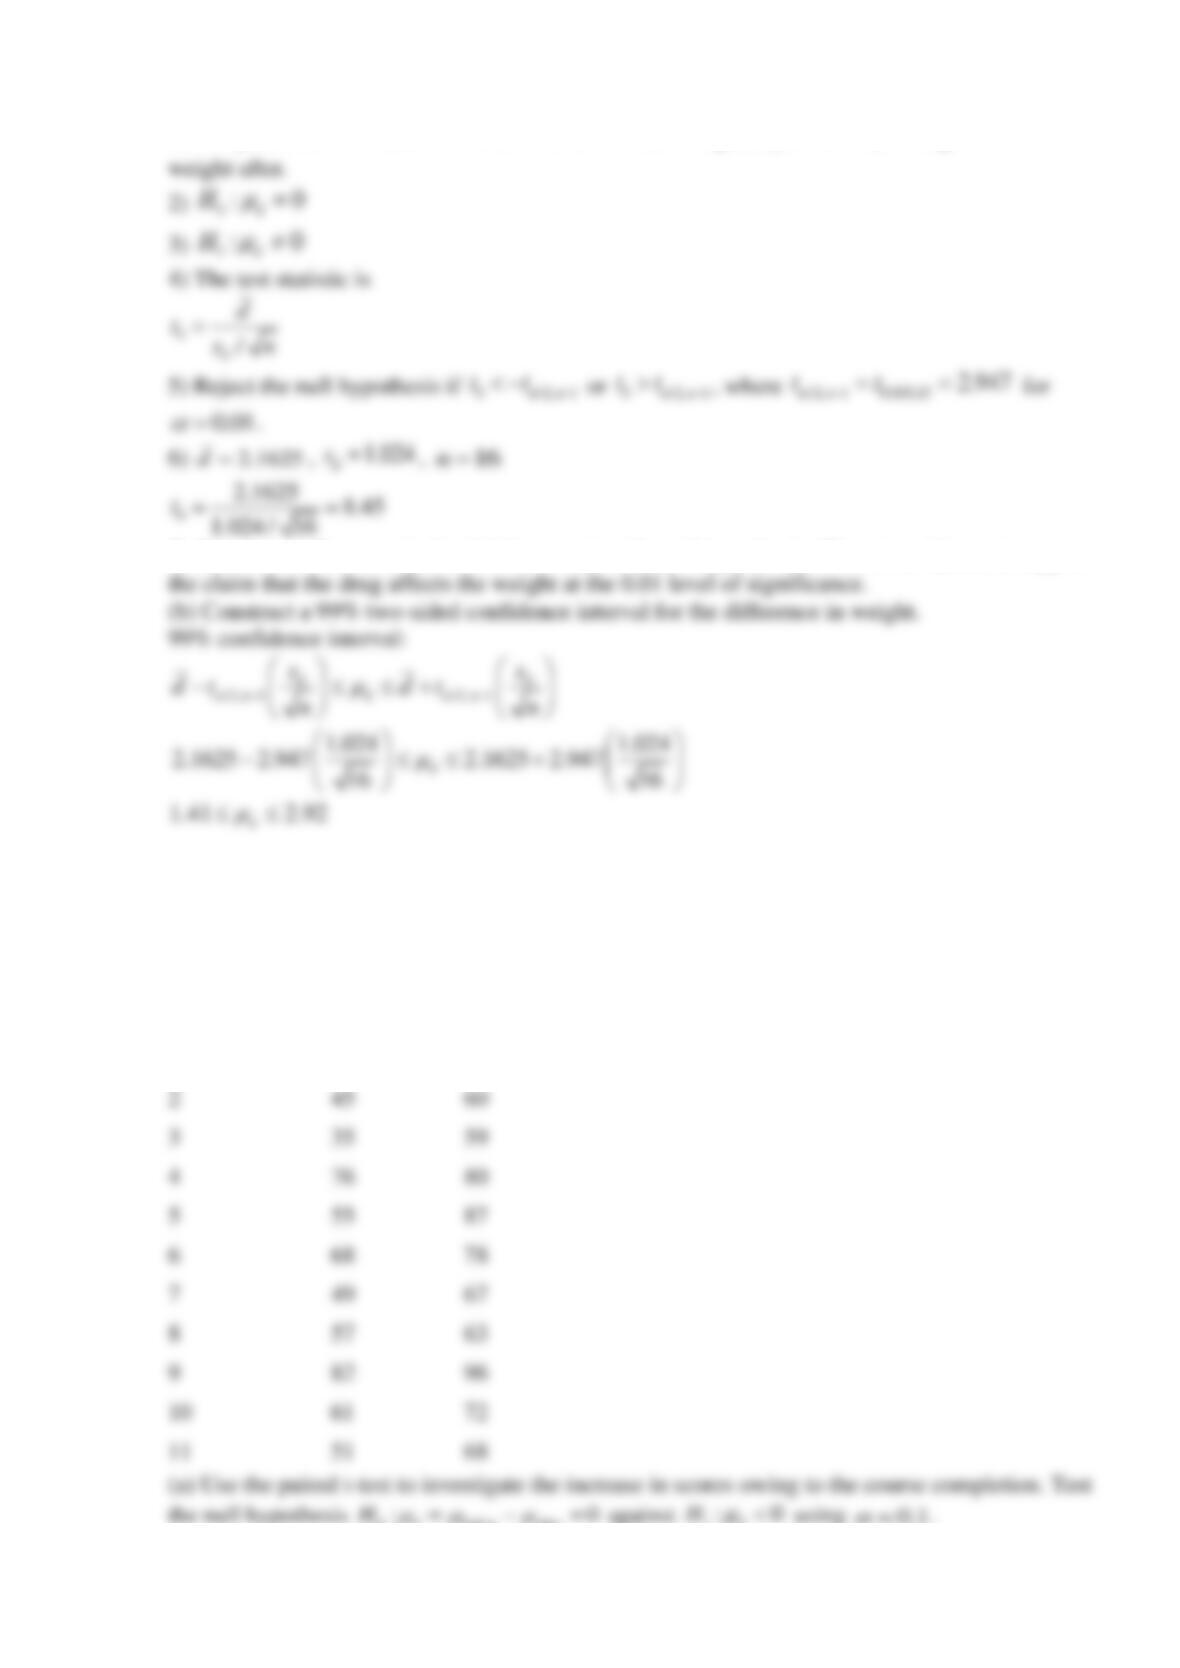
(a) Use the paired t-test to investigate the claim that the drug affects the weight. Test the null
hypothesis
0:0
d before after
H
= − =
against
1:0
d
H
using
0.01
=
.
The parameter of interest is the difference in mean weight,
d
, where
i
d=
weight before – weight
after.
0:0
d
H
=
1:0
d
H
Reject the null hypothesis if
0
t
________ for
0.01
=
.
Find the test statistic.
(b) Construct a 99% two-sided confidence interval for the difference in weight.
SOLUTION
(a)
1) The parameter of interest is the difference in mean weight,
d
, where
i
d=
weight before –
7) Conclusion: Because
8.45 2.947
, we reject the null hypothesis. There is evidence to support
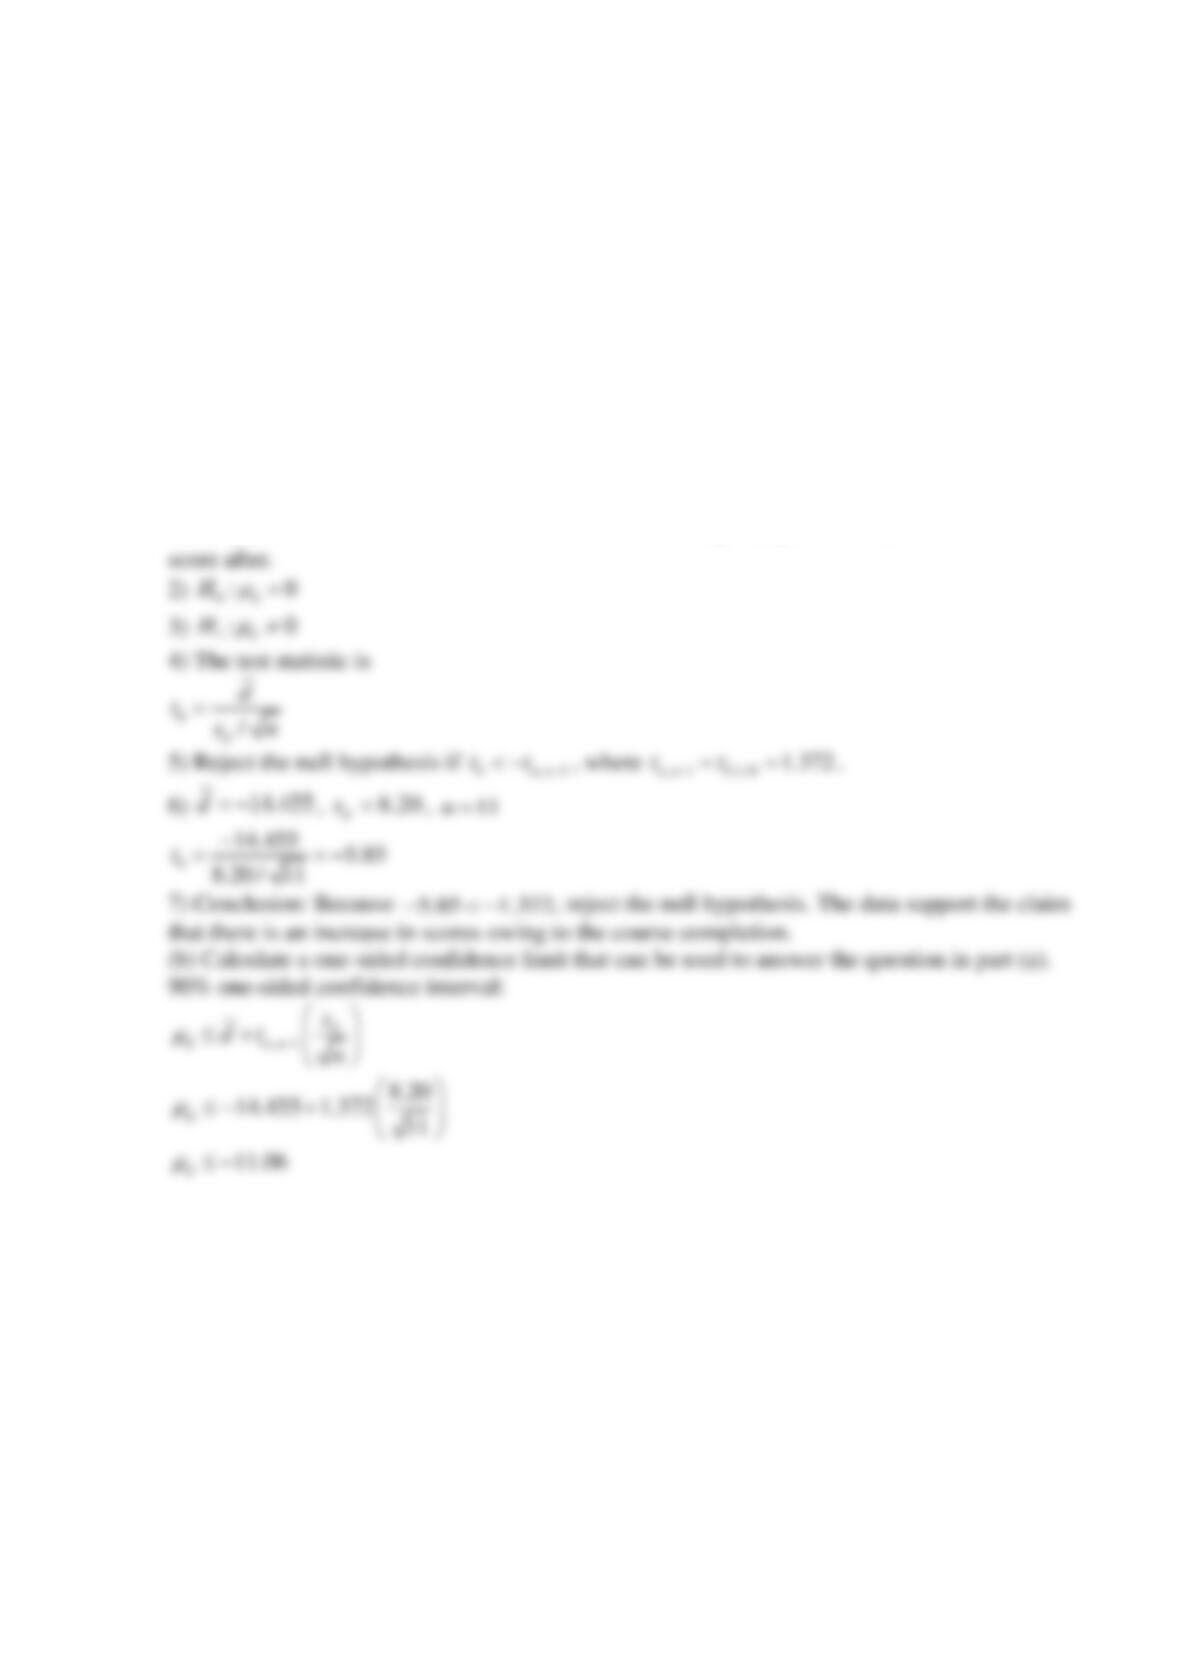
Reserve Problems Chapter 10 Section 4 Problem 2
The table below contains the results of a students’ test before the course and after its completion.
Student number
Score before
Score after
1
64
72
2
45
60
3
35
59
4
76
80
5
55
87
6
68
78
7
49
67
8
57
63
9
82
96
10
61
72
11
51
68
0:0
d before after
1:0
d
0.1
=
The parameter of interest is the difference in mean weight,
d
, where
i
d=
weight before –
weight after.
0:0
d
H
=
1:0
d
H
Reject the null hypothesis if
0
t
________.
Find the test statictic.
(b) Calculate a one-sided confidence limit that can be used to answer the question in part (a).
SOLUTION
(a)
1) The parameter of interest is the difference in mean weight,
d
, where
i
d=
score before –
Reserve Problems Chapter 10 Section 4 Problem 3
Fifteen adult males between the ages of 35 and 50 participated in a study to evaluate the effect of
diet and exercise on blood cholesterol levels. The total cholesterol was measured in each subject
initially and then three months after participating in an aerobic exercise program and switching
to a low-fat diet. The data are shown in the following table.
Blood Cholesterol Level
Subject
Before
After
1
265
229
d
H
2
240
231
3
256
228
4
295
240
5
251
238
6
245
241
7
287
234
8
313
259
9
254
244
10
279
239
11
283
246
12
240
218
13
238
219
14
225
226
15
247
233
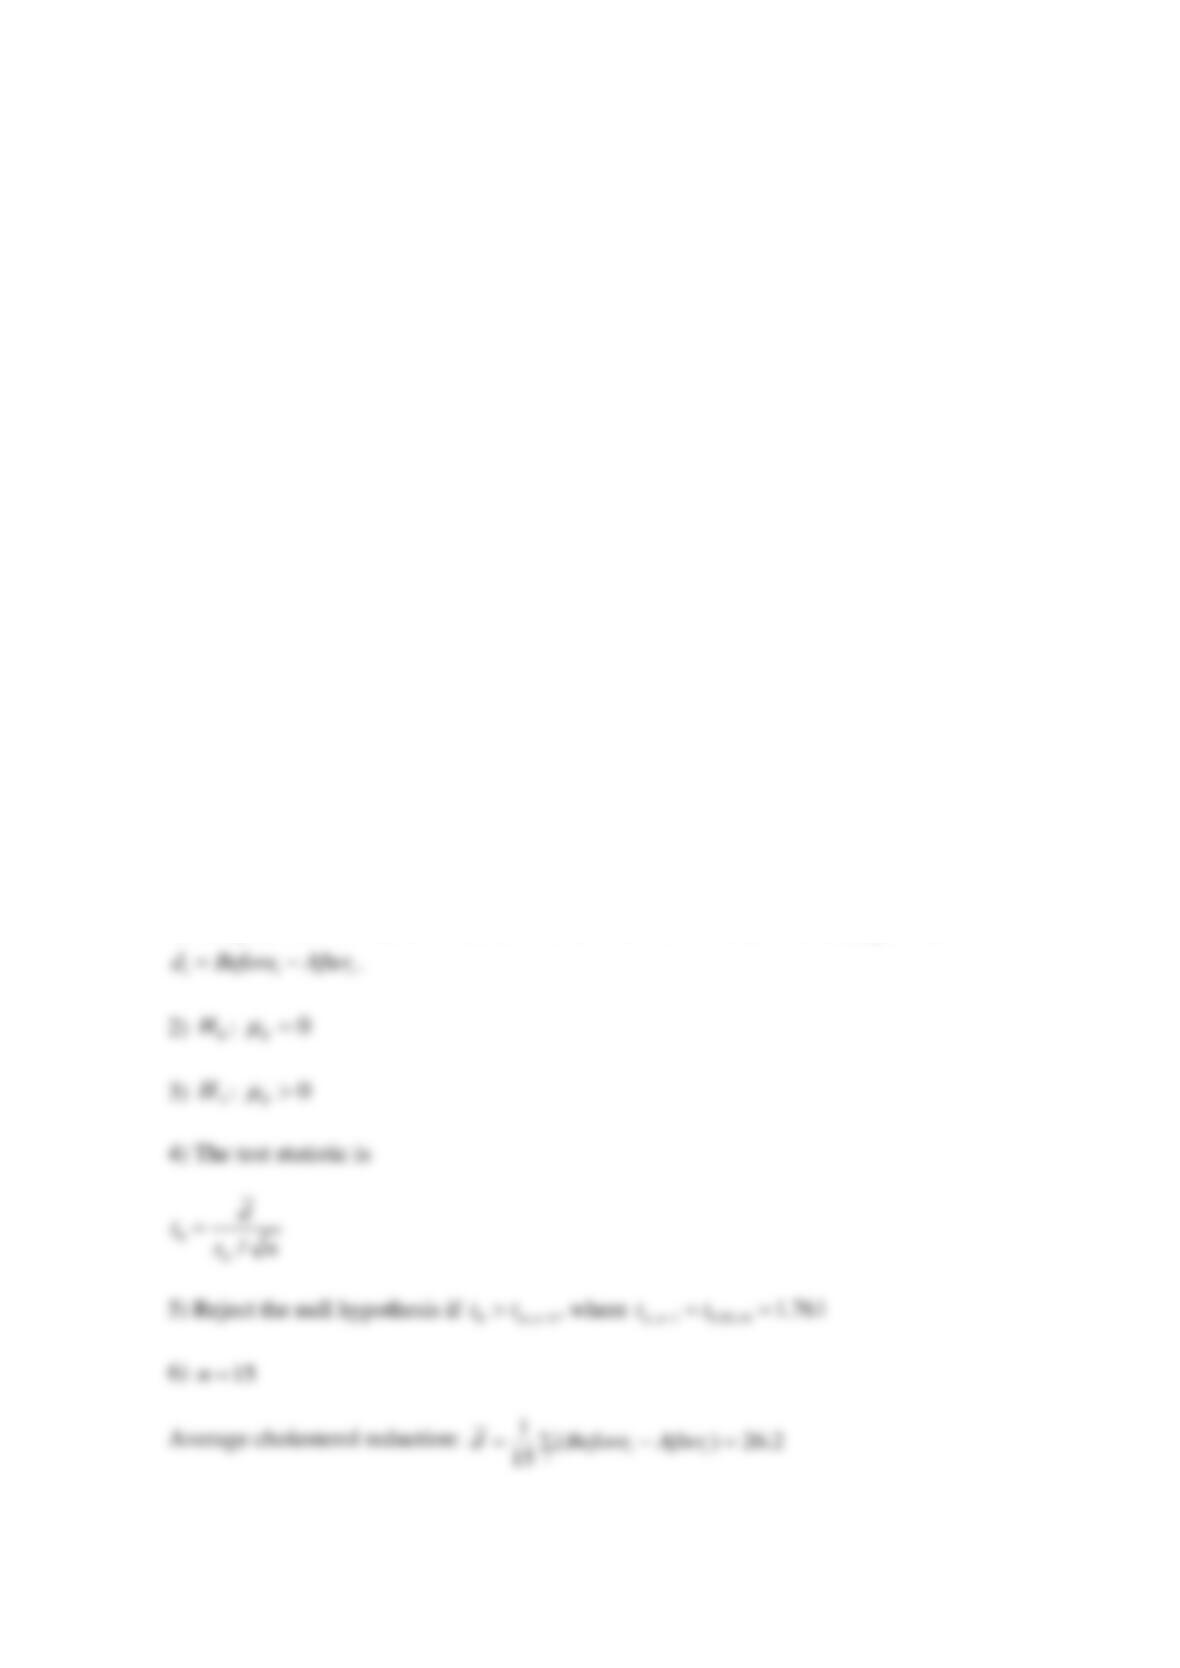
(a) Do the data support the claim that low-fat diet and aerobic exercise are of value in producing
a mean reduction in blood cholesterol levels? Use
0.05
=
. Suppose that the hypotheses are
0
H
:
0
d
=
versus
1
H
:
0
d
, where
i i i
d Before After=−
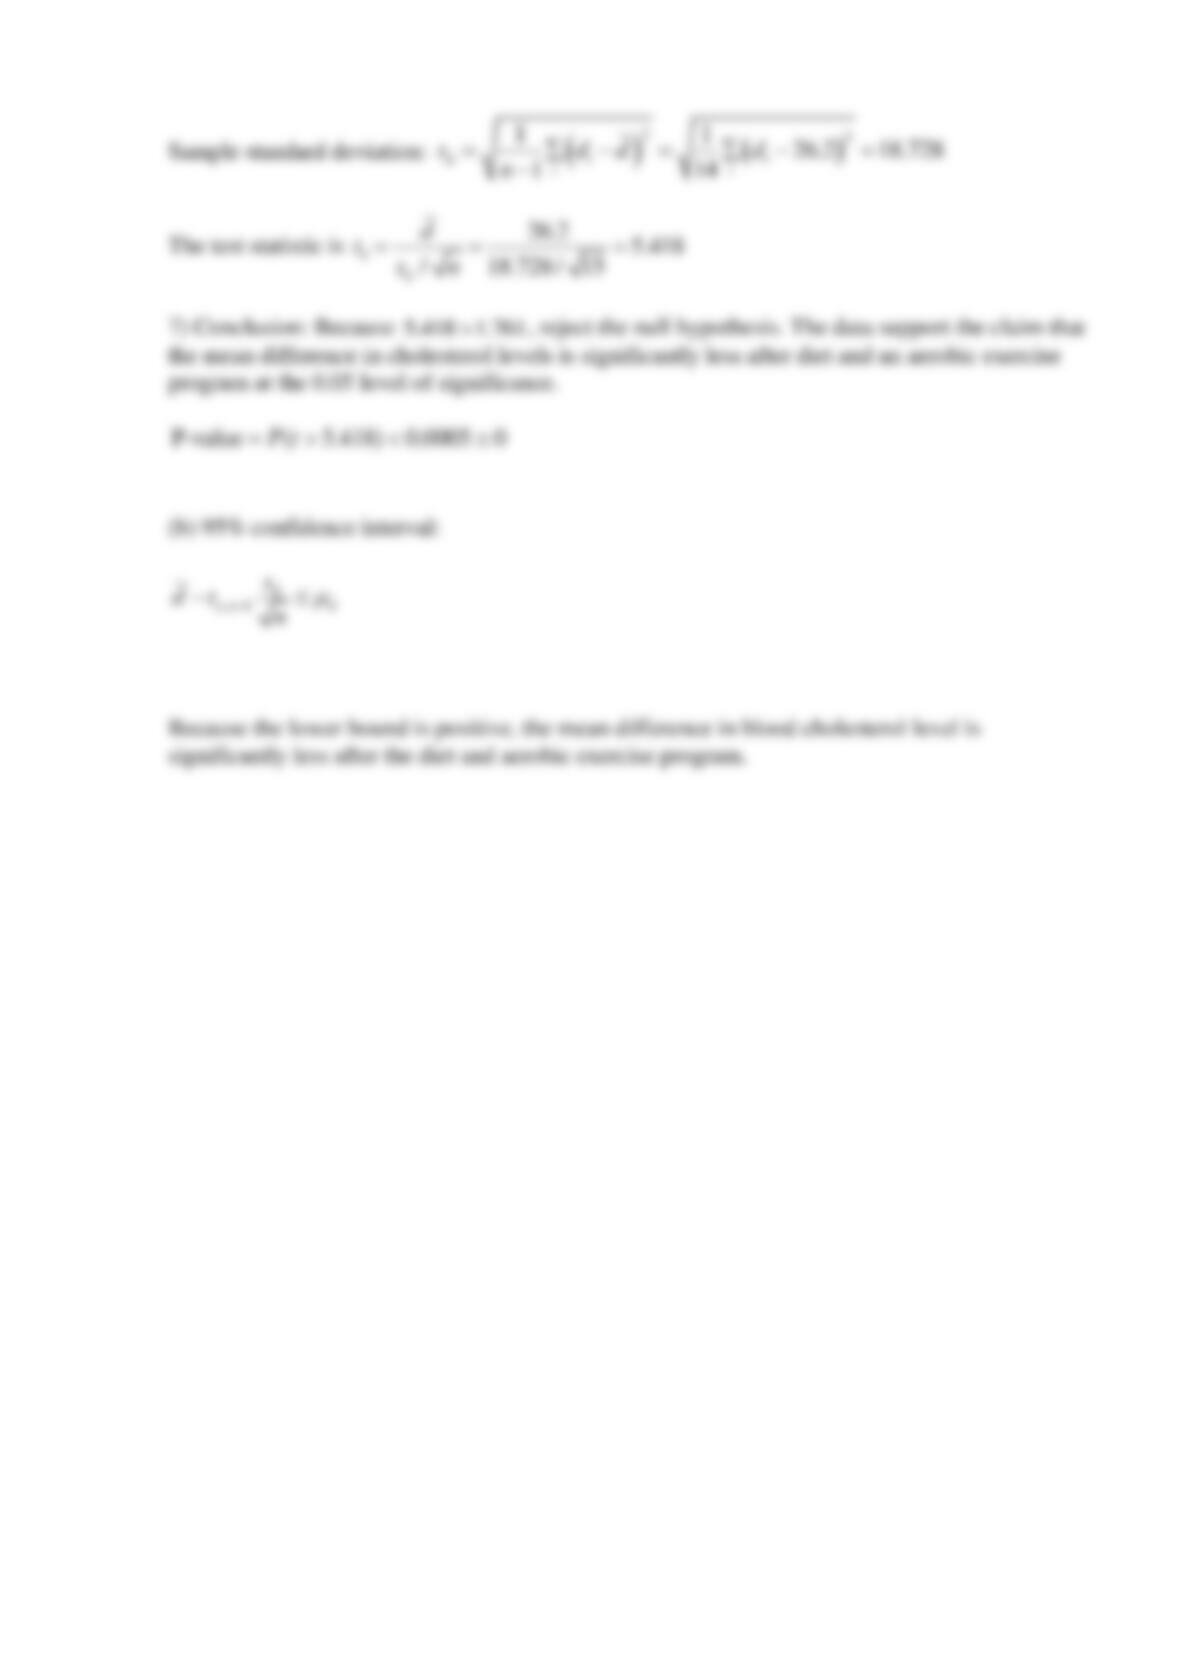
. What is the test statistic?
(b) Calculate a one-sided confidence limit that can be used to answer the question in part (a).
SOLUTION
(a)
1) The parameter of interest is the difference in blood cholesterol level,
d
, where
0
H
Reserve Problems Chapter 10 Section 4 Problem 4
An article in Neurology (1998, Vol. 50, pp. 1246-1252) discussed that monozygotic twins share
numerous physical, psychological, and pathological traits. The investigators measured an
intelligence score of 10 pairs of twins, and the data follow:
Pair
Birth order: 1 (first)
Birth order: 2 (second)
1
6.08
5.73
2
6.22
5.80
3
7.99
8.42
4
7.44
6.84
5
6.48
6.43
6
7.99
8.76
7
6.32
6.32
8
7.60
7.62
9
6.03
6.59
10
7.52
7.67
(a) Find 98% confidence interval on the difference in mean score.
(b) It is important to detect a mean difference in score of one point with a probability of at least
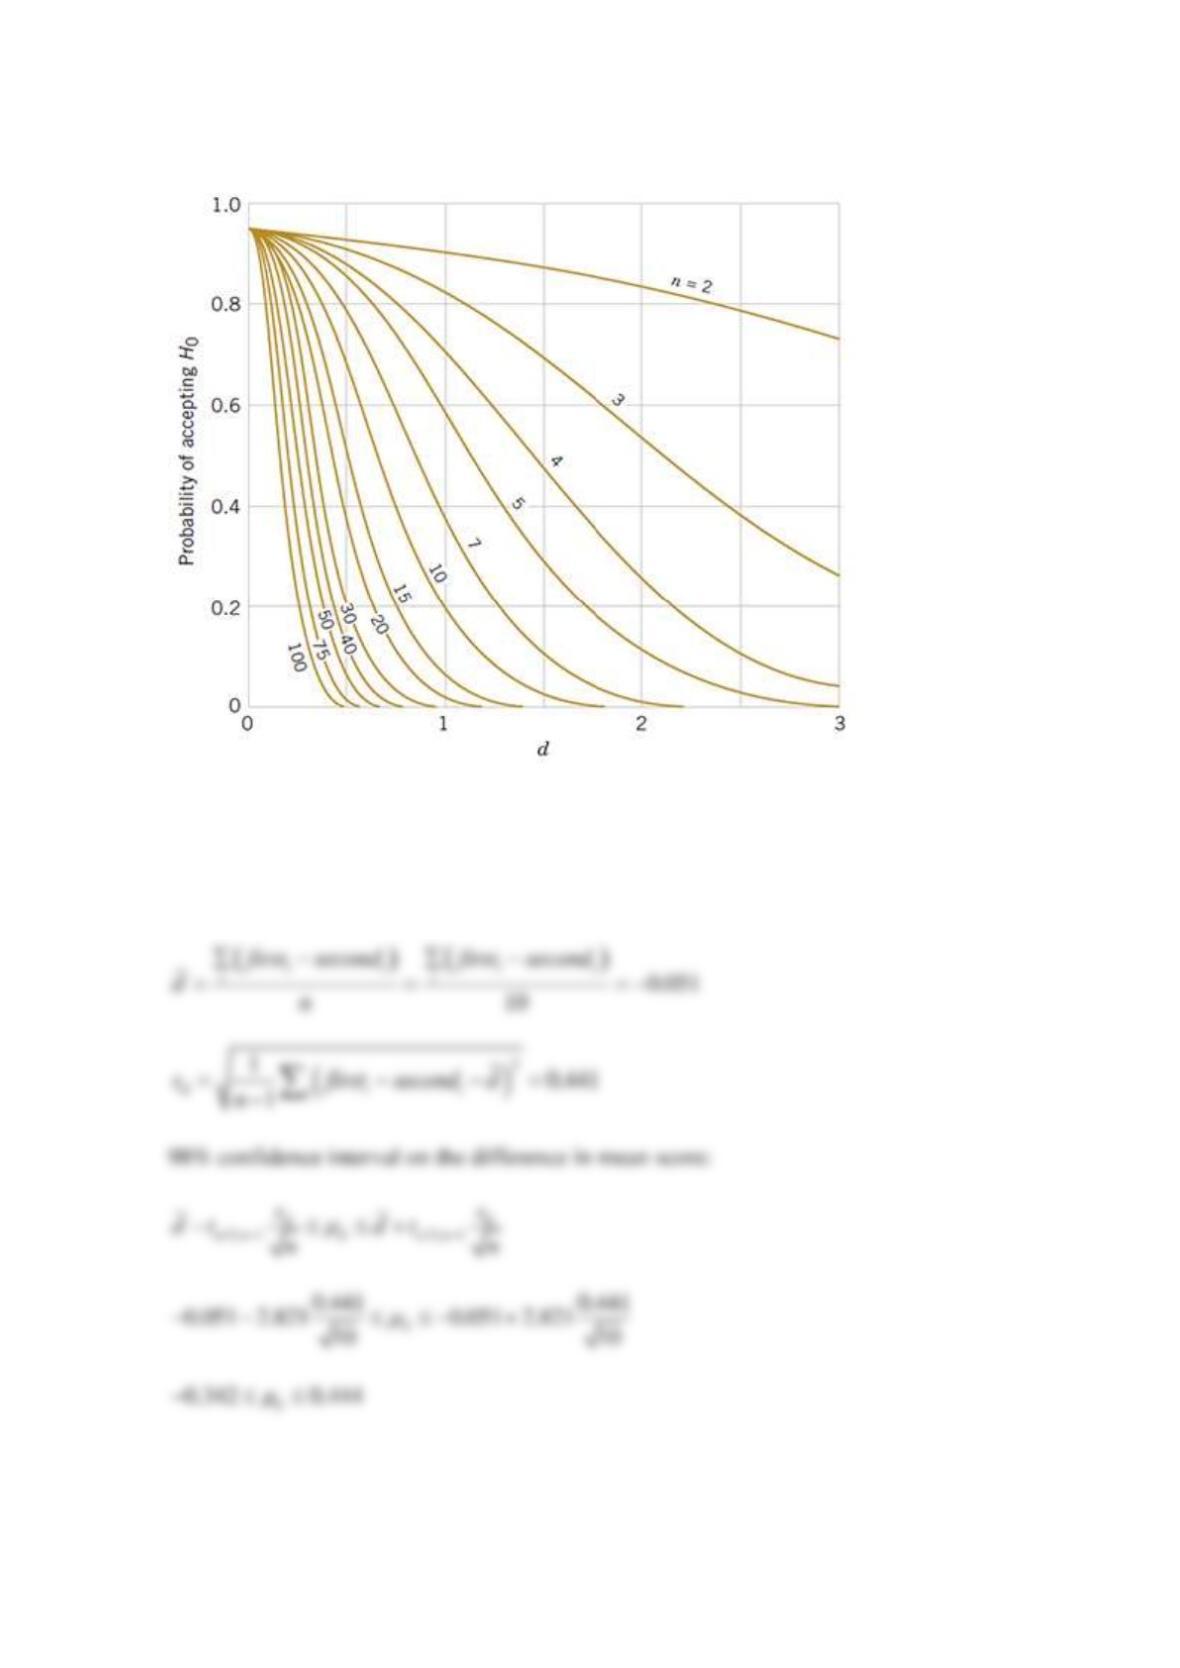
0.90. How many pairs should have been used?
SOLUTION
(a)
10n=
(b)
Reserve Problems Chapter 10 Section 4 Problem 5
Use the sign test on the blood cholesterol data in table.
Blood Cholesterol Level
Subject
Before
After
1
265
229
2
240
231
3
251
245
4
295
240
5
251
238
6
245
241
7
287
234
8
308
257
9
250
240
10
279
239
11
283
246
12
240
218
13
238
219
14
225
226
15
247
233
Is there evidence that diet and exercise reduce the median cholesterol level (
0.05
=
)?
What is the number of signs r which should be compared with the critical value?
What is the critical value?
There ___ enough evidence that diet and exercise reduce the median cholesterol level at
0.05
=
.
SOLUTION
1) Parameters of interest are the median cholesterol levels for two activities
˜
d
, where
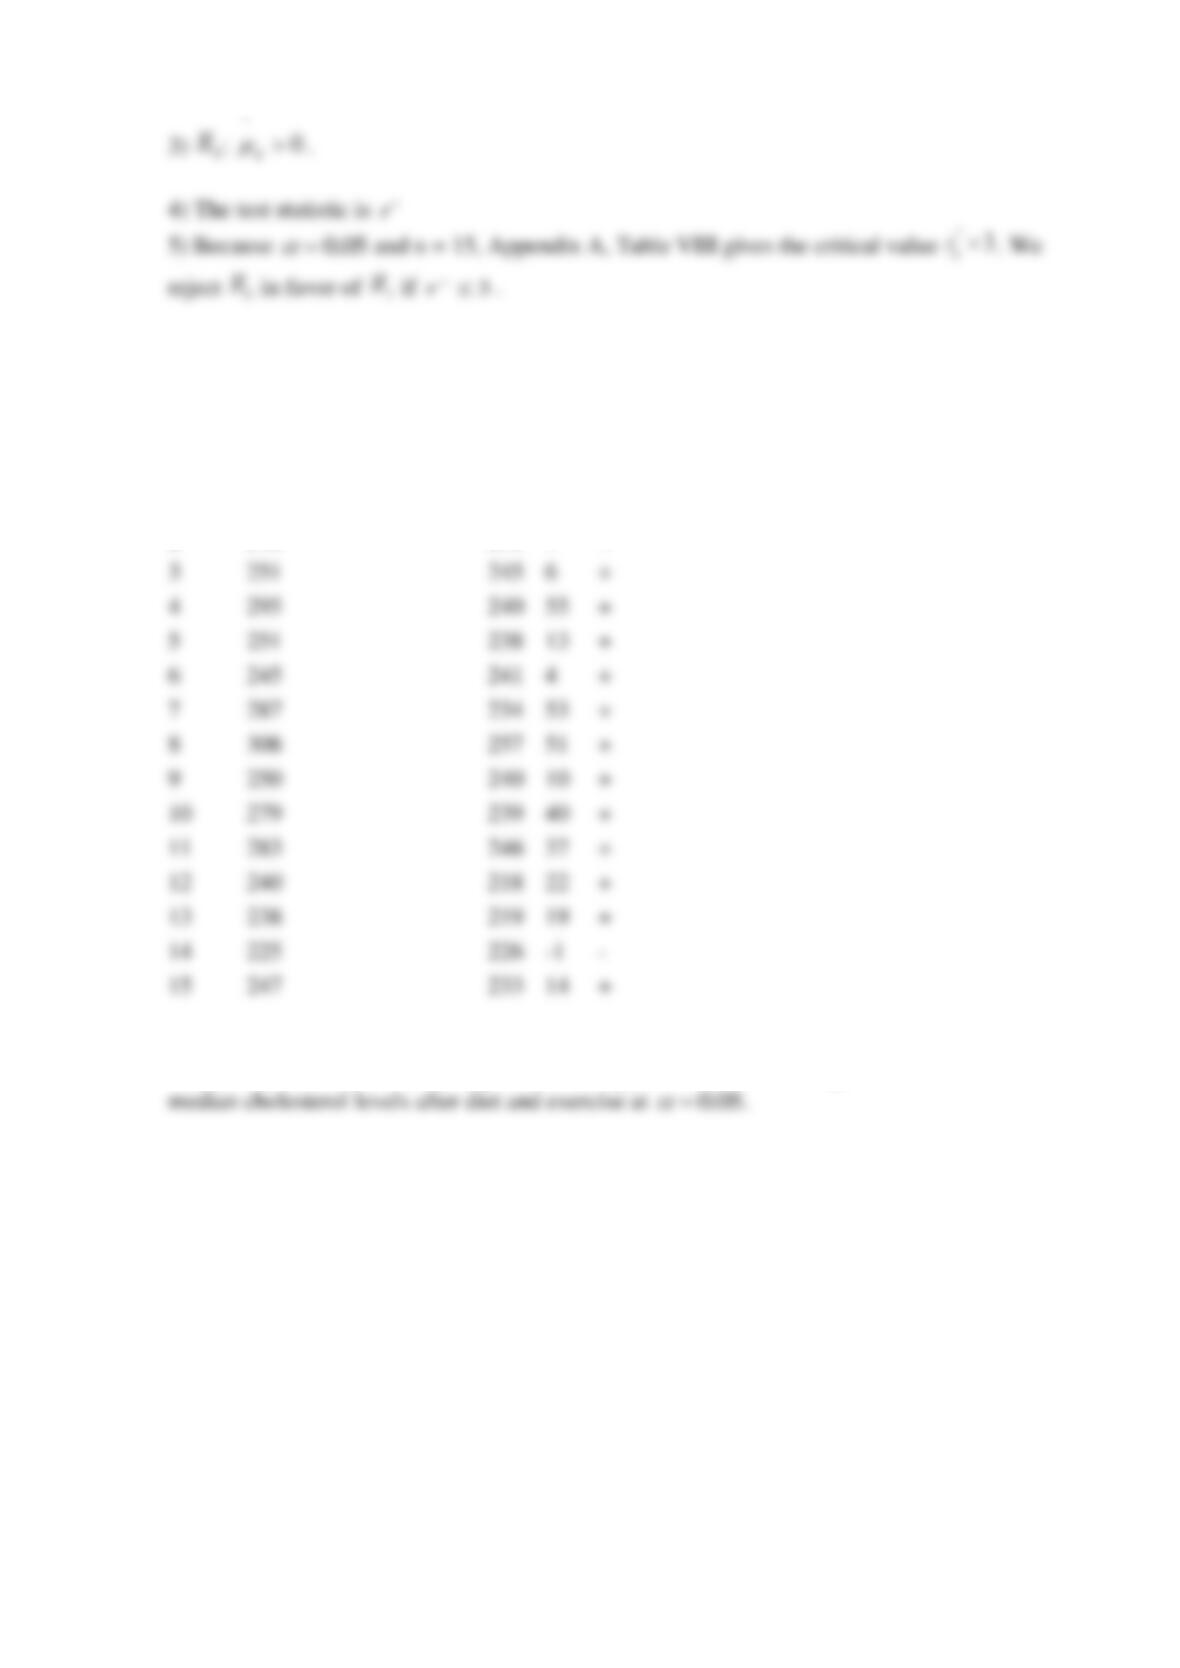
6) Construct the table of differences and find
1r−=
.
Blood Cholesterol Level
Subject
Before
After
delta
sign
1
265
229
36
+
2
240
231
9
+
3
251
245
6
+
4
295
240
55
+
5
251
238
13
+
6
245
241
4
+
7
287
234
53
+
8
308
257
51
+
9
250
240
10
+
10
279
239
40
+
11
283
246
37
+
12
240
218
22
+
13
238
219
19
+
14
225
226
-1
–
15
247
233
14
+
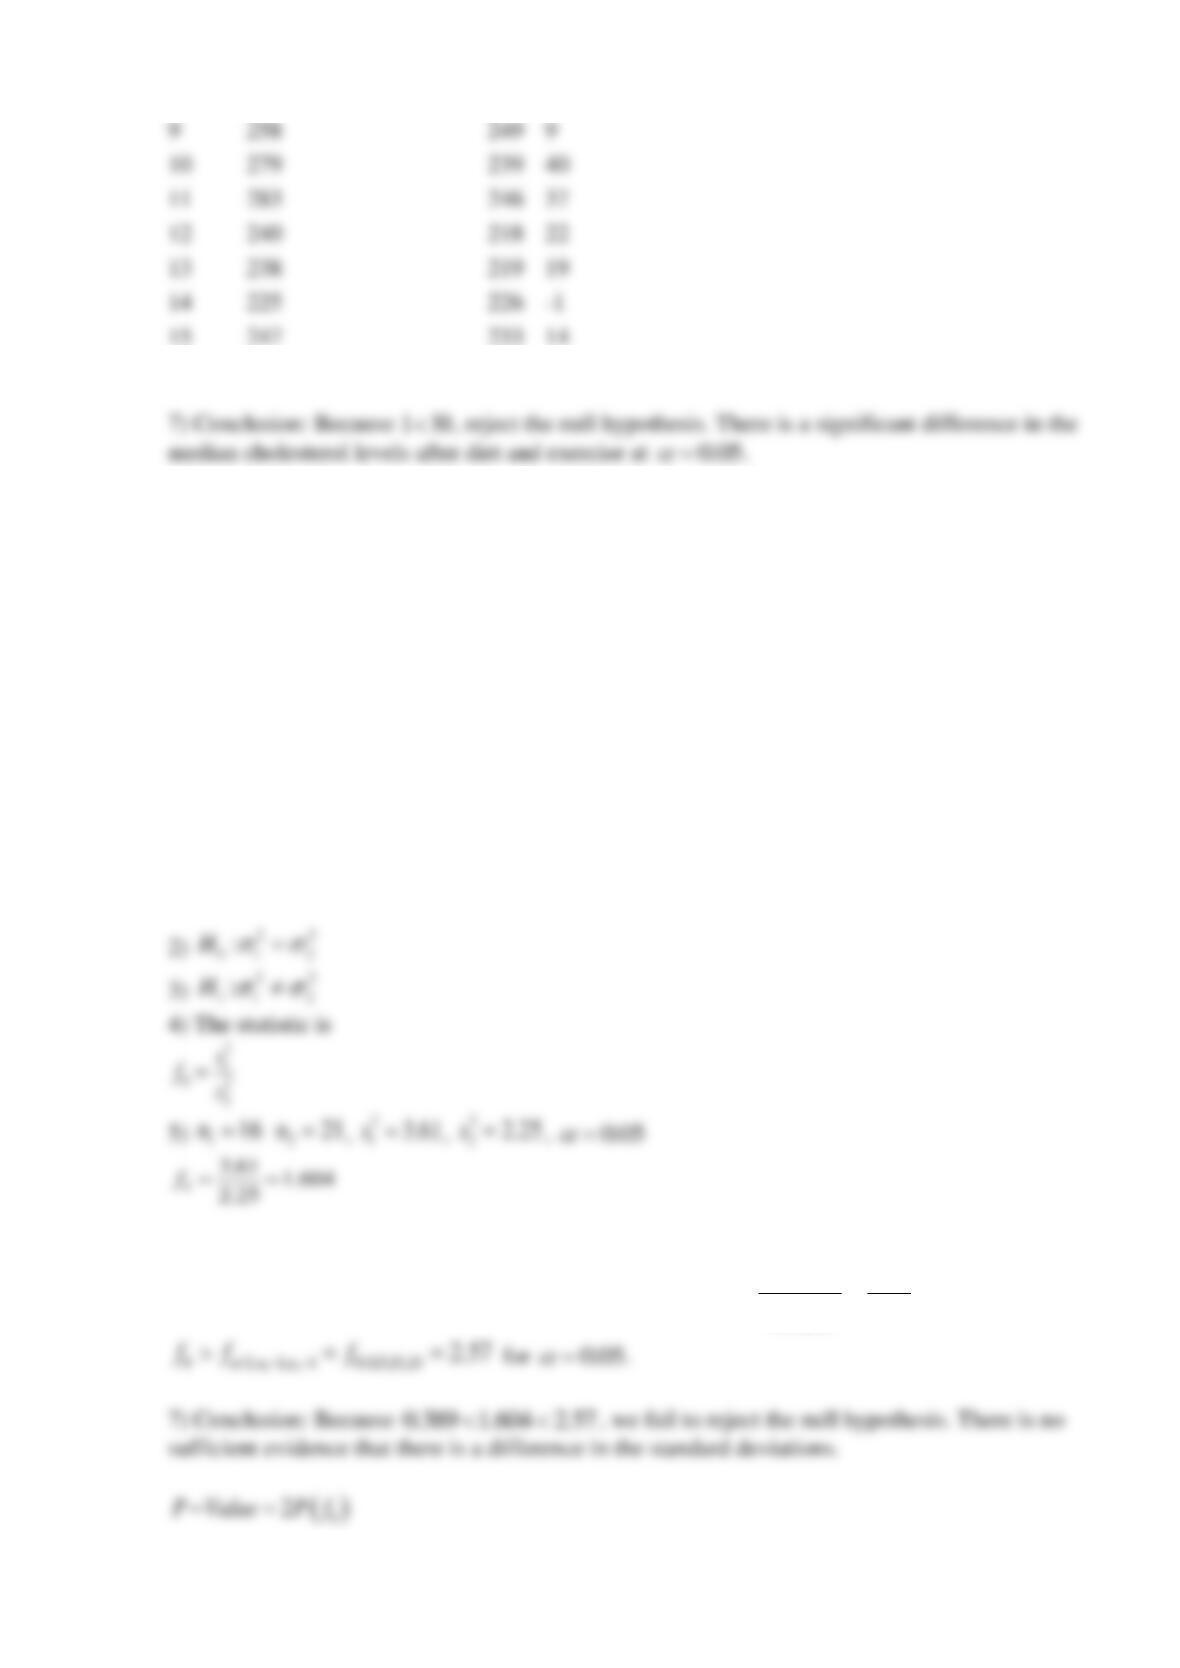
7) Conclusion: Because
13
, reject the null hypothesis. There is a significant difference in the
Reserve Problems Chapter 10 Section 4 Problem 6
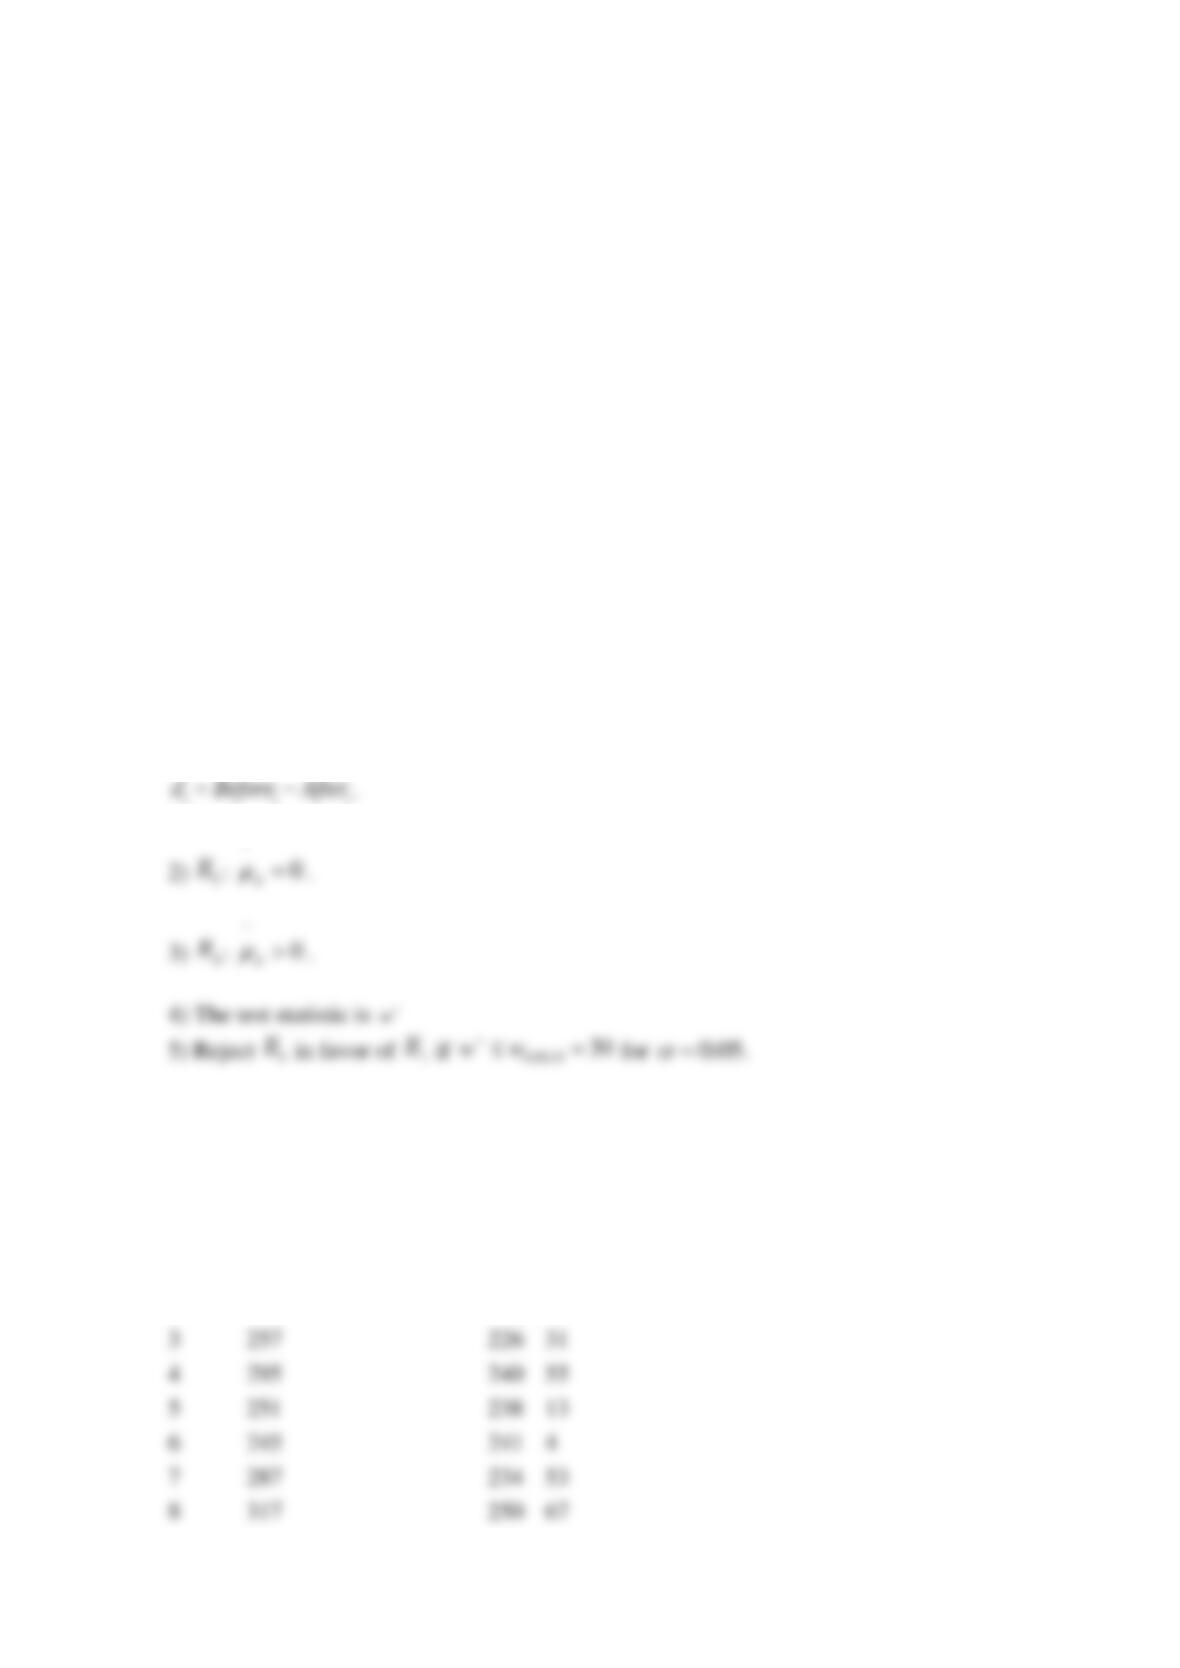
Use the Wilcoxon signed-rank test on the blood cholesterol data in table.
Blood Cholesterol Level
Subject
Before
After
1
265
229
2
240
231
3
257
226
4
295
240
5
251
238
6
245
241
7
287
234
8
317
250
9
258
249
10
279
239
11
283
246
12
240
218
13
238
219
14
225
226
15
247
233
Is there evidence that diet and exercise reduce the mean cholesterol level at
0.05
=
?
What is the sum of signed-rank W which should be compared with the critical value?
What is the critical value
*
W
=
There ____ enough evidence that diet and exercise reduce the median cholesterol level at
0.05
=
.
SOLUTION
1) Parameters of interest are the median cholesterol levels for two activities
˜
d
, where
6) Construct the table of differences and find
1w−=
.
Blood Cholesterol Level
Subject
Before
After
delta
1
265
229
36
2
240
231
9
3
257
226
31
4
295
240
55
5
251
238
13
6
245
241
4
0.05
=
Reserve Problems Chapter 10 Section 5 Problem 1
Consider the hypothesis test
22
0 1 2
:H
=
against
22
1 1 2
:H
. Suppose the sample sizes are
116n=
and
221n=
and the sample standard deviations are
11.9s=
and
21.5s=
. Use
0.05
=
.
a) Test the hypothesis. Find the P-value.
b) Construct a 95% two-sided confidence interval of
2
relations.
SOLUTION
a) 1) The parameters of interest are the standard deviations,
1
and
2
.
221n=
6) Reject the null hypothesis if
12
0 1 /2, 1, 1 0,975,15,20
0.025,20,15
11
0.389
2.76
nn
f f f f
− − −
= = = =
or
0.05
=
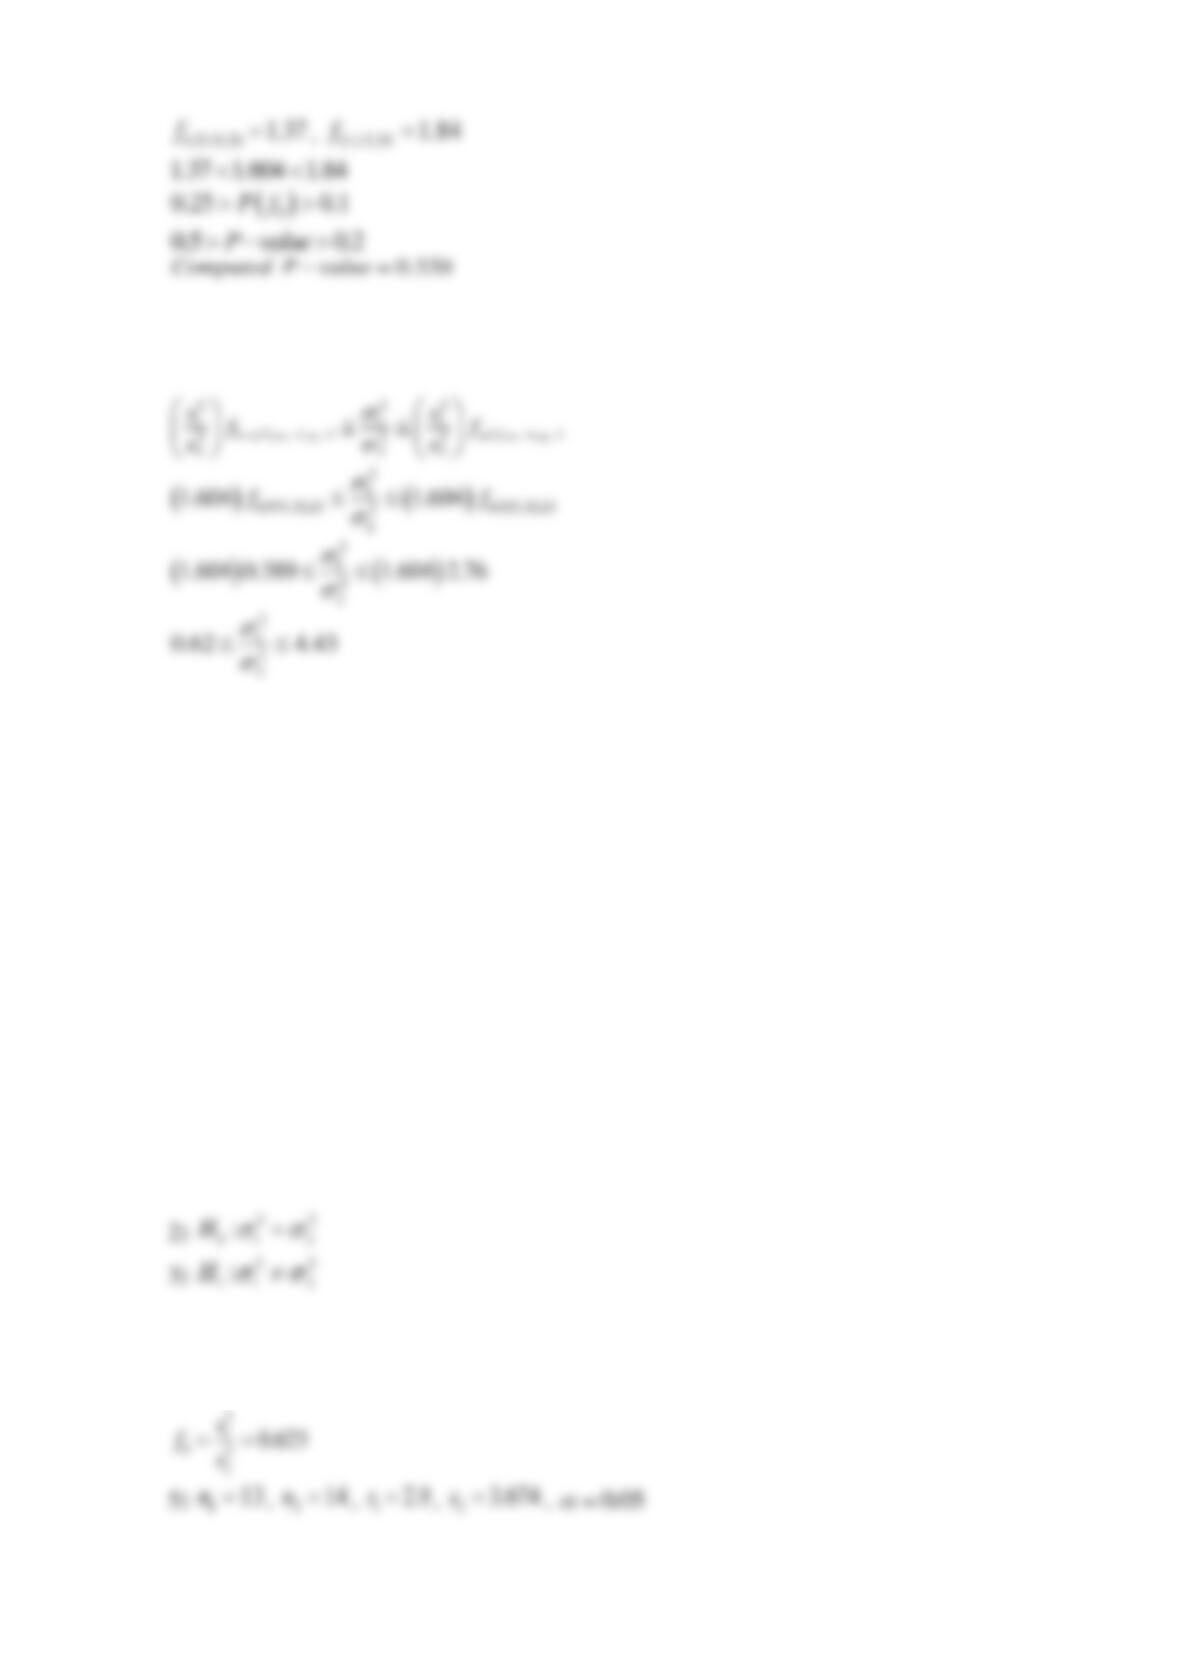
b) 95% confidence interval:
Reserve Problems Chapter 10 Section 5 Problem 2
Hardness of water from two different water treatment facilities is investigated. Observed water
hardness (in ppm) for a random sample of faucets is as follows:
Facility 1:
62
56
57
61
65
57
60
59
54
61
58
60
58
Facility 2:
69
65
59
62
61
57
59
60
60
62
61
66
68
66
a) Is there evidence that the variance of water hardness is different for two facilities? Use
0.05
=
.
b) Construct a 95% two-sided confidence interval of
2
relations.
SOLUTION
a) 1) The parameters of interest are the standard deviations,
1
and
2
.
4) The test statistic is