8 – 1 Compensation – Thirteenth Edition Gerhart │Newman │Milkovich
CHAPTER EIGHT
DESIGNING PAY LEVELS, MIX, AND PAY
STRUCTURES
Overview
This chapter focuses on the major decisions and techniques involved in determining an
organization’s external competitiveness policy—establishing pay levels and pay mix forms and
designing pay structures. Most organizations survey other employers’ pay practices to
determine the rates competitors pay. Based on the survey results, an employer considers how it
wishes to position its total compensation in the market: lead, match, or lag its competitors. This
policy decision may differ for different business units and even for different job groups within a
single organization. An organization’s competitive position policy is translated into practice by
setting pay-policy lines which serve as reference points around which pay grades and ranges or
bands are designed.
There are seven major decisions involved in setting externally competitive pay and designing
the corresponding pay structures. They include:
• Specifying the employer’s competitive pay policy
• Defining the purpose of the survey
The chapter concludes with a discussion on the issues associated with combining the internal
structure (job evaluation results) with external market rates. Internal alignment and external
competitiveness merge together in a pay structure which has two aspects:
The pay-policy line translates an organization’s external competitive policy into practice. Use
of pay grades and ranges or bands offers flexibility to deal with pressures from both external
and internal pressures on pay decisions. The process of balancing internal and external

Chapter Eight: Designing Pay Levels, Mix, and Pay Structures 8 – 2
Learning Objectives
• Identify and discuss the seven major decisions in setting externally competitive pay and
designing the corresponding pay structures.
• Interpret the pay-policy line, including choice of measure, updating, and relating the
8 – 3 Compensation – Thirteenth Edition Gerhart │Newman │Milkovich
Lecture Outline: Overview of Major Topics
I. Major Decisions
II. Specify Competitive Pay Policy
III. The Purpose of a Survey
IV. Select Relevant Market Competitors
A. Fuzzy Markets
V. Design the Survey
A. Who Should Be Involved?
B. How Many Employers?
C. Which Jobs to Include?
D. What Information to Collect?
VI. Interpret Survey Results and Construct a Market Line
A. Verify Data
B. Statistical Analysis
VII. From Policy to Practice: The Pay-Policy Line
A. Choice of Measure
B. Updating
C. Policy Line as Percent of Market Line
VIII. From Policy to Practice: Grades and Ranges
A. Why Bother with Grades and Ranges?
B. Develop Grades
C. Establish Range Midpoints, Minimums, and Maximums
D. Overlap
IX. From Policy to Practice: Broad Banding
Chapter Eight: Designing Pay Levels, Mix, and Pay Structures 8 – 4
Lecture Outline: Summary of Key Chapter Points
I. Major Decisions
• The major decisions in setting externally competitive pay and designing the
corresponding pay structures are shown in Exhibit 8.1. They include:
o Specify the employer’s competitive pay policy
o Define the purpose of the survey
II. Specify Competitive Pay Policy
• Chapter 7 covered the first decision, determining the external competitive pay policy.
• Translating any external pay policy into practice requires information on the external
market.
III. The Purpose of a Survey
• An employer conducts or participates in a survey for a number of reasons:
o To adjust the pay level in response to changing rates paid by competitors
o To set the mix of pay forms relative to that paid by competitors
A. Adjust Pay Level—How Much to Pay?
• Most organizations make adjustments to employees’ pay on a regular basis.
• Such adjustments can be based on:
o The overall movement of pay rates caused by the competition for people in
the market
8 – 5 Compensation – Thirteenth Edition Gerhart │Newman │Milkovich
B. Adjust Pay Mix—What Forms?
• Adjustments to the different forms of pay competitors use (base, bonus, stock,
benefits) and the relative importance they place on each form occur less
frequently than adjustments to overall pay level.
• It is not clear why changes to the pay mix occur less frequently than changes in
the pay level.
C. Adjust Pay Structure?
• Many employers use market surveys to validate their own job evaluation
results.
o For example, job evaluation may place purchasing assistant jobs at the
same level in the job structure as some secretarial jobs.
• The job structure that results from internal job evaluation may not match
competitors’ pay structures in the external market.
o Reconciling these two pay structures is a major issue.
• Rather than integrating an internal and external structure, some employers go
straight to market surveys to establish their internal structures.
D. Study Special Situations
• Information from specialized surveys can shed light on specific pay-related
problems.
o A special study may focus on a targeted group such as patent attorneys,
retail sales managers, secretaries, or software engineers.
o Unusual increases in an employer’s turnover in specific jobs may require
Chapter Eight: Designing Pay Levels, Mix, and Pay Structures 8 – 6
focused market surveys to find out if market changes are occurring.
E. Estimate Competitors’ Labor Costs
• Survey data are used as part of employers’ broader efforts to gather
“competitive intelligence.”
• To better understand how competitors achieve their market share and price
their products/services, companies seek to examine (i.e., benchmark) practices
costs, and so forth against competitors, including in the area of compensation.
• One source of publicly available labor cost data is the Employment Cost Index
(ECI), one of four types of salary surveys published regularly by the
Department of Labor.
IV. Select Relevant Market Competitors
• To make decisions about pay level, mix, and structures, a relevant labor market must
be defined that includes employers who compete in one or more of the following
areas:
• Exhibit 8.2 shows how Microsoft and Alphabet, formerly Google, select relevant
market competitors in establishing executive compensation.
o Both explicitly include product market (technology) and labor market competitors.
o The geographic level is national or international.
• Exhibit 8.3 shows how qualifications interact with geography to define the scope of
relevant labor markets.
o As the importance and complexity of the qualifications increase, the geographic
8 – 7 Compensation – Thirteenth Edition Gerhart │Newman │Milkovich
▪ Some larger firms ignore local market conditions. Instead, they emphasize
internal alignment across geographic areas to facilitate the use of virtual teams.
• Some writers argue that if the skills are tied to a particular industry—as underwriters,
actuaries, and claims representatives are to insurance, for example—it makes sense to
define the market on an industry basis, and some research agrees.
• From the perspective of cost control and ability to pay, including competitors in the
product/service market is crucial.
• While the quantity of data available for international comparisons is improving, using
the data to adjust pay still requires a lot of judgment.
• Even with good international survey data, judgment is still required.
A. Fuzzy Markets
• New organizations and jobs fuse together diverse knowledge and experience,
so “relevant” markets appear more like “fuzzy” markets.
V. Design the Survey
• Consulting firms offer a wide choice of ongoing surveys covering almost every job
family and industry group imaginable.
o Their surveys are getting better and better, likely due to improvements in
technology.
Chapter Eight: Designing Pay Levels, Mix, and Pay Structures 8 – 8
o Who should be involved in the survey design?
o How many employers should be included?
o Which jobs should be included?
o What information should be collected?
A. Who Should Be Involved?
• In most organizations, the responsibility for managing the survey lies with the
compensation manager, but including managers and employees makes sense.
• Outside consulting firms are typically used as third-party protection from
possible “price–fixing” lawsuits.
o Lawsuits have been filed alleging that the direct exchange of survey data
B. How Many Employers?
There are no firm rules on how many employers to include in a survey.
o Large firms with a lead policy may exchange data with only a few (6 to 10)
top-paying competitors.
o A small organization in an area dominated by two or three employers may
Publicly Available Data
o In the United States, the Bureau of Labor Statistics (BLS) is the major
source of publicly available compensation (cash, bonus, and benefits but
not stock ownership) data.
▪ The BLS publishes extensive information on various occupations in
different geographic areas.
8 – 9 Compensation – Thirteenth Edition Gerhart │Newman │Milkovich
“Word of Mouse”
o Before computers, individual employees had a hard time comparing their
salaries to others’; gathering information haphazardly, via word of mouth.
o The ease of access computers provide means managers must be able to
explain salary variations among employees.
o Unfortunately, the quality of some salary data on the web is unclear.
▪ Few sites (except the BLS) offer any information on how they collected
their data, what pay forms are included, and so on.
▪ There are some good exceptions, Salary.com includes a glossary,
identifies where the site’s information comes from, and explains what
the statistics mean.
• Entering “programmer” for Birmingham, Alabama returns 43 job
descriptions.
Many Surveys (But Few That Are Validated)
o Opinions about the value of consultant surveys are rampant; research is
not.
o The fact that companies typically use three or more surveys (for all job
types) suggests that different surveys imply different pay levels.
o No systematic study of the effects of differences in market definition,
participating firms, types of data collected, quality of data, analysis
performed, and/or results is available.
Chapter Eight: Designing Pay Levels, Mix, and Pay Structures 8 – 10
Copyright © McGraw-Hill Education. All rights reserved. No reproduction or distribution without the prior written consent of McGraw-Hill
Education.
▪ For market surveys and analysis, similar indices and standards do not
exist.
▪ Without reliability and validity metrics, survey data are open to
challenge.
C. Which Jobs to Include?
There are several approaches to selecting jobs for inclusion.
Benchmark-Job Approach
o Recall from Chapter 5, benchmark jobs have stable job content, are common
across different employers, and include sizable numbers of employees.
o If the purpose of the survey is to price the entire structure, then benchmark
jobs can be selected to include the entire structure.
o The degree of match between the survey’s benchmark jobs and each
company’s benchmark jobs is assessed by various means.
▪ One approach is benchmark conversion/survey leveling, discussed below.
Low-High Approach
o If an organization is using skill-competency-based structures or generic job
descriptions, it may not have benchmark jobs to match with jobs at competitors
who use a traditional job-based approach.
o Market data must be converted to fit the skill or competency structure.
▪ The simplest way to do this is to identify the lowest- and highest-paid
benchmark jobs for the relevant skills in the relevant market and to use the
wages for these jobs as anchors for the skill-based structures.
▪ Work at various levels within the structure can then be slotted between the
anchors.
8 – 11 Compensation – Thirteenth Edition Gerhart │Newman │Milkovich
Benchmark Conversion/Survey Leveling
o In cases where the content (e.g., job description) of an organization’s jobs does
not sufficiently match that of jobs in the salary survey, an effort can be made to
quantify the difference via benchmark conversion.
o If an organization uses job evaluation, then its job evaluation system can be
applied to the survey jobs.
D. What Information to Collect?
• Three basic types of data typically are requested:
• Exhibit 8.9 lists the basic data elements and the logic for including them.
o No survey includes all the data.
o Rather, the data collected depend on the purpose of the survey, and the jobs
and skills included.
Organization Data
o This information reflects the similarities and differences among
organizations in the survey.
o The competitors’ data have not been used to compare competitors’
productivity (revenues to compensation) or labor costs.
o But this is changing.
▪ Metrics of organization performance such as turnover and revenues are
being collected.
Total Compensation Data
Chapter Eight: Designing Pay Levels, Mix, and Pay Structures 8 – 12
o Information on all types of pay forms is required to assess the total pay
package and competitors’ practices.
▪ The list shown in Exhibit 8.9 reveals the range of forms that could be
included in each company’s definition of total compensation.
o Three alternatives—base pay, total cash (base, profit sharing, bonuses), and
total compensation (total cash plus benefits and perquisites)—are the most
commonly used measures of compensation.
▪ Exhibit 8.10 draws the distinction between these three alternatives and
highlights the usefulness and limitations of each.
▪ Exhibit 8.11 shows some results of conducting a pay survey that
includes these three measures on a sample of engineers:
o Base pay: This is the amount of cash the competitors decided each
job and incumbent is worth. A company might use this information
▪ It is no surprise that for all seven jobs, total compensation is higher
than base pay alone or base plus bonus.
▪ The variability and magnitude of the difference may be a surprise.
▪ So the measure of compensation is an important decision
▪ Misinterpreting competitors’ pay practices can lead to costly mispricing
of pay levels and structures.
VI. Interpret Survey Results and Construct a Market Line
• Technology has made processing data and spitting out reports easy.
• The greatest challenge of total compensation surveys is to understand how to evaluate
the information.
8 – 13 Compensation – Thirteenth Edition Gerhart │Newman │Milkovich
A. Verify Data
• A common first step is to check the accuracy of the job matches, and then
check for anomalies, age of data, and the nature of the organizations.
o Exhibit 8.12 is an excerpt from the survey used to prepare Exhibit 8.13.
• Accuracy of Match (and Improving the Match)
o Part A of the survey contains the description of the survey job.
o For jobs that match perfectly, things are easy.
o If a company job is similar but not identical, some companies use the
• Anomalies
o Part B of the survey shows actual engineer 1 salaries.
o Perusal of salary data gives an analyst a sense of the quality of the data and
helps identify any areas for additional consideration.
▪ For example, Part B of Exhibit 8.12 shows that no engineer 1 at
o Part C of Exhibit 8.12 provides company data. Anomalies may include:
▪ Does any one company dominate?
▪ Do all employers show similar patterns?
▪ Outliers?
o The best way to answer questions on anomalies is to do an analysis of them
alone.
o Part D at the bottom of Exhibit 8.12 contains summary data:
▪ Five different measures of base pay, cash, and total compensation,
Chapter Eight: Designing Pay Levels, Mix, and Pay Structures 8 – 14
B. Statistical Analysis
• While the statistics necessary to analyze survey data, including regression, are
covered in basic statistics classes, a number of websites are probably more fun.
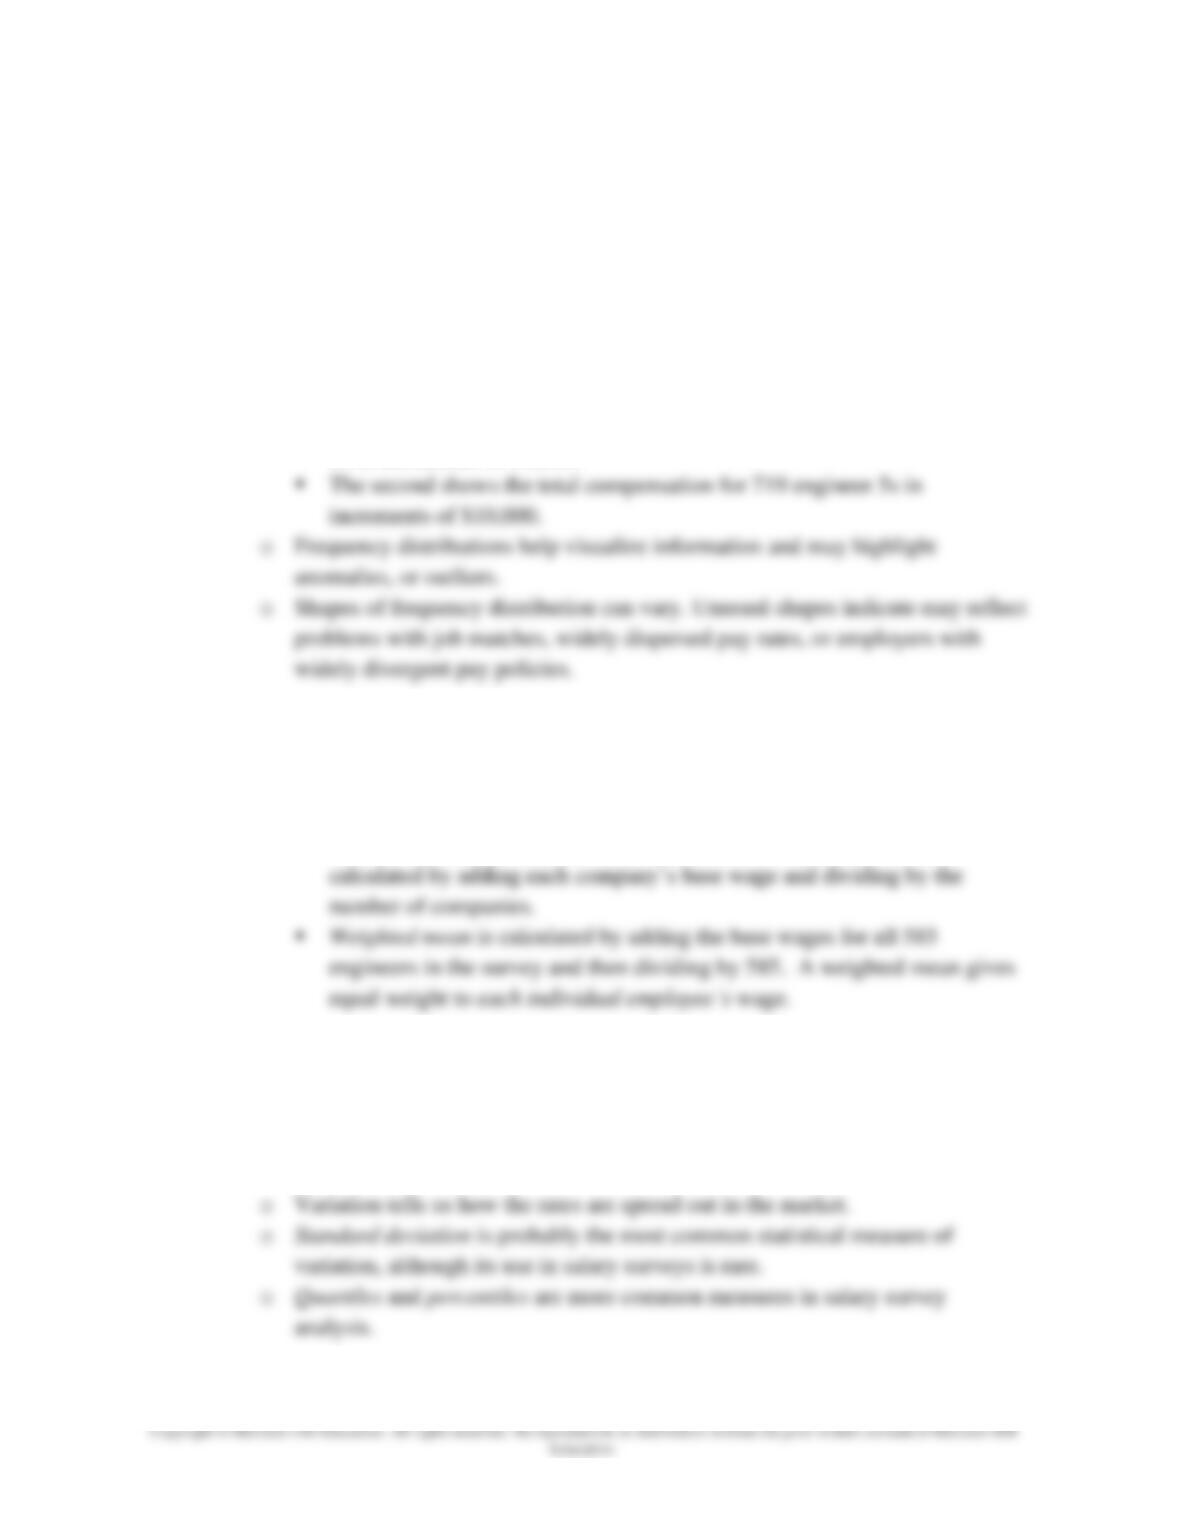
• A useful first step in the analysis is to look at a frequency distribution of the
pay rates.
Frequency Distribution
o Exhibit 8.13 shows two frequency distributions created from the data in the
8.12 survey.
▪ The top one shows the distribution of the base wages for the 585 engineer
1s in increments of $1,000.
Central Tendency
o A measure of central tendency reduces a large amount of data into a single
number. Exhibit 8.14 defines commonly used measures.
o The distinction between “mean” and “weighted mean” is important.
▪ If only company averages are reported in the survey, a mean may be
Variation
o The distribution of rates around a measure of central tendency is called
variation.
▪ The two frequency distributions in Exhibit 8.13 show very different
patterns of variation.
8 – 15 Compensation – Thirteenth Edition Gerhart │Newman │Milkovich
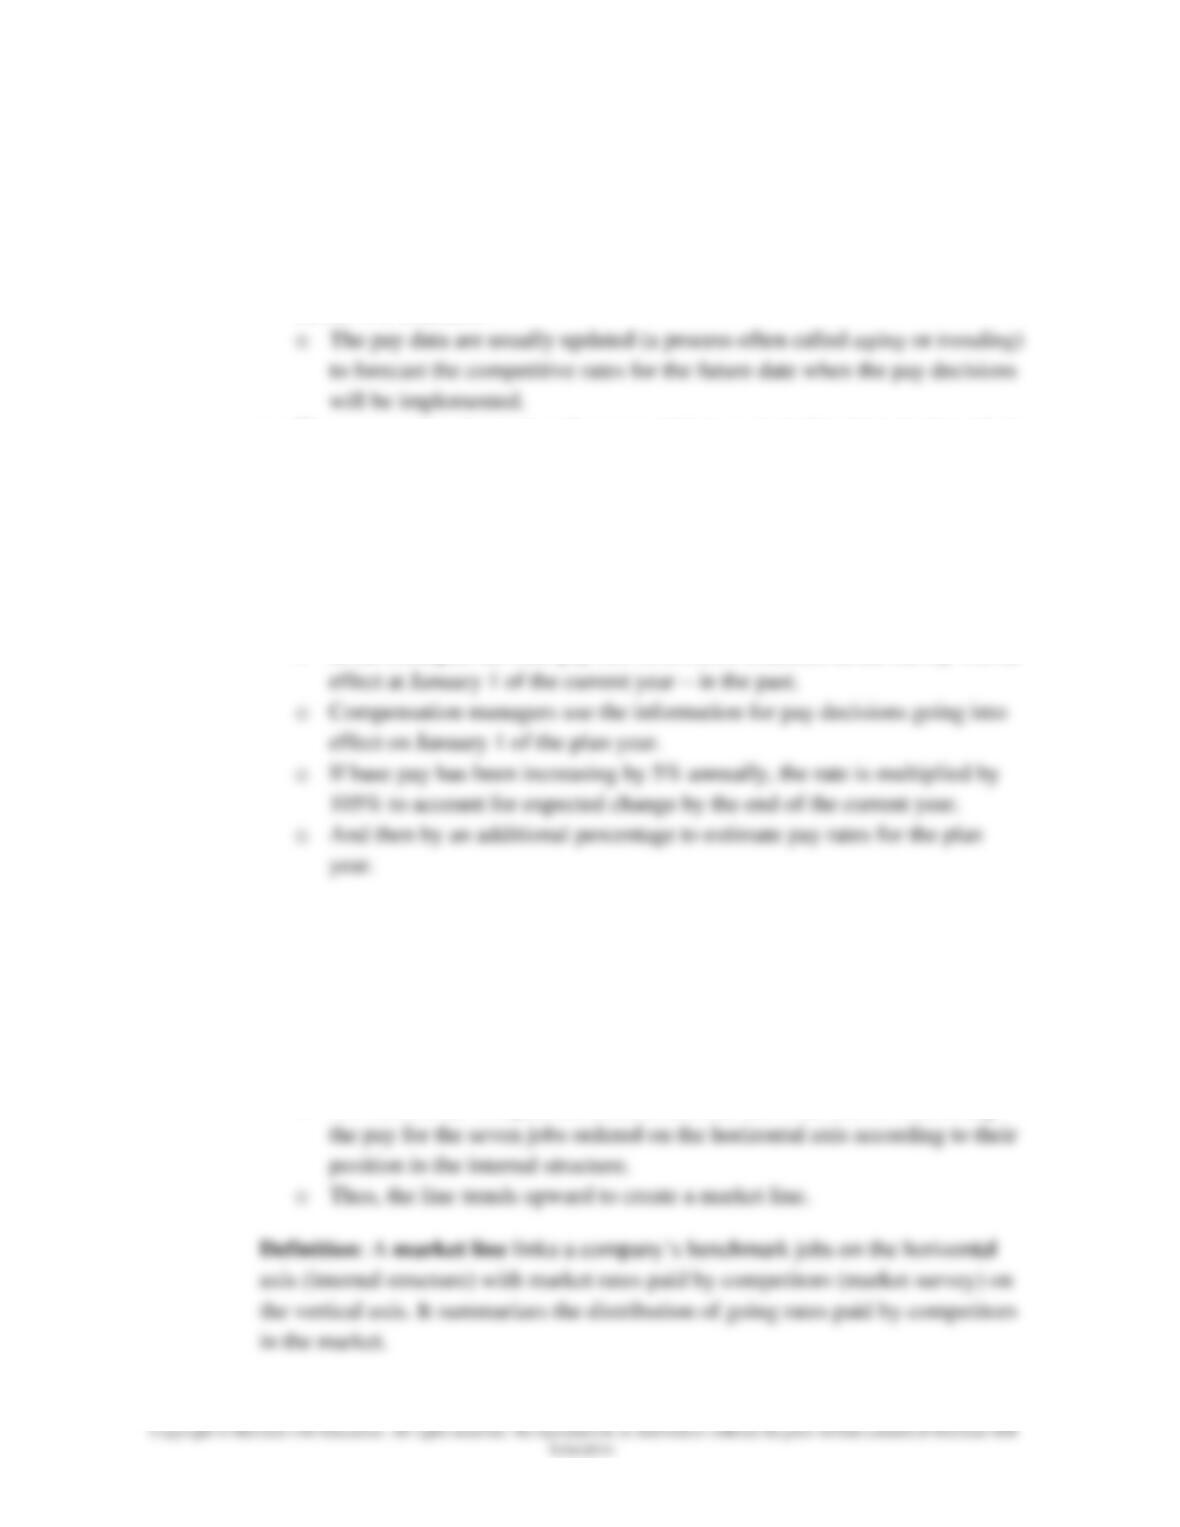
C. Update the Survey Data
• Because they reflect decisions of employers, employees, unions, and
government agencies, wages paid by competitors are constantly changing.
o Additionally, competitors adjust their wages at different times.
• A survey that requires three months to collect and analyze is probably outdated
before it is available.
• The amount to update is based on several factors, including historical trends in
the labor market, prospects for the economy in which the employer operates,
and the manager’s judgment, among others.
• Some recommend using the Consumer Price Index (CPI). It is not advisable
to do so because the CPI measures the rate of change in prices for goods and
services in the product market, not wage changes in labor market.
• Exhibit 8.15 illustrates updating.
o In the example, the base pay rate of $45,000 collected in the survey was in
D. Construct a Market Pay Line
• Look again at Exhibit 8.11.
o It shows the results of the FastCat analyst’s decisions on which salary
survey jobs to include that are judged to closely match internal benchmark
jobs (the 7 jobs on the x [horizontal] axis), which companies to include and
which measures of pay to use.
o For each of the compensation metrics, a line has been drawn connecting
Copyright © McGraw-Hill Education. All rights reserved. No reproduction or distribution without the prior written consent of McGraw-Hill
Education.
8.11 as the dependent variable(s) and the job evaluation points of matched
FastCat jobs as the independent variable.
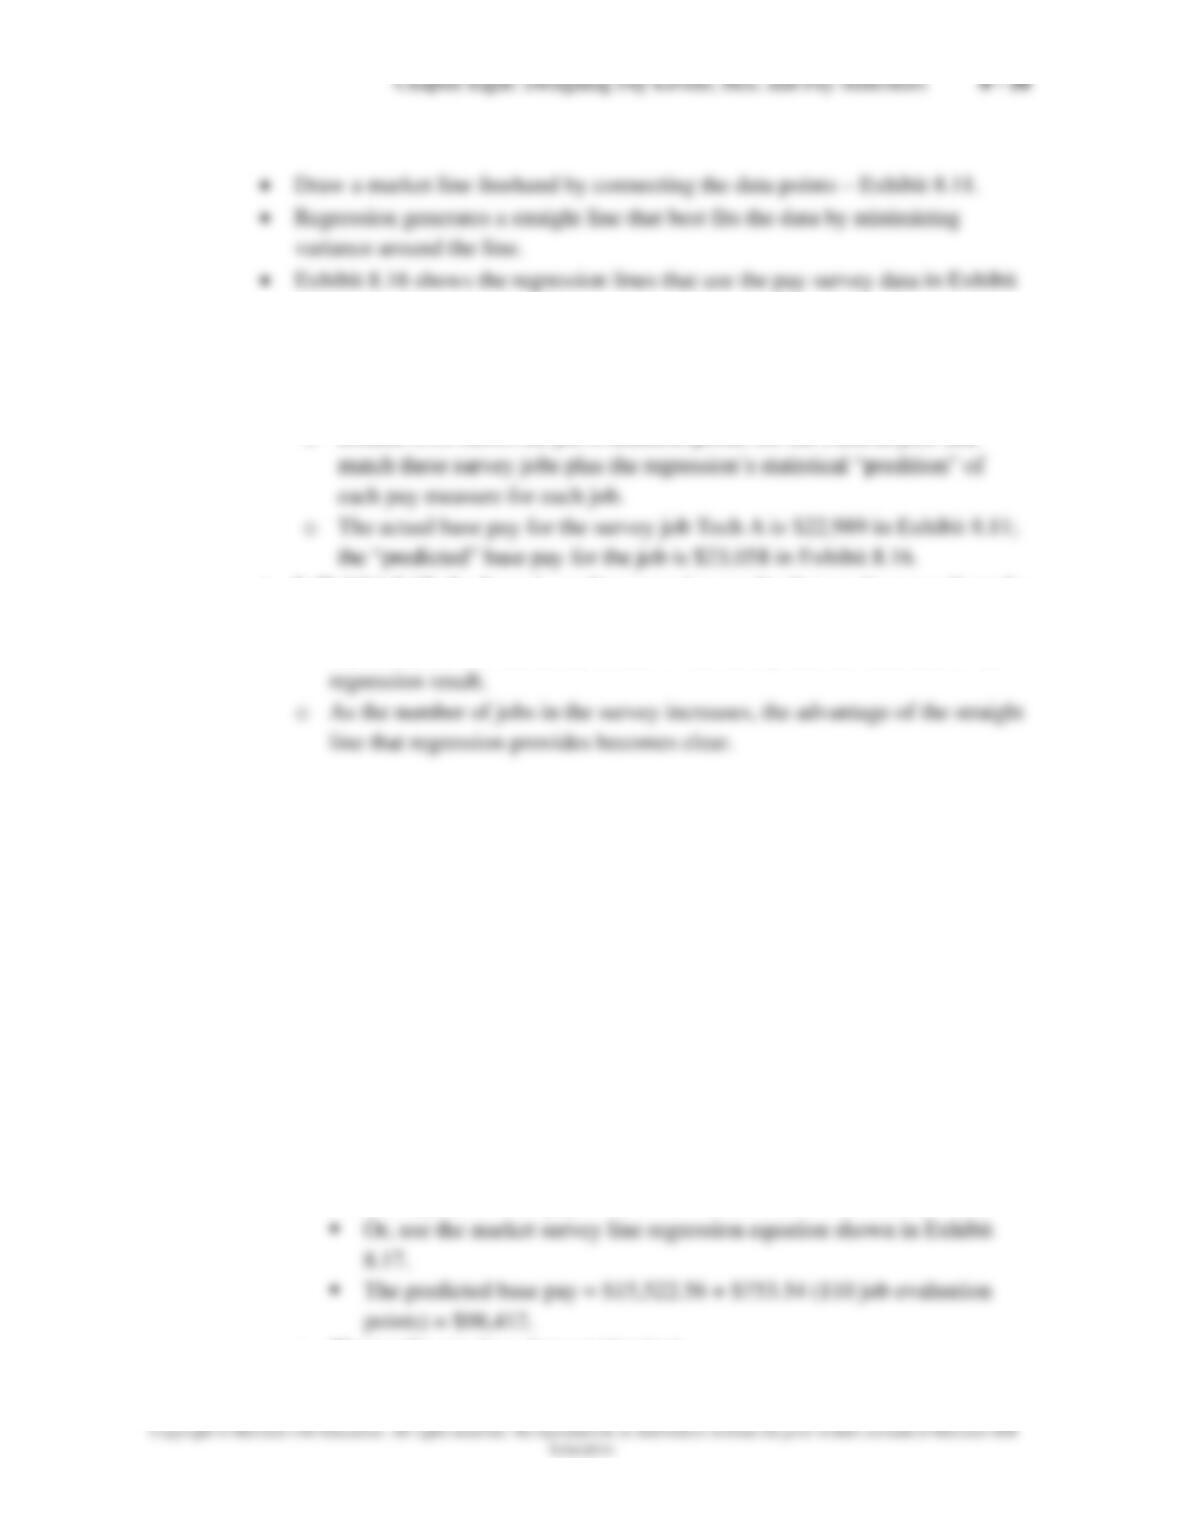
• Compare the data tables in Exhibit 8.11 and Exhibit 8.16.
o Exhibit 8.11 shows the market rates for survey jobs.
o Exhibit 8.16 shows the job evaluation points for the FastCat jobs that
• In Exhibit 8.17, the focus is on the regression results that use base pay from the
survey as the dependent variable.
o The diamonds are the actual results of the survey and the solid line is the
E. Setting Pay for Non-Benchmark Jobs
• Setting pay for benchmark jobs is straightforward to the degree that good
matches with survey jobs are found.
• Once it is known what other organizations pay for each job, a pay level can be
chosen that is a function of what other organizations pay and what role the job
plays in executing the strategy of one’s own organization.
• For non-benchmark jobs (i.e., those jobs for which there is no good match
among jobs included in the pay survey), the market pay lines in Exhibit 8.16
are especially useful.
o For example, Job Z has no match, but does have an assigned job evaluation
point score of 110. How do you estimate its base pay?
o From Exhibit 8.16, we know that FastCat Job J has 100 job evaluation
points and matches a survey job, Eng5, with base pay of $90,876.
▪ One approach is to pay Job Z 110/100 X $90,876 = $99,964.
o The results are close, but not identical.
8 – 17 Compensation – Thirteenth Edition Gerhart │Newman │Milkovich
o The market line is valuable as it allows us to estimate the market pay for
non-benchmark jobs.
• Not all survey results look like the example given in the text and not all
companies use the statistical and analytical techniques given in the text. There
is no “right way” to analyze survey data.
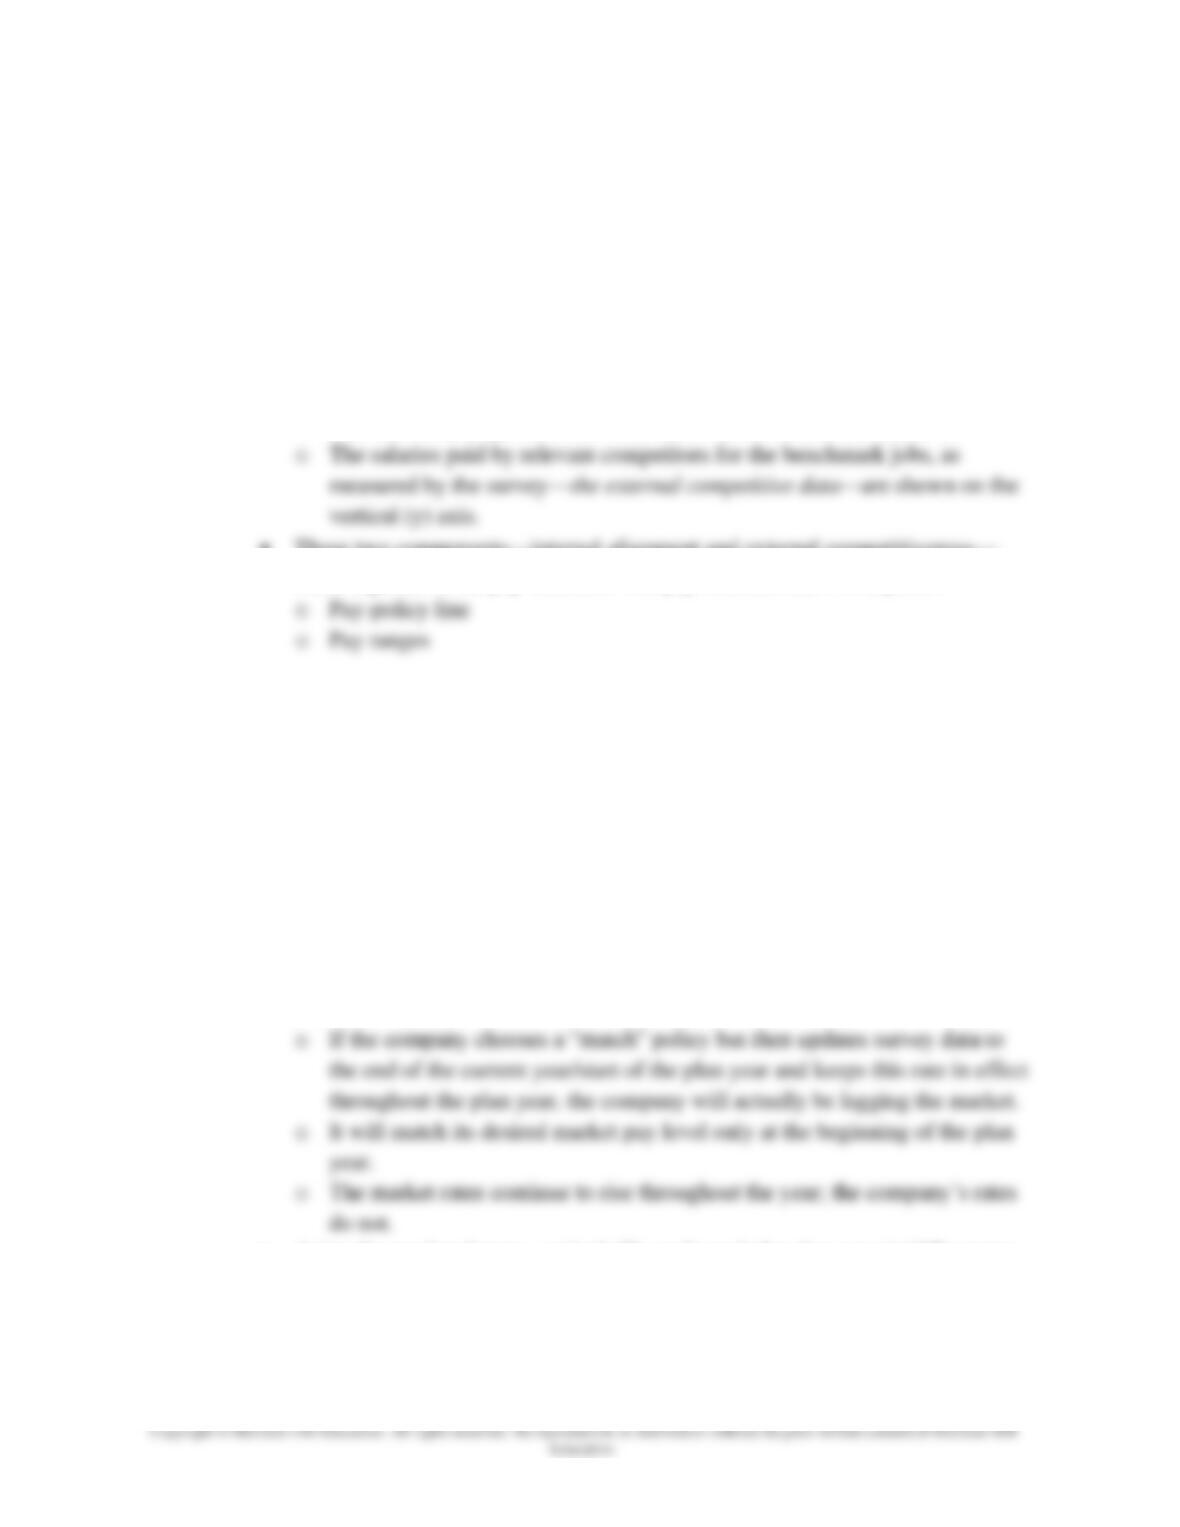
F. Combine Internal Structure and External Market Rates
• At this point, two parts of the total pay model have merged. Their relationship
to each other can be seen in Exhibit 8.18.
o The internally aligned structure is shown on the horizontal (x) axis.
• These two components—internal alignment and external competitiveness—
come together in the pay structure. The pay structure has two aspects:
VII. From Policy to Practice: The Pay-Policy Line
• There are several ways to translate external competitive policy into practice.
A. Choice of Measure
• For example, a company can use a specific percentile for base pay and another
percentile for total compensation as compensation measures in its regression.
B. Updating
• Look again at Exhibit 8.15.
o The arrows on the right side of the exhibit show how updating survey data
reflects policy.
• Aging the market data to a point halfway through the plan year (middle arrow
in Exhibit 8.15) is called lead/lag.
o The original survey rates are updated to the end of the current year plus
half the projected amount for the plan year.
Chapter Eight: Designing Pay Levels, Mix, and Pay Structures 8 – 18
Copyright © McGraw-Hill Education. All rights reserved. No reproduction or distribution without the prior written consent of McGraw-Hill
Education.
o An employer who wants to lead the market may age data to the end of the
plan year and pay at this rate throughout the plan year.
C. Policy Line as Percent of Market Line
• Another way to translate pay-level policy into practice is to simply specify a
percent above or below the regression line (market line) that an employer
intends to match and then draw a new line at this higher (or lower) level.
o This pay-policy line would carry out a policy statement of, “We lead the
market by 10%,” for example. Other examples exist.
• If the practice does not match the policy, then employees receive the wrong
message.
VIII. From Policy to Practice: Grades and Ranges
• The next step is to design pay grades and pay ranges.
• These analyses are usually done with base pay data, since base pay reflects the basic
value of the work rather than performance levels of employees.
• See Exhibit 8.10 for a comparison of metrics
A. Why Bother with Grades and Ranges?
• Grades and ranges offer flexibility to deal with pressures from external
markets and differences among organizations. These include:
o Differences in quality (skills, abilities, experience) among individuals
applying for work.
o Differences in the productivity or value of these quality variations.
▪ The value of the results from a software engineer at Microsoft
probably differs from that of the results of a software engineer at Best
Buy.
o Differences in the mix of pay forms competitors use.
▪ Oracle uses more stock options and lower base compared to IBM.
• A pay range exists whenever two or more rates are paid to employees in the
same job. Hence, ranges provide managers the opportunity to:
o Recognize individual performance differences with pay.
• From an internal alignment perspective, the range reflects the differences in
performance or experience that an employer wishes to recognize with pay.
• From an external competitiveness perspective, the range is a control device.
8 – 19 Compensation – Thirteenth Edition Gerhart │Newman │Milkovich
A range maximum sets the lid on what the employer is willing to pay for that
work; the range minimum sets the floor.
B. Develop Grades
• The first step in building flexibility into the pay structure is to group
different jobs that are considered substantially equal for pay purposes into a
grade.
• The question of which jobs are substantially equal and therefore slotted into
one grade requires the analyst to reconsider the original job evaluation
results.
o Each grade will have its own pay range, and all the jobs within a single
grade will have the same pay range.
o Jobs in different grades should be dissimilar from those in other grades
and will have a different pay range.
• Although grades permit flexibility, they are challenging to design.
o The objective is for all jobs that are similar for pay purposes to be placed
within the same grade.
C. Establish Range Midpoints, Minimums, and Maximums
• Grades group job evaluation data on the horizontal axis; ranges group salary
data on the vertical axis.
o Ranges set upper and lower pay limits for all jobs in each grade.
o A range has three salient features:
• Exhibit 8.19 is an enlargement of grade 2 in Exhibit 8.18, which contains the
engineer 1 job.