Johnson, Human Resource Information Systems, 5e
SAGE Publishing, 2021
HR Data at CyberByte Technology
Assignment Purpose
The purpose of this assignment is to analyze employee data and examine patterns that exist
among data elements. These data are useful for understanding organizational trends and
determining opportunities to improve employment practices. HR data can be useful in decision-
making processes and finding ways to better the organization.
File Needed: HR_Data.xlsx
Familiarize yourself with the spreadsheet before beginning your work.
Note
As you work through the assignment, please be sure to save your work after completing each
section of the project. Save your work as a new Excel file using your first initial and last name.
For example, Joe Smith would be “jsmith_HR_Data.xlsx”.
Calculations
Make sure you round all calculations performed in the spreadsheet as needed. After all, you
can’t have 1/3 of a person. This will require the use of the ROUNDING function. Here is how to
use this function:
Johnson, Human Resource Information Systems, 5e
SAGE Publishing, 2021
Part I – Managerial Personnel
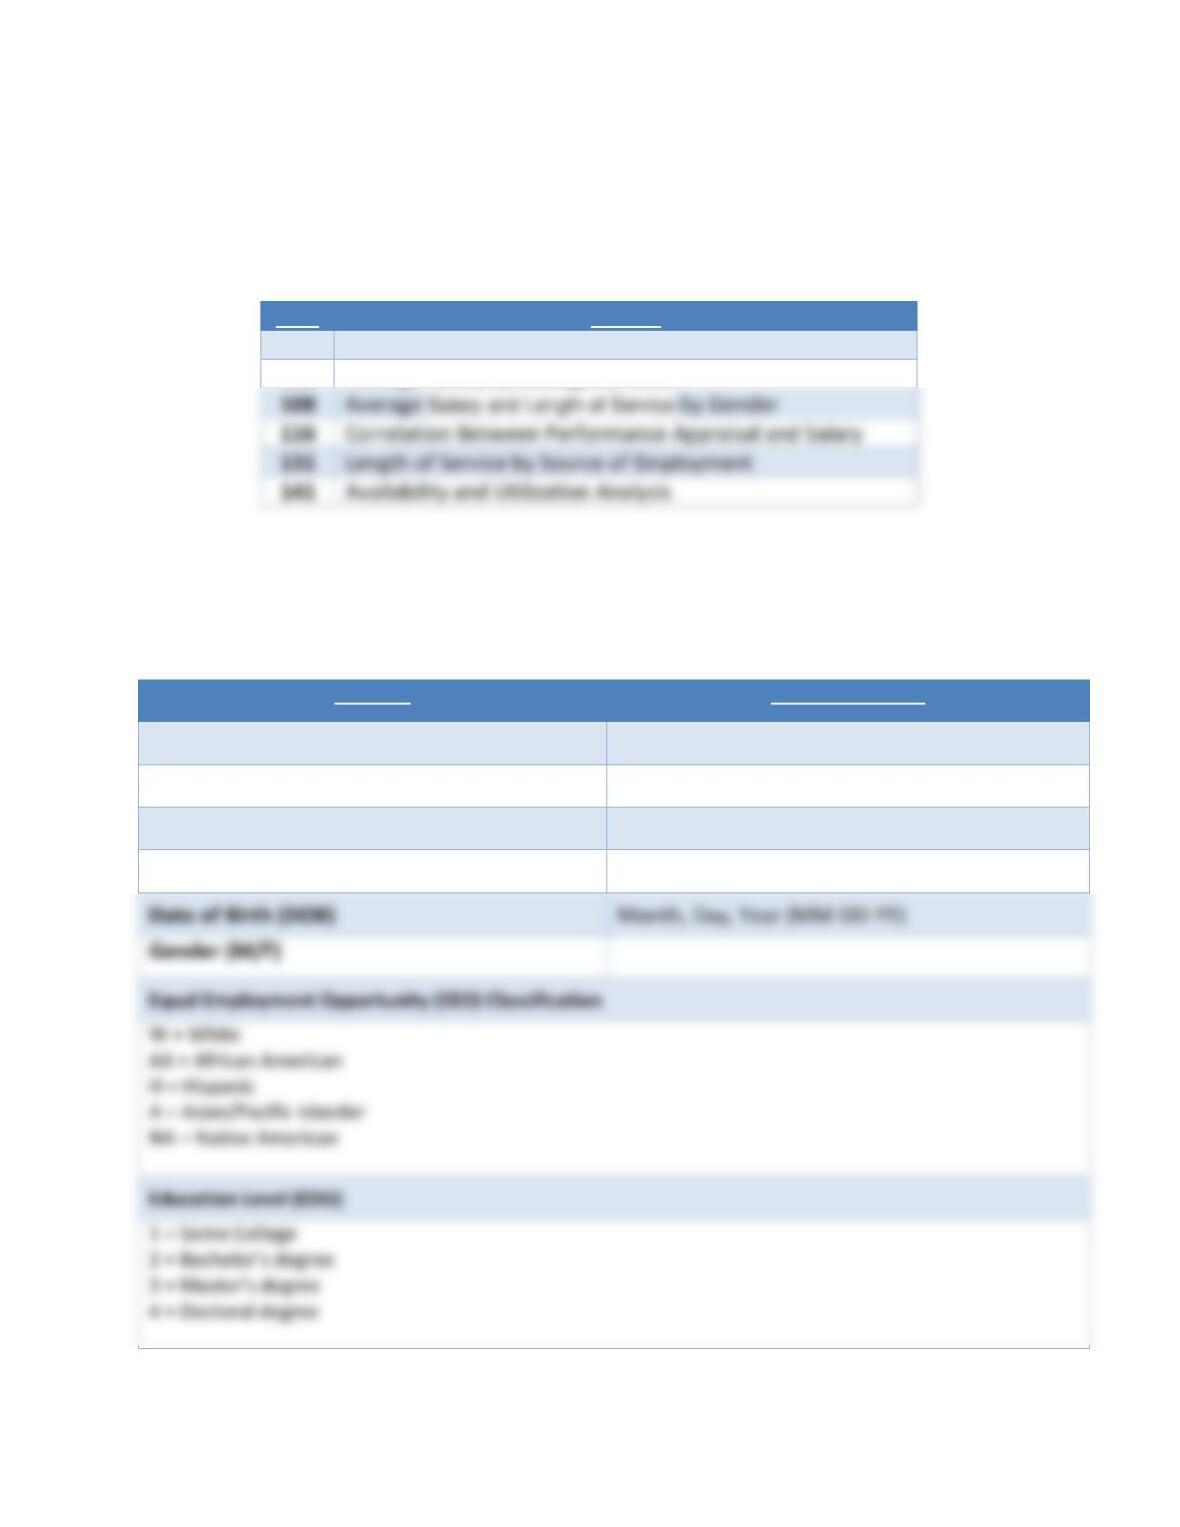
Figure 1: Screen Layout—Locations of Headings for Database Applications
Row
Section
5
Managerial Personnel
108
Average Salary by Managerial Level
108
Average Salary and Length of Service by Gender
116
Correlation Between Performance Appraisal and Salary
131
Length of Service by Source of Employment
The first part of the spreadsheet contains the employee data you will use in this assignment.
Take a minute to familiarize yourself with these data.
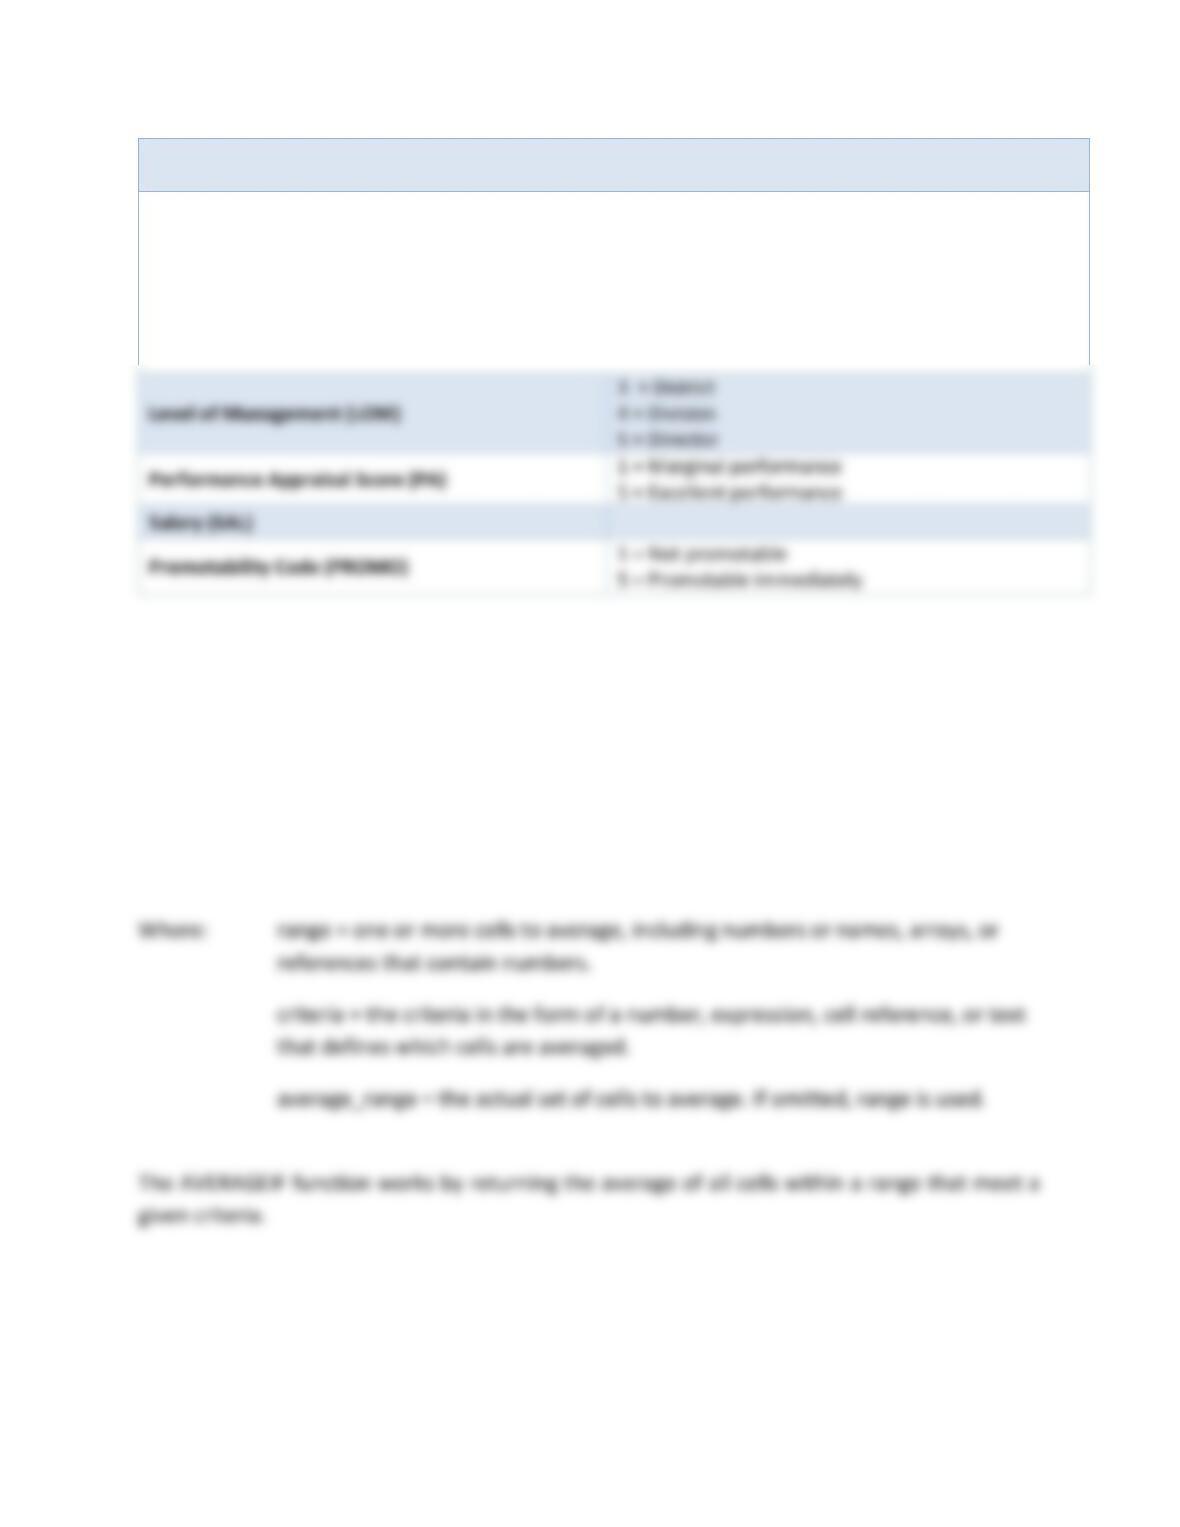
Cell Title
Cell Coding Guide
Employee Last Name (LAST)
First Initial (FI.)
Middle Initial (MI)
Date of Hire (DOH)
Month, Day, Year (MM-DD–YY)
Education Level (EDU)
Johnson, Human Resource Information Systems, 5e
SAGE Publishing, 2021
Source of Employment (SOE)
Agency
College Recruiting
Employment Referral
Job Fair
Unsolicited
Walk-in
AVERAGEIF Function
In this assignment, you will use the AVERAGEIF function to calculate averages for several
different employee groups.
The general form of the AVERAGEIF function is as follows:
= 𝐴𝑉𝐸𝑅𝐴𝐺𝐸𝐼𝐹(𝑟𝑎𝑛𝑔𝑒, 𝑐𝑟𝑖𝑡𝑒𝑟𝑖𝑎, [𝑎𝑣𝑒𝑟𝑎𝑔𝑒_𝑟𝑎𝑛𝑔𝑒])
Part II – Average Salary by Managerial Level
Johnson, Human Resource Information Systems, 5e
SAGE Publishing, 2021
In this section of the spreadsheet, you will utilize the AVERAGEIF function described above to
determine the salaries of managerial personnel within each level of management (LOM):
District, Division, and Director (Cells C111:C113) by inputting the relevant criteria (Columns J
and L).
Part III – Average Salary and length of service by Gender
CTC wants to find out if male and female managers are compensated equally. This analysis is
similar to the analysis above for managerial level, except that you focus on the salary
differences between men and women. To complete this task, you will utilize the AVERAGEIF
function to calculate the salaries for men and women (Cells H111 and H112) by inputting the
relevant criteria for this analysis (Columns F and L).
Part IV – Correlation Between Performance Appraisal and Salary
CTC has a goal of rewarding high performance, but it has not determined the extent to which
these variables are related. During the past year, managers have been trained on CTCs current
performance appraisal system, with the goal of increasing the reliability and validity of
performance appraisals. Your job is to find out whether performance appraisal scores and
salary are correlated.
Part V – Length of Service by Source of Employment
CTC has always assumed that the best sources of managerial talent were college recruits,
employment agencies, and job fairs. They wish to investigate whether or not this is accurate. To
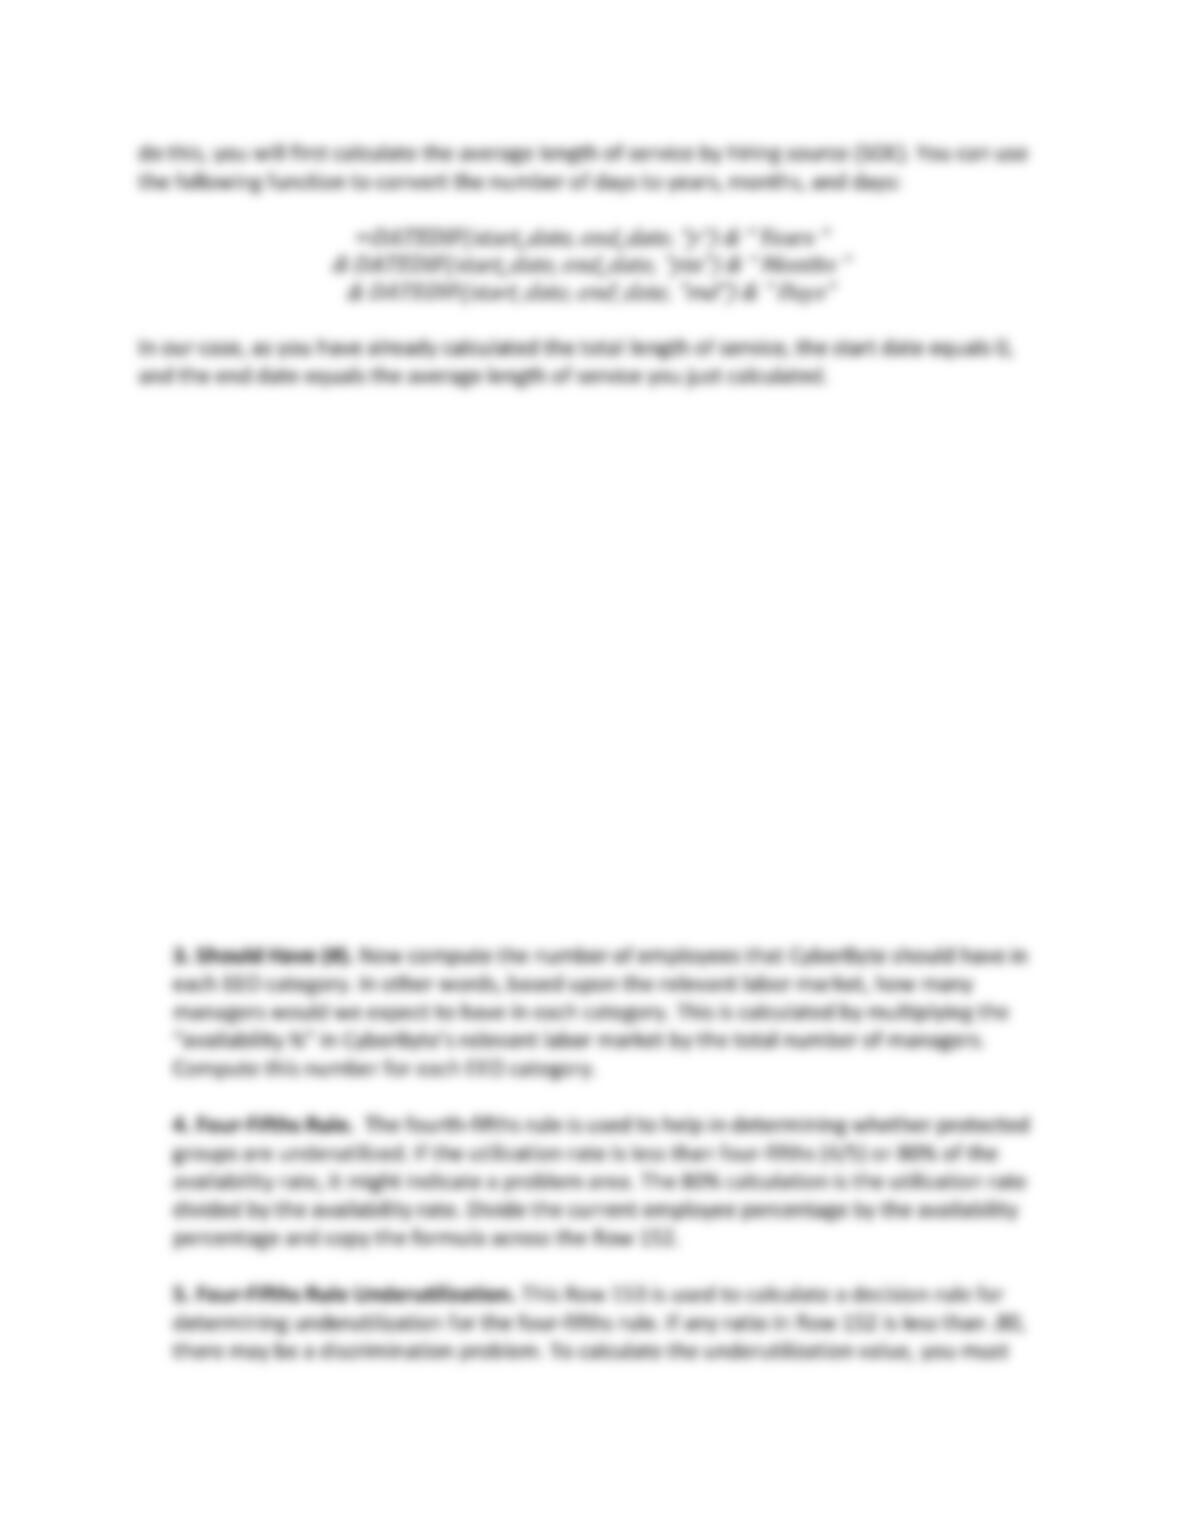
Johnson, Human Resource Information Systems, 5e
SAGE Publishing, 2021
Part VI – Availability and Utilization Analysis
CTC also wants to monitor the diversity of their managers, not only to comply with EEOC
requirements but also to ensure that they have a diverse management team. This section of the
spreadsheet will help assess whether they are achieving diversity. The availability and
utilization analysis refers to the representation of women and minorities in the relevant labor
market (i.e., the labor area surrounding the organization). These availability percentages were
compiled by CyberByte’s HR Department and are found in Cells C149:I149. Row 150 shows the
number of applicants CyberByte has received from applicants in each group.
1. Employees #. Calculate the number of managers employed at CyberByte, organized by
EEOC category. These data come from the calculations you just made. Calculate the total for
each ethnic group and for males and females.
2. Employees %. To calculate this percentage, divide the total in each employee group by
the total number of managers.
Johnson, Human Resource Information Systems, 5e
SAGE Publishing, 2021
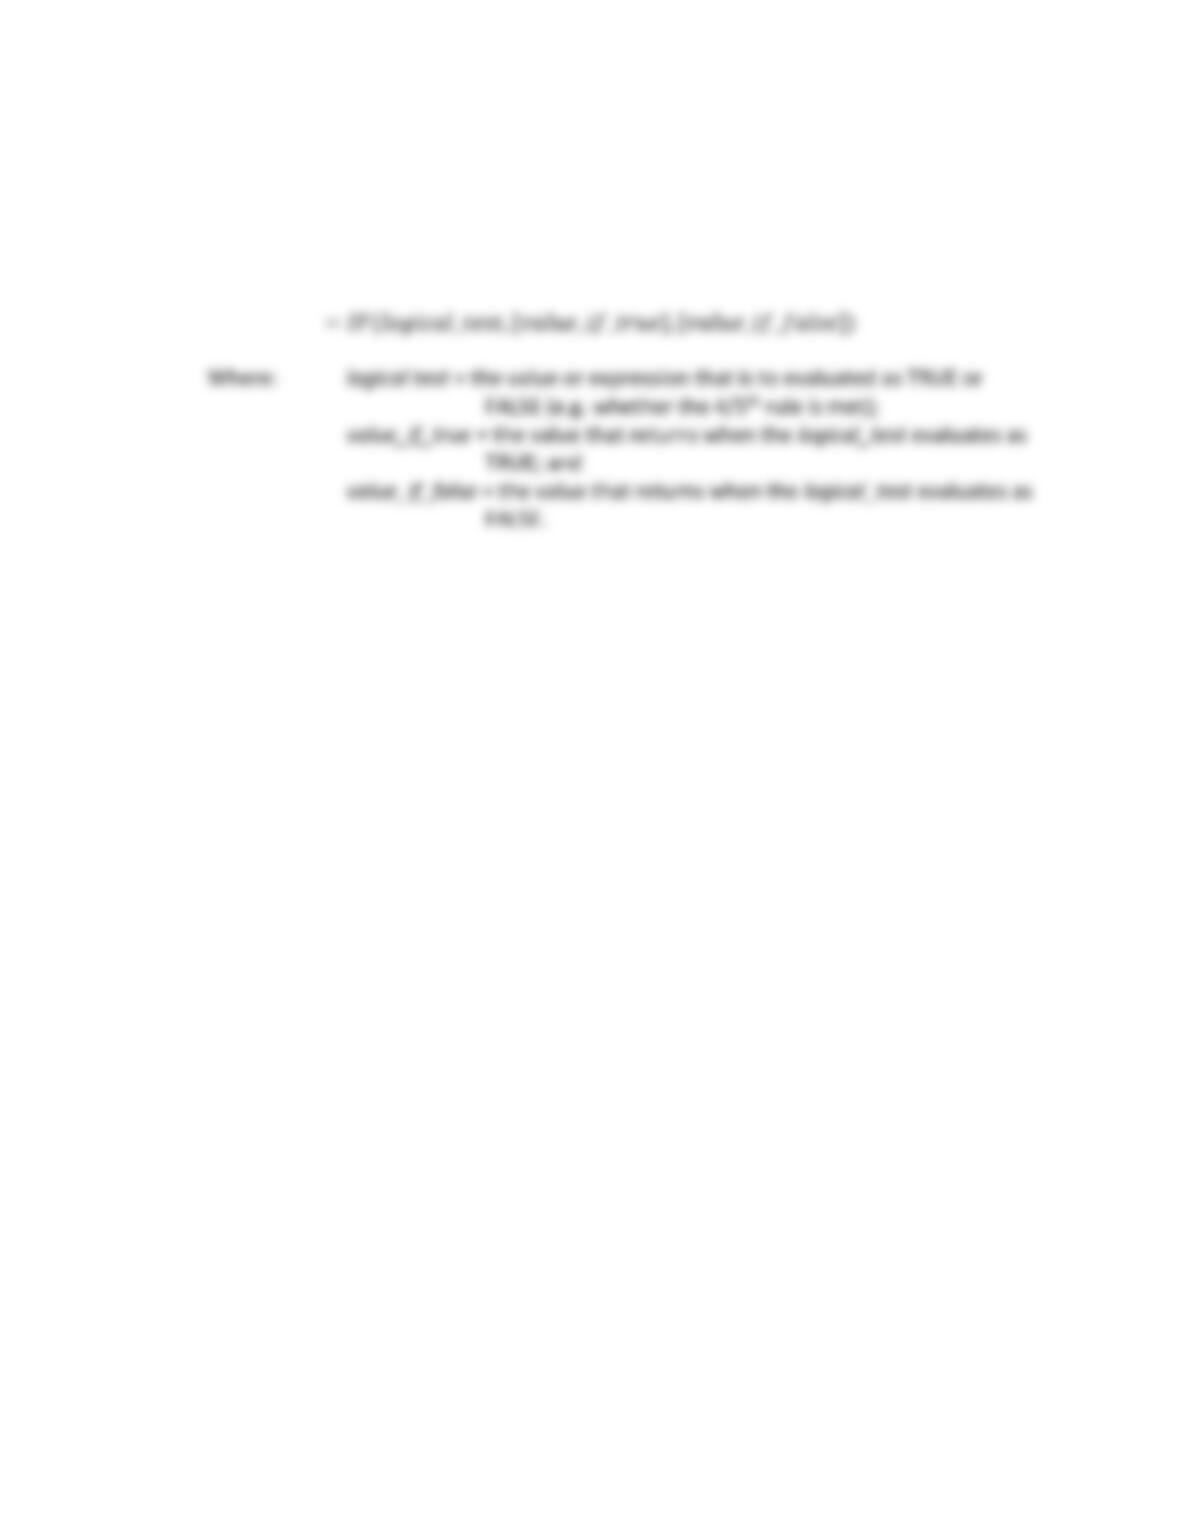
take the ratio in Row 152 and assess if it is less or greater than .80 using the IF function in
Excel. We use the IF function because it will help to retrieve a value of “1” for a TRUE result,
and a value of “0” for a FALSE result.
The IF function is input as follows:
By the logical test, we are asking Excel to yield a true or false value – that is, whether the
ratios in Row 152 indicate violation of the four-fifths rule.
Thus, by yielding an output of 0 or 1, this function will tell us if possible discrimination is
taking place or not. Compute the formula across Row 153.

Johnson, Human Resource Information Systems, 5e
SAGE Publishing, 2021
Study Questions
Using the data from the spreadsheet, answer the following questions in a separate document.
1. What is the average salary for each level of management?
Level 3 _________________
Level 4 _________________
Level 5 _________________
All __________________
Which level of managers have the highest salary? Why do you think that is? As an HR manager,
how would you determine if pay equity exists across levels of management?
2. What is the average salary and length of service (LOS) for male and female managers?
3. How do you account for the fact that male managers have higher average salaries despite the
fact that women have, on average, longer service with CTC?
5. What are the best recruitment sources at CTC base on job survival (LOS)? Do the data
support CTCs beliefs about which sources yield the longest serving managers? How else might
you evaluate the effectiveness of recruitment sources?

Johnson, Human Resource Information Systems, 5e
SAGE Publishing, 2021
6. What do the results of the Four-Fifths Rule indicate regarding the utilization of managers at
CTC?
8. What ethnic group has the highest percentage of employees?