MINI CASE
Hatfield Medical Supplies’s stock price had been lagging its industry averages, so its
board of directors brought in a new CEO, Jaiden Lee. Lee had brought in Ashley Novak, a
finance MBA who had been working for a consulting company, to replace the old CFO, and
Lee asked Ashley to develop the financial planning section of the strategic plan. In her
previous job, Novak’s primary task had been to help clients develop financial forecasts, and
that was one reason Lee hired her.
Novak began as she always did, by comparing Hatfield’s financial ratios to the
industry averages. If any ratio was substandard, she discussed it with the responsible manager
to see what could be done to improve the situation. The following data shows Hatfield’s latest
financial statements plus some ratios and other data that Novak plans to use in her analysis.
Hatfield Medical Supplies (Millions of Dollars Except Per Share Data)
Balance Sheet, 12/31/2015
Income Statement, Year Ending 2015
Cash
$ 20
Sales
$2,000
Accts. rec.
280
Op. costs (excl. depr.)
1,800
Mini Case: 9 – 16
Depreciation
$ 700
Net fixed assets
Interest
Pretax earnings
Taxes (40%)
Accts. pay. & accruals
$ 80
Line of credit
$0
$ 80
$20.0
$46.0
$ 580
420
$6.60
Retained earnings
200
$2.00
$52.80
Selected Additional Data for 2015
Hatfield
Industry
Hatfield
Industry
Op. costs/Sales
90.0%
88.0%
Total liability/Total assets
48.3%
36.7%
Depr./FA
10.0%
12.0%
Times interest earned
3.8
8.9
Cash/Sales
1.0%
1.0%
Return on assets (ROA)
5.5%
10.2%
Note: Hatfield was operating at full capacity in 2015. Also, you may observe small differences in items like the ROE
when calculated in different ways. Any such differences are due to rounding, and they can be ignored.
Mini Case: 9 – 17
14.0%
11.0%
Profit margin (M)
3.30%
4.99%
Inventories/Sales
20.0%
15.0%
1.67
2.04
Fixed assets/Sales
25.0%
22.0%
1.94
1.56
Acc. pay. & accr. / Sales
4.0%
4.0%
Return on equity (ROE)
10.6%
16.1%
Tax rate
40.0%
40.0%
P/E ratio
8.0
16.0
8.0%
12.5%
NOPAT/Sales
4.5%
5.6%
56.0%
45.0%
a. Using Hatfield’s data and its industry averages, how well run would you say
Hatfield appears to be in comparison with other firms in its industry? What are its
primary strengths and weaknesses? Be specific in your answer, and point to various
ratios that support your position. Also, use the DuPont equation (see Chapter 7) as
one part of your analysis.
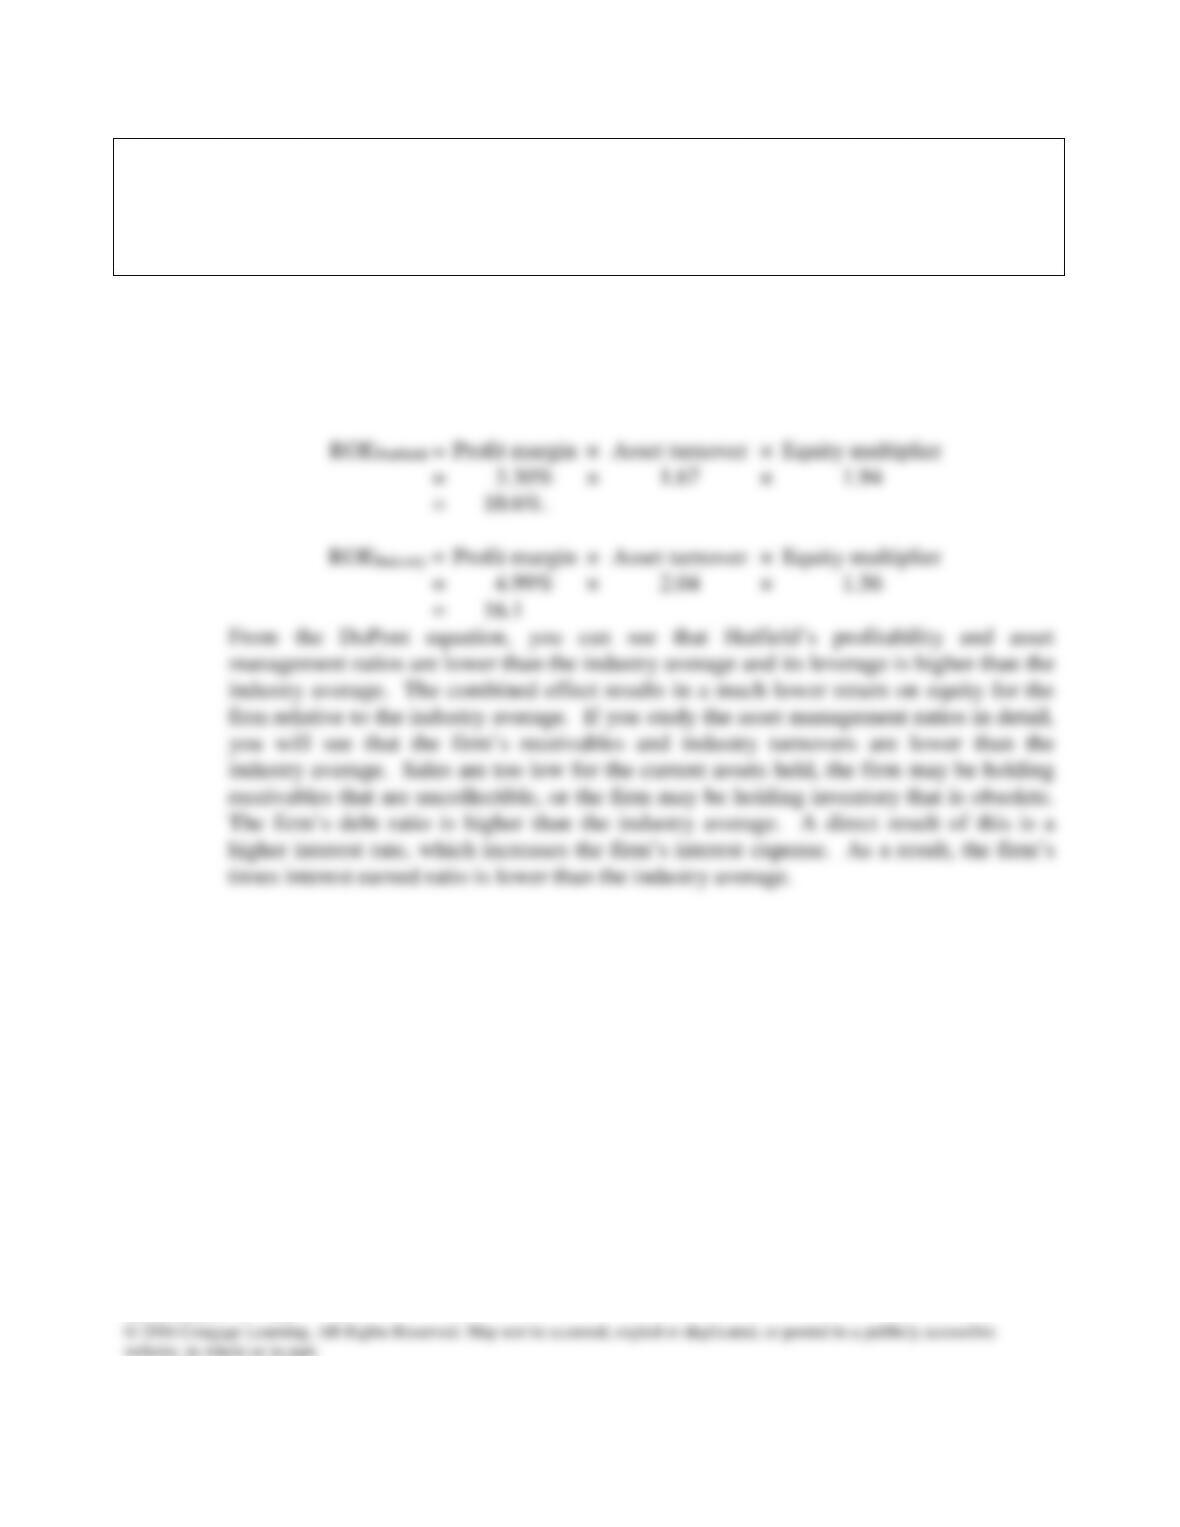
Answer: The DuPont equation shows the relationship among asset management, profitability
ratios, and leverage. By examining this equation we can determine where Hatfield falls
short of the industry.
Mini Case: 9 – 18
b. Use the AFN equation to estimate Hatfield’s required new external capital for 2016
if the sales growth rate is 10%. Assume that the firm’s 2015 ratios will remain the
same in 2016. (Hint: Hatfield was operating at full capacity in 2015.)
Answer:
Data for AFN Equation
Growth rate in sales (g)
10%
Sales (S0)
$2,000
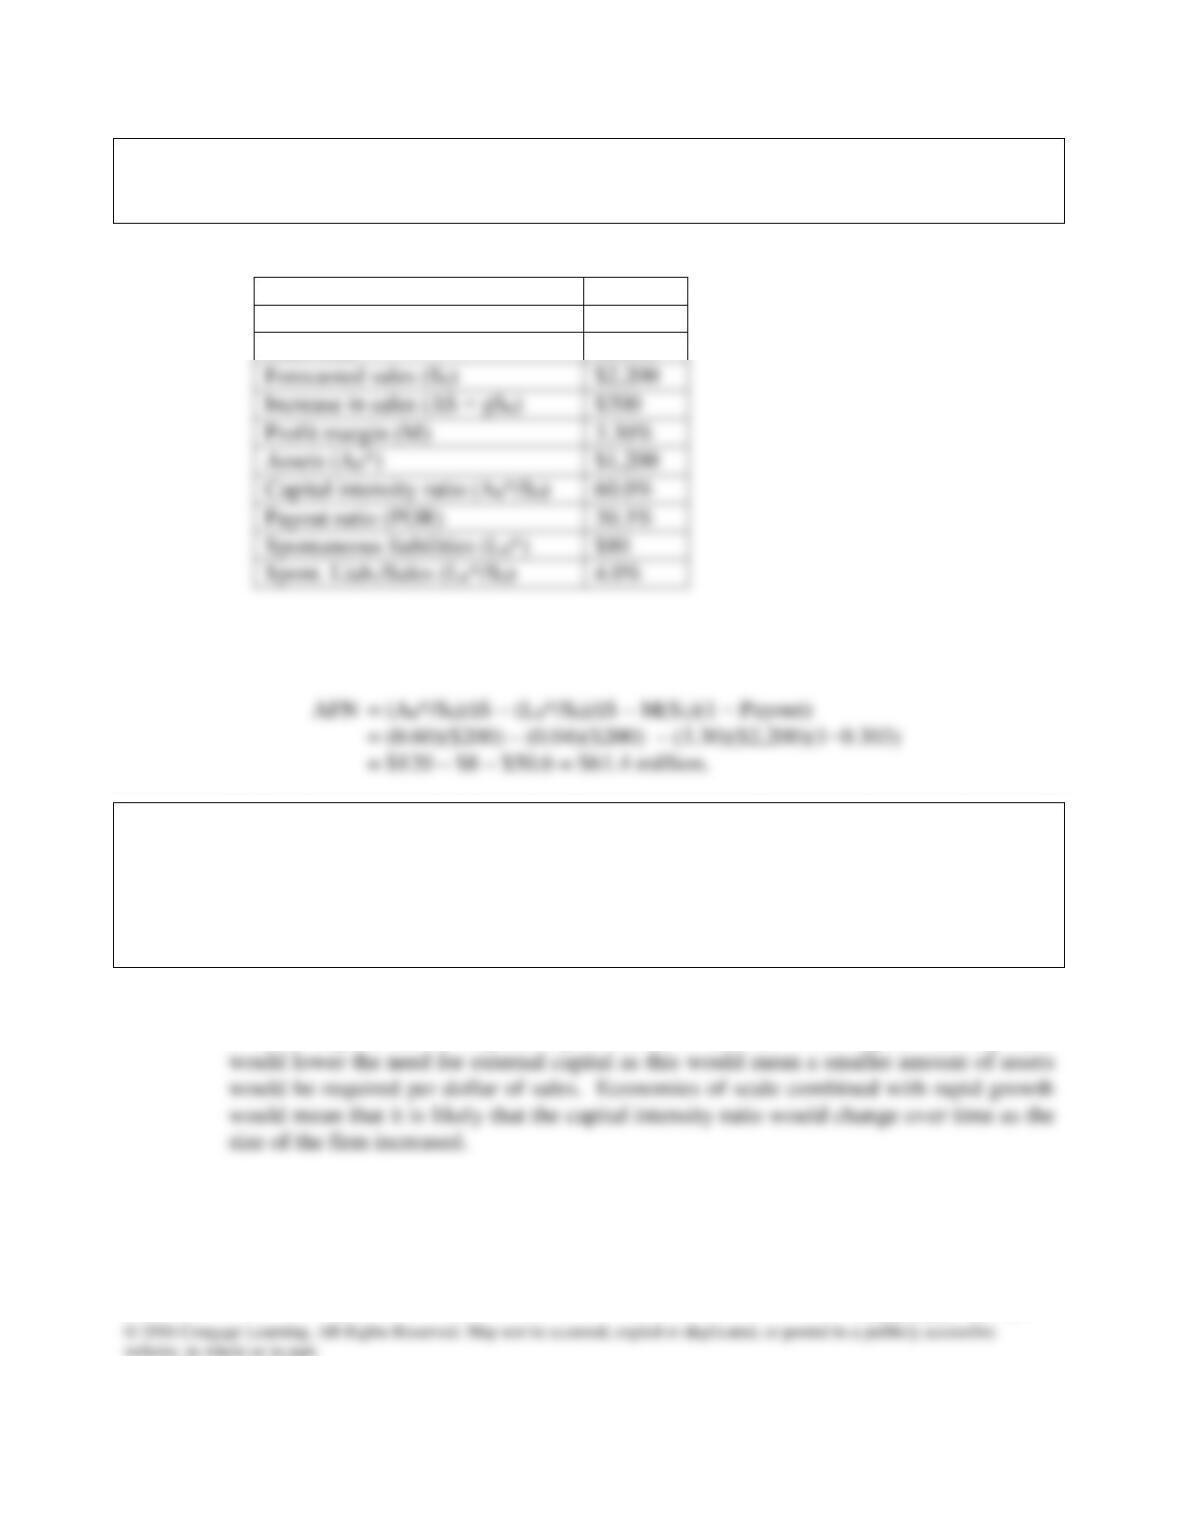
Here is the AFN equation:
c. Define the term capital intensity. Explain how a decline in capital intensity would
affect the AFN, other things held constant. Would economies of scale combined
with rapid growth affect capital intensity, other things held constant? Also, explain
how changes in each of the following would affect AFN, holding other things
constant: the growth rate, the amount of accounts payable, the profit margin, and
the payout ratio.
Answer: The capital intensity ratio is the amount of assets required per dollar of sales, A0*/S0, and
it has a major effect on capital requirements. A decline in the capital intensity ratio
Mini Case: 9 – 19
Forecasted sales (S1)
$2,200
$200
3.30%
$1,200
60.0%
Payout ratio (POR)
30.3%
$80
Spont. Liab./Sales (L0*/S0)
4.0%
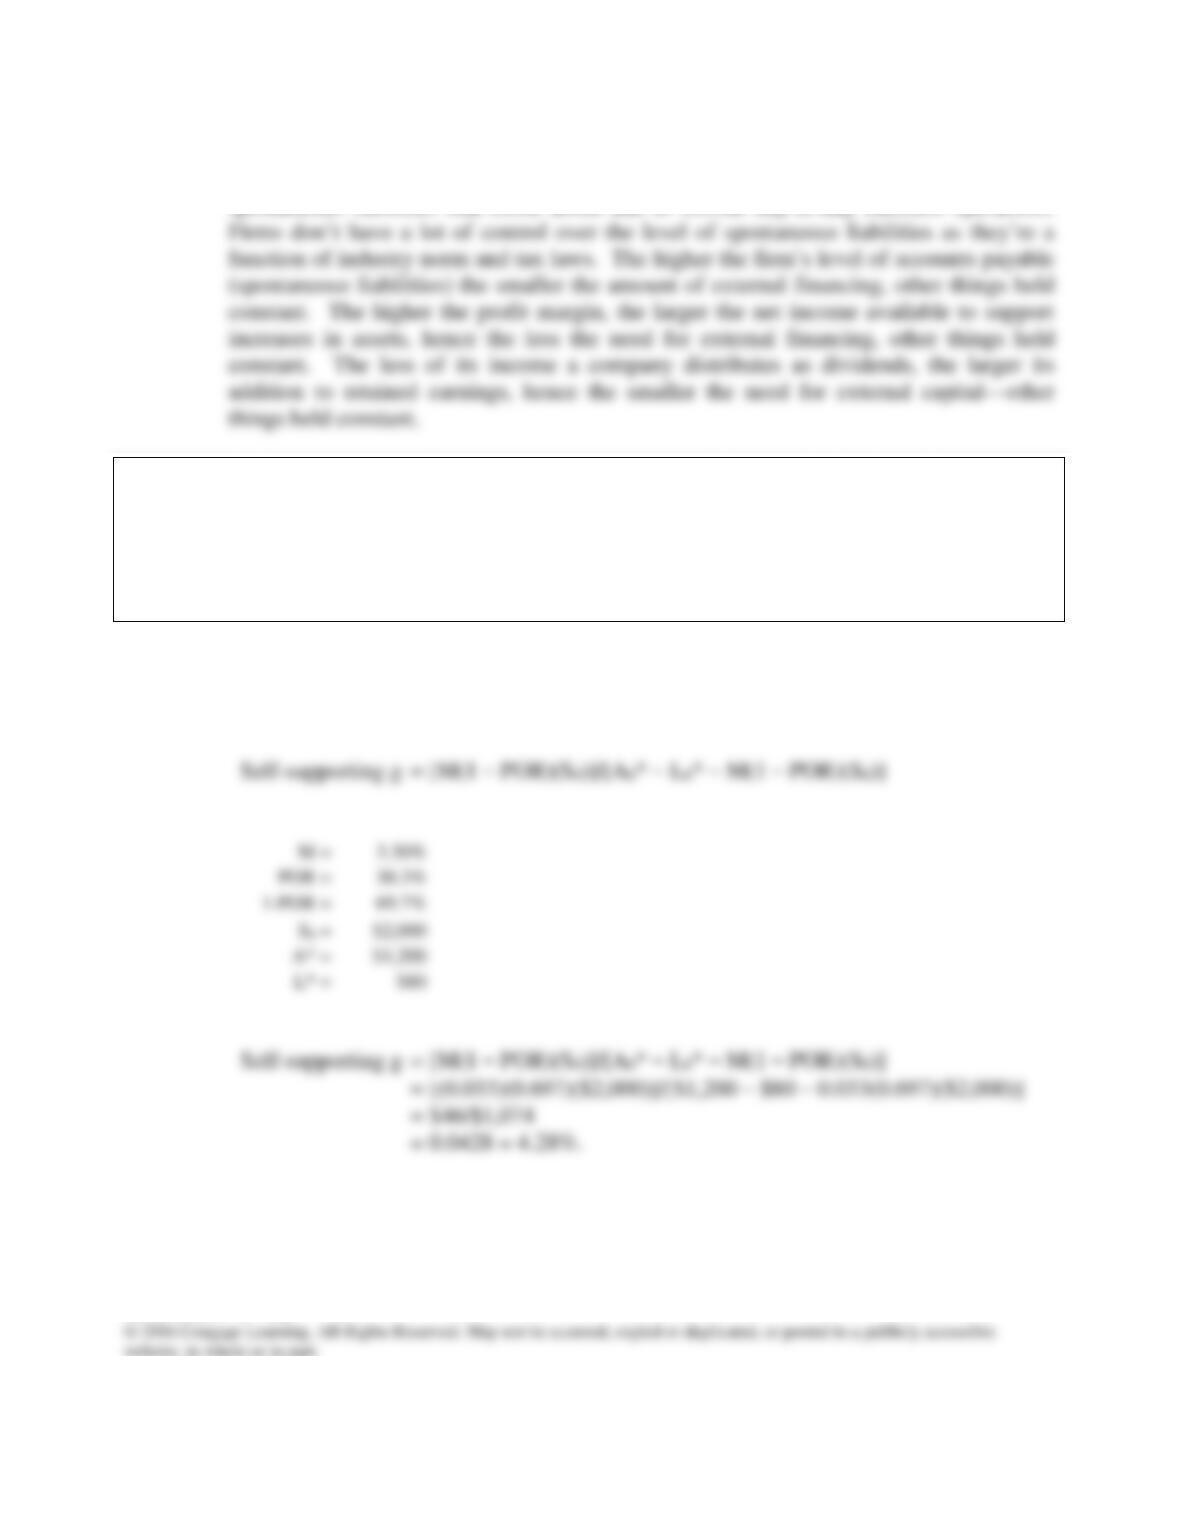
Rapidly growing companies require large increases in assets and a corresponding
large amount of external financing, other things held constant. Accounts payable are
spontaneous liabilities that come about due to normal day–to–day business operations.
d. Define the term self–supporting growth rate. What is Hatfield’s self-supporting
growth rate? Would the self-supporting growth rate be affected by a change in the
capital intensity ratio or the other factors mentioned in the previous question?
Other things held constant, would the calculated capital intensity ratio change over
time if the company were growing and were also subject to economies of scale
and/or lumpy assets?
Answer: The self-supporting growth rate is the maximum growth rate the firm could achieve if it
had no access to external capital. From the data given, Hatfield’s self-supporting growth
rate is calculated as:
Mini Case: 9 – 20
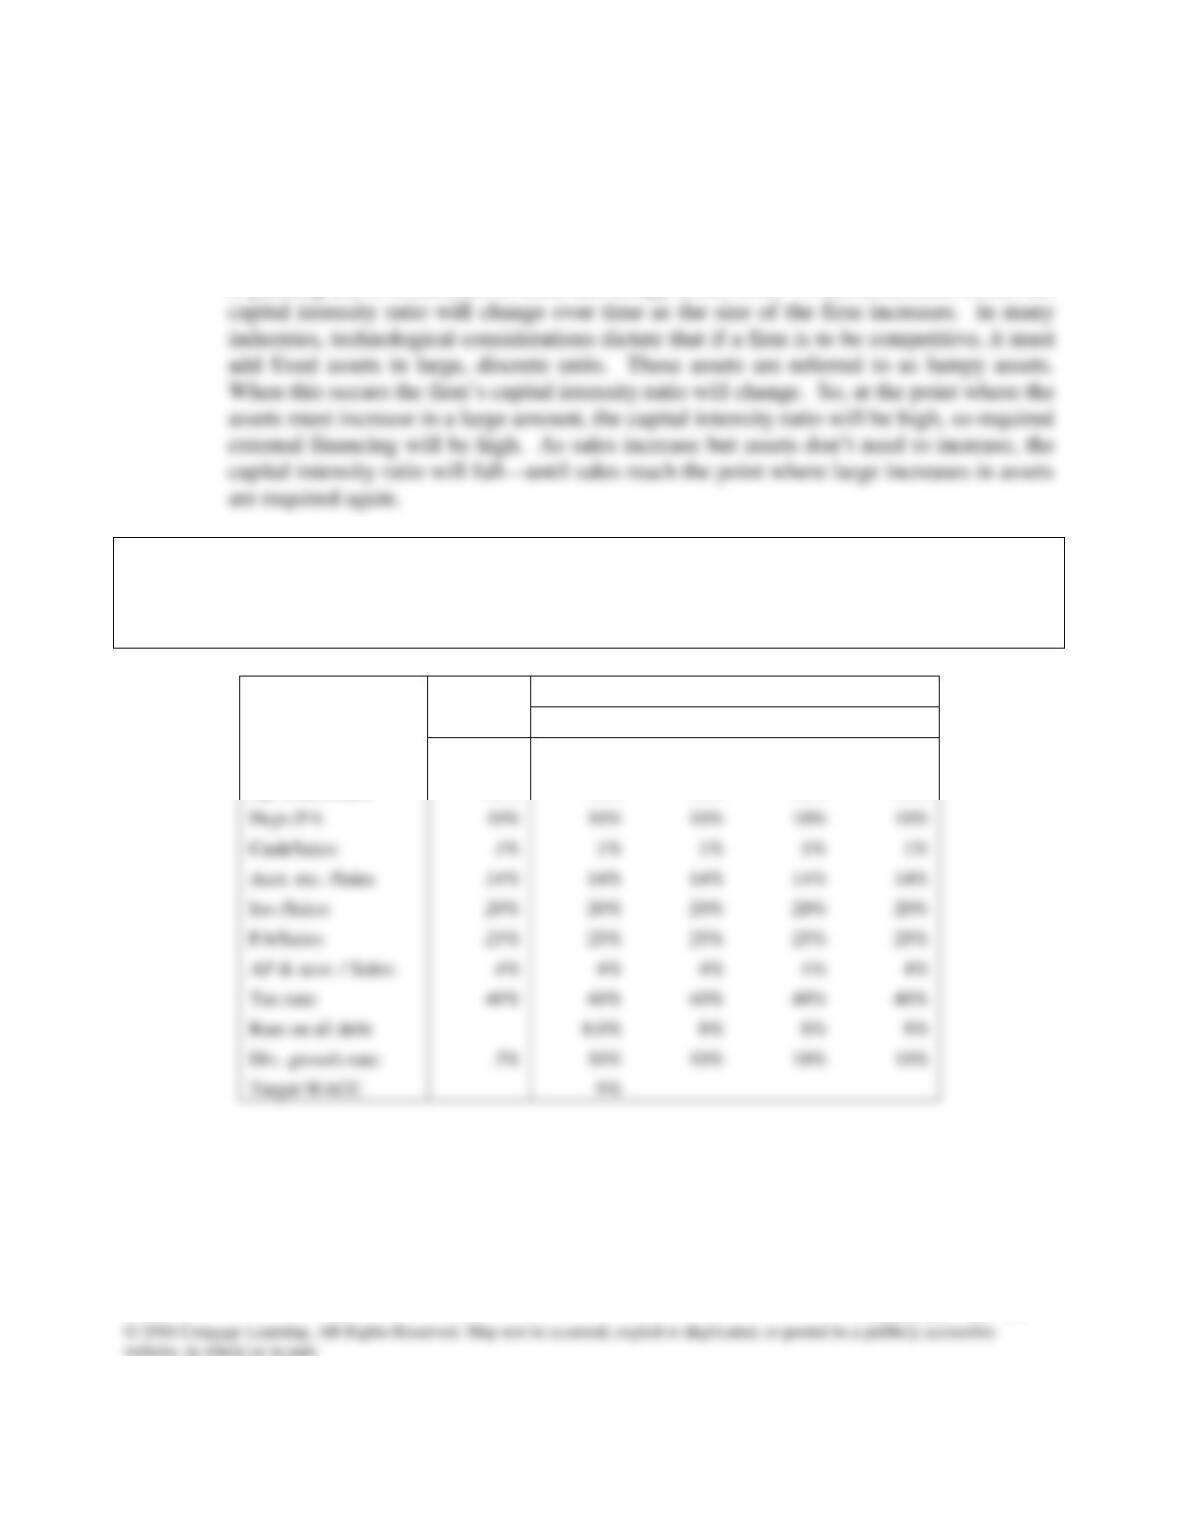
The higher the firm’s capital intensity ratio, the lower the firm’s self-supporting growth
rate because the firm would require more assets per dollar of sales. The higher the
firm’s profit margin and the lower its payout ratio, the higher the firm’s self-supporting
growth rate.
The calculated capital intensity ratio will change over time if the firm company is
expanding and if economies of scale and lumpy assets exist. When economies occur, the
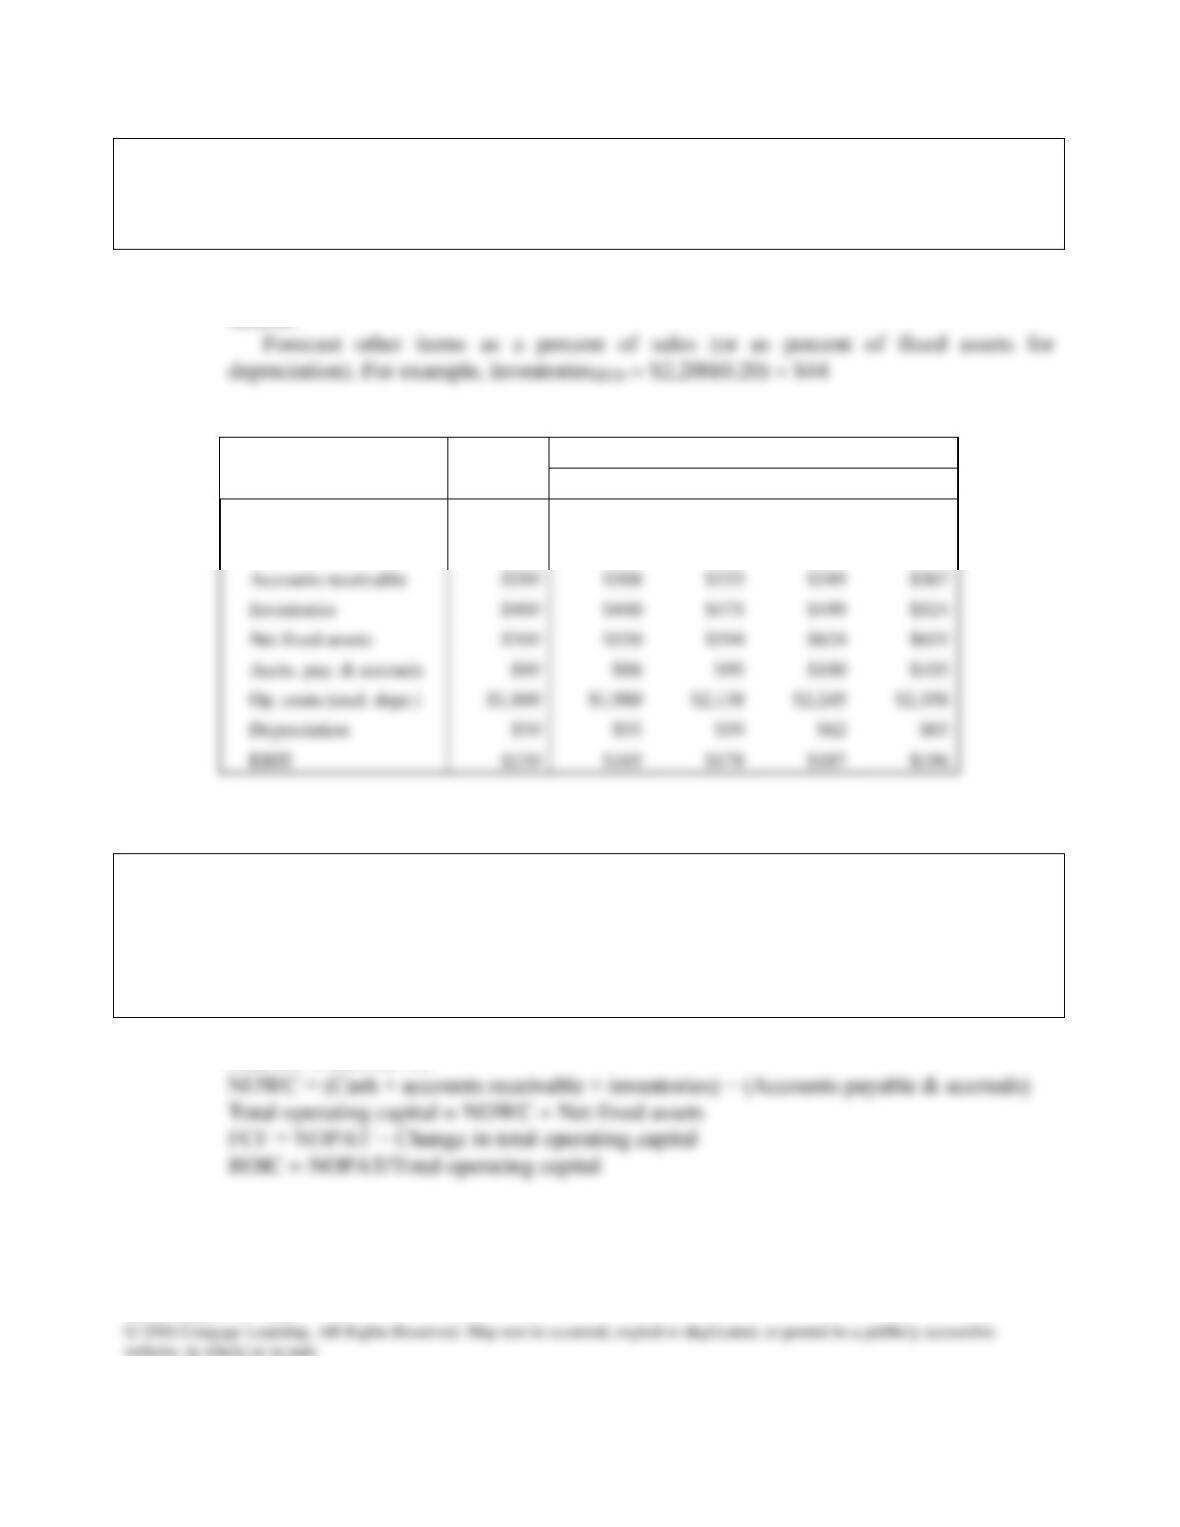
e. Use the following assumptions to answer the questions below: (1) Operating ratios
remain unchanged. (2) Sales will grow by 10%, 8%, 5%, and 5% for the next four
years. (3) The target weighted average cost of capital (WACC) is 9%. This is the
No Change scenario because operations remain unchanged.
Actual
Forecast
Inputs
2015
2016
2017
2018
2019
Sales growth rate:
10%
8%
5%
5%
Op. costs/Sales:
90%
90%
90%
90%
90%
10%
10%
10%
10%
10%
1%
1%
1%
Acct. rec. /Sales
14%
14%
14%
14%
14%
Inv./Sales:
20%
20%
20%
20%
20%
25%
25%
25%
25%
25%
AP & accr. / Sales:
4%
4%
4%
Tax rate:
40%
40%
40%
40%
40%
Rate on all debt
8%
8%
8%
10%
10%
10%
10%
Target WACC
Mini Case: 9 – 21
e. 1. For each of the next four years, forecast the following items: sales, cash, accounts
receivable, inventories, net fixed assets, accounts payable & accruals, operating
costs (excluding depreciation), depreciation, and earnings before interest and taxes
(EBIT).
Forecast sales as Salest = Salest-1(1+gt). For example, Sales2016 = $2,000(1+0.10) =
$2,200.
Scenario: No Change
Actual
Forecast
2015
2016
2017
2018
2019
Net sales
$2,000
$2,200
$2,376
$2,495
$2,620
Cash
$20
$22
$24
$25
$26
Accounts receivable
Net fixed assets
Accts. pay. & accruals
$80
$88
$95
Op. costs (excl. depr.)
$1,800
$1,980
$2,138
$2,245
$2,358
$55
$59
$62
$65
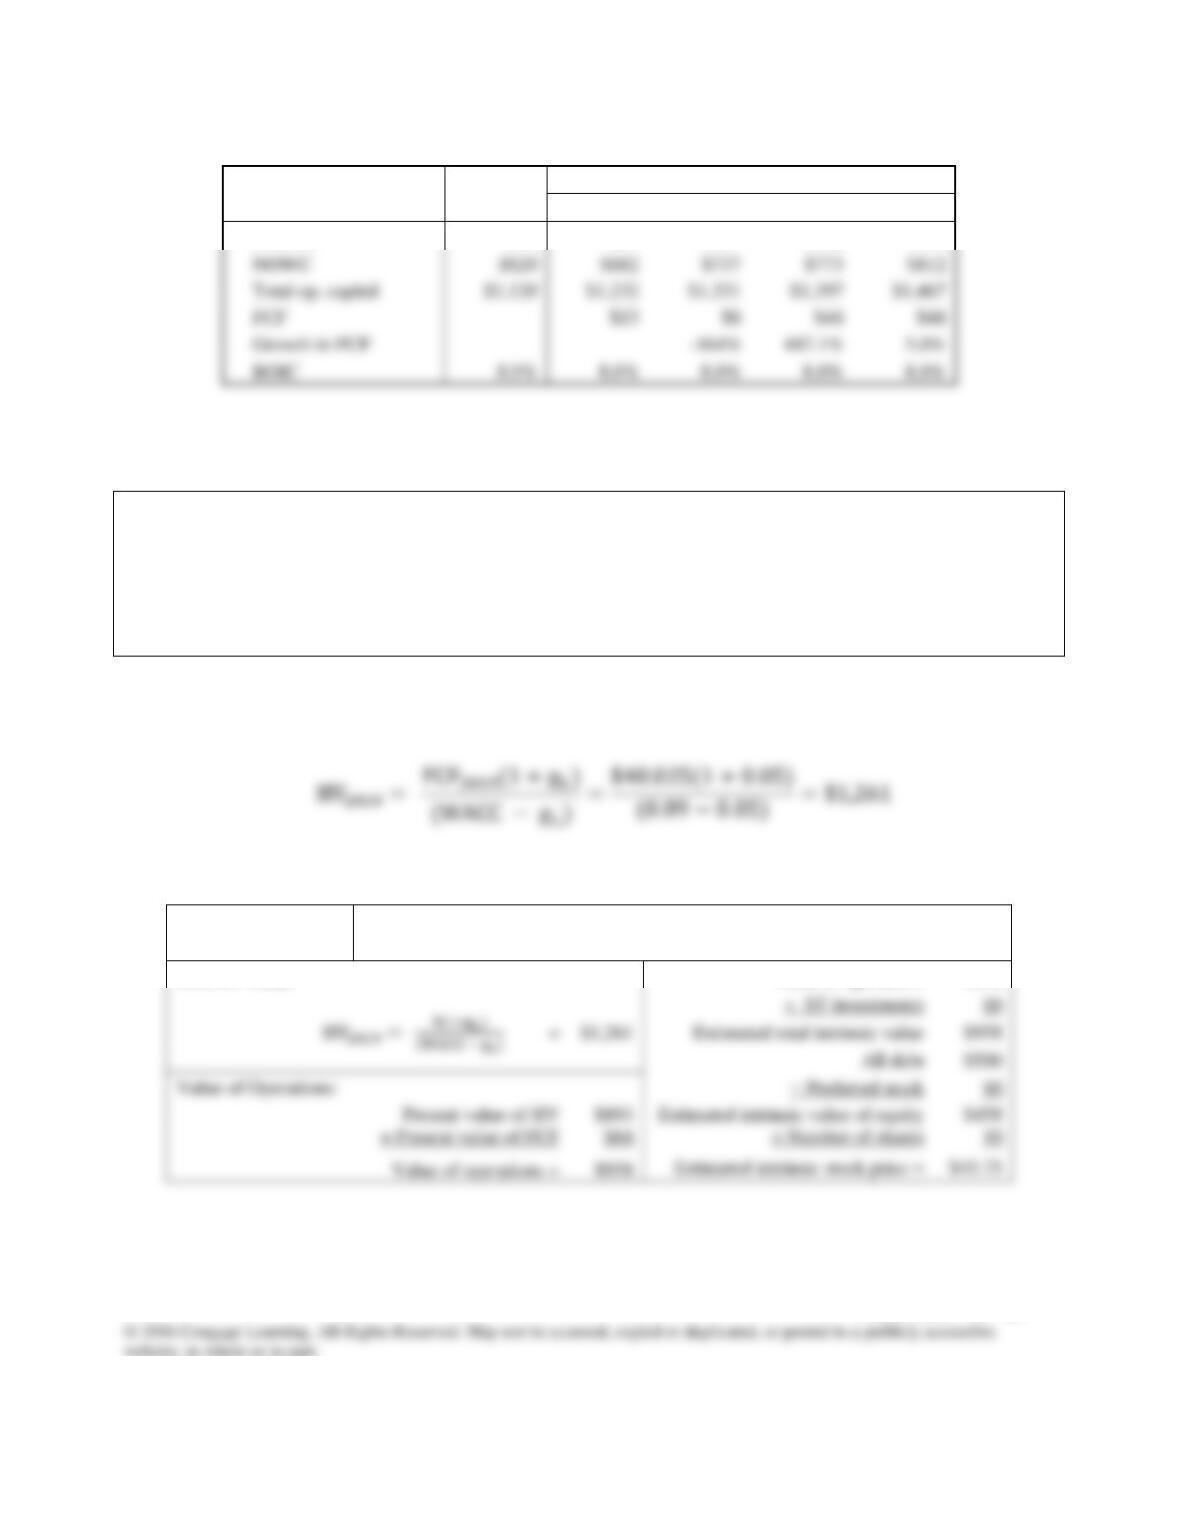
e. 2. Using the previously forecasted items, calculate for each of the next four years the
net operating profit after taxes (NOPAT), net operating working capital, total
operating capital, free cash flow, (FCF), annual growth rate in FCF, and return on
invested capital. What does the forecasted free cash flow in the first year imply
about the need for external financing? Compare the forecasted ROIC compare
with the WACC. What does this imply about how well the company is performing?
NOPAT = EBIT(1–T)
Mini Case: 9 – 22
Scenario:
Actual
Forecast
No Change
2015
2016
2017
2018
2019
NOPAT
$90
$99
$107
$112
$118
e. 3. Assume that FCF will continue to grow at the growth rate for the last year in the
forecast horizon (Hint: 5%). What is the horizon value at 2019? What is the present
value of the horizon value? What is the present value of the forecasted FCF? (Hint:
use the free cash flows for 2016 through 2019). What is the current value of
operations? Using information from the 2015 financial statements, what is the
current estimated intrinsic stock price?
With no rounding in intermediate steps, FCF2019 = $48.025.
Scenario:
No Change
Horizon Value:
Value of operations
$958
$958
$500
Value of Operations:
$458
Mini Case: 9 – 23
NOWC
$682
$737
$773
$812
$46
$48
The estimated intrinsic stock value of $45.75 is less than the actual market price of
f. Continue with the same assumptions for the No Change scenario from the previous
question, but now forecast the balance sheet and income statements for 2016 (but
not for the following three years) using the following preliminary financial policy.
(1) Regular dividends will grow by 10%. (2) No additional long-term debt or
common stock will be issued. (3) The interest rate on all debt is 8%. (4) Interest
expense for long–term debt is based on the average balance during the year. (5) If
the operating results and the preliminary financing plan cause a financing deficit,
eliminate the deficit by drawing on a line of credit. The line of credit would be
tapped on the last day of the year, so it would create no additional interest expenses
for that year. (6) If there is a financing surplus, eliminate it by paying a special
dividend. After forecasting the 2016 financial statements, answer the following
questions.
f. 1. How much will Hatfield need to draw on the line of credit?
Answer: Forecast sales and then items on the balance sheet. The forecast of sales is $2,200.
Mini Case: 9 – 24
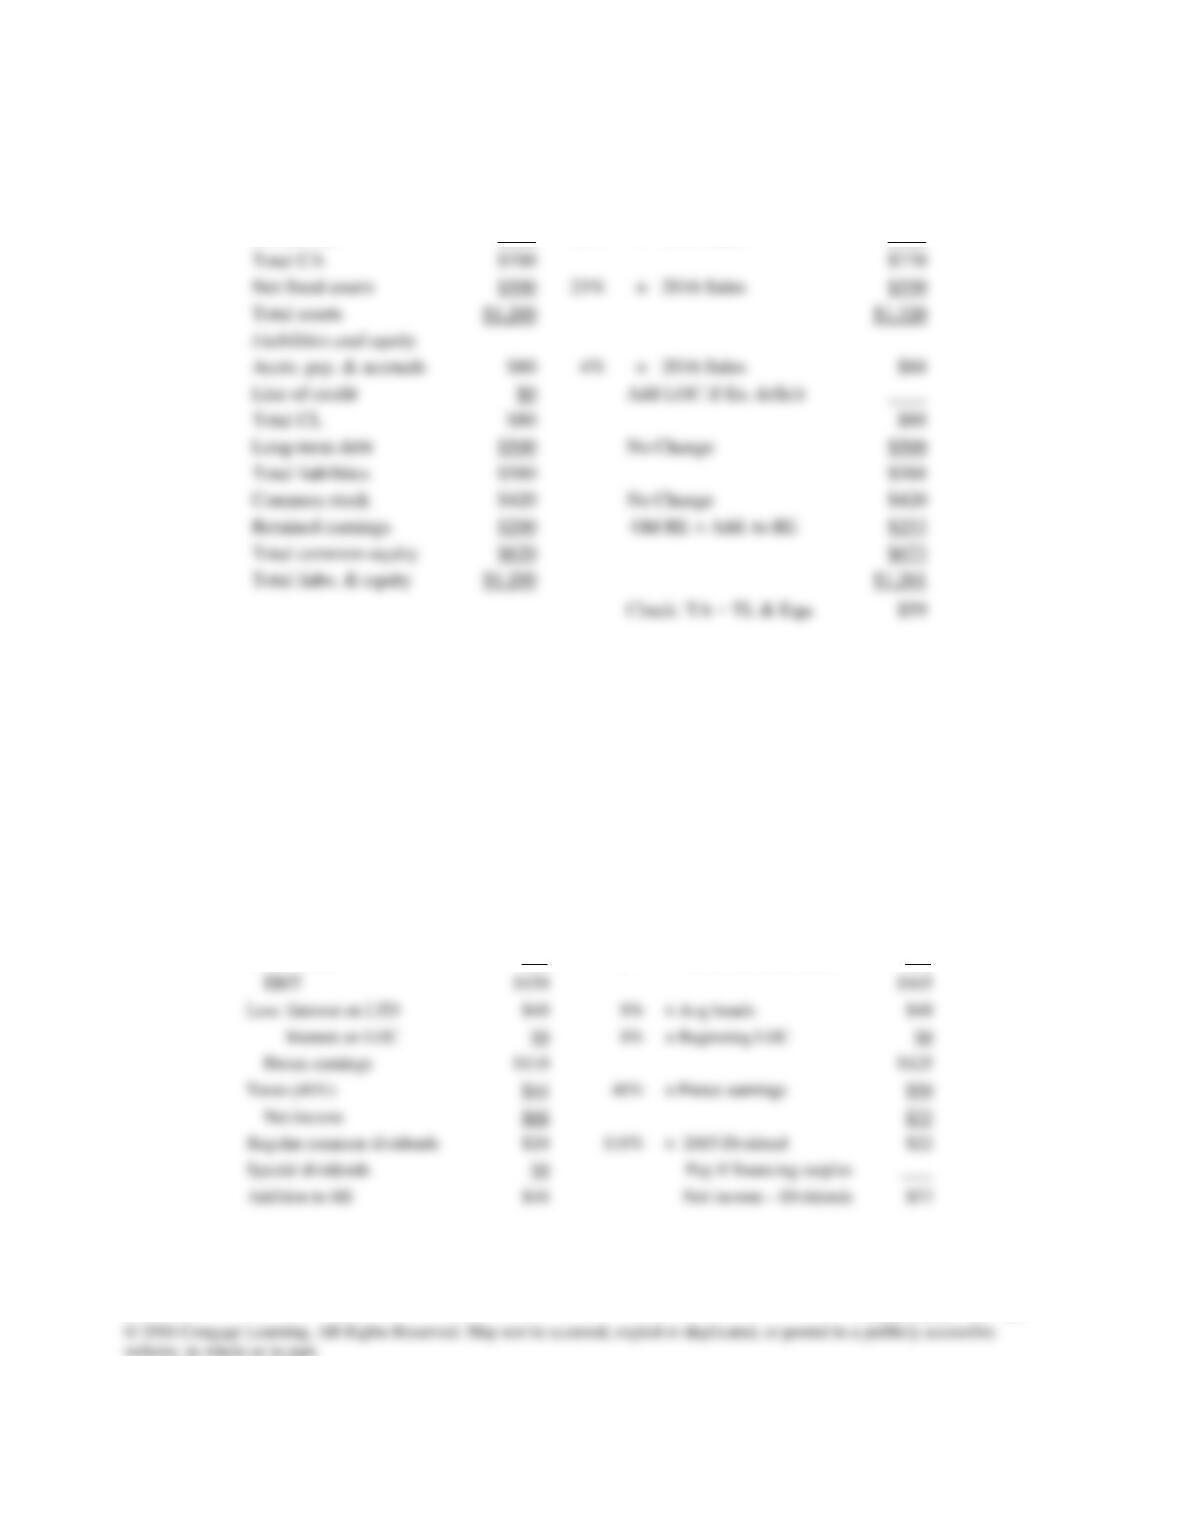
Assets
2015
Input
Basis for 2016 Forecast
2016
Cash
$20
1%
× 2016 Sales
$22
Accts. rec.
$280
14%
× 2016 Sales
$308
Inventories
$400
20%
× 2016 Sales
$440
Forecast the items on the income statement. Costs are a percent of sales, depreciation is a
percent of Net PP&E. Forecast interest expense on the long-term debt as the product of
the interest rate and the average balance on the long–term debt (i.e., the average of the
beginning value and the ending value). Pay a regular dividend. Leave the special
dividend blank for now.
2015
Input
Basis for 2016 Forecast
2016
Sales
$2,000
110%
× 2015 Sales
$2,20
0
Op. costs (excl. depr.)
$1,800
90%
× 2016 Sales
$1,98
0
Depreciation
$50
10%
× 2016 Net fixed assets
$55
$40
× Avg bonds
$40
× Beginning LOC
Taxes (40%)
$44
40%
× Pretax earnings
$50
$66
$75
Regular common dividends
$20
110%
× 2015 Dividend
$22
Special dividends
$46
$53
Mini Case: 9 – 25
$700
$770
Net fixed assets
$500
25%
× 2016 Sales
$550
Accts. pay. & accruals
$80
4%
× 2016 Sales
$88
Line of credit
$80
$88
$500
$500
$580
$588
$420
$420
$200
$253
$620
$673
$59
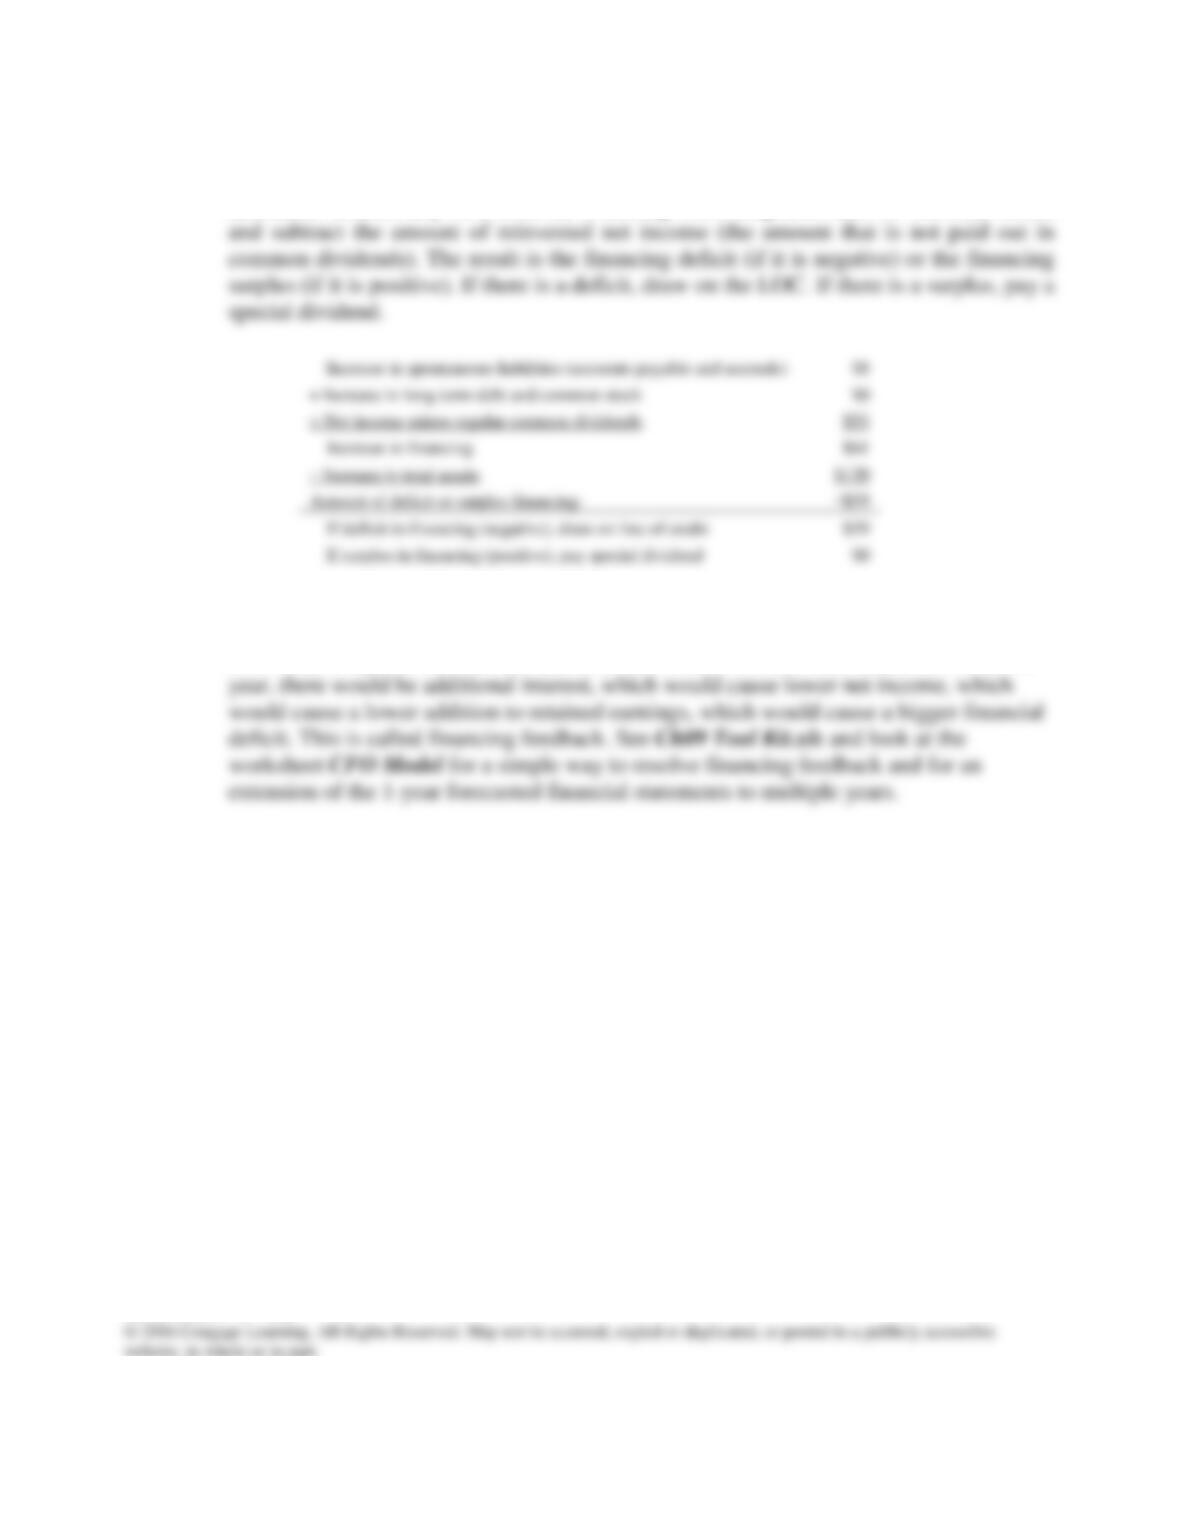
The next step is to identify the financing surplus or deficit. Start with the additions to
operating assets, subtract the increase in spontaneous liabilities (accounts payable and
accruals), subtract any new external financing from long–term debt or common stock,
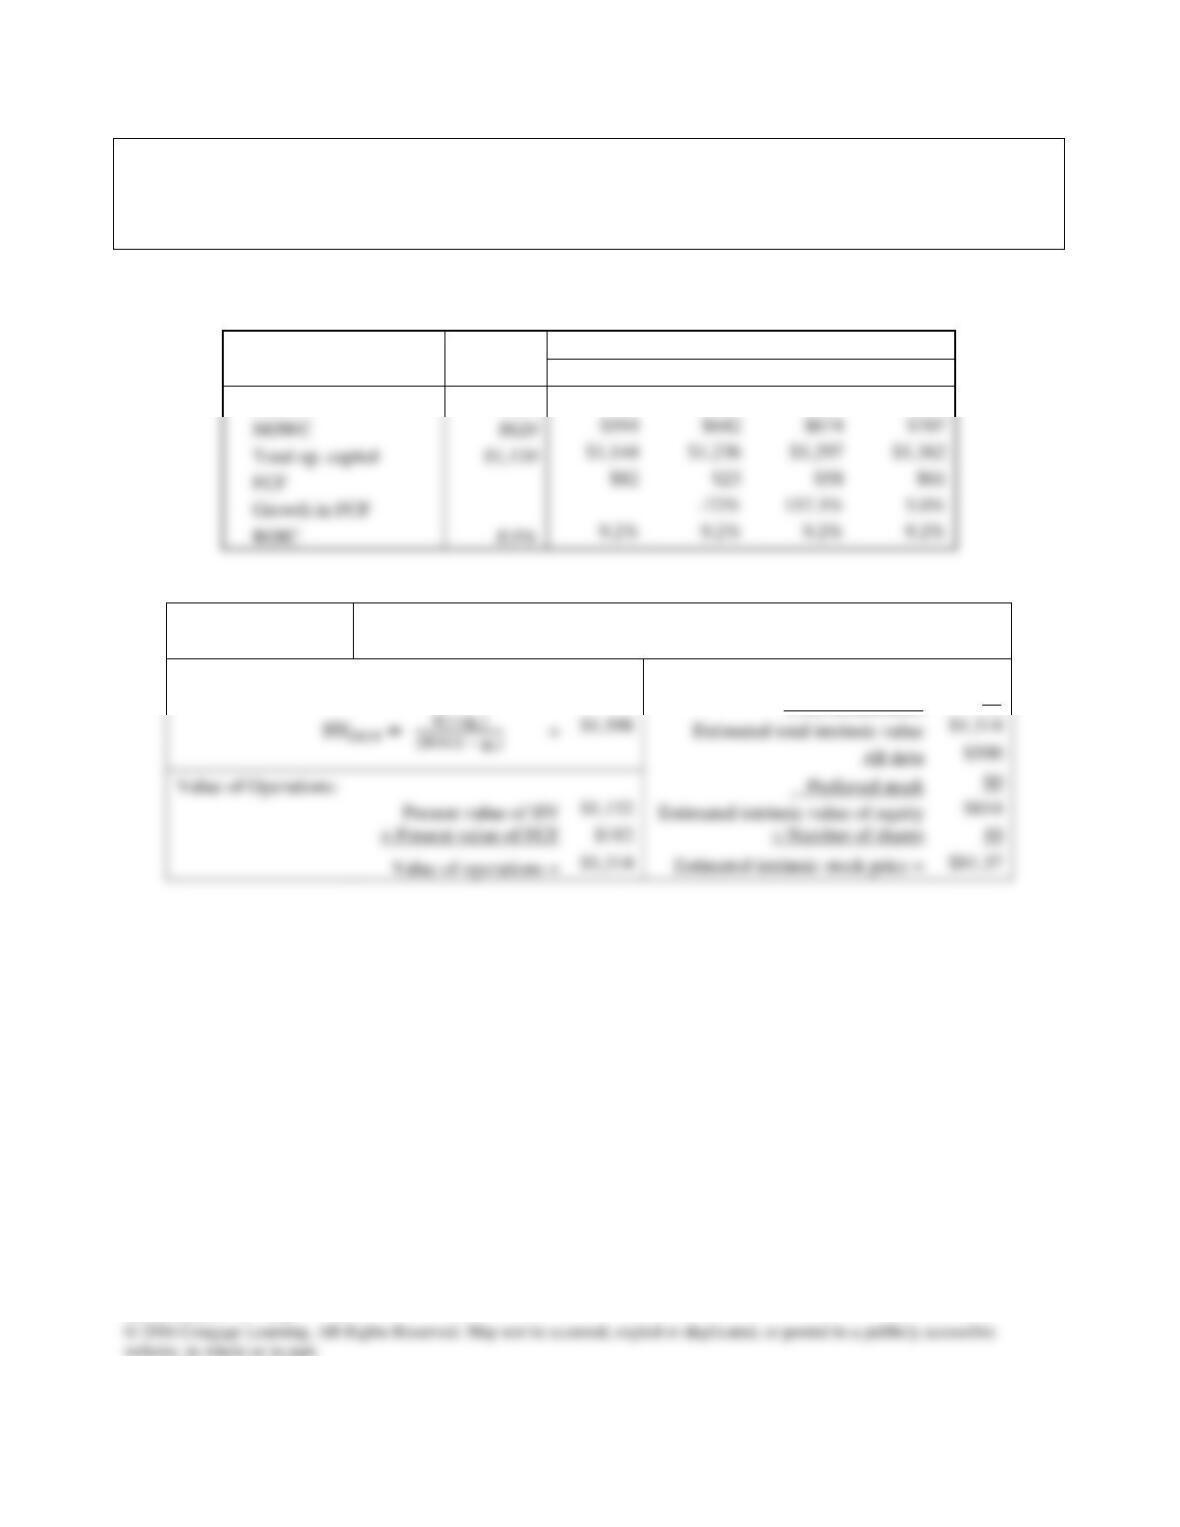
There is a deficit of $59, so update the balance sheets by adding $59 to the line of credit.
Because the LOC is added at the end of the year, there is no additional interest, so there
is no need to update the income statement. If the LOC were instead added earlier in the
Mini Case: 9 – 26
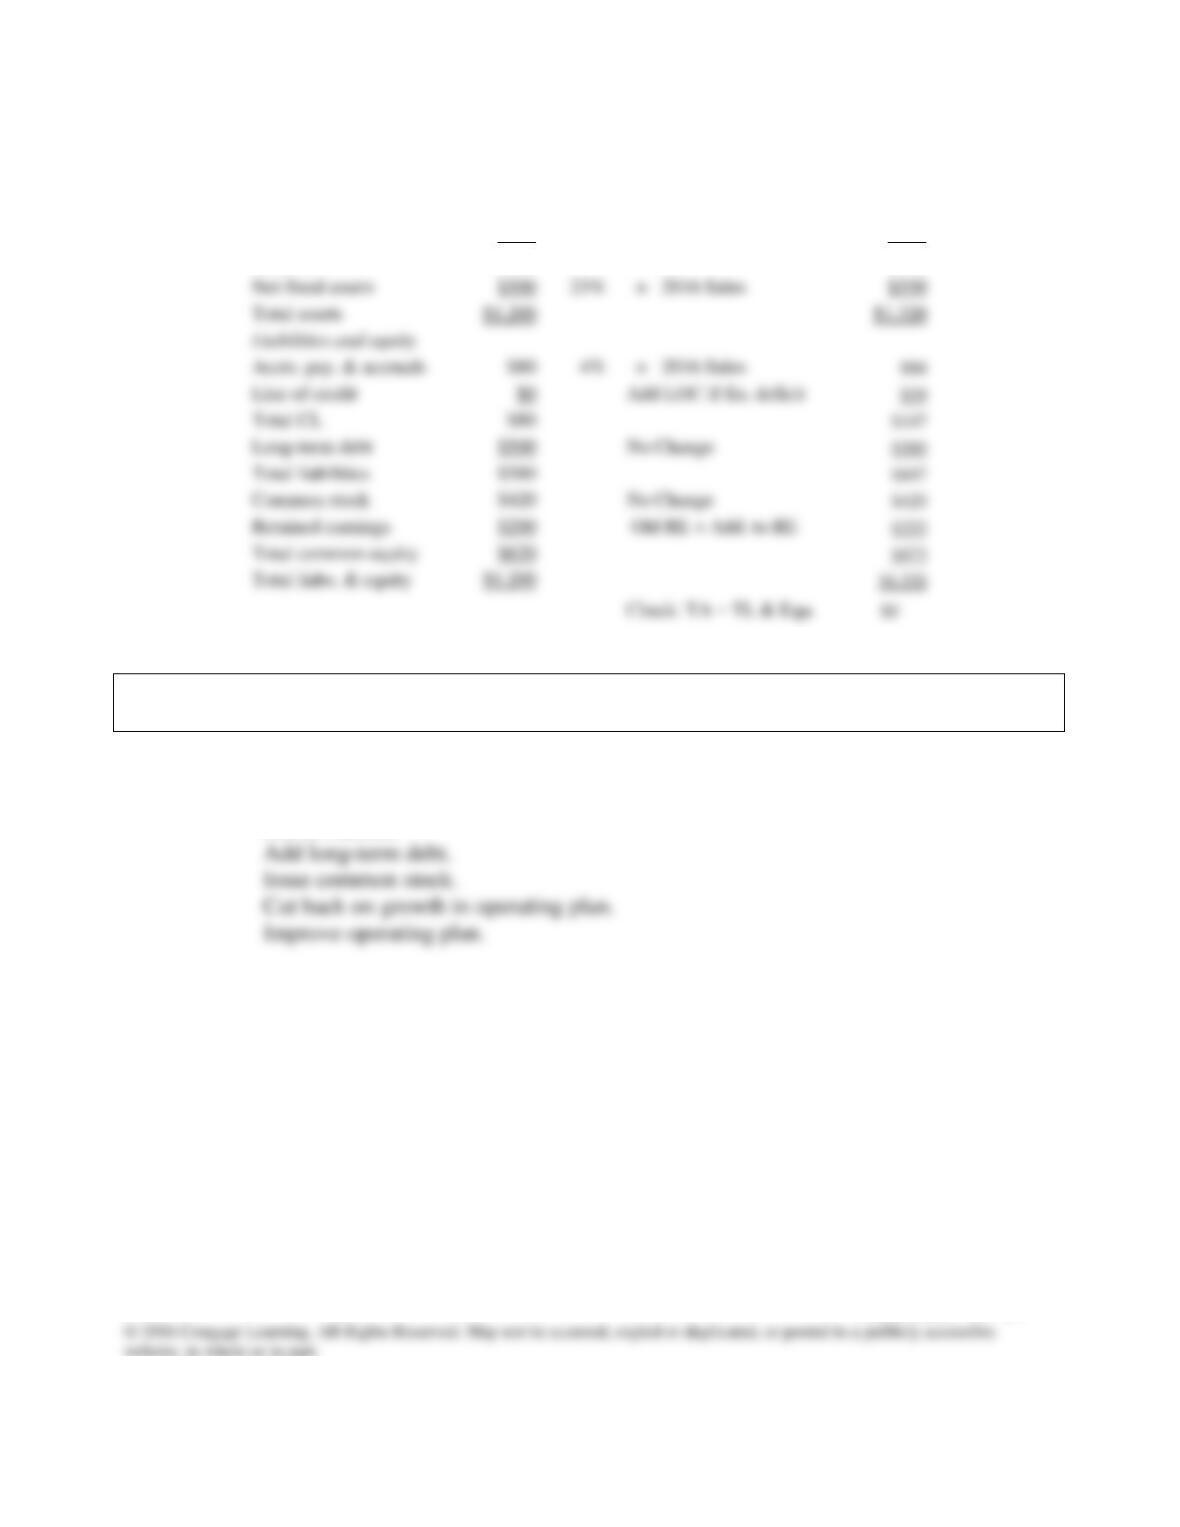
Assets
2015
Input
Basis for 2016 Forecast
2016
Cash
$20
1%
× 2016 Sales
$22
Accts. rec.
$280
14%
× 2016 Sales
$308
Inventories
$400
20%
× 2016 Sales
$440
Total CA
$700
$770
f. 2. What are some alternative ways than those in the preliminary financial policy that
Hatfield might choose to eliminate the financing deficit?
Answer: Here are some alternative ways to eliminate the deficit:
Cut dividends.
Mini Case: 9 – 27
Net fixed assets
$500
25%
× 2016 Sales
$550
Total assets
Accts. pay. & accruals
$80
4%
× 2016 Sales
Line of credit
Total CL
$80
$500
Total liabilities
$580
$420
Retained earnings
$200
Total common equity
$620
Total liabs. & equity
g. Repeat the analysis performed the previous question but now assume that Hatfield
is able to improve the following inputs: (1) reduce operating costs (excluding
depreciation)/sales to 89.5% at a cost of $40 million; and (2) reduce
inventories/sales to 16% at a cost of $10 million. This is the Improve scenario.
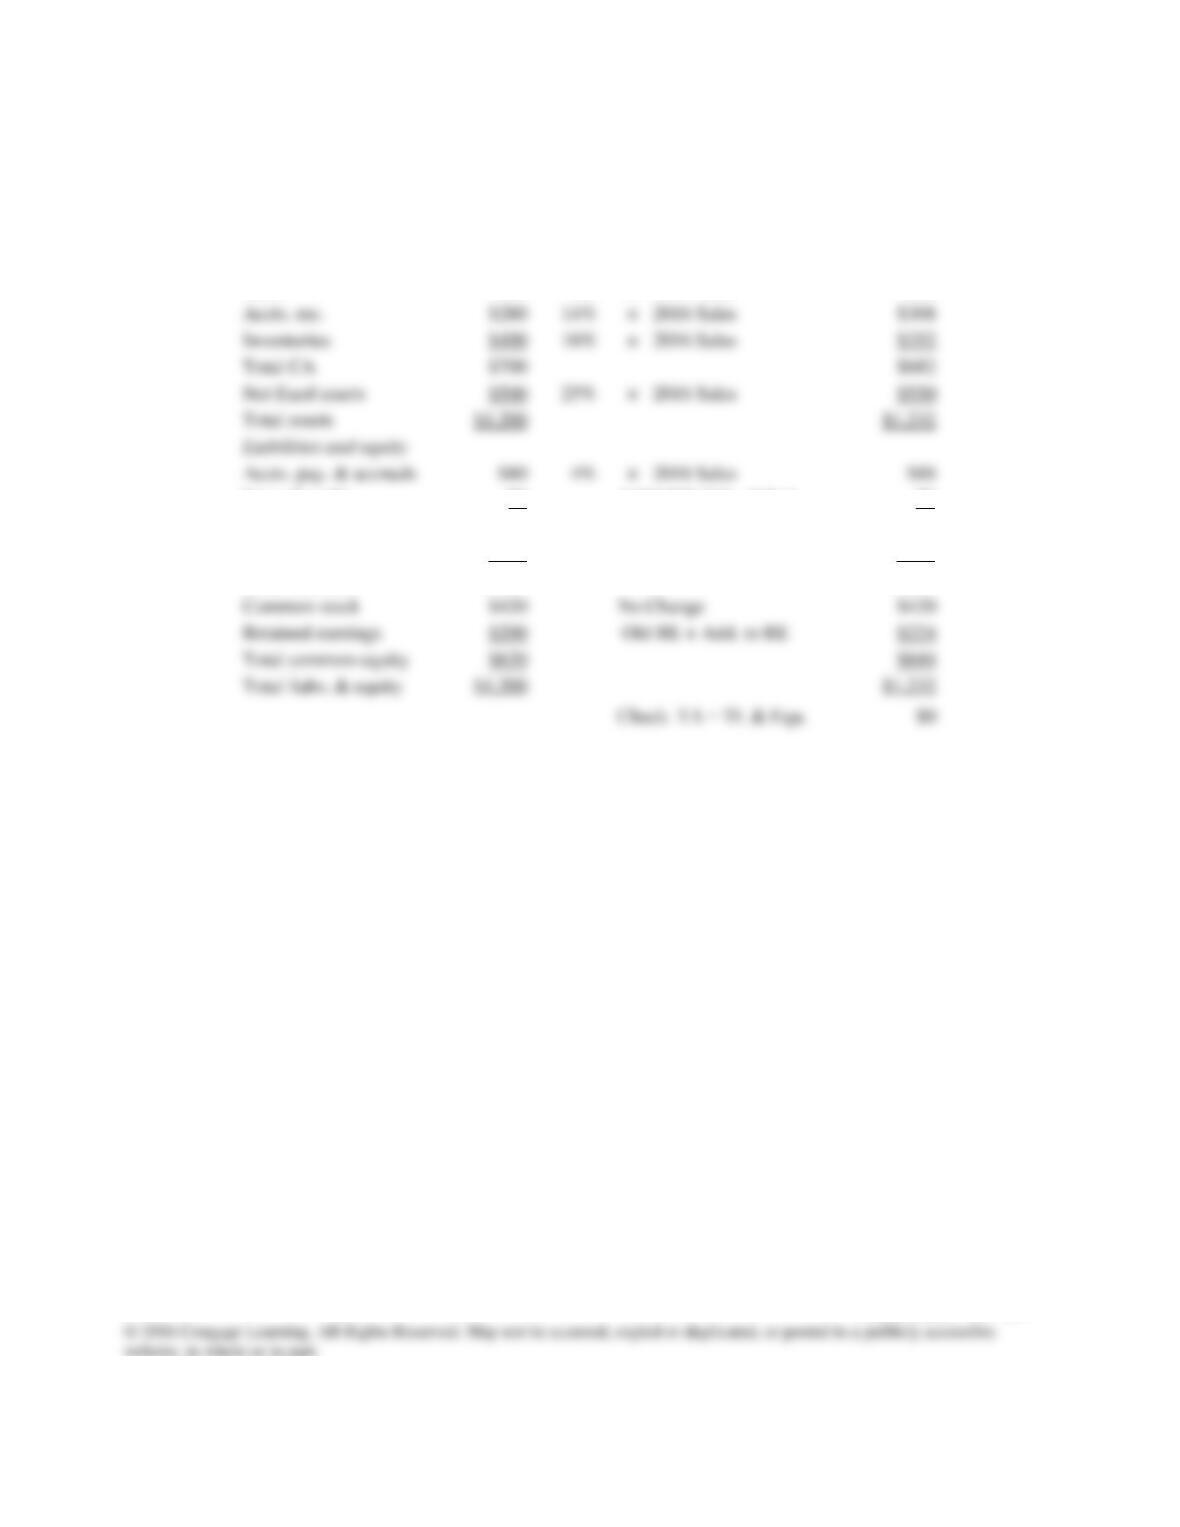
Answer: The impact on the operating plan is shown below:
Scenario:
Actual
Forecast
Improve
2015
2016
2017
2018
2019
NOPAT
$90
$106
$114
$120
$126
Scenario:
Improve
Horizon Value:
Value of operations
$1,314
+ ST investments
$0
10
Mini Case: 9 – 28
NOWC
$594
$642
$674
$707
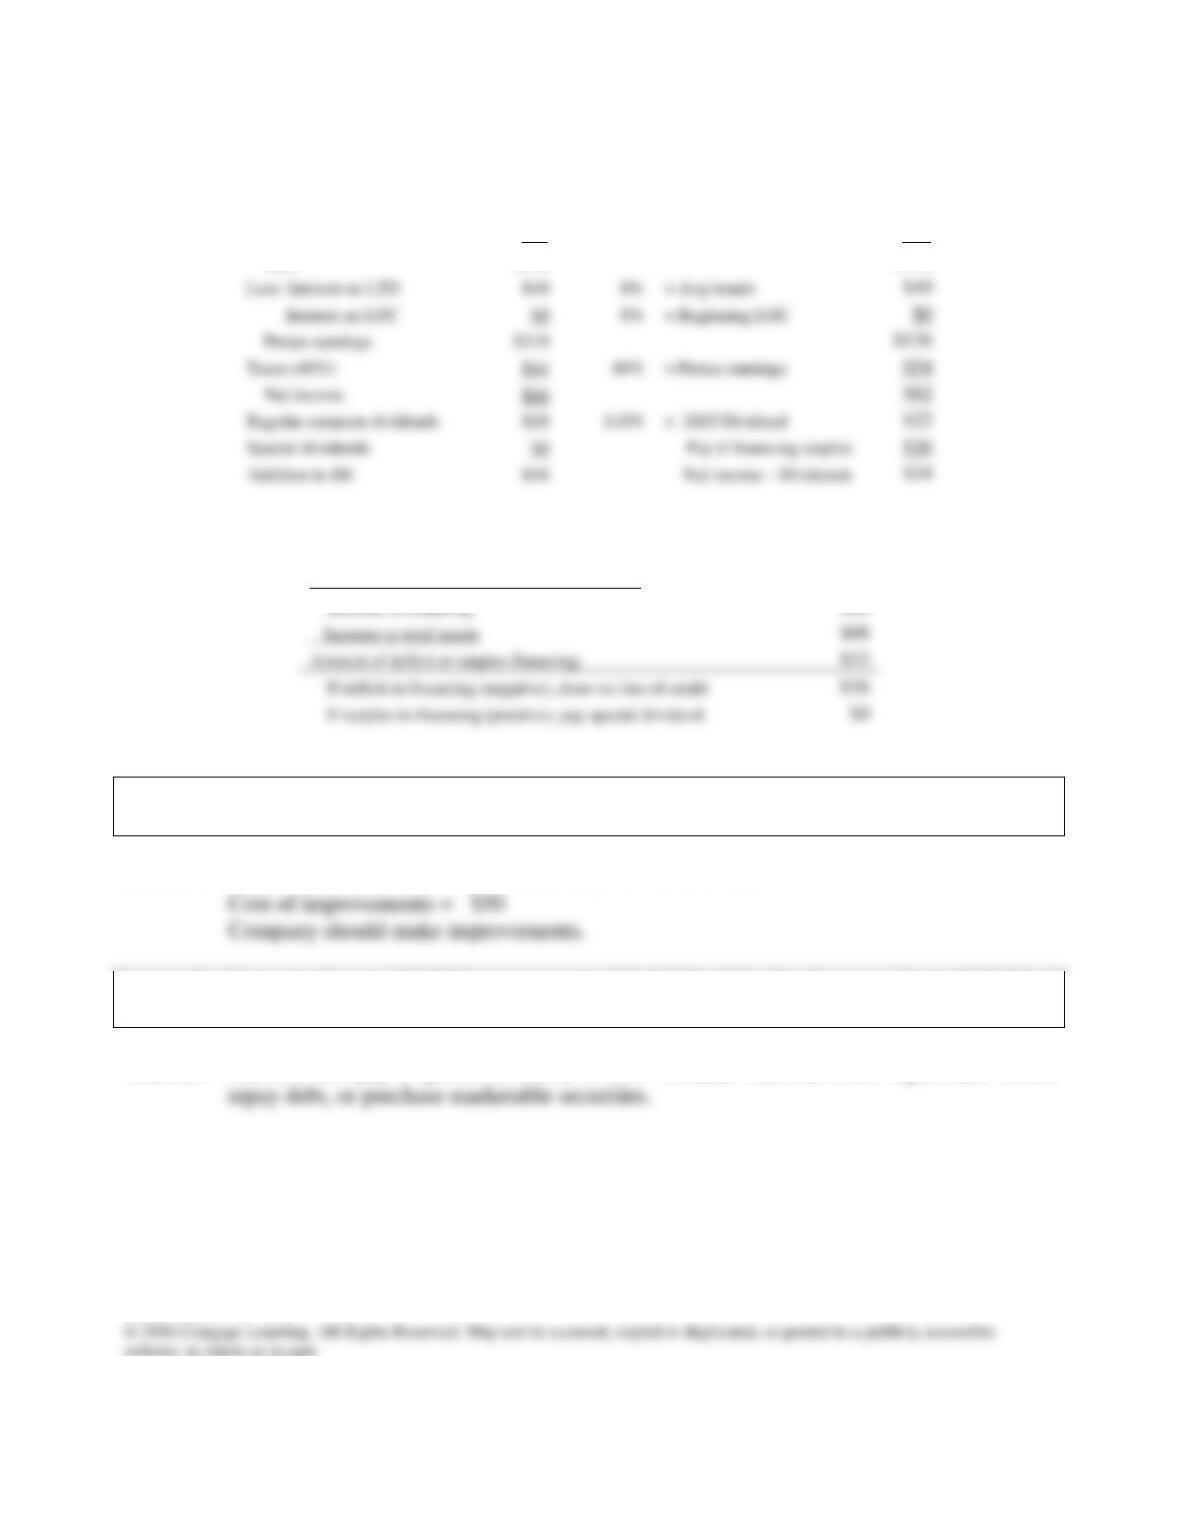
The impact on the financial statements is shown below.
Scenario:
Improve
Assets
2015
Input
Basis for 2016 Forecast
2016
Cash
$20
1%
× 2016 Sales
$22
Line of credit
$0
Add LOC if fin. deficit
$0
Total CL
$80
$88
Long–term debt
$500
No Change
$500
Total liabilities
$580
$588
$420
No Change
$420
Retained earnings
$200
$224
Total common equity
$620
$644
Total liabs. & equity
$0
Mini Case: 9 – 29
Accts. rec.
$280
× 2016 Sales
$308
$400
× 2016 Sales
$352
Total CA
$700
$682
Net fixed assets
$500
× 2016 Sales
$550
Total assets
Accts. pay. & accruals
$80
4%
× 2016 Sales
$88
Improve
2015
Input
Basis for 2016 Forecast
2016
Sales
$2,000
110%
× 2015 Sales
$2,200
Op. costs (excl. depr.)
$1,800
89.5%
× 2016 Sales
$1,969
Depreciation
$50
10%
× 2016 Net fixed assets
$55
EBIT
$150
$176
Increase in spontaneous liabilities (accounts payable and accruals)
$8
+ Increase in long–term debt and common stock
$8
+ Net income minus regular common dividends
$0
Increase in financing
Amount of deficit or surplus financing:
$0
g. 1. Should Hatfield implement the plans? How much value would they add to the
company?
Answer: Improvement in value of operations: $1,314 − $958 = $356
g. 2. How much can Hatfield pay as a special dividend in the Improve Scenario? What
else might Hatfield do with the financing surplus?
Answer: Hatfield can pay a special dividend of $35. Instead, Hatfield could repurchase stock,
Mini Case: 9 – 30
$40
× Avg bonds
$40
× Beginning LOC
Pretax earnings
$110
$136
Taxes (40%)
$44
40%
× Pretax earnings
$54
Net income
$66
$82
$20
110%
× 2015 Dividend
$22
Special dividends
$36
$46
Net income – Dividends
$24