C09
Chapter 9 Spreadsheet Problem Solutions (C09)
1. There are a number of instructions with which you should be familiar
to use these computerized models. These instructions appear in a
2. The IRR formula requires that an initial “guess” value be entered.
We have chosen 10 percent which works in most cases and does give
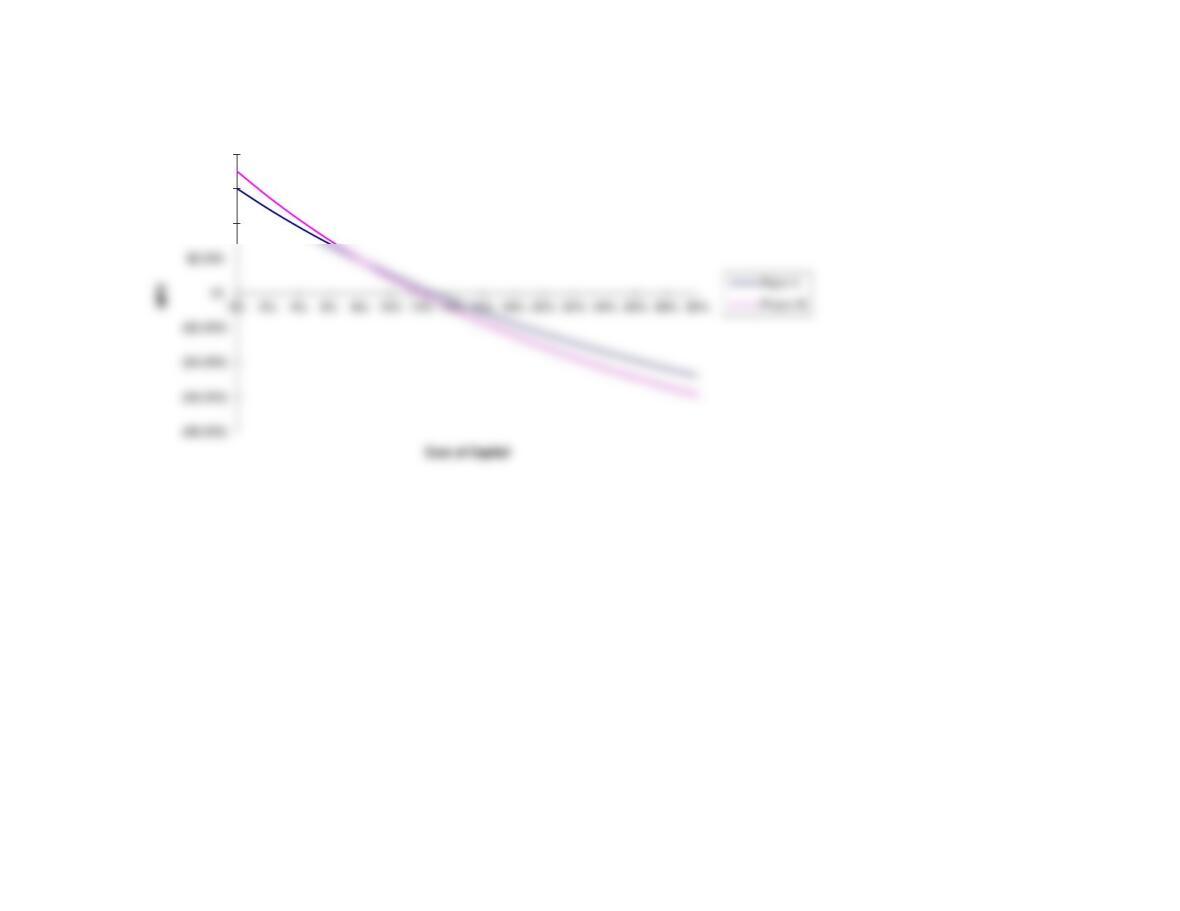
3. A graph of the NPV profiles for each project can be displayed
if you click the worksheet labeled GRAPH at the bottom of this
spreadsheet. To return to this worksheet, click on the worksheet
labeled C09 at the bottom of the GRAPH worksheet.
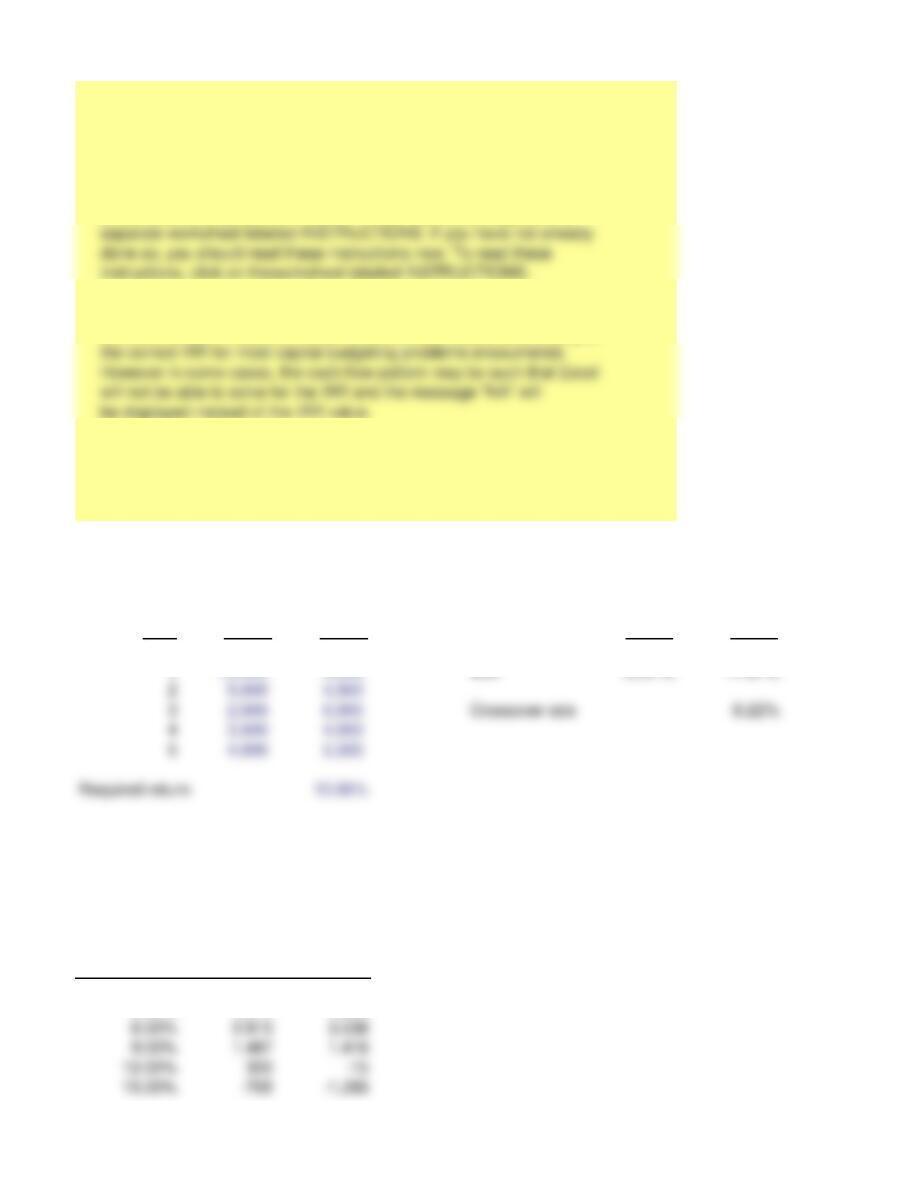
INPUT DATA: KEY OUTPUT:
Year Proj. A Proj. B Proj. A Proj. B
0(20,000) (18,000) NPV 1,077 919
MODEL-GENERATED DATA:
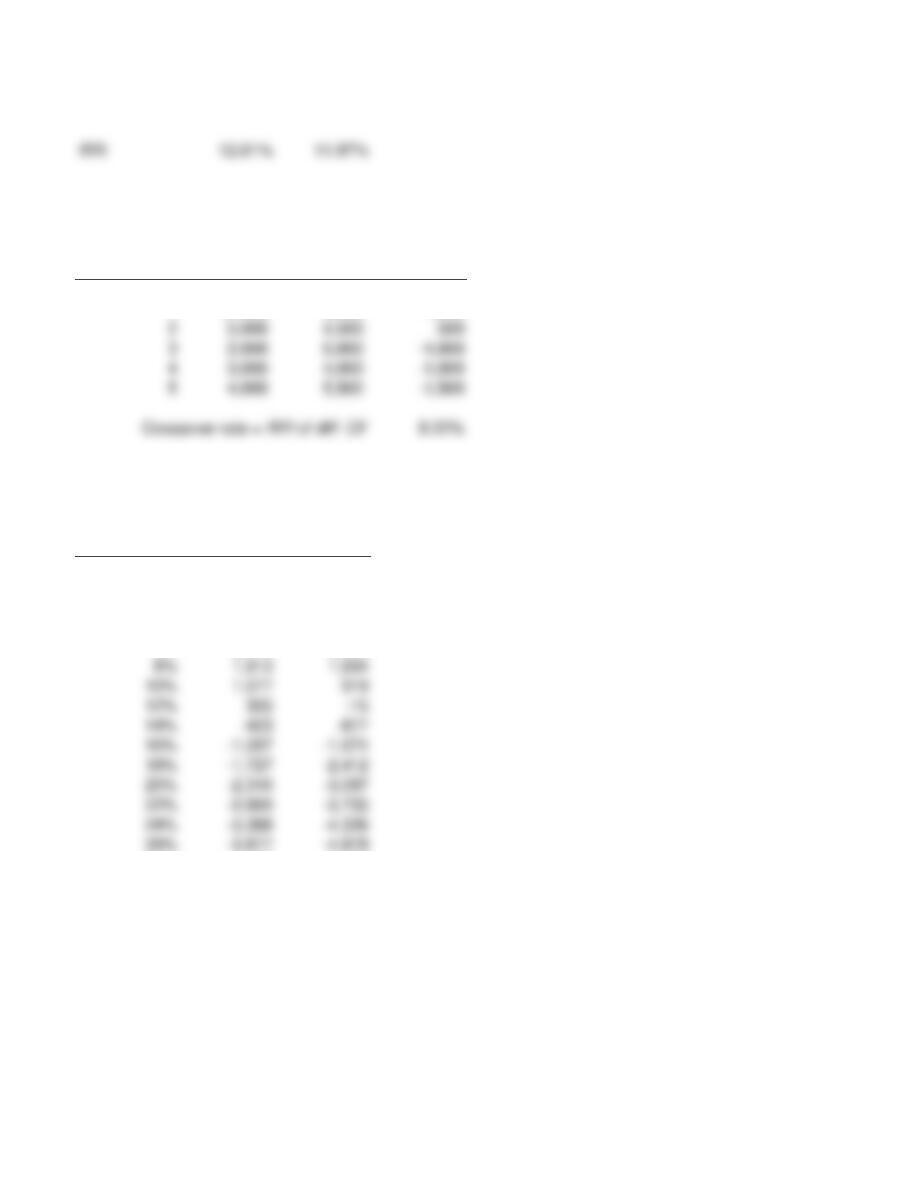
NPV profile:
Proj. A Proj. B
r NPV NPV
0.00% 6,000 7,000
3.00% 4,310 4,885
NPV and IRR Analysis
Expected Cash Flows
Page 1
C09
17.00% -1,417 -2,050
20.00% -2,316 -3,097
Crossover rate calculation:
Difference
Year Proj. A Proj. B in CFs
0(20,000) (18,000) -2,000
112,000 5,000 7,000
Data for NPV profile graph:
Required Proj. A Proj. B
Return NPV NPV
10.00% 1076.67757 919.472714
0% 6,000 7,000
2% 4,850 5,558
4% 3,791 4,242
6% 2,815 3,038
28% -4,338 -5,395
30% -4,773 -5,878
Expected Cash Flows
Page 2
GRAPH
$4,000
$6,000
$8,000
Page 3

We have already entered the base case data for each model in this
1. The input data are entered in specified cells in the INPUT DATA
section. When you change an input item, the model automatically
2. The key output data are displayed to the right of the INPUT DATA
3. Input data items that you can change are distinguished from the
ones you should not change. The items that you can change generally
appear in color (blue) whereas the other items are printed in black.
4. All percentages must be entered as decimals. Dollars and other
numbers must be entered without dollar signs or commas.
5. Instructions and comments concerning specific models accompany
GENERAL INSTRUCTIONS FOR COMPUTERIZED PROBLEM SOLUTIONS