Chapter 9 CFIN6
Chapter 9 Solutions
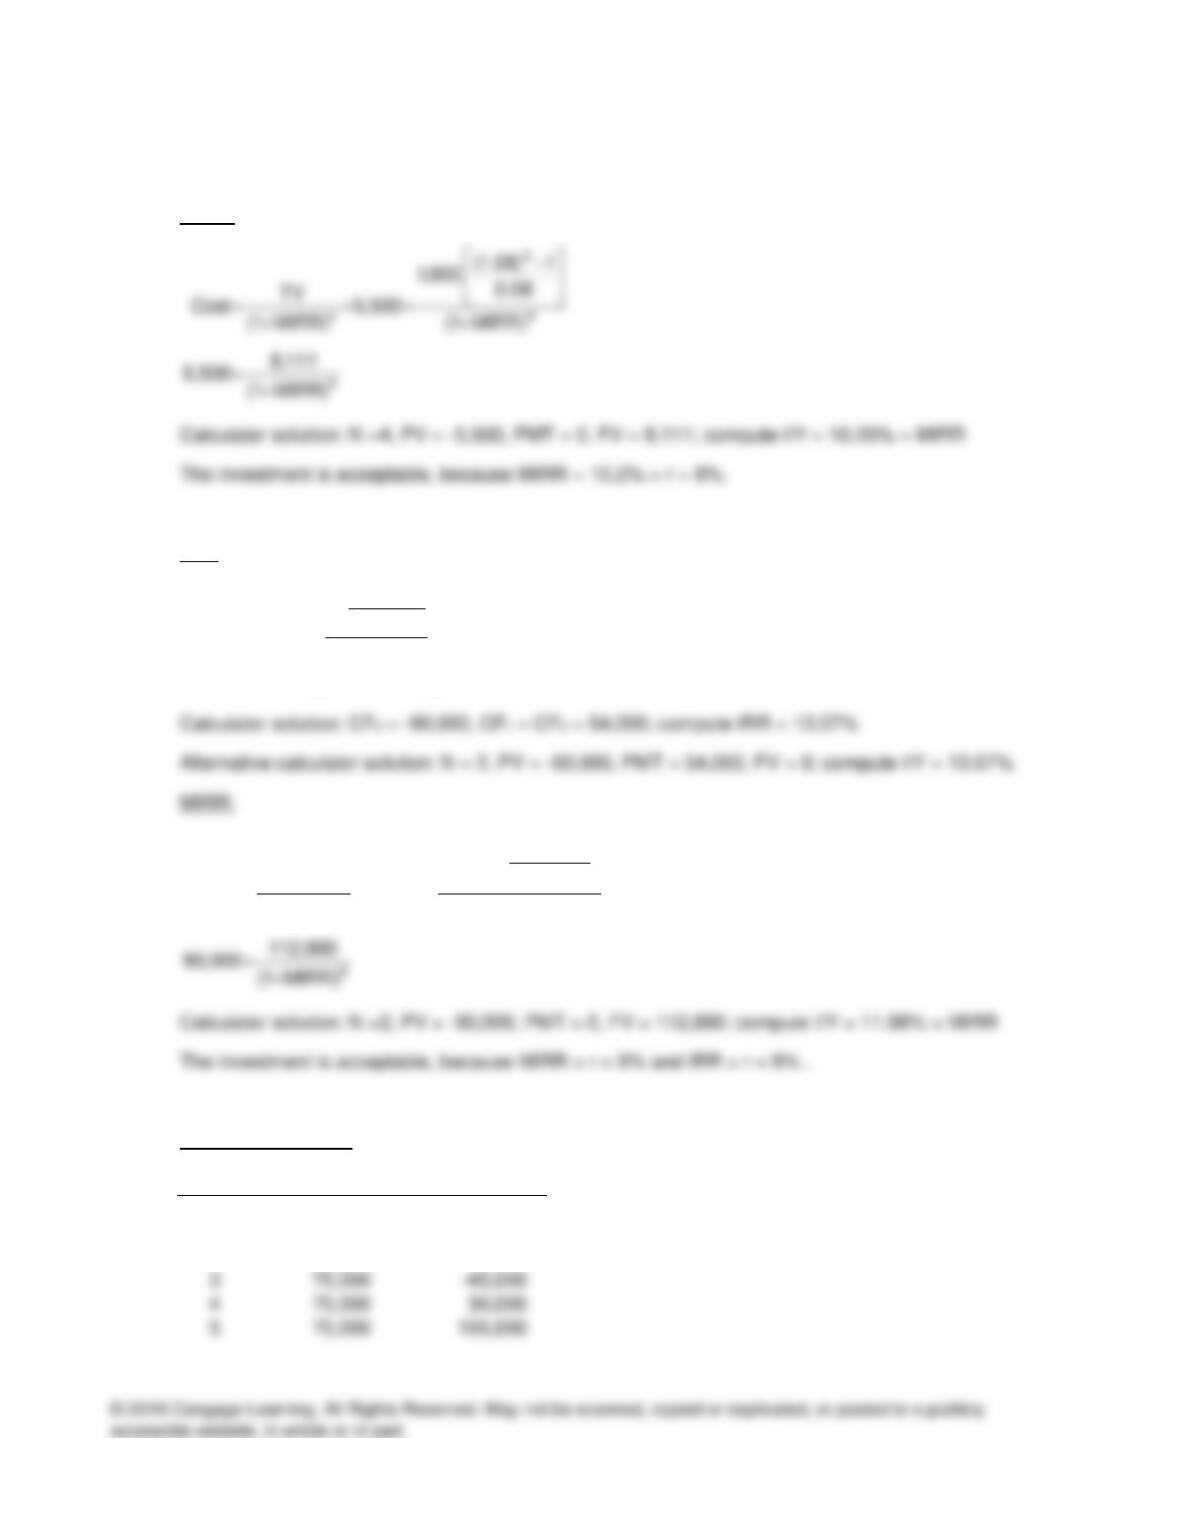
9-1
6
1
1(1.10)
Value PV of CFs 36,950 36,950(4.355261) 160,926.88
0.10
−
= = = =
9-2 a.
4
1
1(1.16)
Value PV of CFs 104,000 104,400(2.798181) 292,130.06
0.16
−
= = = =
c. From our discussion of TVM in Chapter 4, we know that the present value of future amounts
represents the amount that must be invested today at the opportunity cost rate (required rate of
return) to generate the particular future cash flows. As a result, when the interest rate is lower—
that is, 12 percent versus 16 percent—we should expect the present value to be higher because
the opportunity to earn interest is lower. Stated differently, Zebra Fashions must invest $292,130
to generate $104,400 annually for the next four years because it can earn 16 percent interest per
year. On the other hand, because it can only earn 12 percent interest per year, Leopard Fashions
must invest $317,099 to generate the same future cash flows.
Chapter 9 CFIN6
9-4
5
1
1(1.09)
NPV 42,000 11,000 0.09
−
=− +
9-5
3
1
1(1 IRR)
20,070 8,500 IRR
−
+
=
9-6
6
1
1(1 IRR)
74,000 16,500 IRR
−
+
=
9-7 a.
4
1
1(1.14)
NPV 75,000 26,000 0.14
−
=− +
Chapter 9 CFIN6
9-8 a.
3
1
1(1.12)
NPV 34,000 14,150 0.12
−
=− +
=-34,000+14,150(2.401831) = -34,000 + 33,985.91 = –14.09
Calculator solution: CF0 = -34,000, CF1 – CF3 = 14,150, I = 12; compute NPV = –14.09
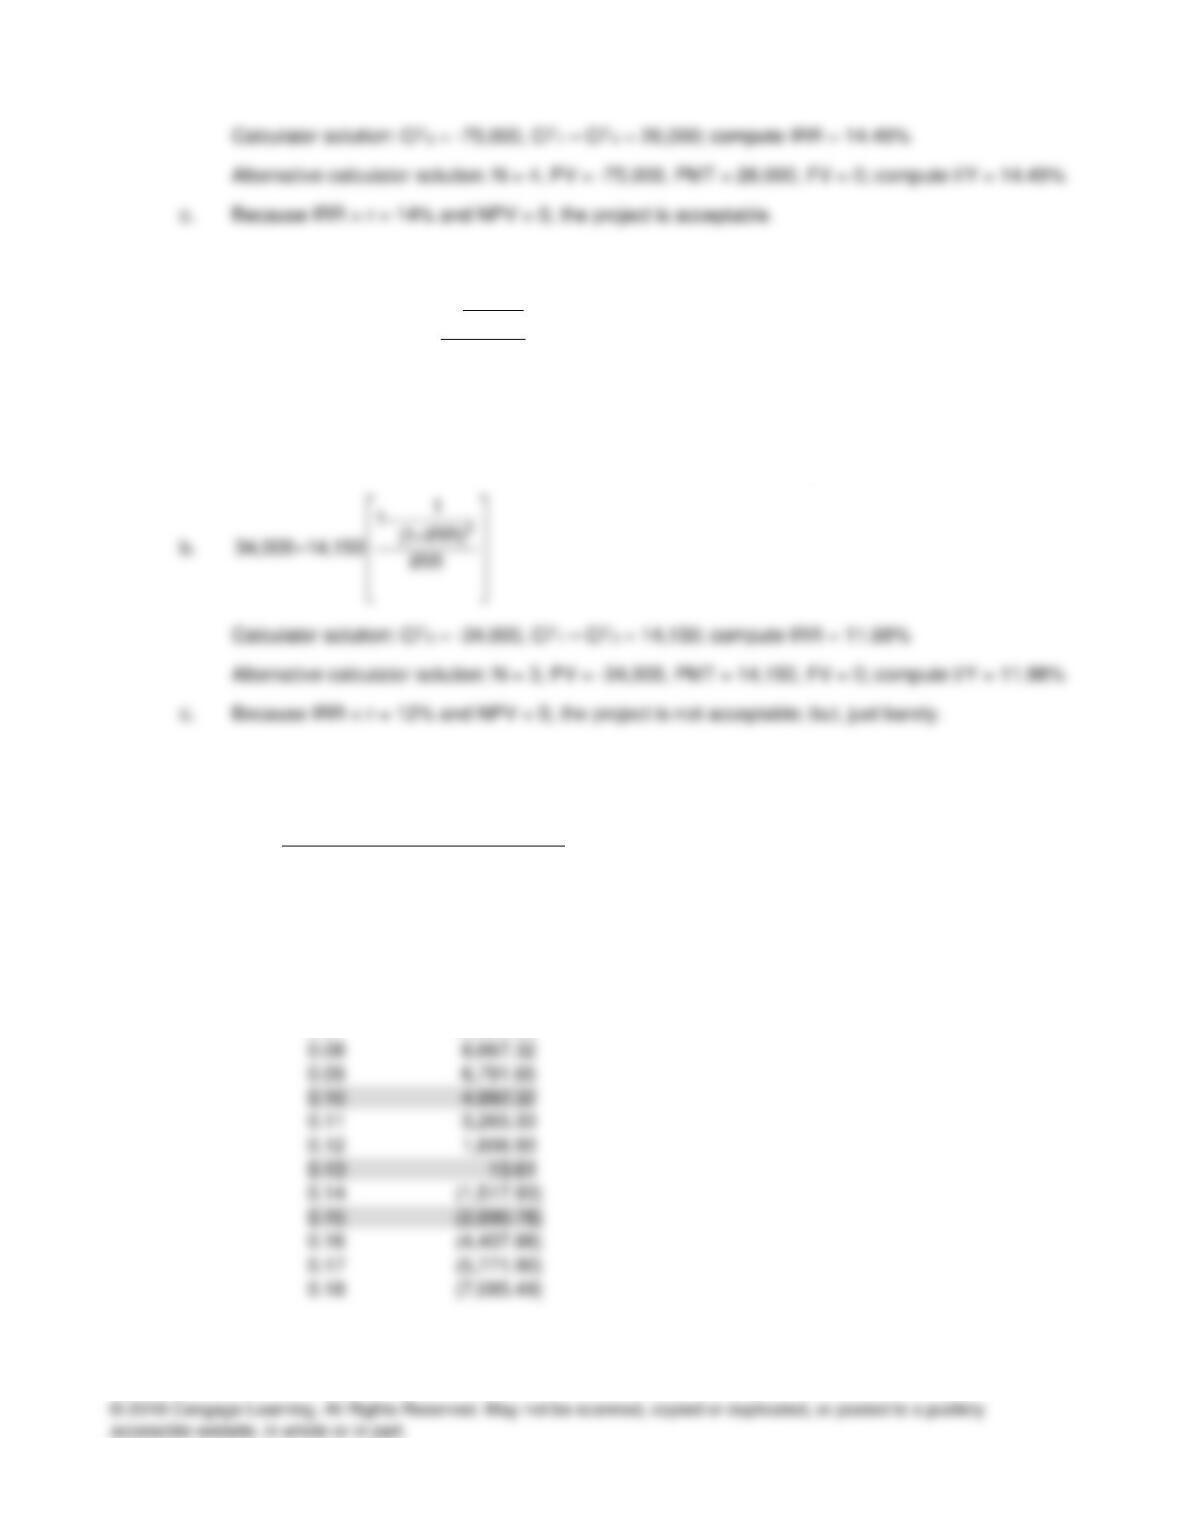
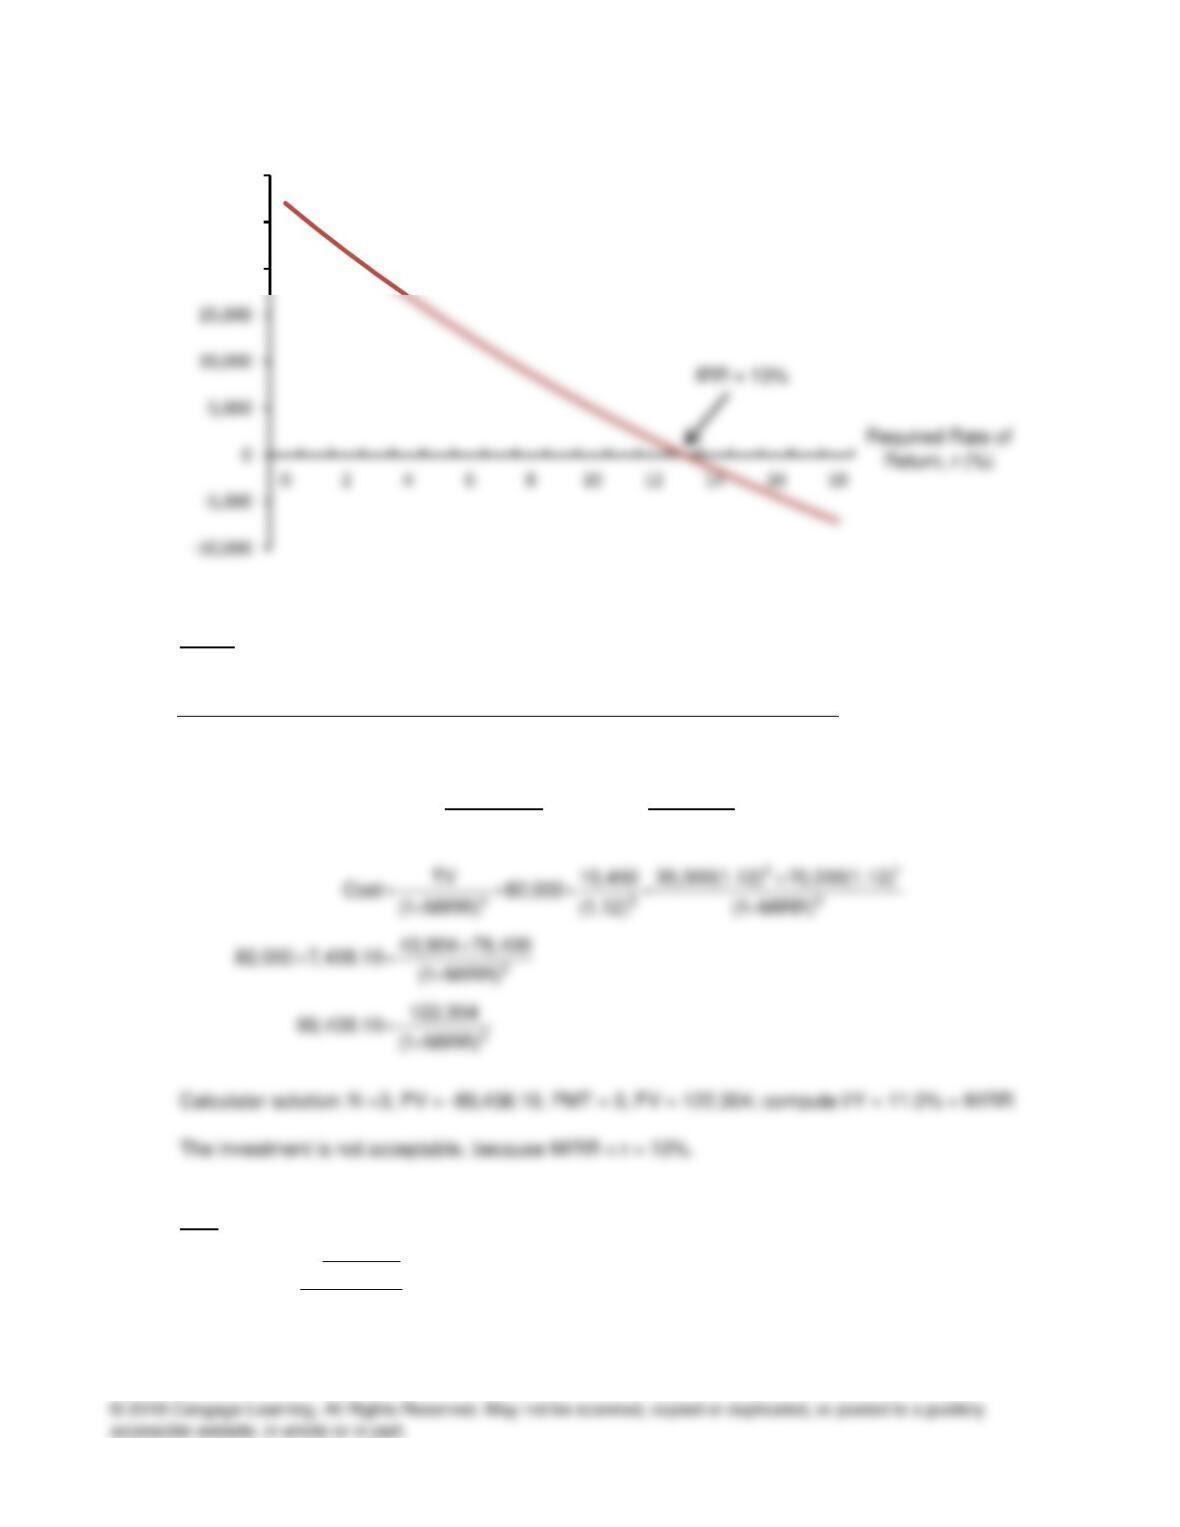
9-9 Data for NPV profile: Cost = 64,000, CF = 18,200 for five years
r NPV
0.00 $27,000.00
0.01 24,332.45
0.02 21,784.96
0.03 19,350.67
0.04 17,023.17
0.05 14,796.48
0.06 12,665.02
0.07 10,623.59
Chapter 9 CFIN6
9-10. MIRR:
PV of Cash FV in Year 3 of
Year CF Outflows @ 12% Cash Inflows @ 12%
0 (82,000) (82,000.00)
1 35,000 43,904.00
2 70,000 78,400.00
3 (10,450) ( 7,438.10)
(89,438.10) 122,304.00
9-11 IRR:
4
1
1(1 IRR)
5,500 1,800 IRR
−
+
=
NPV ($)
20,000
25,000
30,000
Chapter 9 CFIN6
Calculator solution: CF0 = -5,500, CF1 – CF4 = 1,800; compute IRR = 11.72%
Alternative calculator solution: N = 4, PV = -5,500, PMT = 1,800, FV = 0; compute I/Y = 11.72%
MIRR:
9-12 IRR:
2
1
1(1 IRR)
90,000 54,000 IRR
−
+
=
2
n2
(1.09) 1
54,000 0.09
TV
Cost 90,000
(1 MIRR) (1 MIRR)
−
= = =
++
9-13 Traditional payback:
Year CF CF
0 -270,000 -270,000
1 75,000 -195,000
2 75,000 -120,000
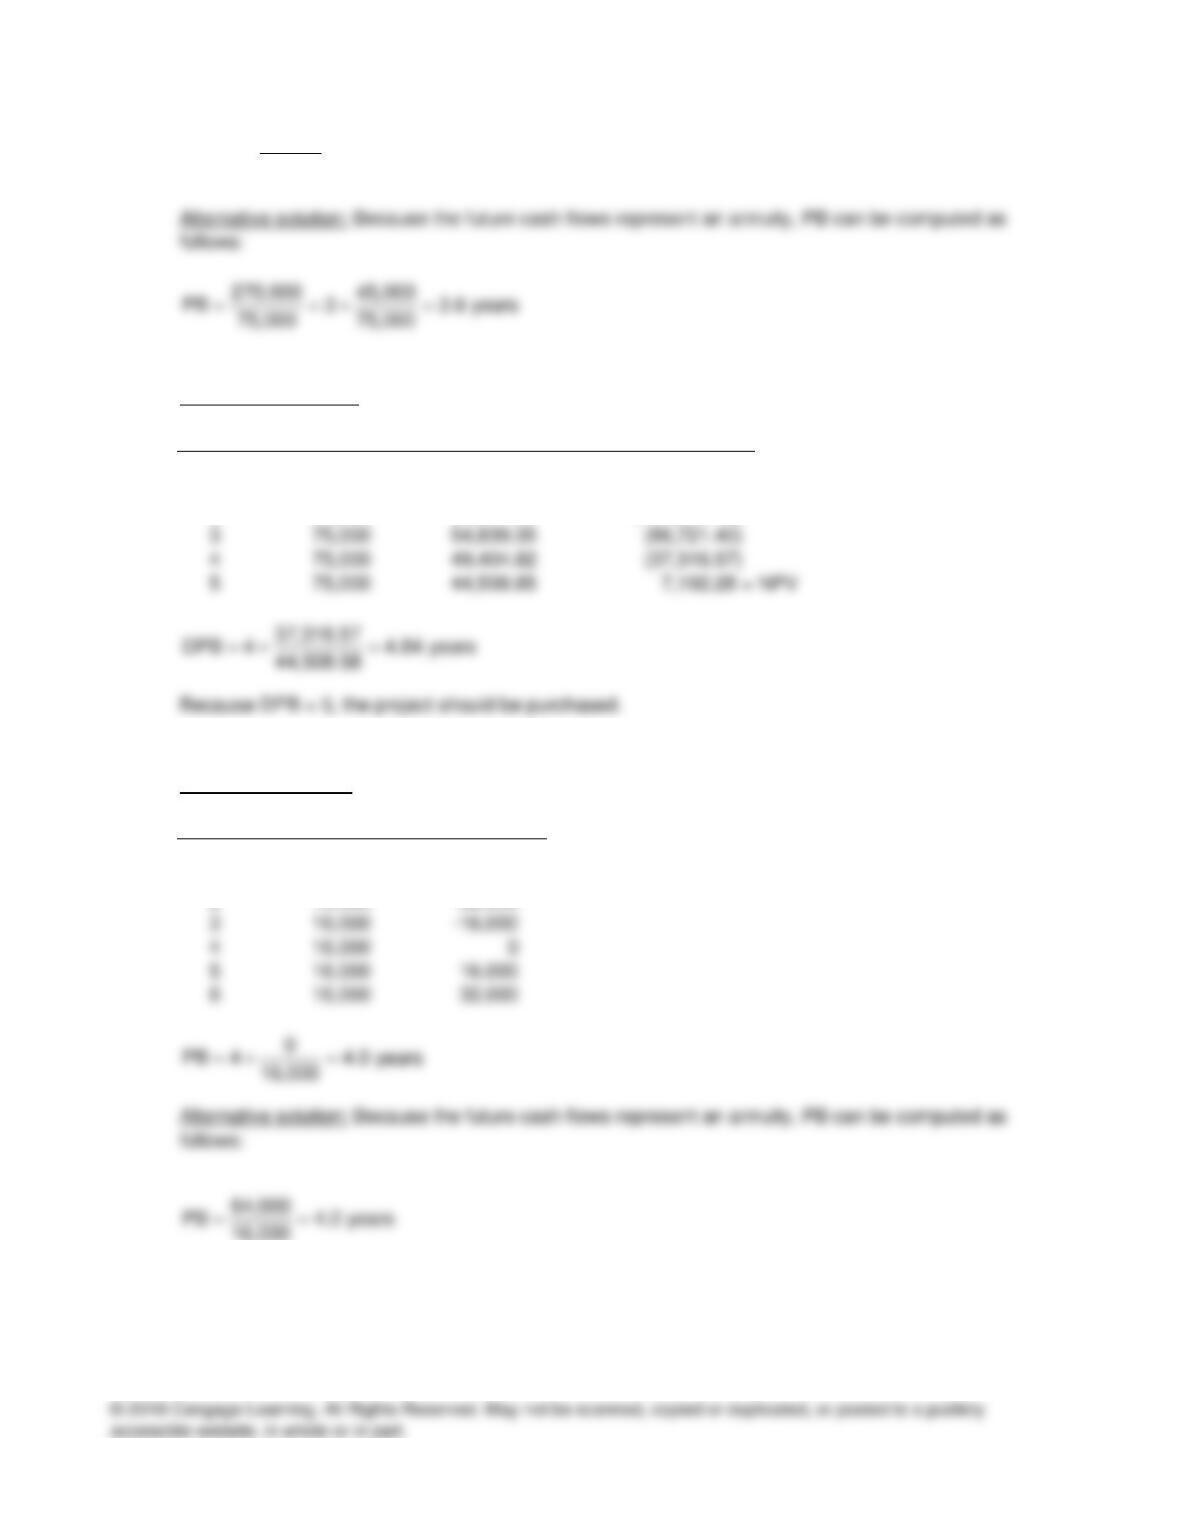
Chapter 9 CFIN6
45,000
PB 3 3.6 years
75,000
= + =
Discounted payback:
Year CF PV of CF @ 11% PV of CF
0 (270,000) (270,000.00) (270,000.00)
1 75,000 67,567.57 (202,432.43)
2 75,000 60,871.68 (141,560.75)
PB 4 4.0 years
9-14 Traditional payback:
Year CF CF
0 -64,000 -64,000
1 16,000 -48,000
2 16,000 -32,000
16,000
Chapter 9 CFIN6
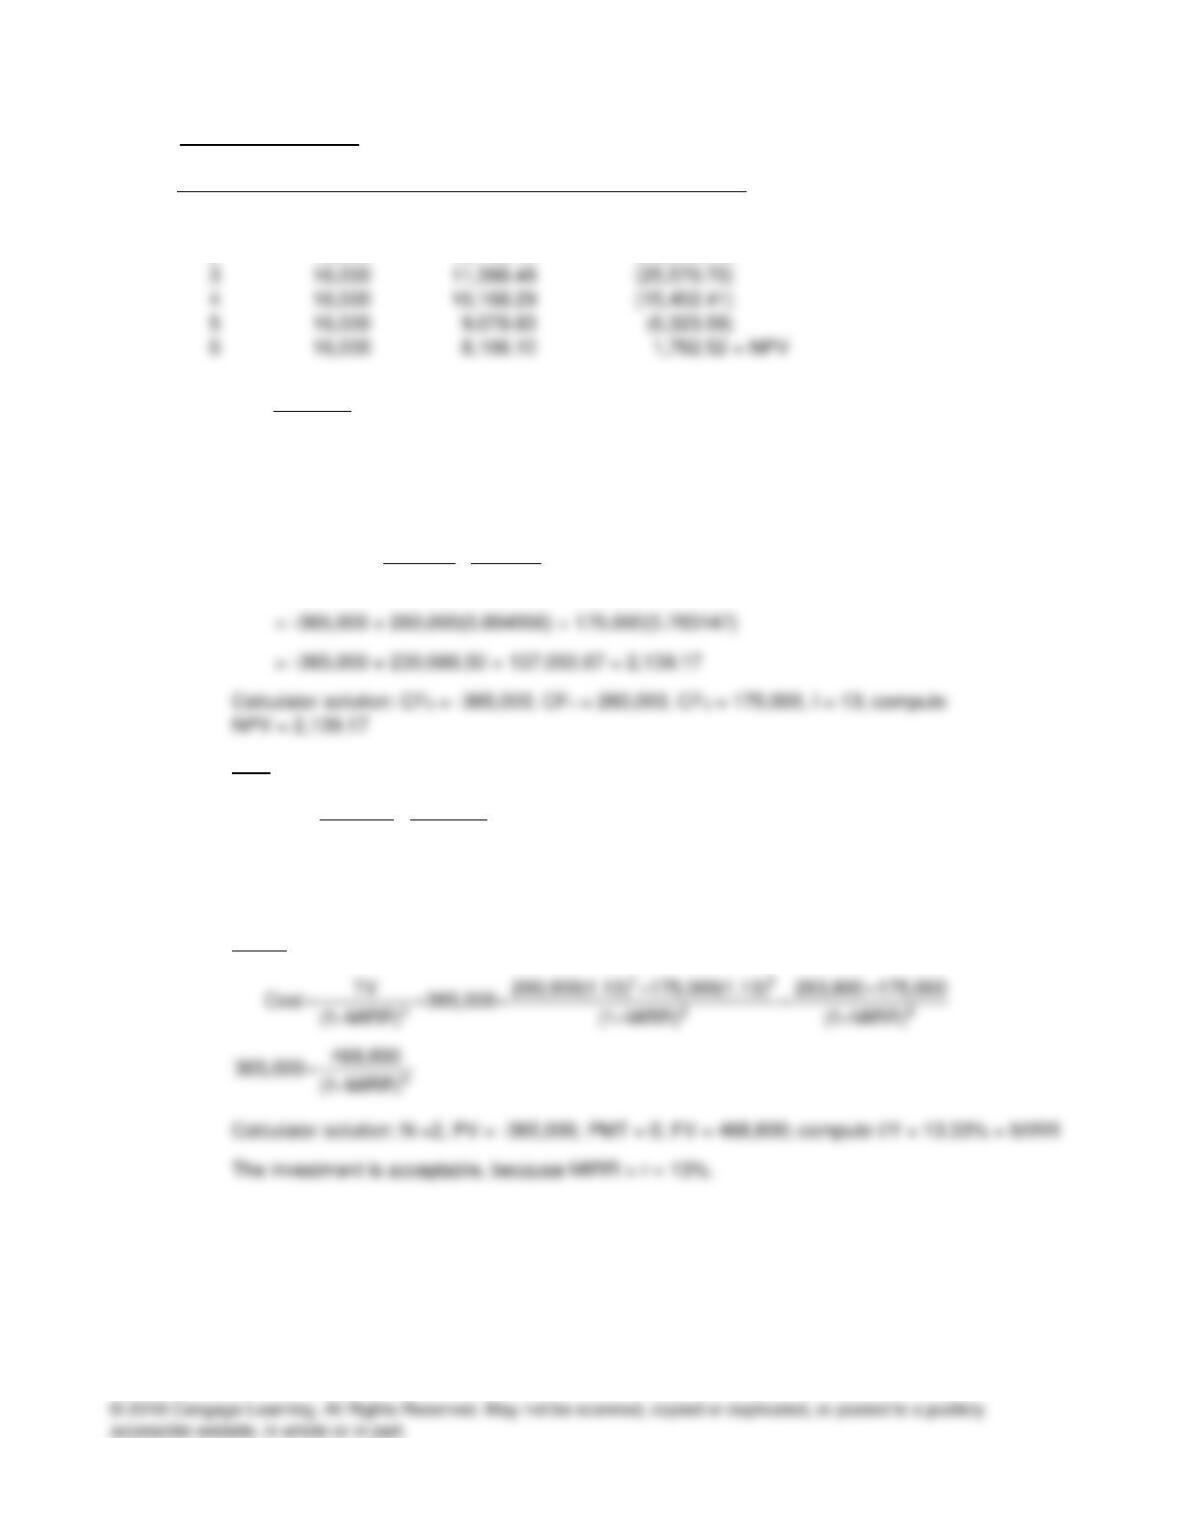
Discounted payback:
Year CF PV of CF @ 12% PV of C
0 (64,000) (64,000.00) (64,000.00)
1 16,000 14,285.71 (49,714.29)
2 16,000 12,755.10 (36,959.18)
6,323.58
DPB 5 5.78 years
8,106.10
= + =
Because DPB < 6, the project should be purchased.
9-15 a.
12
260,000 175,000
NPV 365,000 (1.13) (1.13)
=− + +
b. IRR:
12
260,000 175,000
365,000 (1 IRR) (1 IRR)
=+
++
Calculator solution: CF0 = -365,000, CF1 = 260,000, CF2 = 175,000, I = 13; compute
IRR = 13.48%
c. MIRR:
Chapter 9 CFIN6
9-16 Project Alpha:
a. NPV:
b. IRR:
1 2 3
120,000 120,000 120,000
270,000 (1 IRR) (1 IRR) (1 IRR)
= + +
+ + +
c. Discounted payback:
Year CF PV of CF @ 12% PV of C
0 (270,000) (270,000.00) (270,000.00)
1 120,000 105,263.16 (164,736.84)
Project Beta:
a. NPV:
1 2 3
0 80,000 555,000
NPV 300,000 (1.14) (1.14) (1.14)
−
=− + + +
b. IRR:
1 2 3
0 80,000 555,000
300,000 (1 IRR) (1 IRR) (1 IRR)
−
= + +
+ + +
Chapter 9 CFIN6
c. Discounted payback:
Year CF PV of CF @ 12% PV of C
0 (300,000) (300,000.00) (300,000.00)
1 0 0.00 (300,000.00)
Summary of computations:
Project NPV IRR DPB
Alpha $8,595.84 15.89% 2.89 years
Beta 13,051.79 15.53 2.97
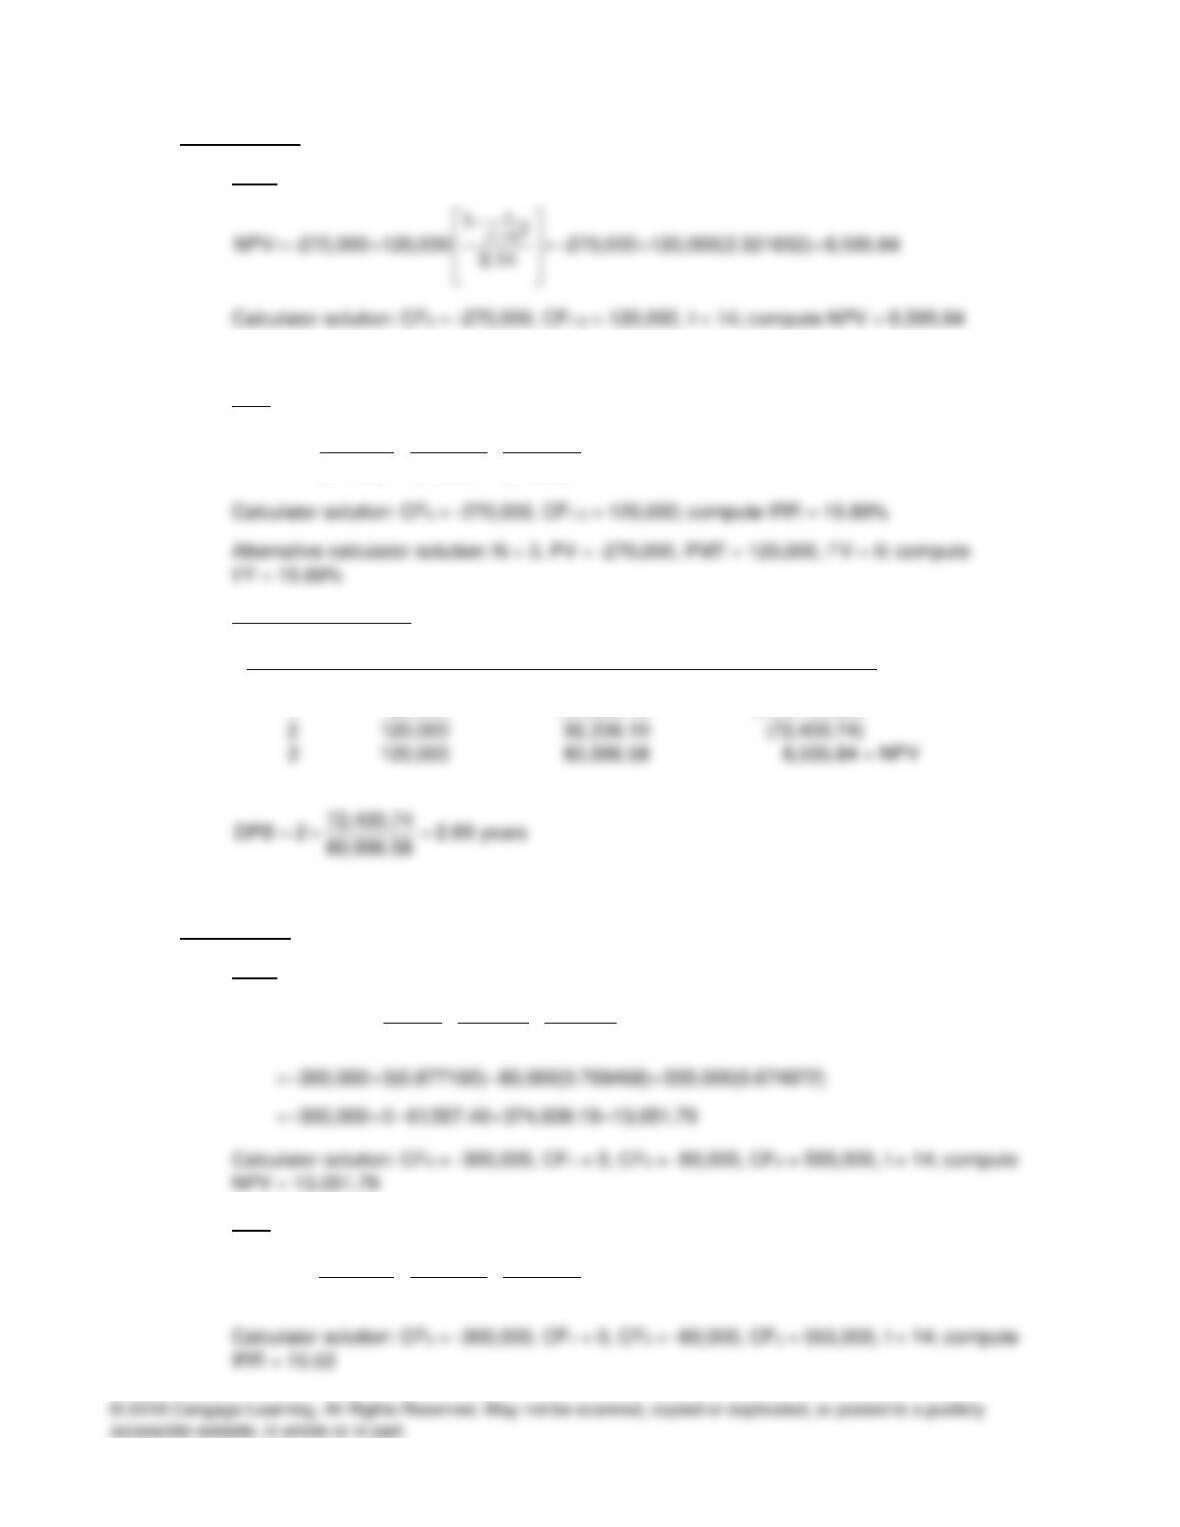
9-17 Project AB:
a. NPV:
−
=− + =− + =
13
(1.13)
1
NPV 90,000 39,000 90,000 39,000(2.361153) 2,084.95
0.13
Calculator solution: CF0 = -90,000, CF1-3 = 39,000, I = 13; compute NPV = 2,084.95
c. MIRR:
−
3
2 1 0
(1.13) 1
39,000 0.13
Chapter 9 CFIN6
d. Discounted payback:
Year CF PV of CF @ 13% PV of C
0 (90,000) (90,000.00) (90,000.00)
1 39,000 34,513.27 (55,486.73)
Project LM:
a. NPV:
=− + =− + =
3
147,500
NPV 100,000 100,000 147,500(0.693050) 2,224.90
(1.13)
Calculator solution: CF0 = –100,000, CF1-2 = 0, CF3 = 147,500, I = 13; compute NPV = 2,224.90
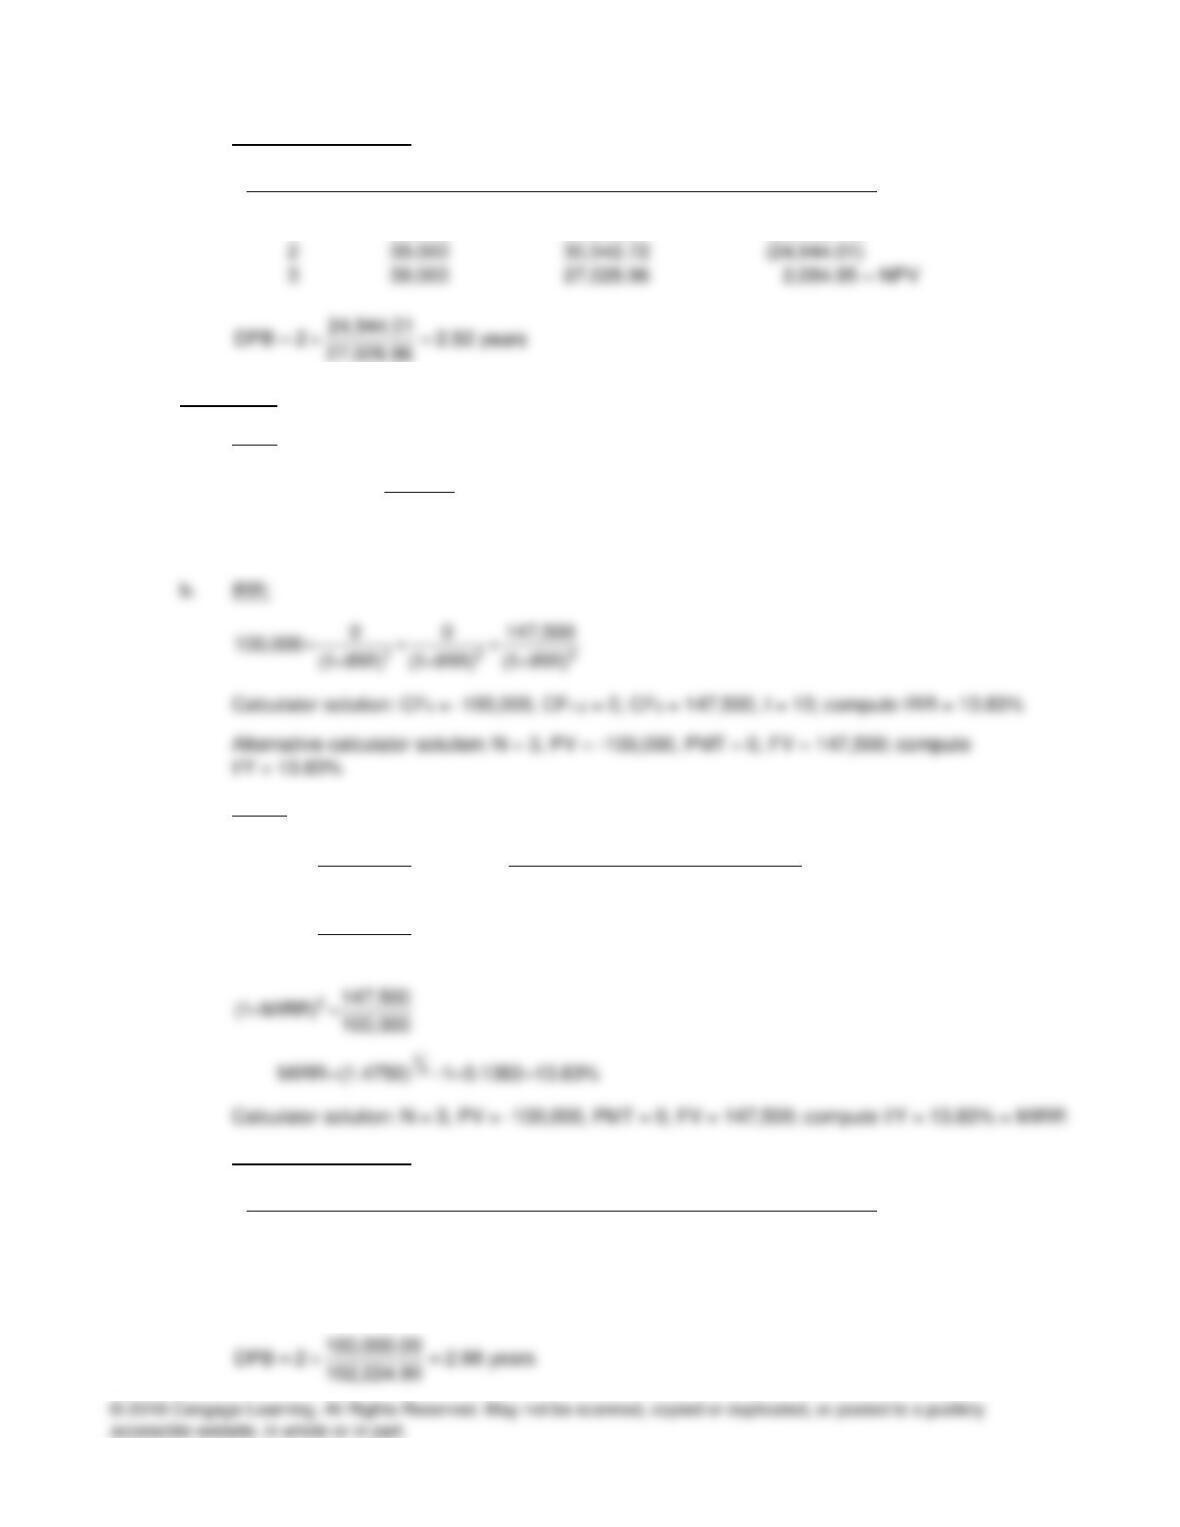
c. MIRR:
++
= = =
++
=+
2 1 0
n3
3
TV 0(1.13) 0(1.13) 147,500(1.13)
Cost 100,000
(1 MIRR) (1 MIRR)
147,500
100,000 (1 MIRR)
d. Discounted payback:
Year CF PV of CF @ 13% PV of C
0 (100,000) (100,000.00) (100,000.00)
1 0 0.00 (100,000.00)
2 0 0.00 (100,000.00)
3 147,500 102,224.90 2,224.90 = NPV
Chapter 9 CFIN6
Project UV:
a. NPV:
−
=− + + +
1 2 3
55,000 100,000 100,000
NPV 96,500 (1.13) (1.13) (1.13)
b. IRR:
−
= + +
+ + +
1 2 3
55,000 100,000 100,000
96,500 (1 IRR) (1 IRR) (1 IRR)
Calculator solution: CF0 = –96,500, CF1 = -55,000, CF2-3 = 100,000; compute IRR = 13.89%
Calculator solution: N = 3, PV = -145,172.57, PMT = 0, FV = 213,000; compute I/Y = 13.63% =
MIRR
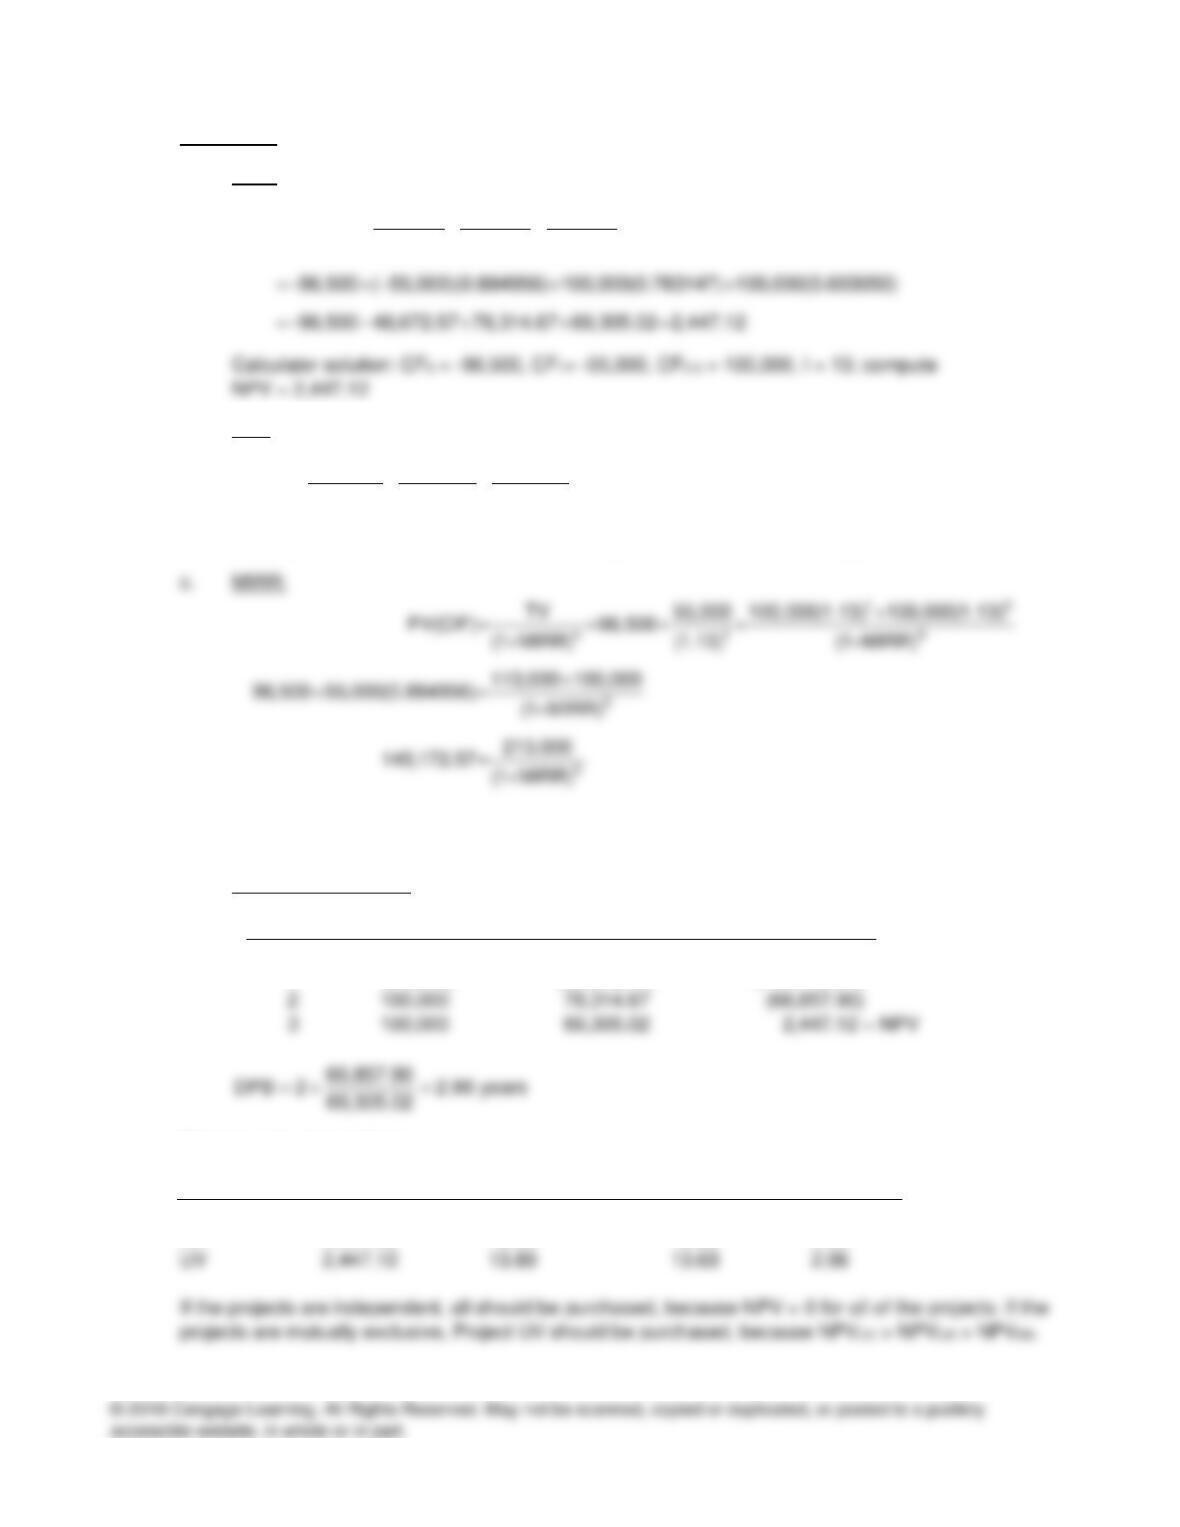
d. Discounted payback:
Year CF PV of CF @ 13% PV of C
0 (96,500) (96,500.00) (96,500.00)
1 (55,000) (48,672.57) (145,172.57)
Summary of computations:
Project NPV IRR MIRR DPB
AB $2,084.95 14.36% 13.87% 2.92 years
LM 2,224.90 13.83 13.83 2.98
Chapter 9 CFIN6
9-18 NPV:
=− + + =− + +
=− + + =
S12
14,000 6,000
NPV 16,000 16,000 14,000(0.862069) 6,000(0.743163)
(1.16) (1.16)
16,000 12,068.97 4,458.98 527.95
IRR:
=+
++
12
2,000 18,600
15,000 (1 IRR) (1 IRR)
Calculator solution: CF0 = -15,000, CF1 = 2,000, CF2 = 18,600, compute IRR = 18.22%
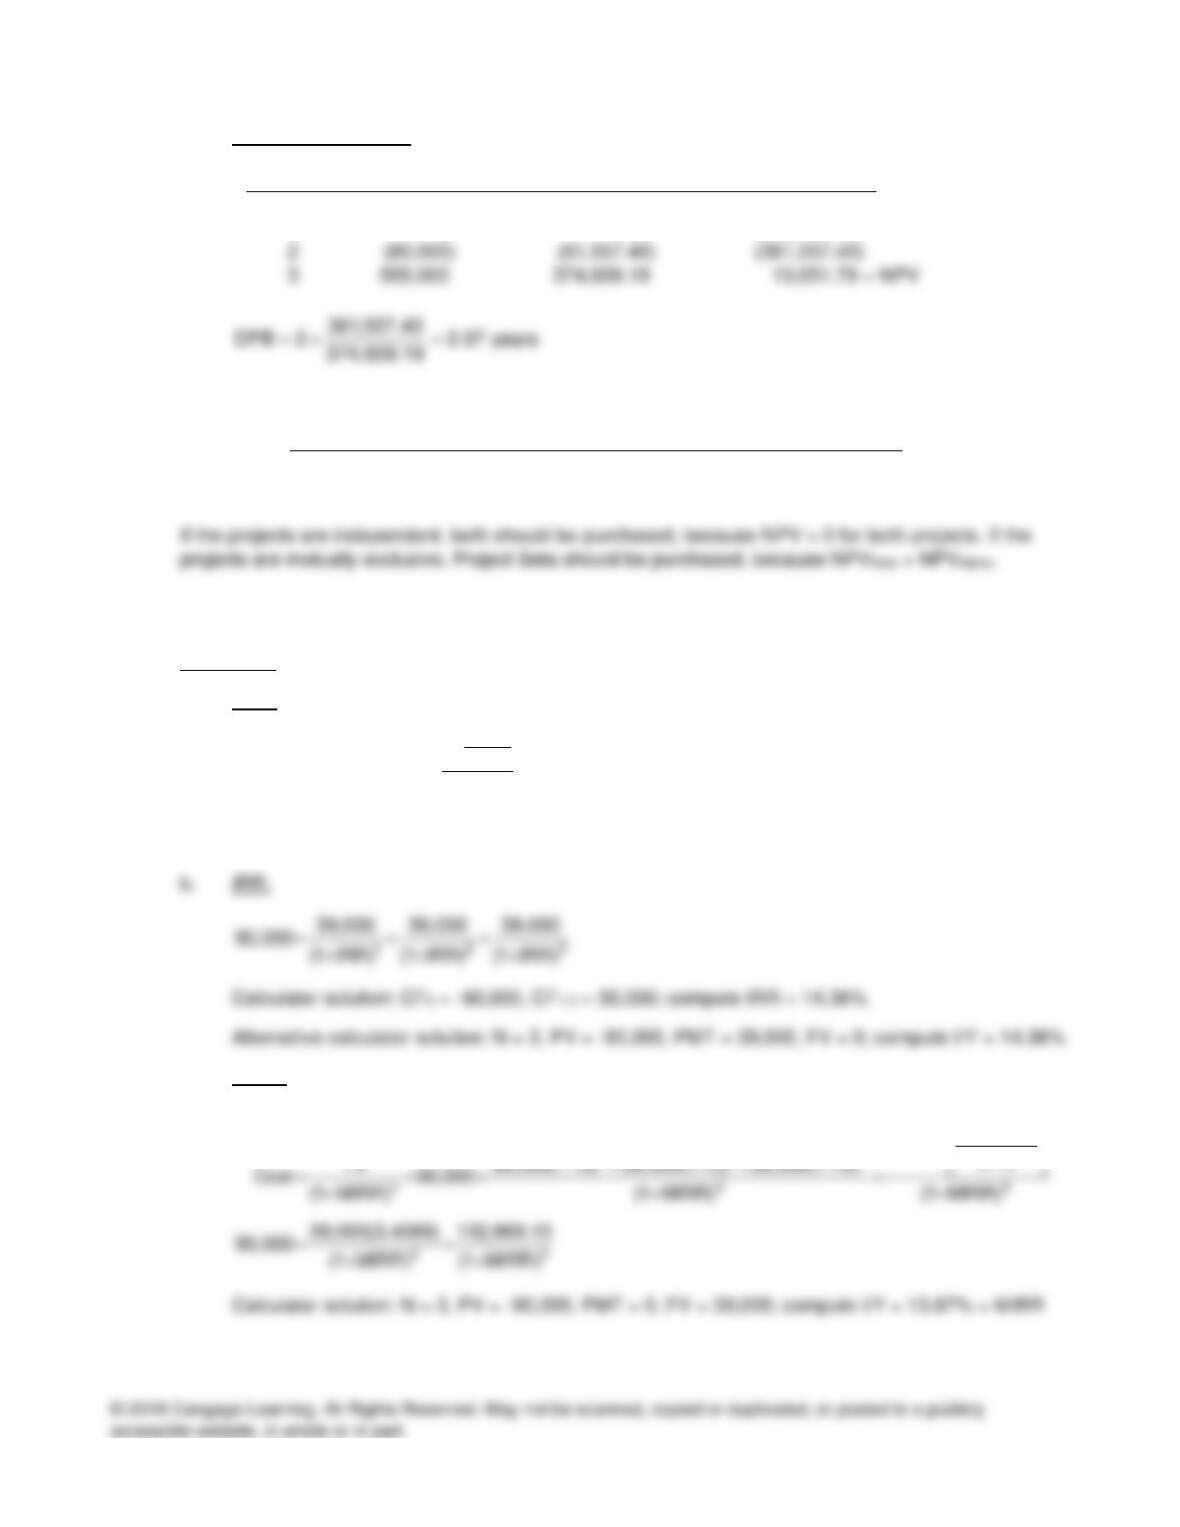
9-19 a. Because they are independent and both projects have positive NPVs, both projects are
acceptable.
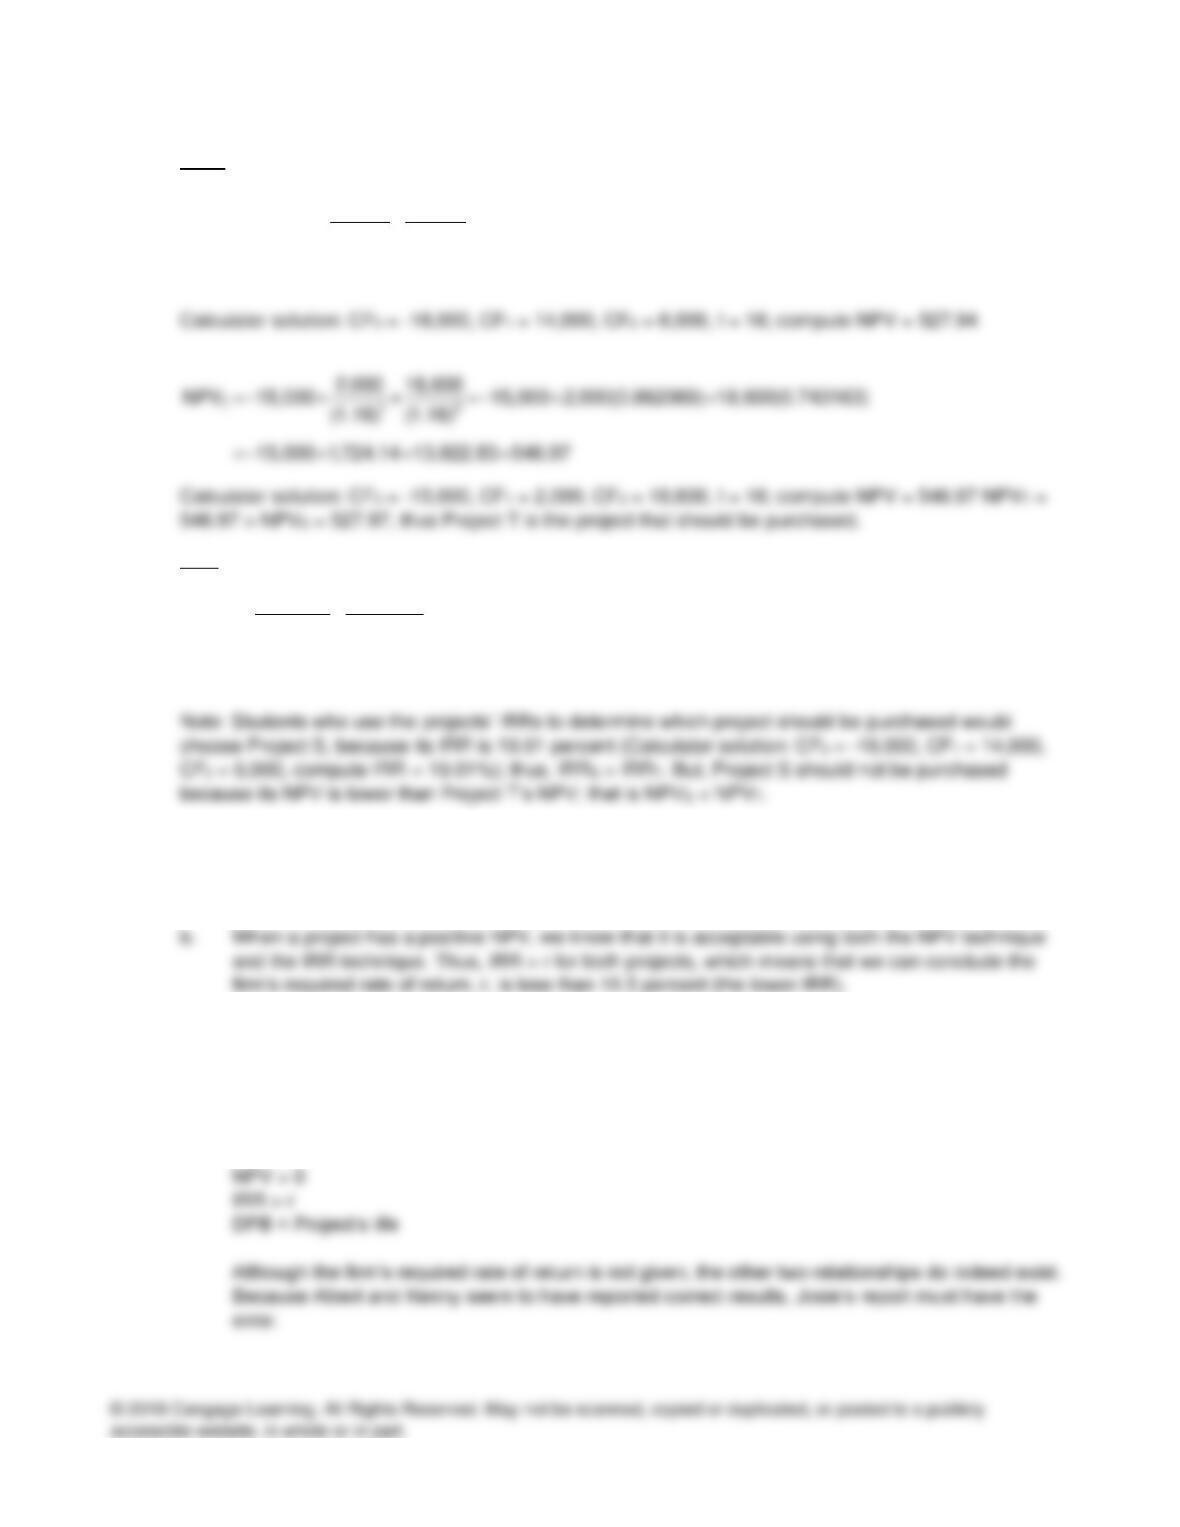
9-20 a. Because all of the capital budgeting techniques listed in the table are based on time value of
money (TVM) concepts, they all must agree with respect to the accept/reject decision. The
projects Albert and Kenny evaluated are acceptable, and therefore should be purchased. As a
result, for both projects, the following must exist:
Chapter 9 CFIN6
If a project is not acceptable, then NPV < 0 and DPB > Project’s life. For her project, Josie reports
that NPV < 0, which is correct; but the number that she reports for the project’s discounted
payback period indicate DPB = 5.8 years, which is less than the project’s life of 6 years. This is
the error, because when NPV < 0, DPB > Project’s life, which means that the DPB Josie reports
should be greater than six years.