FY2009/10 Approved Budget
18
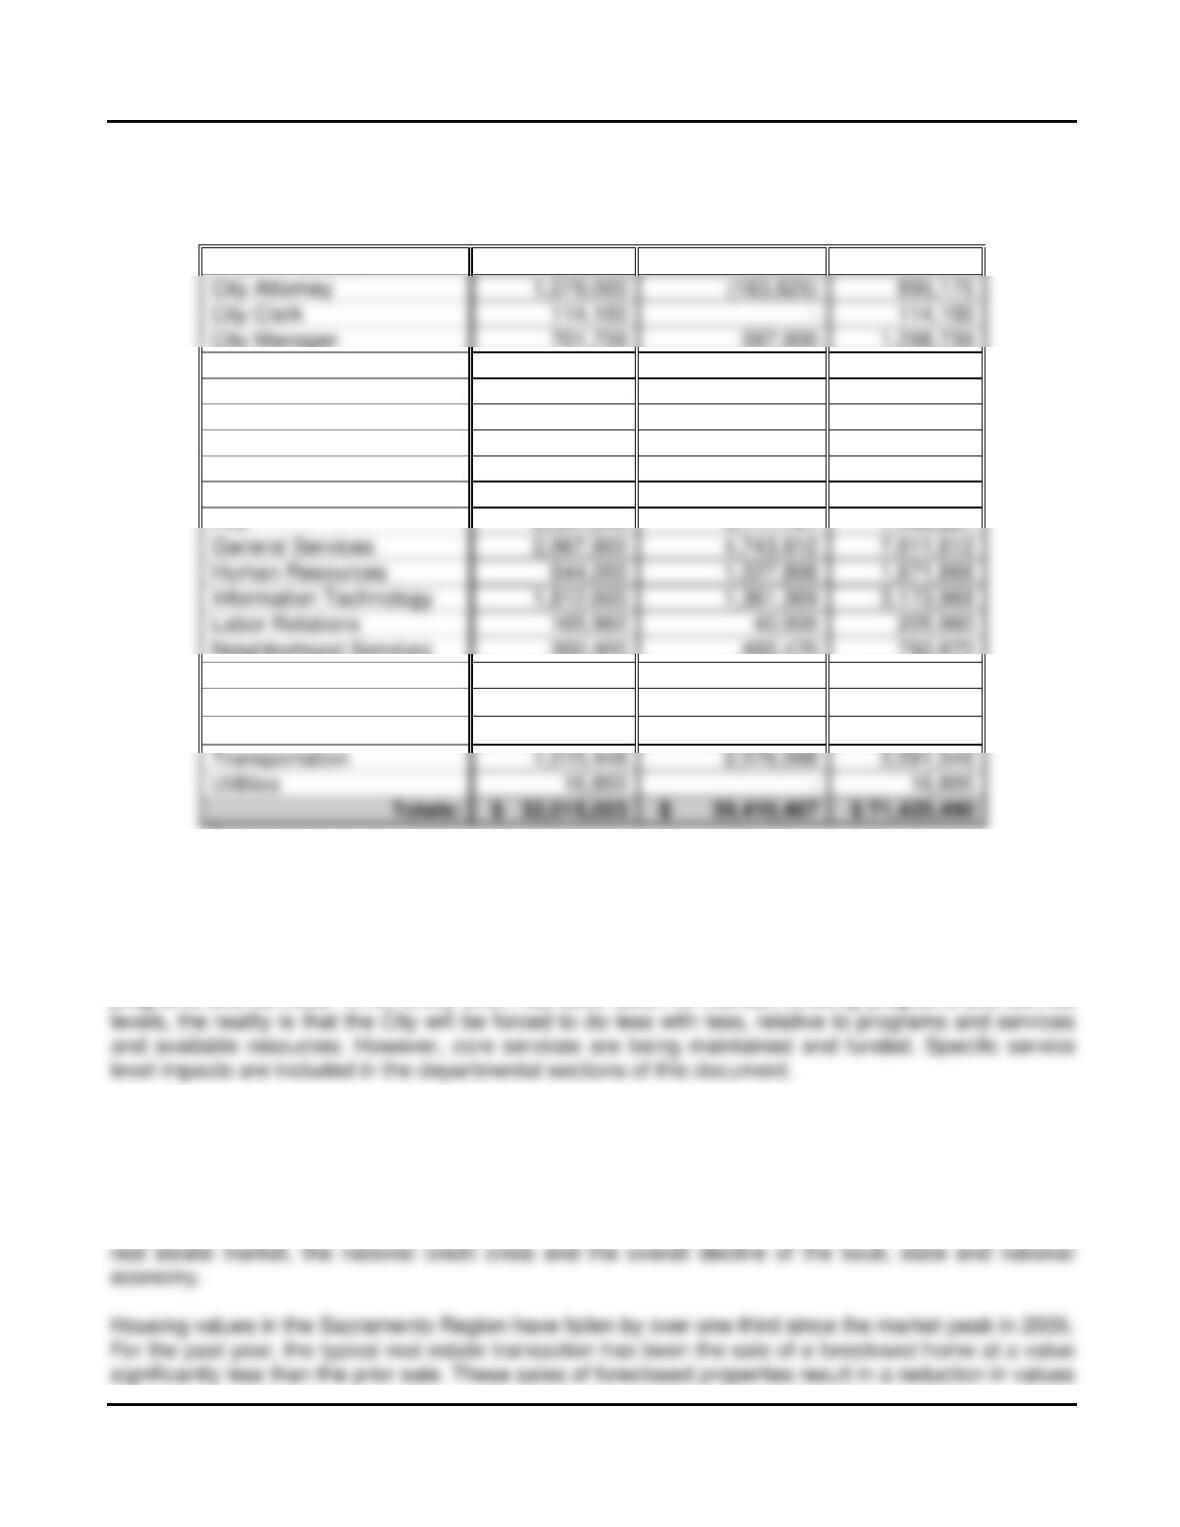
Department
Budget
Reduction
FY2008/09
Budget
Reduction
FY2009/10
Cumulative
Reductions
Mayor & Council 394,805 266,809 661,614
City Treasurer 416,637 468,140 884,777
Code Enforcement 1,243,800 1,720,716 2,964,516
C C & L 823,000 1,355,363 2,178,363
Community Development 882,603 2,610,825 3,493,428
Economic Development 323,800 669,274 993,074
Finance 1,197,600 1,890,123 3,087,723
Fire 2,331,040 5,117,181 7,448,221
Parks & Recreation 4,966,247 8,297,002 13,263,249
Planning1 608,644 – 608,644
Police2 10,109,000 6,360,244 16,469,244
1 FY2009/10 Planning Department reductions are included in the Community Development and Finance
Department.
2 FY2009/10 Police Department reductions reflect new revenues and the deferral of COLA and step increases
for sworn personnel.
In many cases these reductions will change what we do and how we do it, ultimately resulting in
additional changes in levels of service or when possible, increased cost recovery for fee related
programs and services. While every effort has been taken to maintain existing programs and service
THE CHALLENGE
Budget development is both difficult and contentious as it requires leaders to make tough choices:
Which programs should be funded and at what level? At the same time these decisions are being
made, there is much uncertainty about future revenue levels. What we do know is that the City of
Sacramento’s financial condition continues to worsen as a result of the significant decline in the City’s
FY2009/10 Approved Budget
19
on the Assessor’s Tax Roll. In 1978, California voters passed Proposition 8, a constitutional
amendment that allows a temporary reduction in assessed value when a property suffers a “decline-in-
value.” A decline-in-value occurs when the current market value of your property is less than the
The resulting “structural budget deficit” is inevitable as there is no revenue growth to keep pace with
compounding expenditure growth caused by increasing service demands, escalating personnel costs,
and the ongoing operations and maintenance of aging infrastructure. Expenditures must be reduced to
cover the multi-years commitments to the workforce and new facilities and to cover the declining
The City’s challenge for FY2009/10 is to effectively implement a multi-year plan to close the gap
between revenues and expenses in the General Fund, achieving a fiscally sustainable budget.
Unfortunately, the capacity to deal with this fiscal challenge is determined, ultimately by a number of
factors completely out of our control, including the condition of the local, statewide and national
economies and the impact on the generation of discretionary tax revenues. The downturn of the
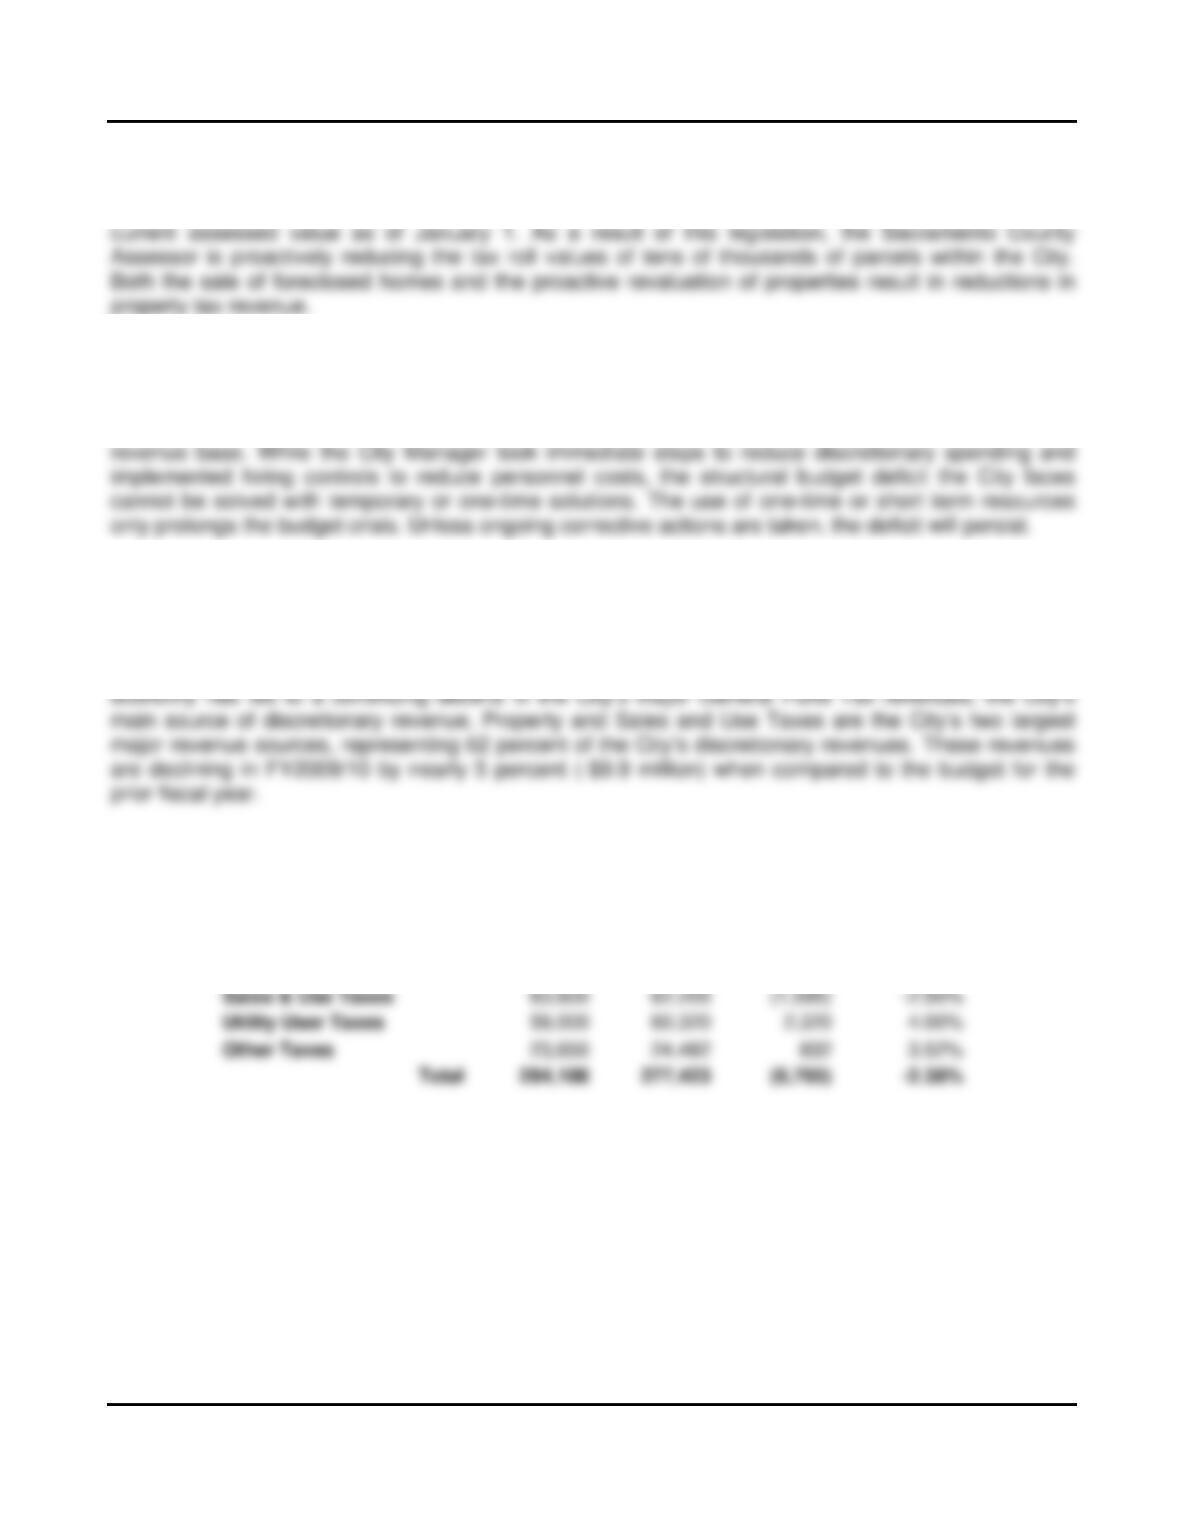
The following table summarizes the estimated major revenue sources for FY2009/10 compared to the
estimates of the current year revenues (dollars in thousands):
Amended
FY2008/09
Proposed
FY2009/10 Difference Percentage
Property Taxes 138,738 130,416 (8,322) -6.00%
As demonstrated in the table above, City revenues have essentially ceased to grow while expenditures
necessary to maintain staffing levels and fund prior commitments in the upcoming fiscal year continue
to grow. In the current year, the adopted budget relies on nearly $8.3 million in one-time resources to
bridge the gap between revenues and expenditures.
BUDGET BALANCING
The gap between ongoing revenues and expenditures has been closed with a combination of ongoing
expenditure reductions ($36.7 million), new revenues ($5.1 million), and one-time funding ($8.3
million).
FY2009/10 Approved Budget
20
In November and December 2008 the City’s operating departments undertook a comprehensive
review of programs and services, Essential Services Planning (ESP), to identify the following
information in order to better understand the City’s budget:
Cost and current FTE to deliver programs and services
Alternative models for delivering programs and services
The ESP information was reviewed and refined at the City Manager’s Office in efforts to address the
growing gap between revenues and expenses; all operating departments were asked to prepare
reduction proposals based on the work done for the ESP, looking to reduce or eliminate lower priority
services, redefining service levels or alternative models for service delivery or options for off-setting
costs by increasing cost recovery. All non-public safety departments submitted proposals outlining
plans to reduce spending or raise revenue to meet a 15 percent, 25 percent or 35 percent reduction in
In addition to department specific operating reductions, the Proposed Budget reflects continuing efforts
to reduce costs on a citywide basis, including reductions in internal service fund costs for fleet and
workers’ compensation that result in lower costs in nearly all funds citywide.
Approximately eighty percent, $41.7 million of the funding gap is closed with ongoing measures, the
combination of department and citywide reductions. However, $8.3 million will be pushed into
FY2010/11 through the use of one-time funding. Following is a high level overview of the reductions to
the City’s General Fund operating departments included in the Proposed Budget:
$28.9 million reduction in labor costs, including the unfunding of 387 FTE
Detailed information on the proposed reductions and the associated service level impacts is included
in each department’s section of the Proposed Budget.
The $8.3 million in one-time funding included in the Proposed Budget is from the following sources:
$2.7 million in excess bond proceeds and interest earnings from the 2002 Capital
Improvement Revenue Bond Fund to offset General Fund debt ($2.2 million) and provide
The use of one-time resources to bridge the gap between revenues and expenditures defers, but does
not eliminate the need to make cost reductions. In future years, as we are already experiencing, these
reductions will be deeper and more difficult since many of the non-essential services were already
eliminated in FY2008/09 or are already proposed to be eliminated in FY2009/10.
It is important to note that the Proposed Budget does not include adjustments that may be necessary
as a result of State or County budget actions, nor any additional contributions that could be required by
GENERAL FUND – FIVE-YEAR FORECAST
The five-year forecast of the General Fund is an important fiscal planning tool. The forecast is based
on the current budget and projects future expenditures, revenues, and other funding sources over a
multi-year horizon. Under the sustainable budget policy of the Mayor and City Council, proposed fiscal
actions are evaluated in a longer term, rather than a short term context.
The five-year forecast is based on a set of point-in-time assumptions. The projected expenditure
growth is a reality, particularly through the term of the current labor contracts, the increased costs
necessary to make up for investment losses in the City’s retirement funds, and the costs to bring new
facilities on-line. Revenues are derived from economically sensitive sources and the five-year revenue
forecasts are subject to the same uncertainty and downside risk surrounding national economic
we’re having hunches.”
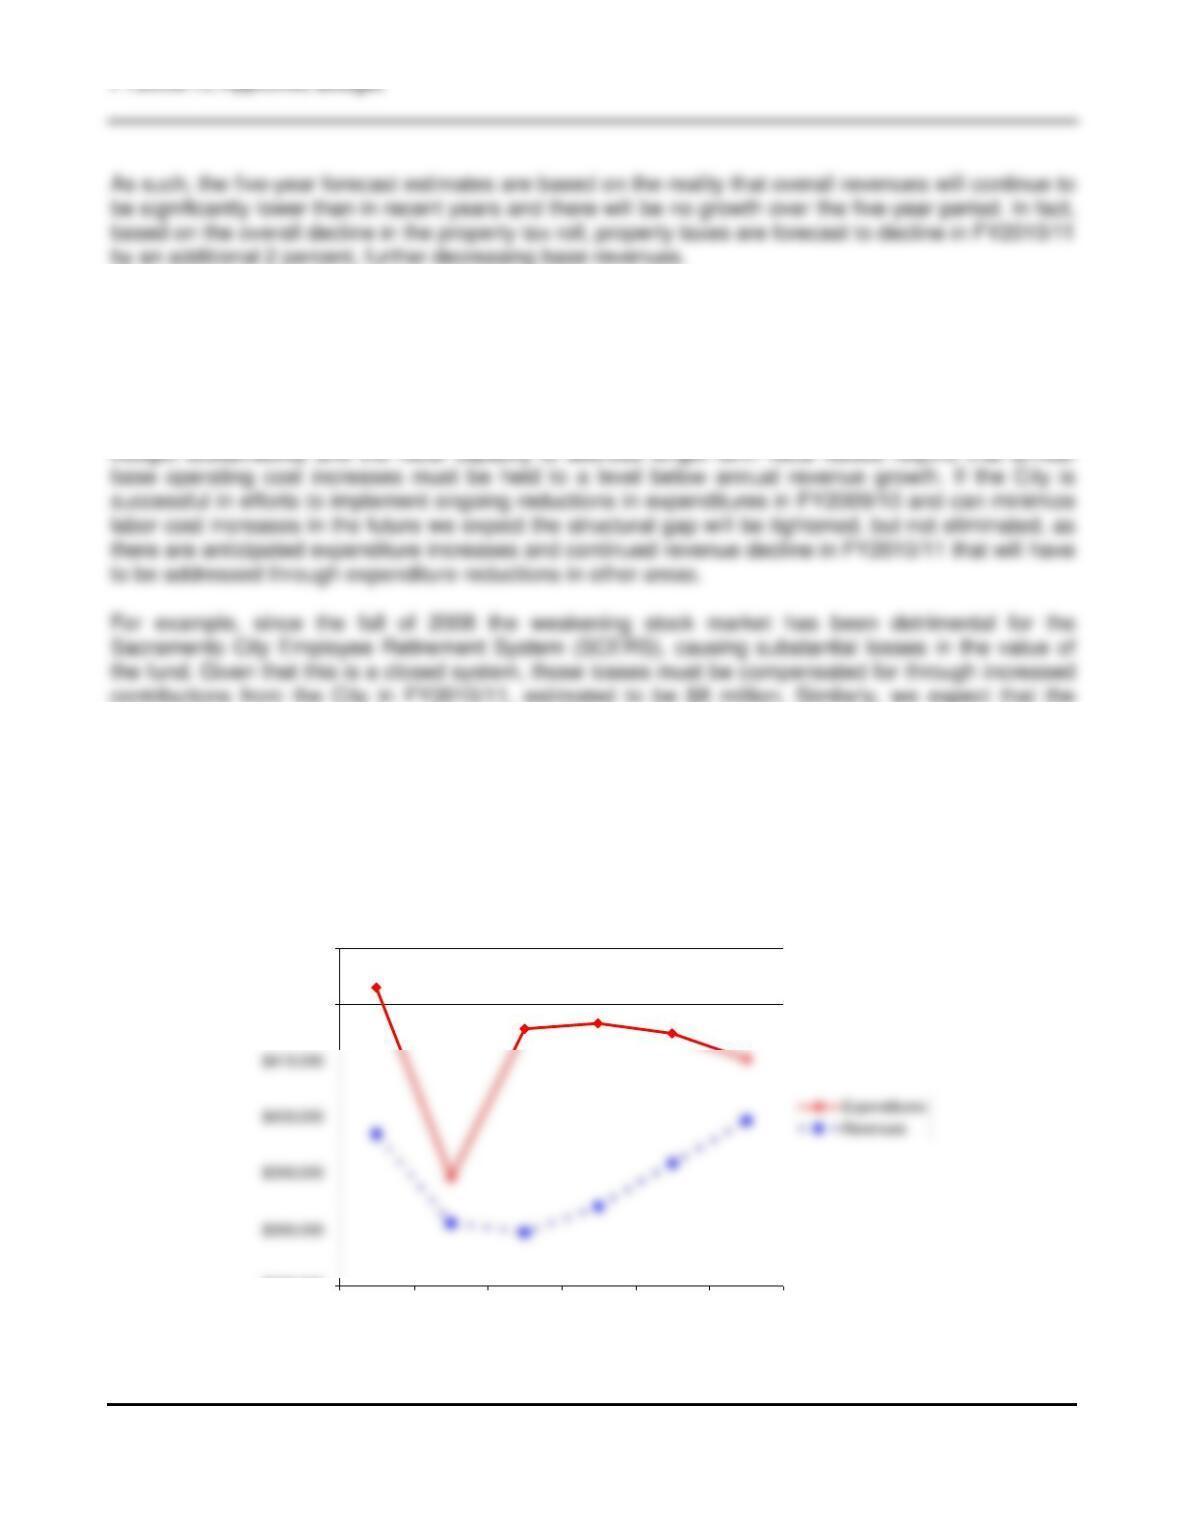
Based on current trends, the forecast reflects negative revenue growth for the coming fiscal year and
minimal revenue growth over the next five years. Locally the City has experienced a surge in
foreclosures, a decline in residential sales and lower property values in certain areas of the City. As
stated earlier, the overall decline in the real estate market marks a salient reality of significant
22
General Fund 5 Year Forecast
(in 000s)
$370,000
$420,000
$430,000
FY09 FY10 FY11 FY12 FY13 FY14
Trends in employment and payrolls continue to demonstrate the overall decline in the local economy.
Unemployment in California rose to 10.5 percent in February, the highest in 26 years, with
unemployment in the Sacramento region increasing to 10.8 percent. Payrolls are also decreasing as
overall there are more employed people earning less money. Most economic forecasts state that
statewide unemployment will remain above 10 percent through calendar year 2011.
Public Employee Retirement System (PERS) will require the City to make a larger annual contribution,
between three and five percent of total salaries, to make up for investment losses in City funds held by
PERS, currently estimated at $12 million.
The following graph depicts the ongoing gap in the General Fund, and the growth over the five-year
forecast period:
FY2009/10 Approved Budget
23
Given these realities, the current level of annual funding commitments is not sustainable as the five-
year forecast reflects a cumulative deficit of $102 million over the next four fiscal years if further
LONG-TERM STRATEGY
The City is clearly facing a substantial challenge in returning to a long-term structurally balanced
General Fund budget. Successfully addressing this financial challenge will require increased flexibility,
new ways of delivering programs and services and extreme fiscal discipline. We have already taken
Had the City experienced a less severe economic downturn, these measures would have been enough
to balance the budget. However, knowing that revenues will not recover to the level necessary to cover
growing expenses in the next two years, and likely not even over the next five years, the strategies
implemented in the Proposed Budget are simply not enough to address the estimated budget shortfall
in FY2010/11 and beyond.
The Proposed Budget represents a significant step in a multi-year plan to close the budget gap with
ongoing measures and minimal use of remaining reserves. Further, staff will continue to aggressively
pursue all available federal, state and local funding to offset operating and capital costs. However,
Reflecting the direction provided by the Mayor and City Council at the budget development workshops,
the City Manager’s Office has identified the following long-term General Fund budget strategies that
should be evaluated for implementation. It is important to note that, in the case of citywide revenue
increases these measures require voter approval, for which the earliest opportunity to place the
measures on the ballot for consideration is June 2010.
The long-term plan will consider the following strategies to close the gap between revenues and
expenditures:
Alternative Revenue Options
As major discretionary tax revenues decline and residents continue to demand additional programs
and services, staff has been asked to identify potential opportunities to grow citywide revenues to
offset the costs of programs and services. Three such proposals are outlined below:
FY2009/10 Approved Budget
24
Public Safety Assessment – The City continues to work on developing Police and Fire
Master Plans that will create a ten-year blueprint for each department’s operational and
infrastructure needs. Implementing the Master Plans will require dedicating new funding to
Parking Assessment – The City Council adopted the Central City Parking Master Plan
(CCPMP) in September 2006. One of the 80+ recommendations of the CCPMP included
exploring the possibility of a commercial parking surcharge (aka parking tax). More
specifically, it was recommendation 7.4.3 which reads “Consider a parking surcharge on all
commercial parking to provide funding for increased enforcement and promotion of
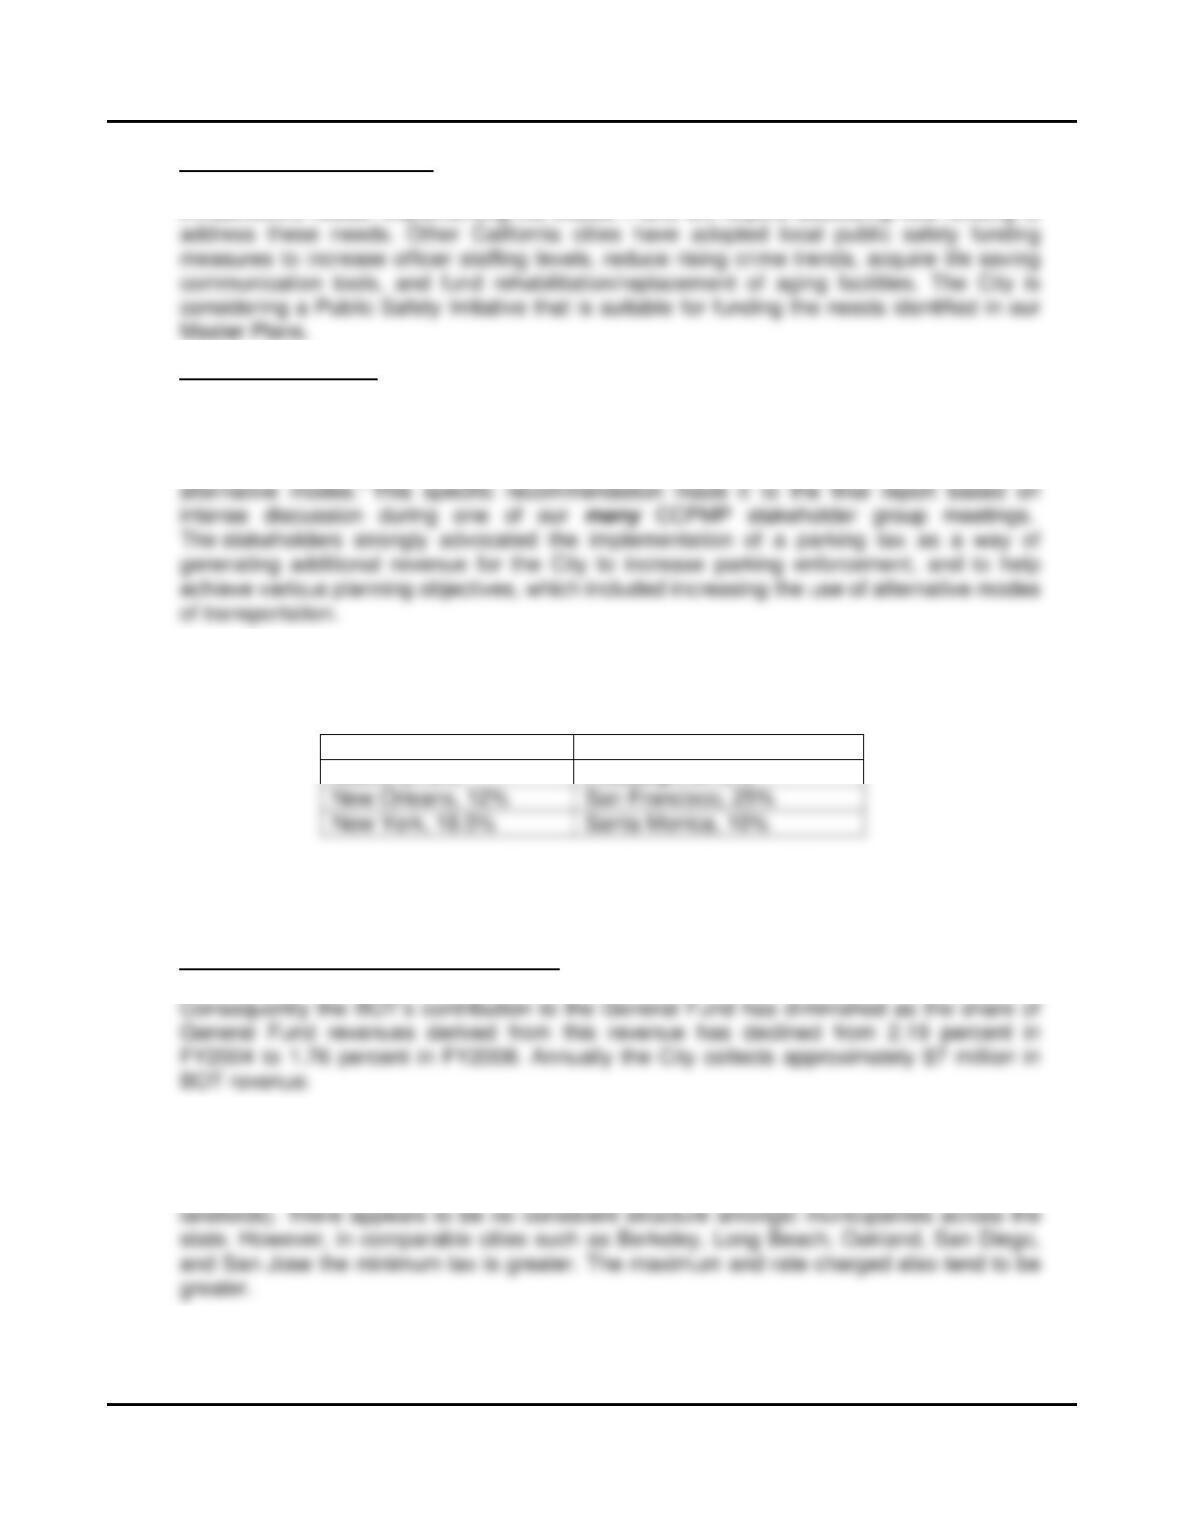
While there are many strategies for implementing a parking tax, the most common
approach is to levy a tax on parking operations based on gross revenue. Some of the cities
that currently have a parking tax are as follows:
Los Angeles, 10% Oakland, 10%
Miami, 27.8% Pittsburgh, 37.5%
If the City were to pursue a general tax, a simple majority vote of the Council is required to
place the measure on the ballot and a simple majority of the electorate is required to
implement a parking tax for general purpose expenditures.
Business Operations Tax Modernization – The City’s Business Operations Tax (BOT) was
adopted in 1984 and was adjusted in 1991. It has remained unchanged since.
General law and charter cities in California are authorized to levy a tax on business activity.
The tax may be fixed based on a per unit basis, or may be based on the number of
employees, gross receipts, net business income, and/or the number of rental units (for
If the City were to adjust our taxing criteria, the revenues generated are estimated as
follows:
FY2009/10 Approved Budget
25
Minimum tax from $30 to $50 = $384,000 increase;
Maximum from $5,000 to $10,000 = $940,000 increase; and
Increase the rate from 0.0004 to 0.0005 = $1.875 million increase.
Staffing and Labor Cost Reductions
Although wage freezes can slow the growth of payroll overall, such steps will not be enough to achieve
the longer term savings in the City’s employment costs that the City’s financial situation requires.
Ultimately, achieving a balance between the employment needs of workers and the City’s ability to
continue to provide key services to the public requires an actual reduction in the per-employee cost of
wages and benefits or the reallocation or redeployment of existing labor.
Toward that end, the City should study opportunities that that will further reduce labor costs as part of
the overall strategy to reduce the expenditure side of the budget deficit. Such strategies could include:
alternative staffing models for labor intensive programs and services; changes in health benefit plans
to reduce costs in both the short and long-term, relief from current and future pension liability by
Financial/Operational Review
As the City works to identify cost savings and right-size the organization to meet reduced revenue
trends, an independent financial/operational review could offer additional recommendations for cost-
savings, efficiencies and improved service to citizens. This type of review would be distinct from the
formal audit processes the City conducts (e.g. required annual financial attestation performed in
accordance with Generally Accepted Accounting Principles and internal audit examinations performed
in accordance with Generally Accepted Government Auditing Standards). The City also anticipates the
management audit would prioritize recommendations yielding the greatest potential for cost savings
ENTERPRISE FUNDS
Revenues in the Enterprise Funds are also significantly down as a result of the economic crisis. In the
Utilities Enterprise Funds, the cost for a number of critical items necessary to deliver services, such as
labor, fuel, chemicals, and utilities, have increased much more than expected. The downturn of the
26
housing market has also created shortfalls in projected revenues and the increase in foreclosures has
dramatically increased the number of unpaid utility bills that the Department is forced to write off as
bad debt. Finally, the Department has obligations to pay for regulatory requirements that apply to the
operation of water, sewer and solid waste collection systems, such as the water meter retrofit program,
regulatory permit requirements for the sewer systems, and landfill closure costs. As such, rate
Revenues for the City’s Community Center Fund and Marina Fund are also down, reflecting the
economic reality of less discretionary spending on hotels and leisure activities. The Proposed Budget
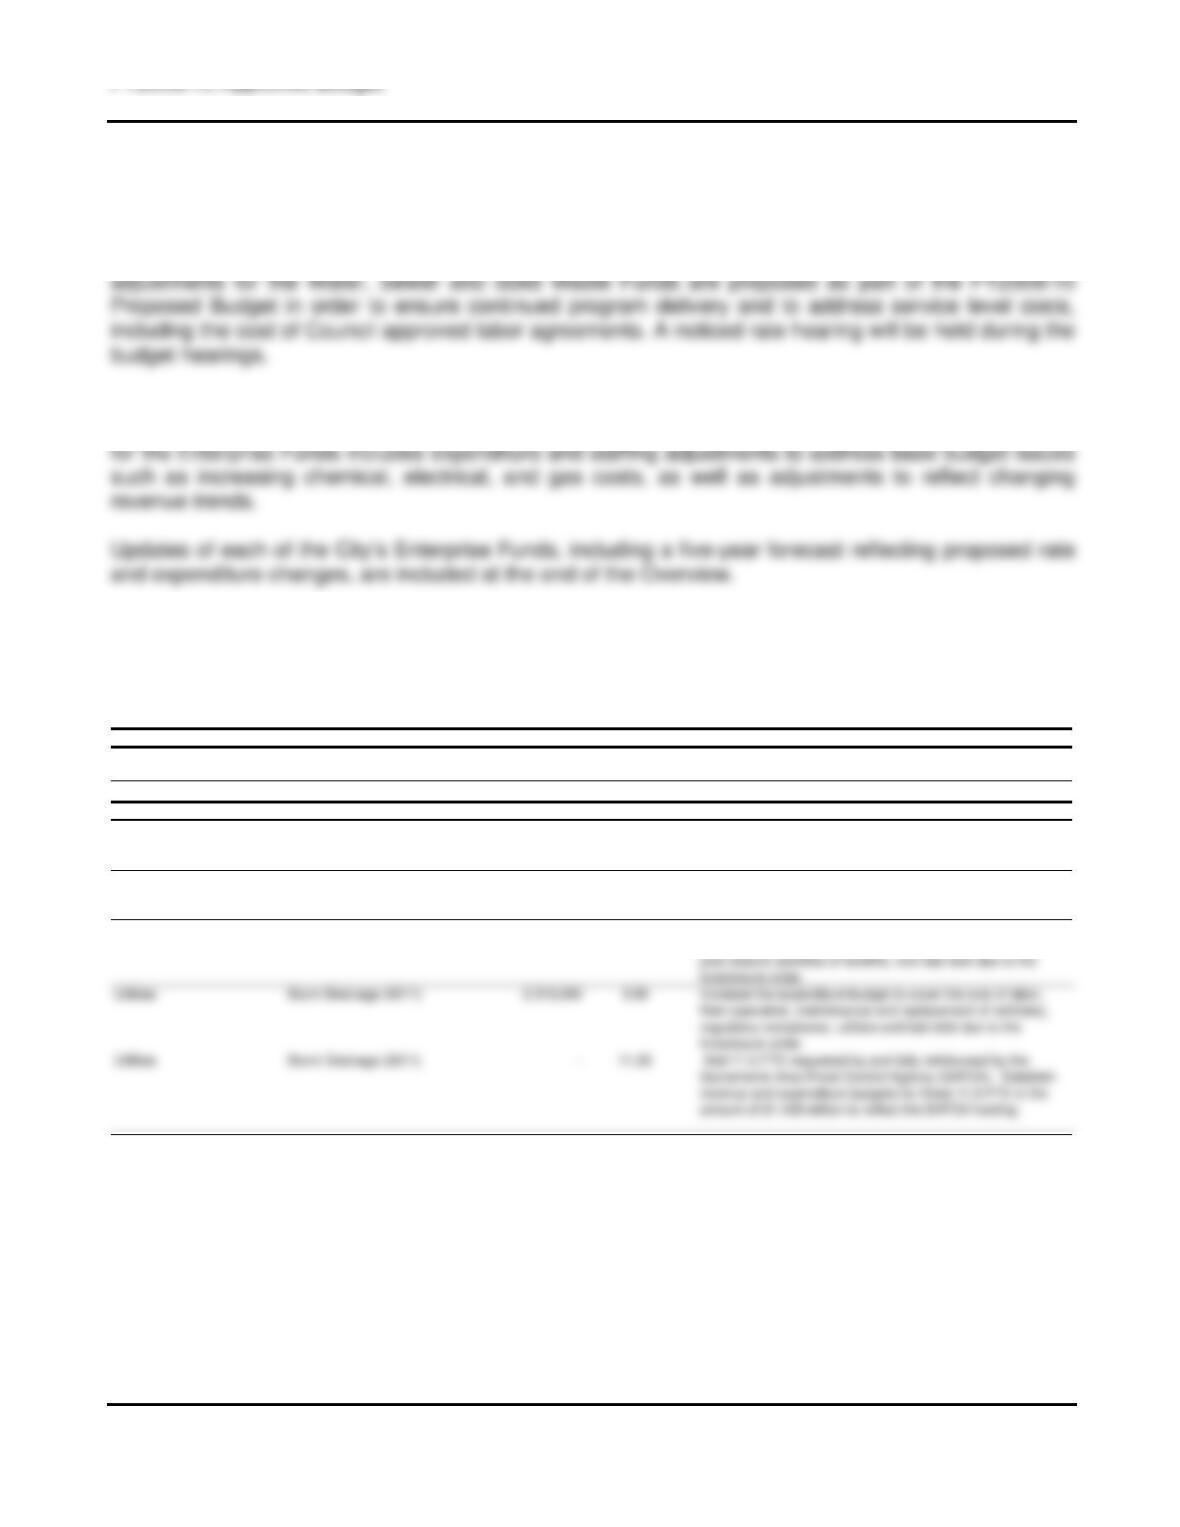
AUGMENTATIONS
Several Departments have identified program needs that benefit City residents and customers, which
result in no fiscal impact on the General Fund. These are identified in the chart below.
General Fund
Department Fund Net Cost FTE Description
Transportation General Fund (1001) – 8.00 Add Parking Enforcement Officers, costs to be fully offset by
revenues.
Enterprise, Special Revenue and Internal Service Funds
Department Fund Net Cost FTE Description
Utilities Water (6005) 7,443,000 0.00 Increase the expenditure budget to cover the cost of labor,
chemicals, utilities, sludge dewatering, and bad debt due to the
foreclosure crisis.
Utilities Sewer (6006) 1,852,000 0.00 Increase the expenditure budget to cover the cost of labor,
chemicals, utilities, and bad debt due to the foreclosure crisis.
Utilities Solid Waste (6007) 2,224,000 0.00 Increase the expenditure budget to cover the cost of labor,
fleet (operation, maintenance and replacement of vehicles),
2009-2014 CAPITAL IMPROVEMENT PROGRAM (CIP)
The Proposed FY2009/10 CIP Budget totals $50.1 million, funding 155 projects in all program areas in
various geographic areas of the City. The General Fund total for capital expenditures in FY2009/10 is
$1.8 million. The FY2009/10 CIP is nearly $49 million less than the prior year, funding 39 fewer
projects. This reflects the overall decline in available resources that the City faces in the context of the
decline in the local, state and national economy. The five-year program totals $219.2 million from all
funding sources. The General Fund portion of the five-year program is $17.9 million.
FY2009/10 Approved Budget
27
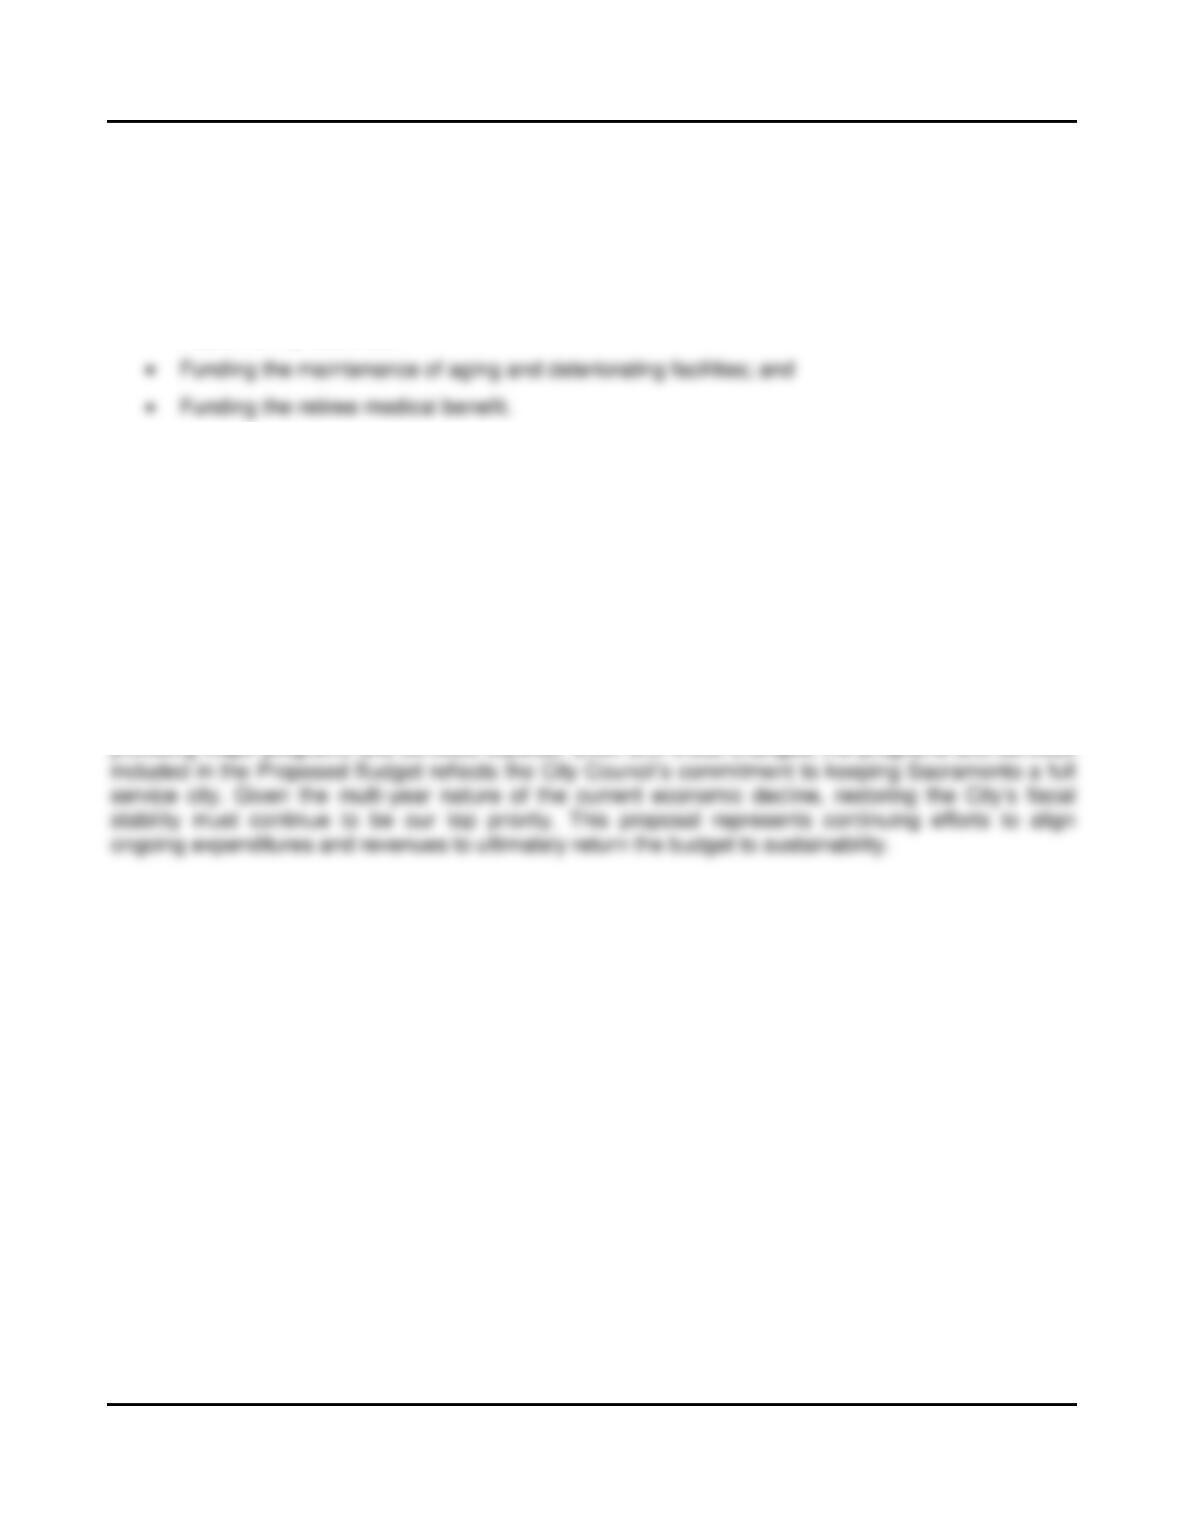
FUTURE FISCAL CHALLENGES
There are several important fiscal issues that were identified in the FY2008/09 budget that continue to
present challenges for the City when the General Fund budget reaches stability. These include:
Restoration of service levels through the funding of staff and other expenditures in the base
budget;
Replenishing reserves;
These problems cannot be addressed unless annual base operating cost increases, particularly labor
costs, are held to a level below annual revenues. Until the City regains fiscal sustainability (base
operating costs are less than base revenues), service and staffing reductions will continue to be a
necessary consideration during the annual budget process.
CONCLUSION
The Proposed Budget reflects the significant fiscal challenges the City is facing including the unfunding
of hundreds of jobs, saving nearly $42 million in ongoing costs. The Proposed Budget ensures that the
City will continue providing core services. However, it is important to recognize that due to reduced
levels of funding provided in the Proposed Budget, on top of the reductions already implemented in the
FY2008/09 budget, the City will have to change what we do and how we do it in order to continue
providing major programs and services citywide. Even with these changes, the programs and services
FY2009/10 Approved Budget
28
Fines, Forf eitures
& Penalties
1.4%
Interest, Rents,
2.0%
Licenses
2.2%
Other Sources
26.9%
Intergovernmental
0.0%
Beginning
34.9%
4.5%
Contingency
8.3%
Property
2.4%
15.7%
18.9%
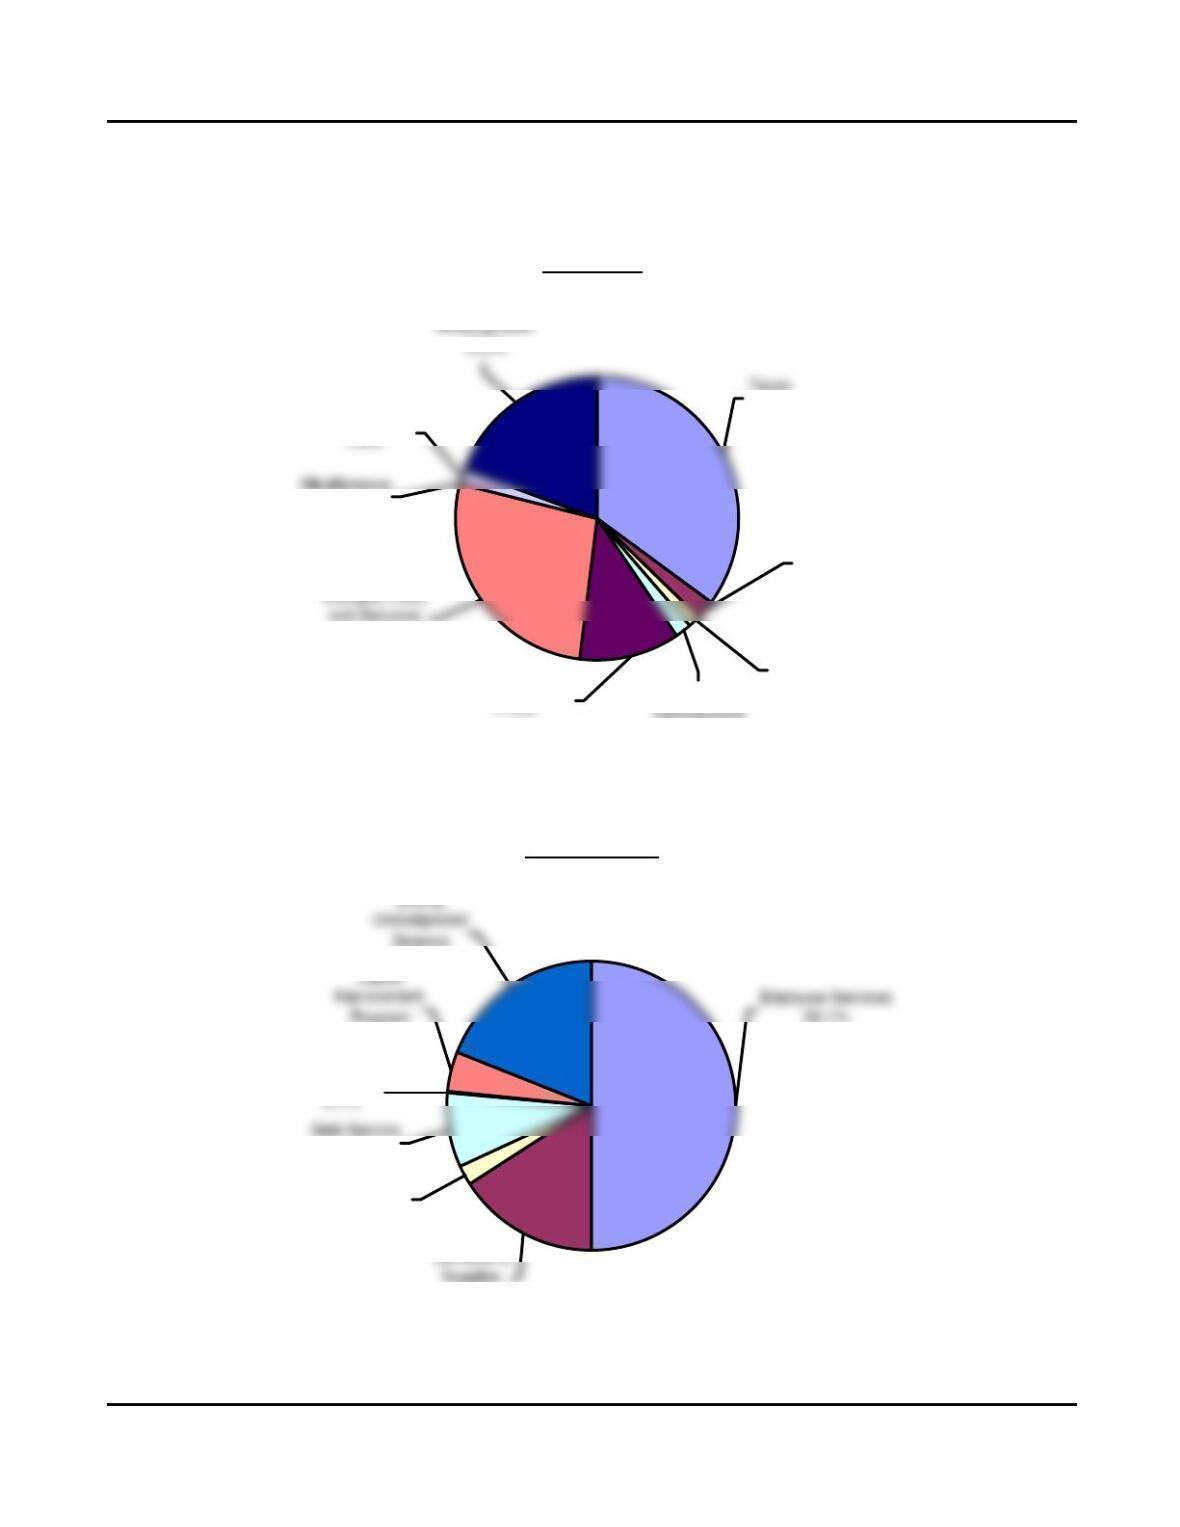
OTHER FINANCIAL INFORMATION
Total Proposed City Budget: $875.1 Million
Revenues
Expenditures

FY2009/10 Approved Budget
29
0.7%
Intergovernmental
13.0%
Charges, Fees,
and Services
2.8%
Contributions from
Other Funds
6.1% Other Sources
1.3%
71.9%
0.3%
0.4%
5.5%
0.5% Ending
0.0%
1.4%
Total Proposed General Fund Budget: $385.9 Million
Revenues
Expenditures

FY2009/10 Approved Budget
30
THIS PAGE LEFT INTENTIONALLY BLANK
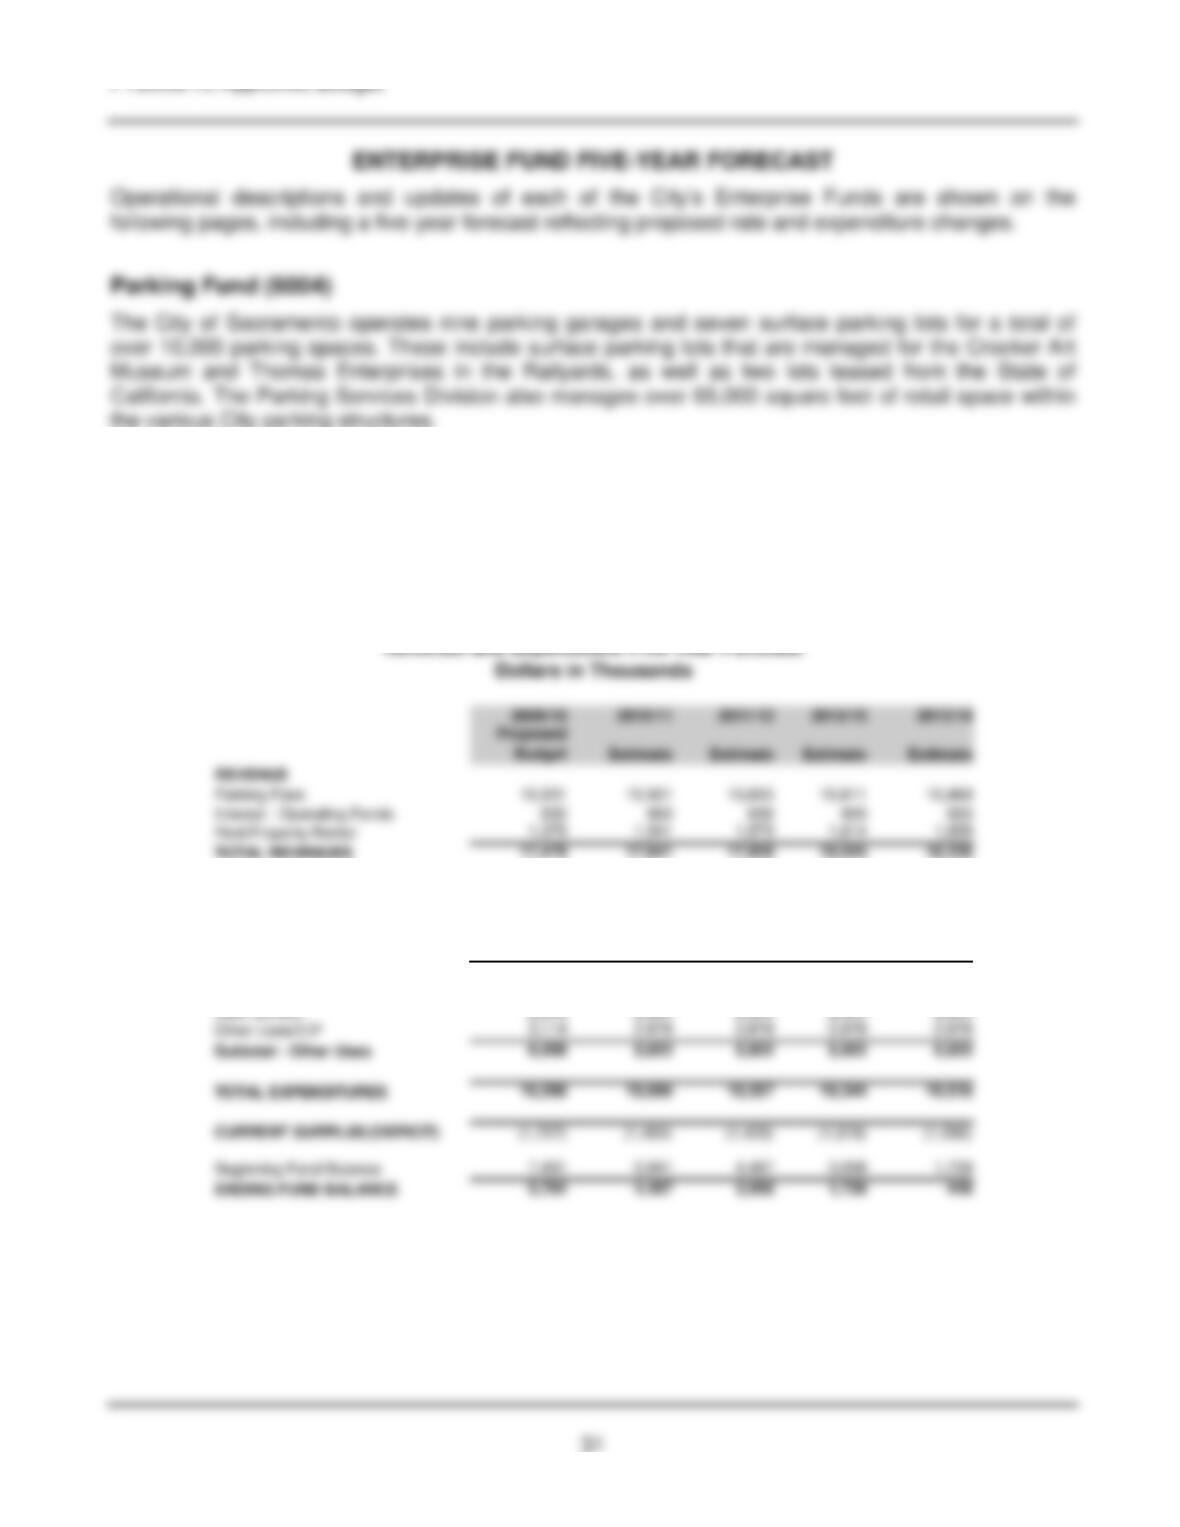
EXPENDITURES
Employee Services 4,305 4,433 4,564 4,698 4,834
Other Services & Supplies 7,343 7,380 7,417 7,454 7,491
Operating Transfer Out/(In) 1,500 1,461 1,454 1,371 1,371
Subtotal – Operating 13,148 13,274 13,435 13,522 13,696
Parking Fund (6004)
Parking fee revenues are projected to decrease 4.6 percent for FY2009/10 due to the downturn in the
economy. The revenue is expected to increase one percent annually beginning in FY2011/12 through
FY2013/14. Rental income is based on current and anticipated leases. Operating expenses are
projected to grow at approximately one percent annually.
FY2009/10 Approved Budget
32
Utilities Rate Advisory Commission
The City Council formed a Utilities Rate Advisory Commission (Commission) last year to provide
advice and recommendations to the Mayor and City Council on the City’s utility service rates. The
Commission is made up of community members, some of whom have expertise in the Utilities field.
Water Fund (6005)
Revenue generated by the City for the purpose of providing water service to its customers is deposited
in the Water Fund. Revenues are derived from customer fees, interest earnings, development fees, tap
sales, and reimbursements from other entities for services provided. Water Fund revenues are
structured to cover the costs of providing water service to our customers. Services include water
treatment, plant maintenance, water distribution system repair and maintenance, water conservation
Ongoing replacement and maintenance of aging infrastructure to provide safe and reliable
drinking water to the community and meet state and federal standards.
Continued implementation of the Residential Water Meter Installation Program in compliance
with the state mandate requiring installation of water meters citywide by the year 2025.
Maintaining state and federal regulatory compliance.
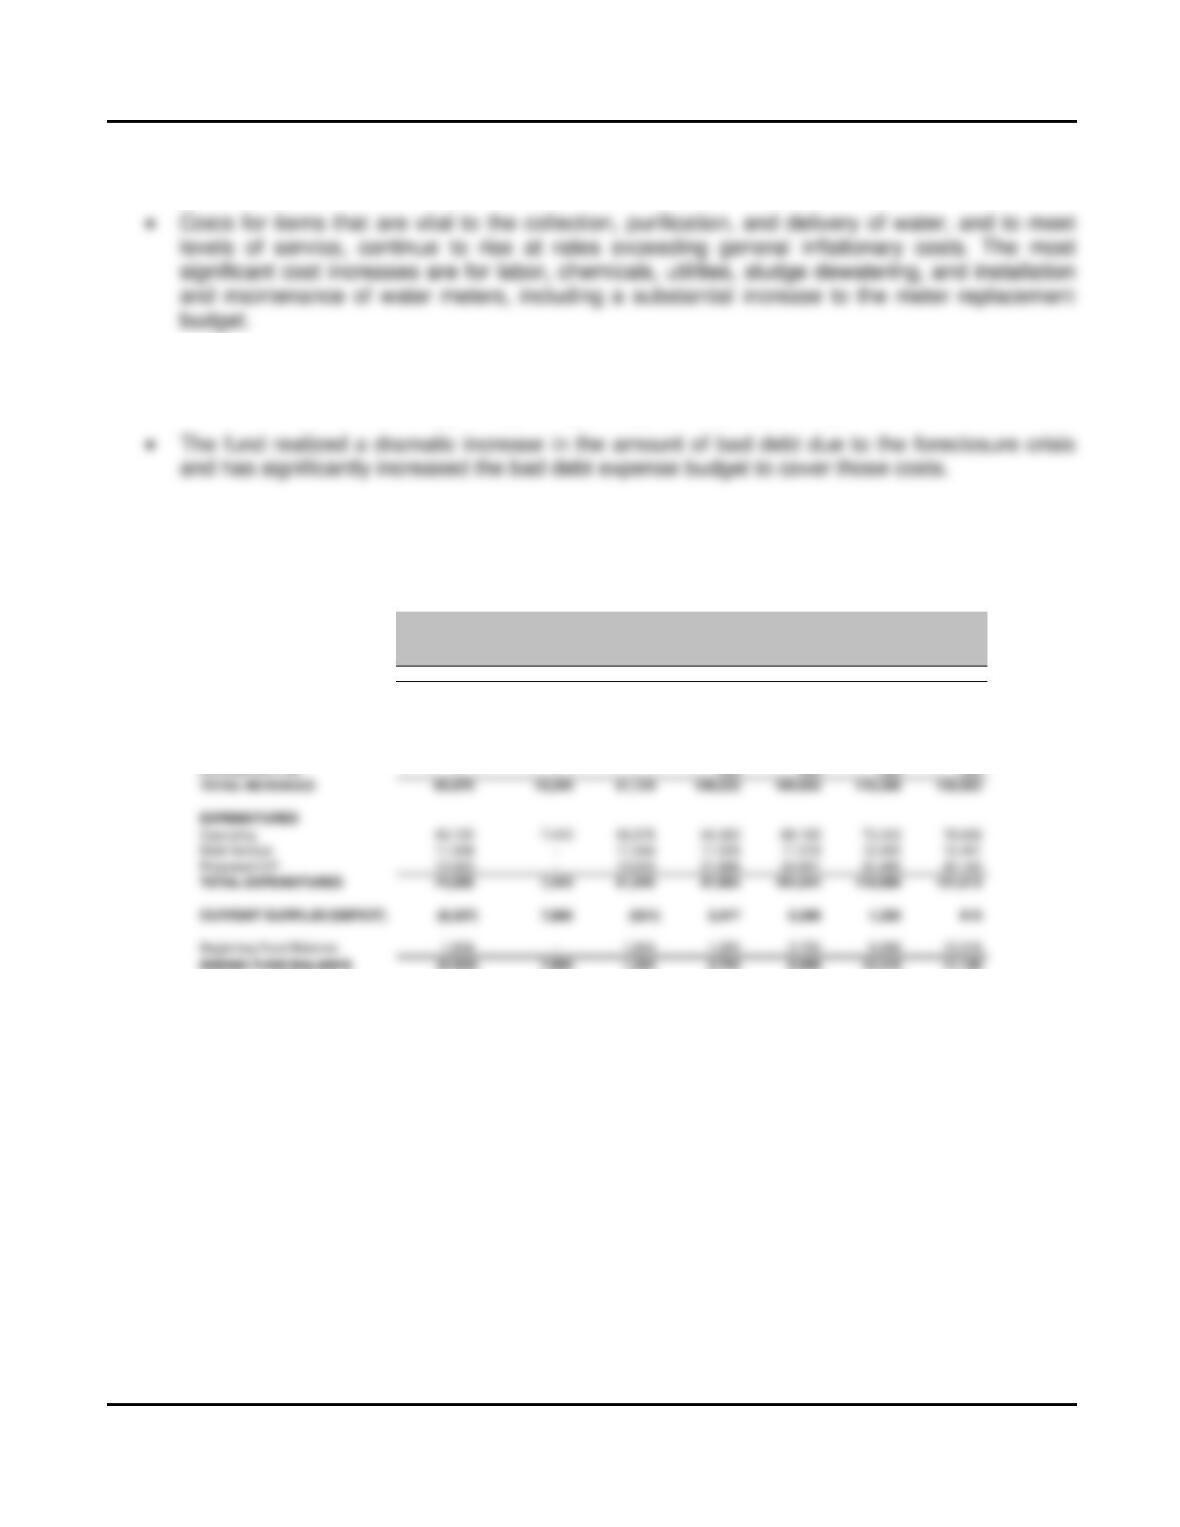
The following chart provides a five-year budget forecast for the Water Fund with proposed rate
increases of 25 percent for FY 2009/10 and FY2010/11 to address anticipated cost increases, meet
regulatory requirements and sustain a positive fund balance, and includes the following assumptions:
System growth will approximate zero percent annually over the next five years due to
decreased development.
FY2009/10 Approved Budget
33
2009/10 2009/10 2009/10 2010/11 2011/12 2012/13 2013/14
Base
Budget
Proposed
A
ugmentations
Proposed
Budget Estimate Estimate Estimate Estimate
Projected Rate Increase 25.00% 25.00% * * *
REVENUE
Charges, Fees and Services 62,697 14,960 77,657 96,203 105,823 114,289 128,004
Interest 2,398 2,398 2,433 2,433 2,433 2,433
Other/Misc. 780 289 1,069 1,336 1,336 1,336 1,336
Water Fund (6005)
Revenue and Expenditure Five Year Forecast
Dollars in Thousands
*Rate increases are projected between 8-12% in each fiscal year from 2011/12 to 2013/14 to meet operational expenses, address deferred
CIPs and accelerate implementation of the mandated water meter program.
Future capital spending will reflect continued implementation of the mandated water meter
program and a reasonable appropriation for infrastructure repair and rehabilitation.
In an effort to encourage water conservation, additional funds are budgeted for water
conservation programs and education and outreach. Additionally, funding is included to cover
costs incurred for increasingly stringent regulatory water quality testing.
FY2009/10 Approved Budget
34
Sewer Fund (6006)
Revenue generated by the City for the purpose of providing sewer collection service to its customers is
deposited in the Sewer Fund. Revenues are derived from customer service fees, recovery of
Sacramento Regional County Sanitation District (SRCSD) related operation and maintenance costs
paid for by the Fund, interest earnings, and connection charges. Sewer Fund revenues cover the cost
The sewer system is a “contained system” in that very little expansion other than in-fill projects is
possible. The City-operated sewer collection system serves approximately 60 percent of the City,
primarily the central and older sections of the City. The Sacramento Area Sanitation District is the
sewer collection system provider for the other areas of the City. The City’s sewage is treated by the
SRCSD, while the City provides the SRCSD with billing and collection services for properties within the
City service area.
The Sewer Fund presents unique challenges due to the system’s minimal growth potential and the age
and nature of the system’s infrastructure. Issues facing the Sewer Fund include:
Compliance with state and federal regulations, including state mandated rehabilitation of the
central City’s combined sewer and storm drainage system (CSS). The CSS collects both waste
water from homes and businesses as well as storm water and urban runoff.
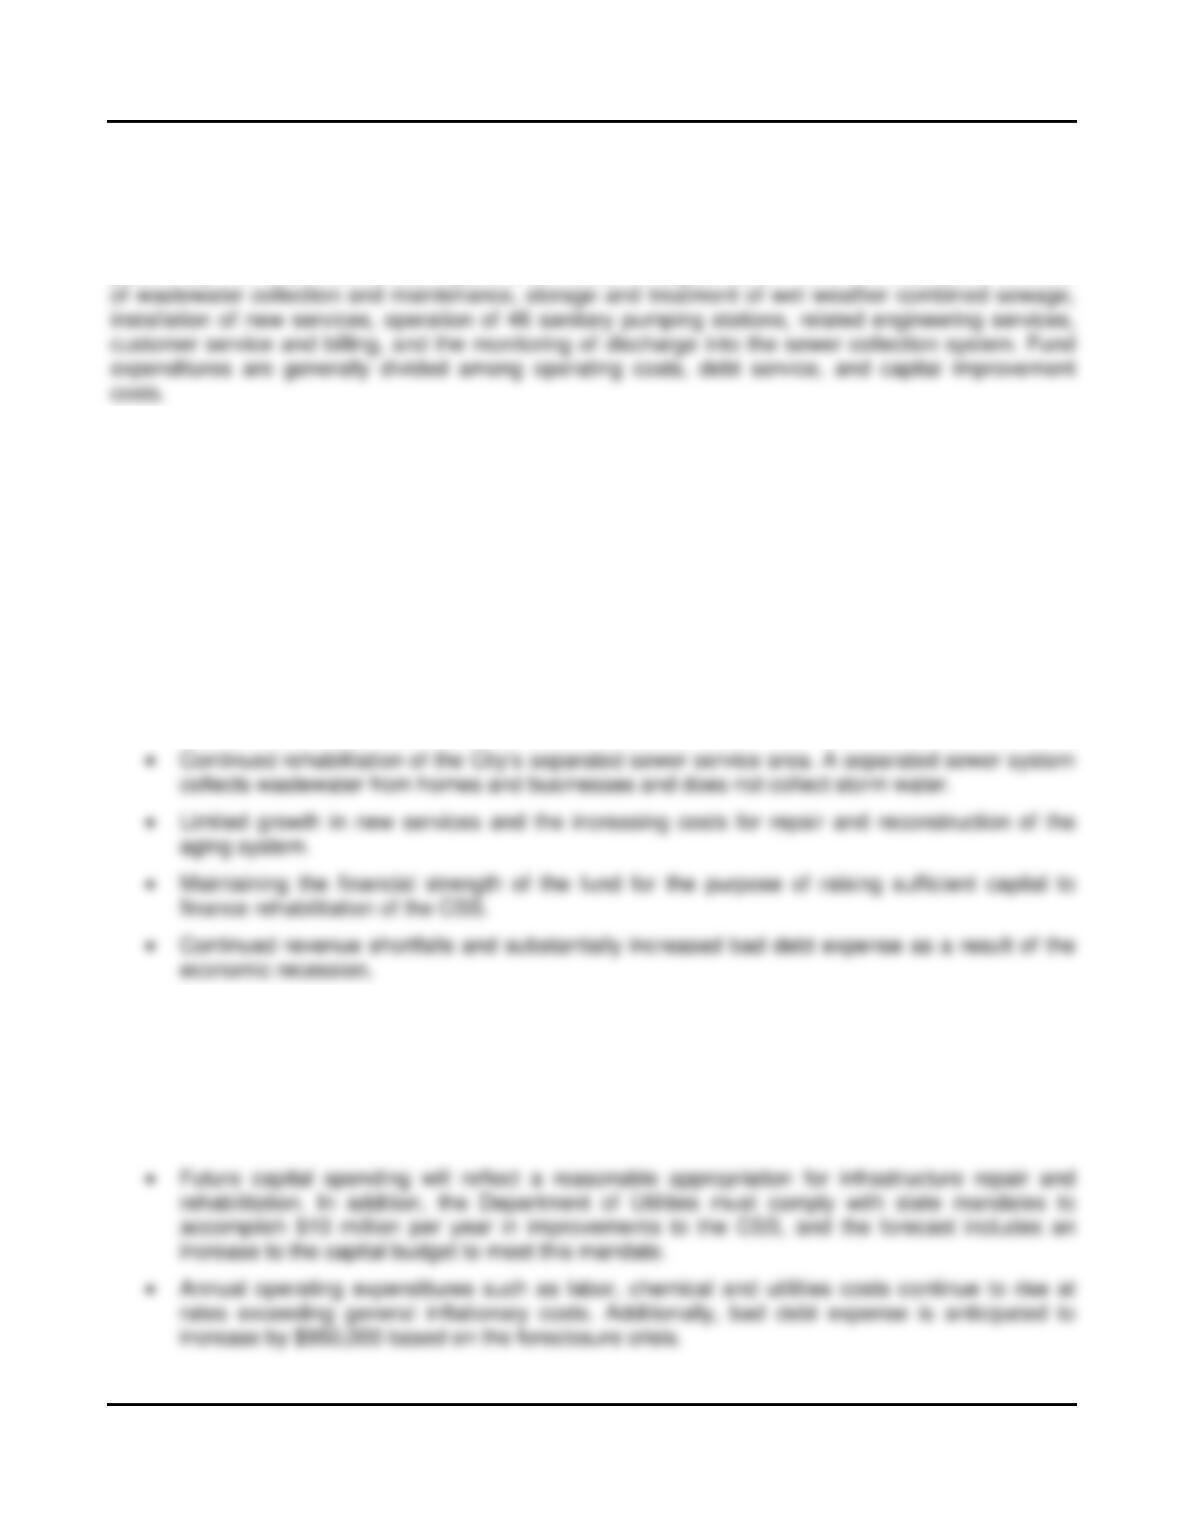
The following chart provides a five-year budget forecast for the Sewer Fund with proposed rate
increases of 15 percent for FY2009/10 and FY2010/11 to address anticipated cost increases, meet
regulatory requirements and sustain a positive fund balance. The forecast includes the following
assumptions:
Future growth in the system will approximate zero percent annually over the next five years due
to decreased development.
FY2009/10 Approved Budget
2009/10 2009/10 2009/10 2010/11 2011/12 2012/13 2013/14
Base
Budget
Proposed
A
ugmentations
Proposed
Budget Estimate Estimate Estimate Estimate
Projected Rate Increase 15.00% 15.00% * * *
REVENUE
Charges, Fees and Services 19,260 2,889 22,149 25,471 28,528 31,951 35,785
EXPENDITURES
Operating 17,042 1,852 18,894 20,443 21,426 22,563 23,903
Debt Service 973 – 973 973 973 859 859
CIP 3,315 – 3,315 5,765 7,985 10,219 12,468
Sewer Fund (6006)
Revenue and Expenditure Five Year Forecast
Dollars in Thousands
FY2009/10 Approved Budget
36
Solid Waste Fund (6007)
The Solid Waste Fund is financially responsible for the activities of collecting garbage, recyclables and
garden refuse; sweeping streets; removing illegally dumped materials from throughout the City; and
waste reduction. These solid waste activities serve three types of customers: residential, commercial,
and City facilities. Issues facing the Solid Waste Fund include:
Increasing need to develop a new disposal/facility plan that:
1. Incorporates areas north of the American River that reduces mileage;
Funding increasing costs for new/replacement equipment.
Meeting state mandated diversion goals.
Continued revenue shortfalls and substantially increased bad debt expense as a result of the
economic recession.
Costs for items vital to providing solid waste services and compliance with regulatory mandates
continue to rise. The most significant cost increases are labor, fleet (operation, maintenance and
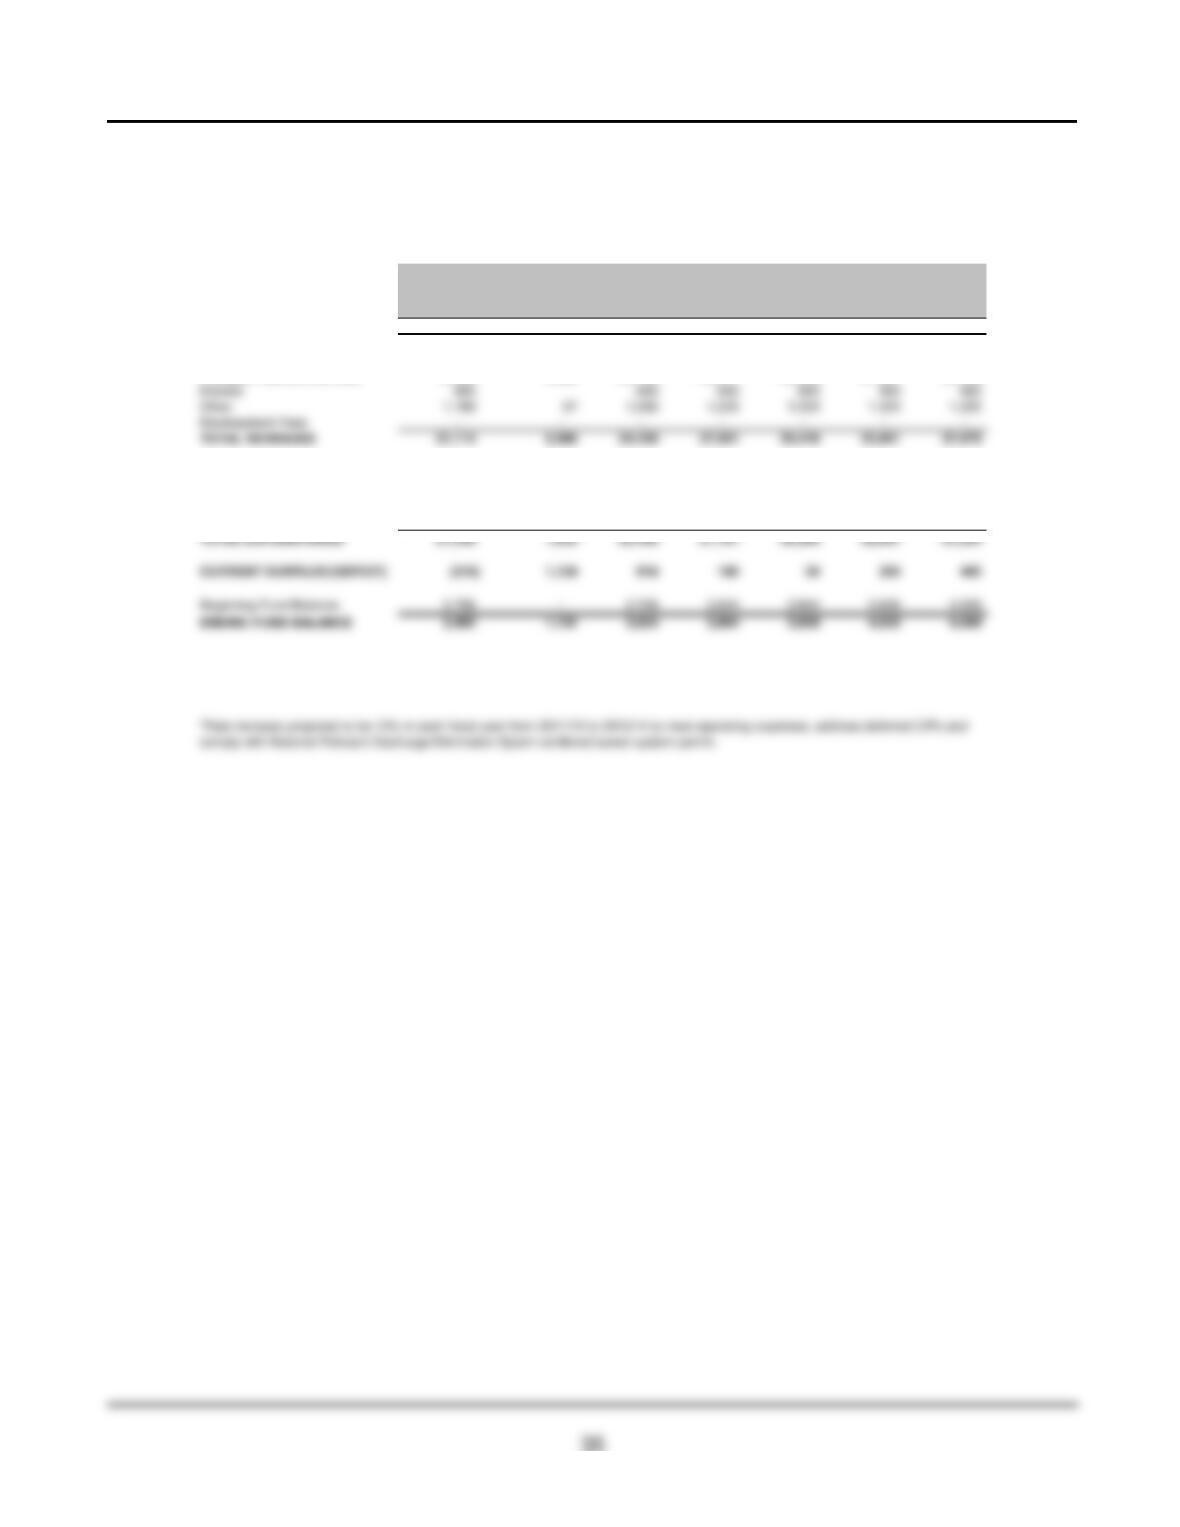
To achieve financial stability and restore a positive fund balance, a 15 percent rate increase in
FY2009/10 and FY2010/11 is being proposed.
The following chart provides a five-year budget and rate forecast:

FY2009/10 Approved Budget
37
2009/10 2009/10 2009/10 2010/11 2011/12 2012/13 2013/14
Base
Budget
Proposed
A
ugmentations
Proposed
Budget Estimate Estimate Estimate Estimate
Projected Rate Increase 15.00% 15.00% * * *
REVENUE
Charges, Fees and Services 54,712 5,878 60,590 68,758 68,758 68,758 68,758
Other/Misc. 735 735 1,535 1,535 1,535 1,535
Development Fees – – – – – – –
TOTAL REVENUES 55,447 5,878 61,325 70,293 70,293 70,293 70,293
CURRENT SURPLUS/(DEFICIT) (630) 3,654 3,024 3,654 2,753 4,170 (870)
Beginning Fund Balance (2,539) – (2,539) 485 4,139 6,892 11,062
ENDING FUND BALANCE (3,169) 3,654 485 4,139 6,892 11,062 10,192
Solid Waste Fund (6007)
Revenue and Expenditure Five Year Forecast
Dollars in Thousands
*Rate increases are expected to be nominal (0-5%) in each fiscal year from 2011/12 to 2013/14 to meet operating expenses, debt service
obligation and capital projects including landfill post closures.