Chapter 9
Corporate Valuation and Financial Planning
ANSWERS TO BEGINNING-OF–CHAPTER QUESTIONS
We like to use discussion questions along with relatively simple and easy to follow calculations
for our lectures. Unfortunately, forecasting is by its very nature relatively complex, and it simply
cannot be done in a realistic manner without using a spreadsheet. Accordingly, our primary
9-1 The major components of the strategic plan include the firm’s purpose, the scope of its
operations, its specific (quantified) objectives, its operating strategies, its operating
plan, and its financial plan.
Engineers, economists, marketing experts, human resources people, and so on all
9-2 a. The sales forecast is the primary driver of the financial plan. Forecasted sales
determine the amount of capacity needed, inventory and receivables levels, profits,
and capital requirements. If a company forecasts its sales incorrectly, this can be
disastrous, as Cisco and Lucent learned recently. We discuss sales forecasting in the
BOC model.
c. See the BOC model for a detailed explanation. Essentially, we project the assets that
will be required to support the forecasted level of sales, and we also project the
amount of funds that will be available from retained income and spontaneous sources
d. See the BOC model for a detailed explanation. Given the projected financial
statements, we can calculate various ratios, EPS, and FCF and then compare the
9-3 The performance of the firm could be compared with the industry average. Also, as
shown in the model, we could see how the firm’s ROE, EPS, etc. would look if it could
get its operating ratios to the same level as the industry average.
9-4 Managers are obviously concerned about forecast errors. The effects of such errors can
be analyzed by use of scenario and sensitivity analysis. Both types of analysis are
illustrated in the BOC model.
Answers and Solutions: 9 – 2
9-5 Economies of scale refer to situations where unit costs decline as sales increase. Lumpy
assets are assets that must be added in very large units, often resulting in excess capacity
immediately after they go on line and before sales can grow into them. Excess capacity
simply means that the firm could produce more than it is currently producing, in which
9-6 The AFN equation is useful in a pedagogic sense to get an idea of how sales increases
lead to required asset increases, and hence to a need for new capital. The equation is not
used in practice today because spreadsheet models provide so much more information
and are relatively easy to construct.
9-7 We could set the AFN equation up and use it to get an idea of the maximum sales growth
rate without external capital. However, we can use the model go get a better
approximation.
Answers and Solutions: 9 – 3
ANSWERS TO END-OF-CHAPTER QUESTIONS
9-1 a. The operating plan provides detailed implementation guidance designed to
b. Spontaneous liabilities are the first source of expansion capital as these accounts
increase automatically through normal business operations. Examples of spontaneous
liabilities include accounts payable, accrued wages, and accrued taxes. No interest is
normally paid on these spontaneous liabilities; however, their amounts are limited due
Answers and Solutions: 9 – 4
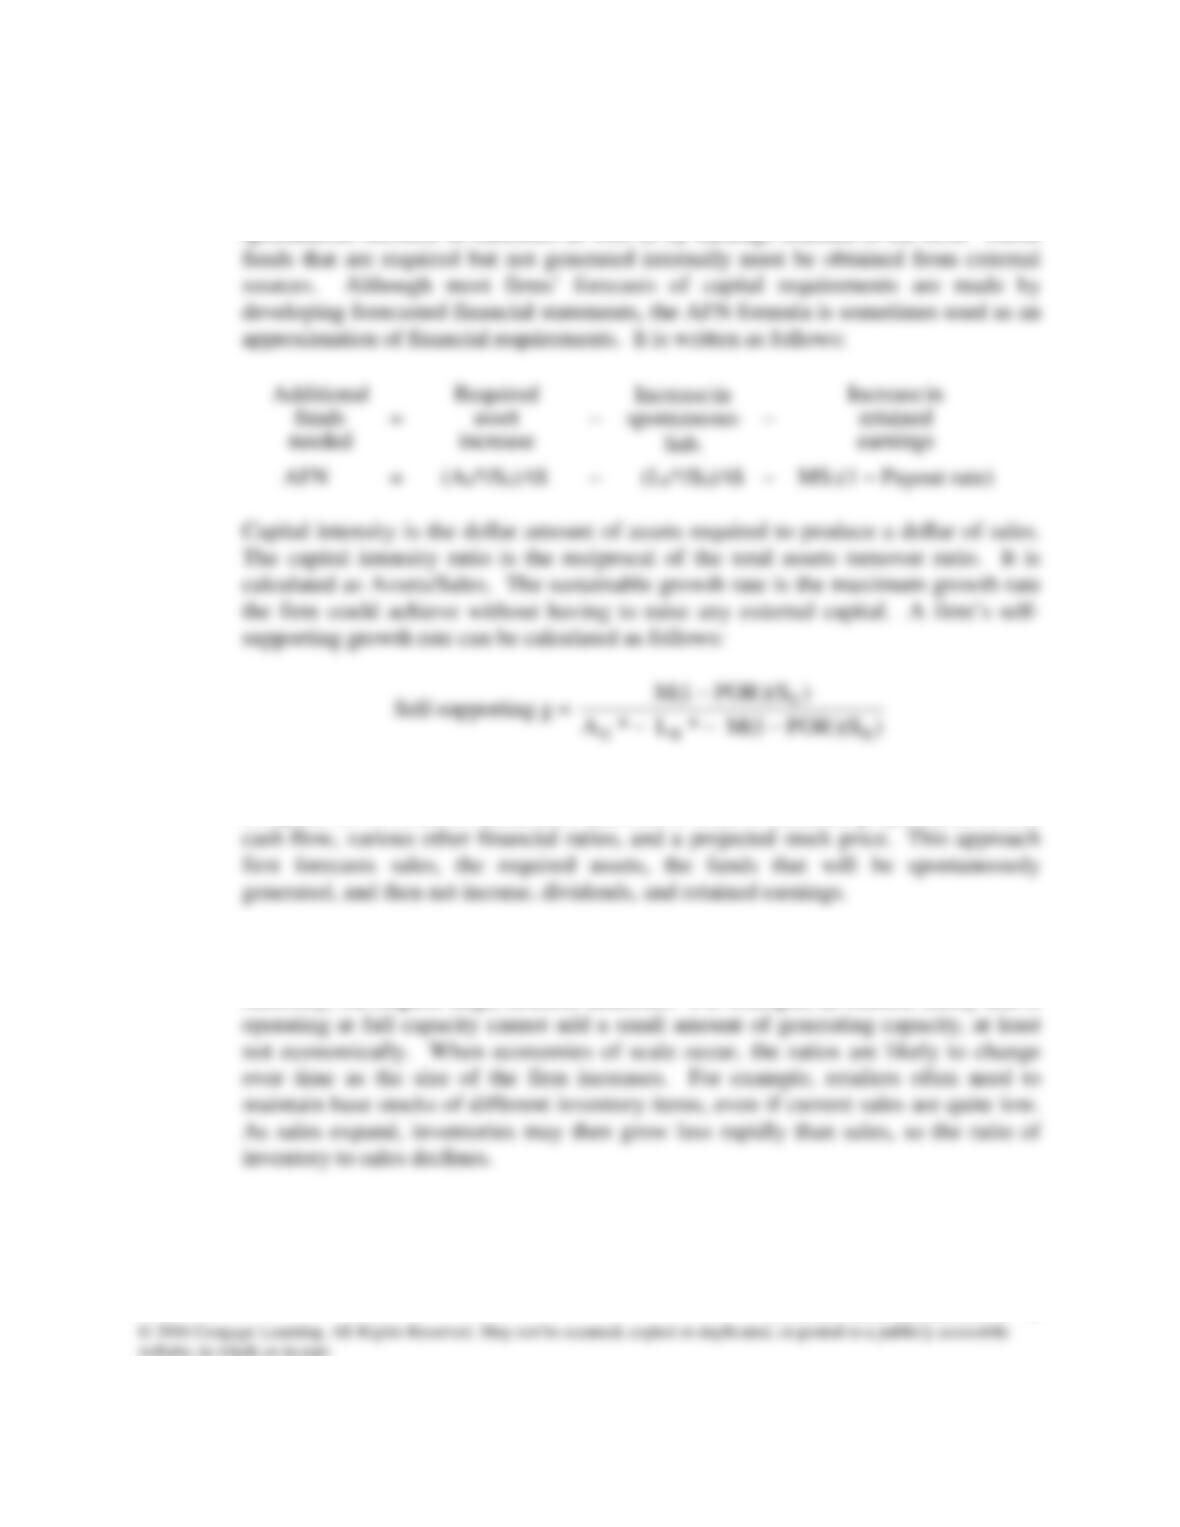
c. Additional funds needed (AFN) are those funds required from external sources to
increase the firm’s assets to support a sales increase. A sales increase will normally
require an increase in assets. However, some of this increase is usually offset by a
spontaneous increase in liabilities as well as by earnings retained in the firm. Those
d. The forecasted financial statement approach using percent of sales develops a
complete set of financial statements that can be used to calculate projected EPS, free
e. A firm has excess capacity when its sales can grow before it must add fixed assets
such as plant and equipment. “Lumpy” assets are those assets that cannot be acquired
smoothly, but require large, discrete additions. For example, an electric utility that is
Answers and Solutions: 9 – 5
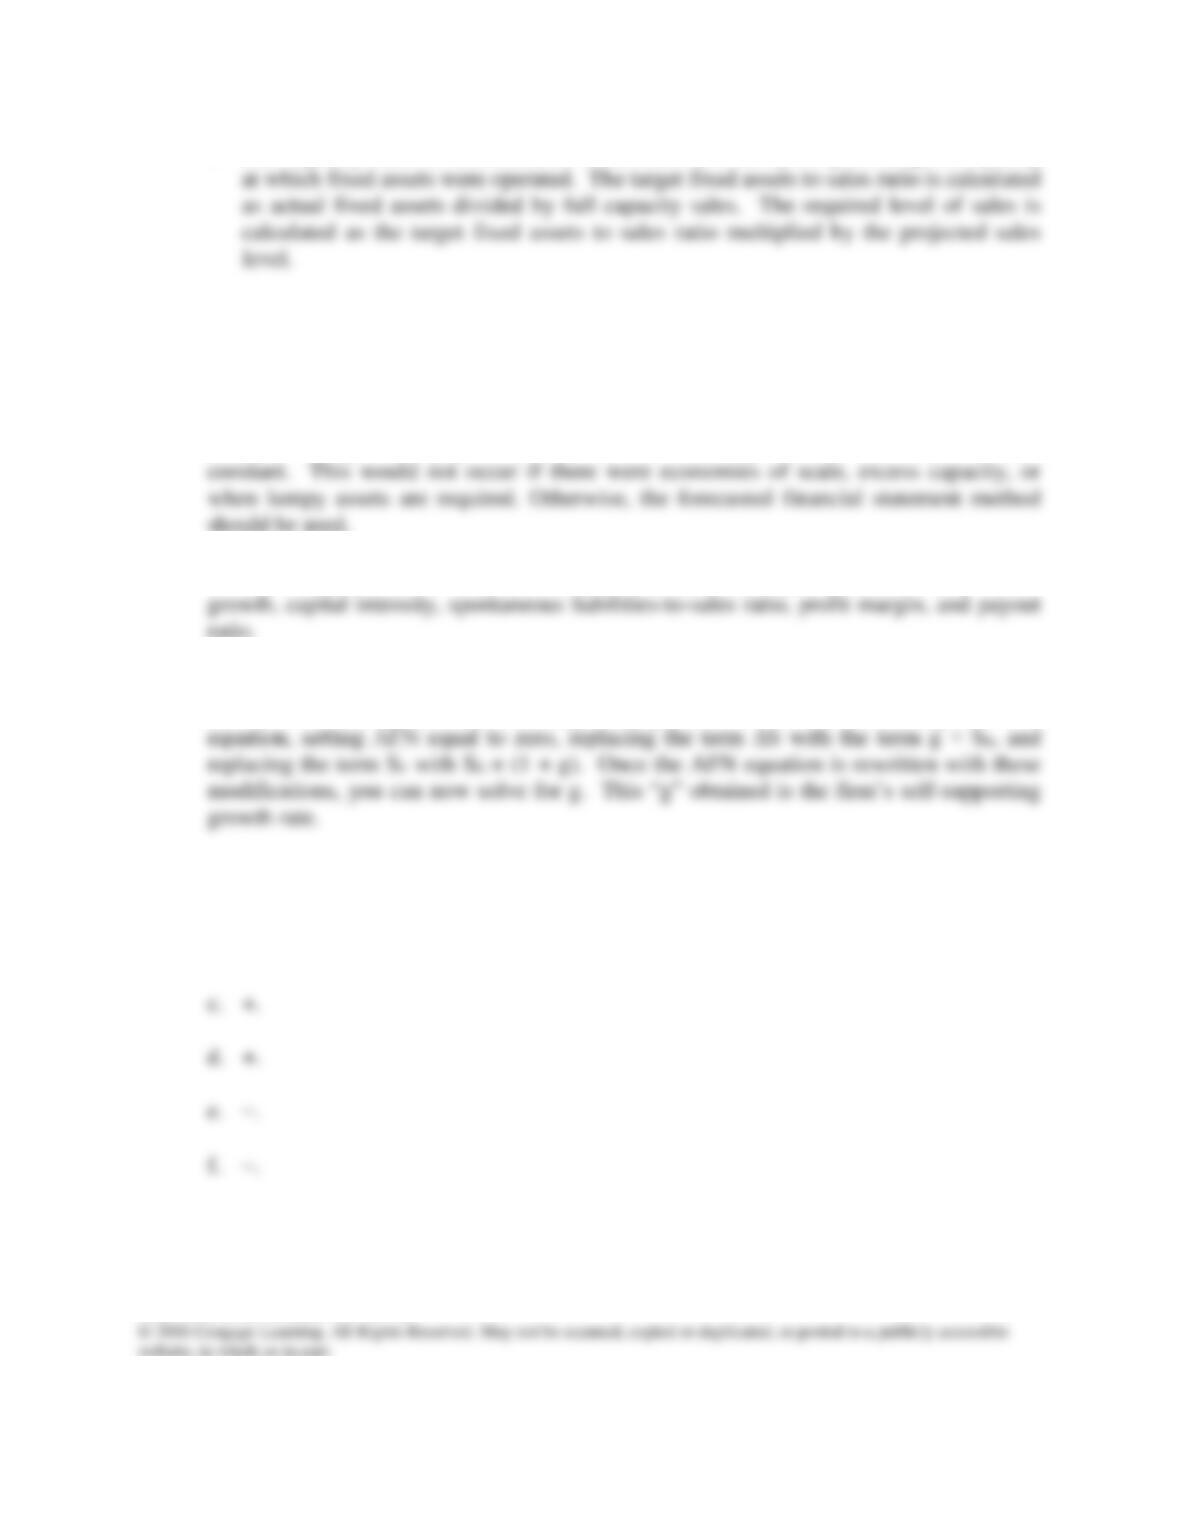
f. Full capacity sales are calculated as actual sales divided by the percentage of capacity
9-2 Accounts payable, accrued wages, and accrued taxes increase spontaneously. Retained
earnings may or may not increase, depending on profitability and dividend payout policy.
9-3 The equation gives good forecasts of financial requirements if the ratios A0*/S and L0*/S,
the profit margin, and payout ratio are stable. This equation assumes that ratios are
9-4 The five key factors that impact a firm’s external financing requirements are: Sales
9-5 The self-supporting growth rate is the maximum rate a firm can achieve without having
to raise external capital. The self-supporting growth rate is calculated using the AFN
9-6 a. +.
b. +. It reduces spontaneous funds; however, it may eventually increase retained
earnings.
Answers and Solutions: 9 – 6
SOLUTIONS TO END-OF-CHAPTER PROBLEMS
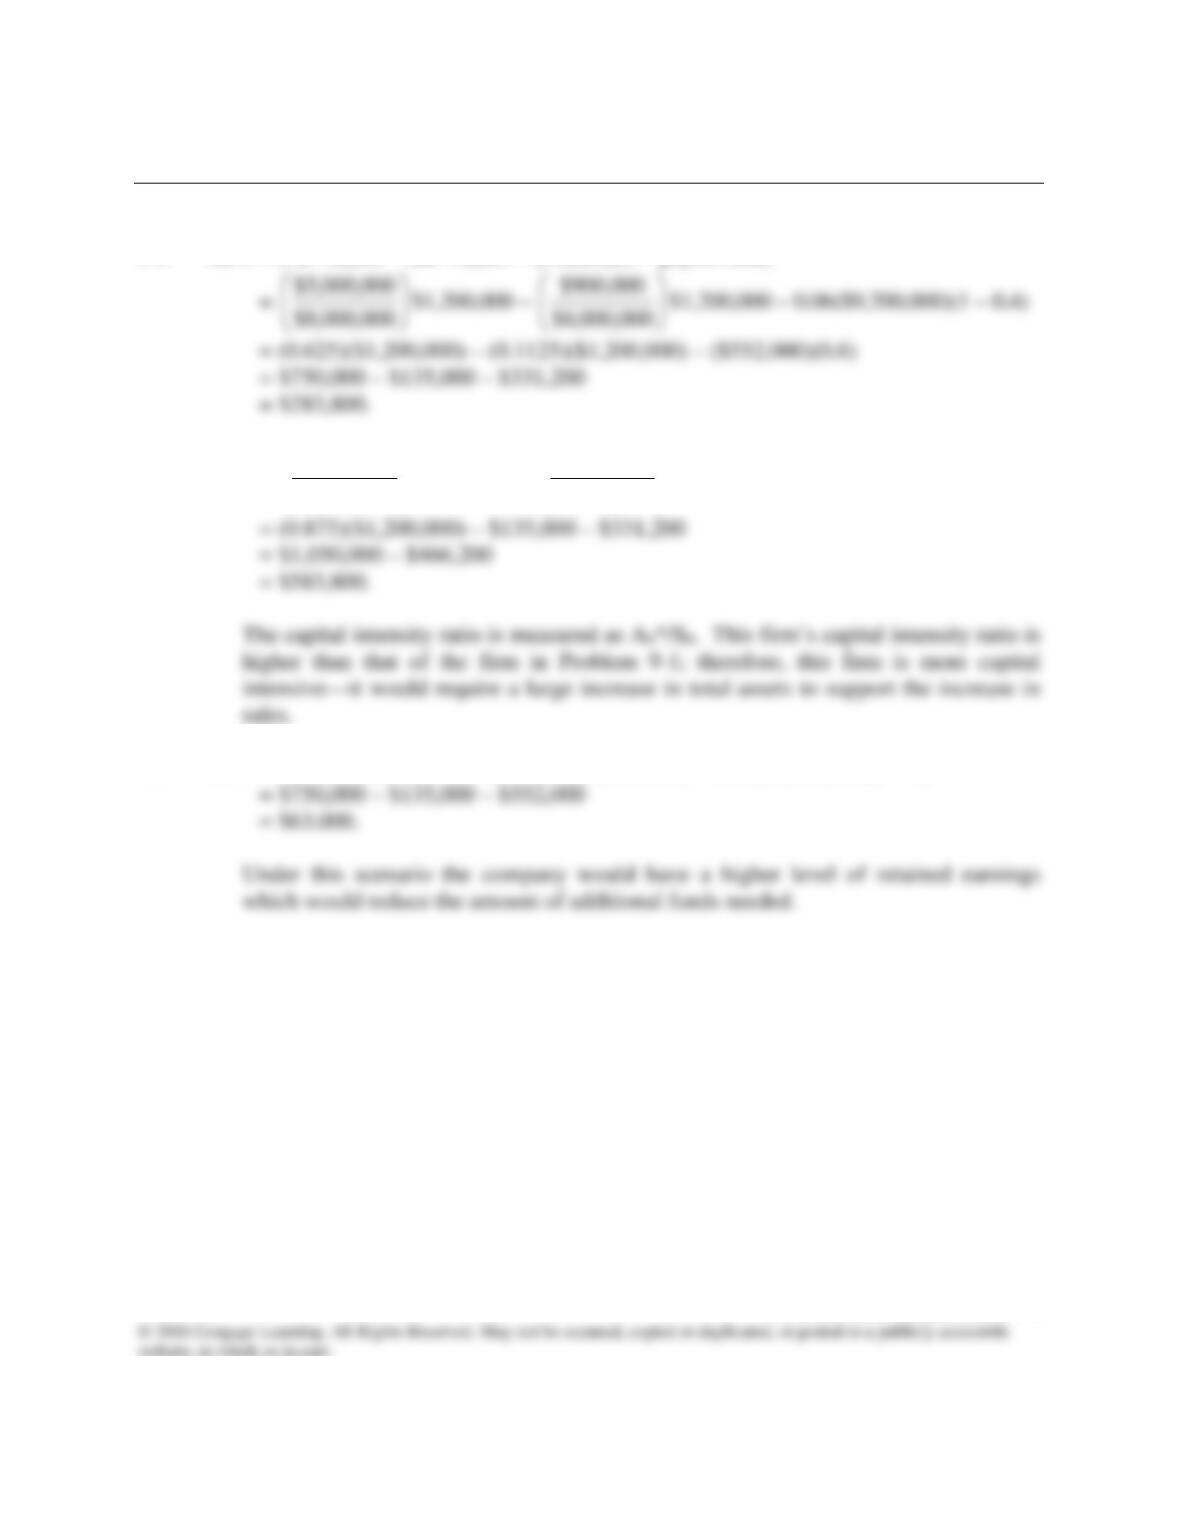
9-1 AFN = (A0*/S0)∆S – (L0*/S0)∆S – (PM)(S1)(1 – payout rate)
9-2 AFN =
000,000,8$
000,000,7$
$1,200,000 –
000,000,8$
000,900$
$1,200,000 – 0.06($9,200,000)(1 – 0.4)
9-3 AFN = (0.625)($1,200,000) – (0.1125)($1,200,000) – 0.06($9,200,000)(1 – 0)
Answers and Solutions: 9 – 7
000,000,8$
000,000,8$
000,900$
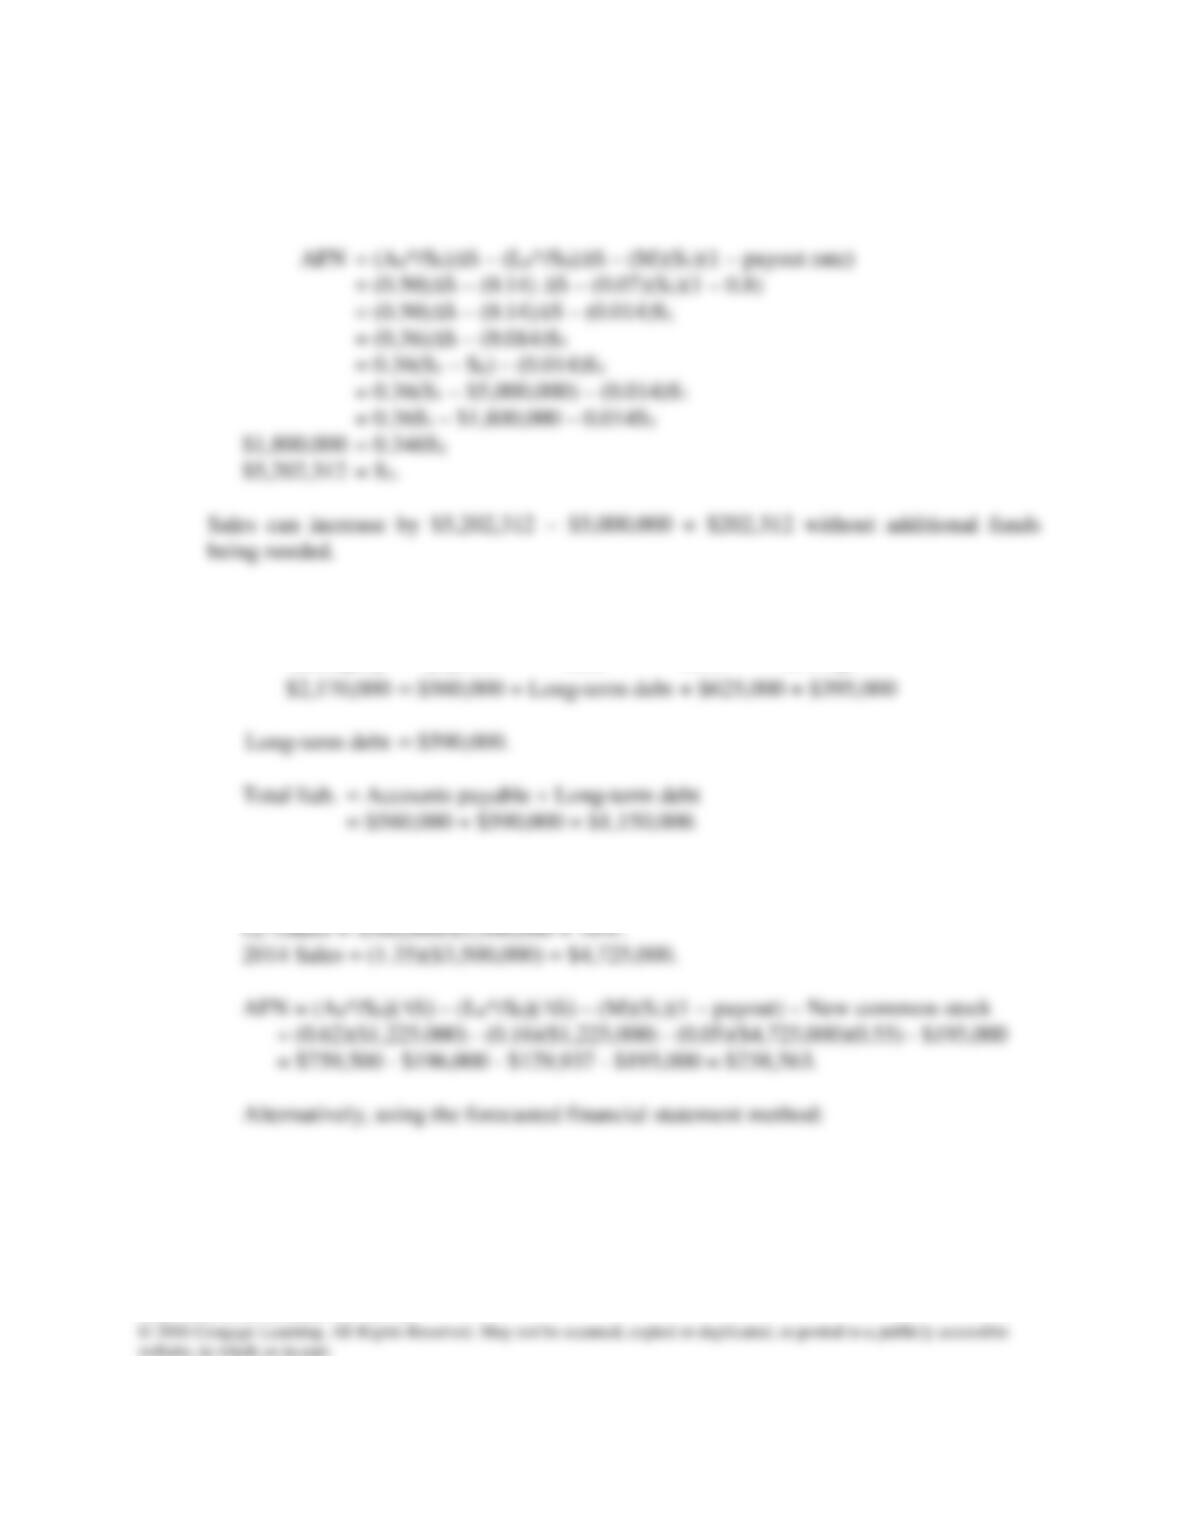
9-4 S0 = $5,000,000; A0* = $2,500,000; CL = $700,000; NP = $300,000; AP = $500,000;
Accruals = $200,000; M = 7%; payout ratio = 80%; A0*/S0 = 0.50; L0* = (AP +
Accruals)/S0 = ($500,000 + $200,000)/$5,000,000 = 0.14.
9-5 a.
equity and
liab. Total
=
payable
Accounts
+
debt
term–Long
+
stock
Common
+
earnings
Retained
b. Assets/Sales (A0*/S0) = $2,170,000/$3,500,000 = 62%.
Answers and Solutions: 9 – 8
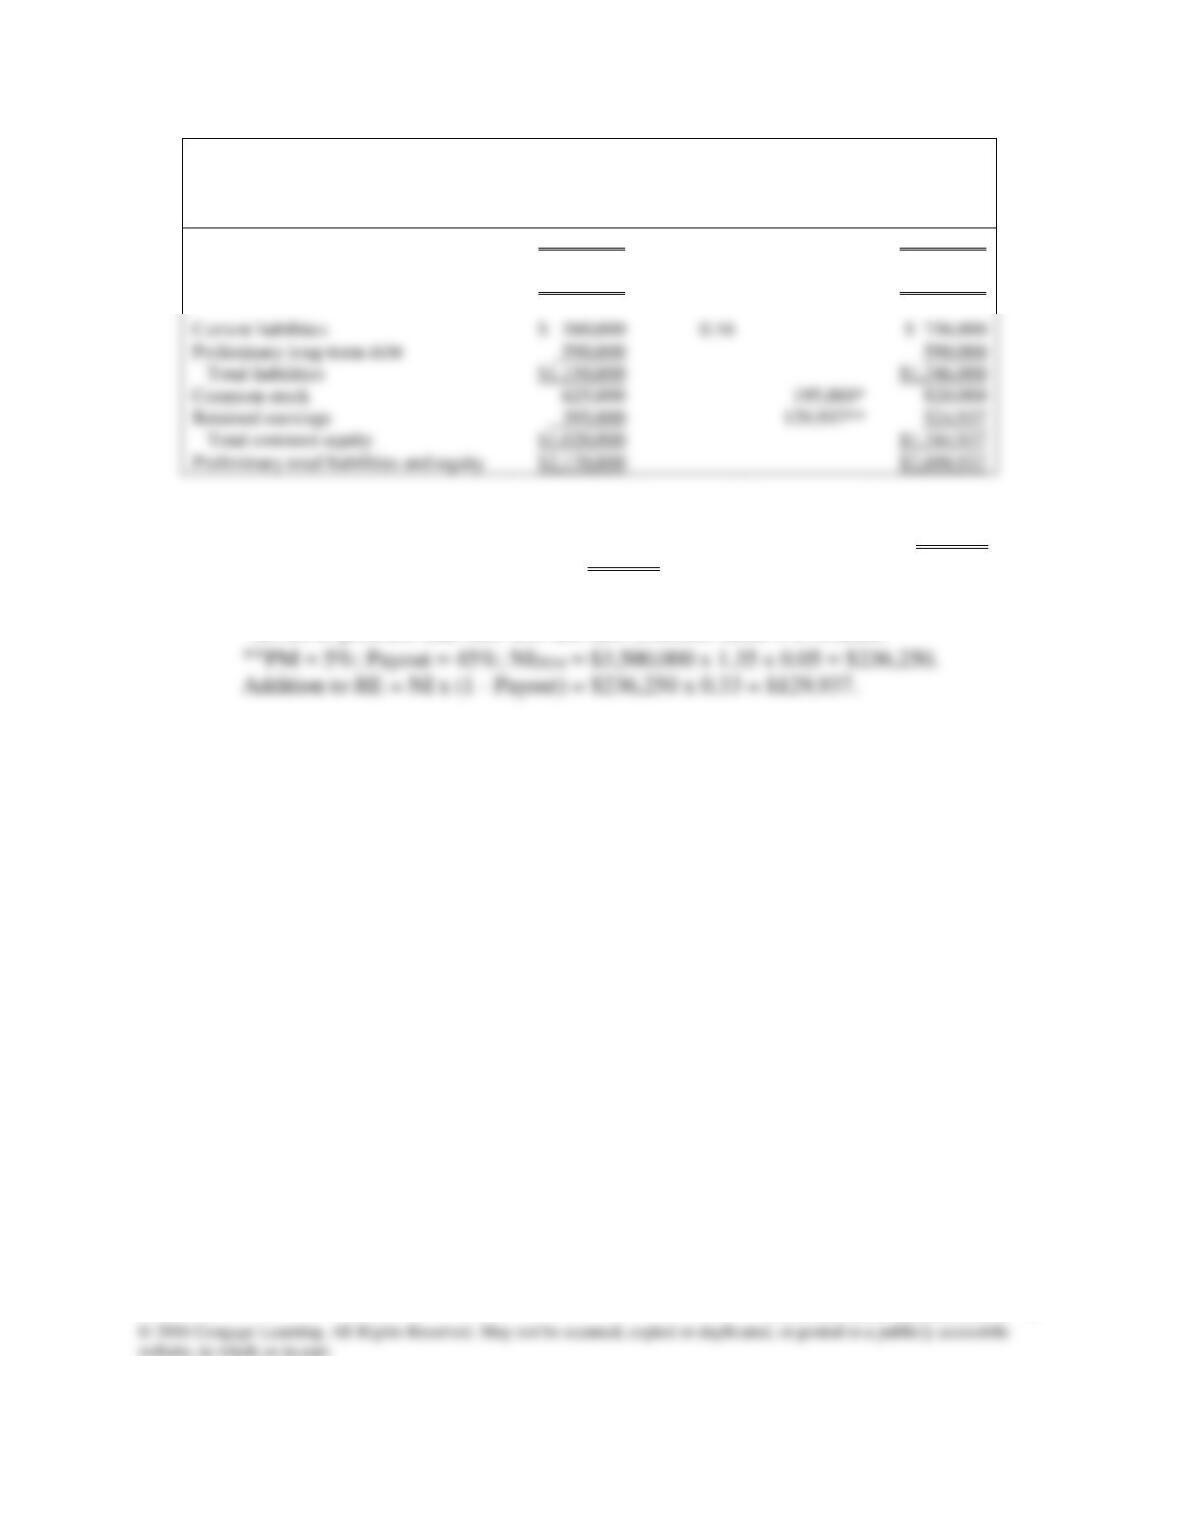
2015
Forecast
basis is %
of 2015
Sales
Additions
(New
Financing and
ΔRE)
2016
Sales
$3.500,000
$4,725,000
Total assets
$2,170,000
0.62
$2,929,500
AFN = Total assets – Preliminary total liabilities & equity = S2,929,500 – 2,690,937 = $238,563
AFN = Additional required long–term debt =$238,563
*Given in problem that firm will sell new common stock = $195,000.
Answers and Solutions: 9 – 9
Current liabilities
0.16
Preliminary total liabilities and equity
$2,170,000
$2,690,937
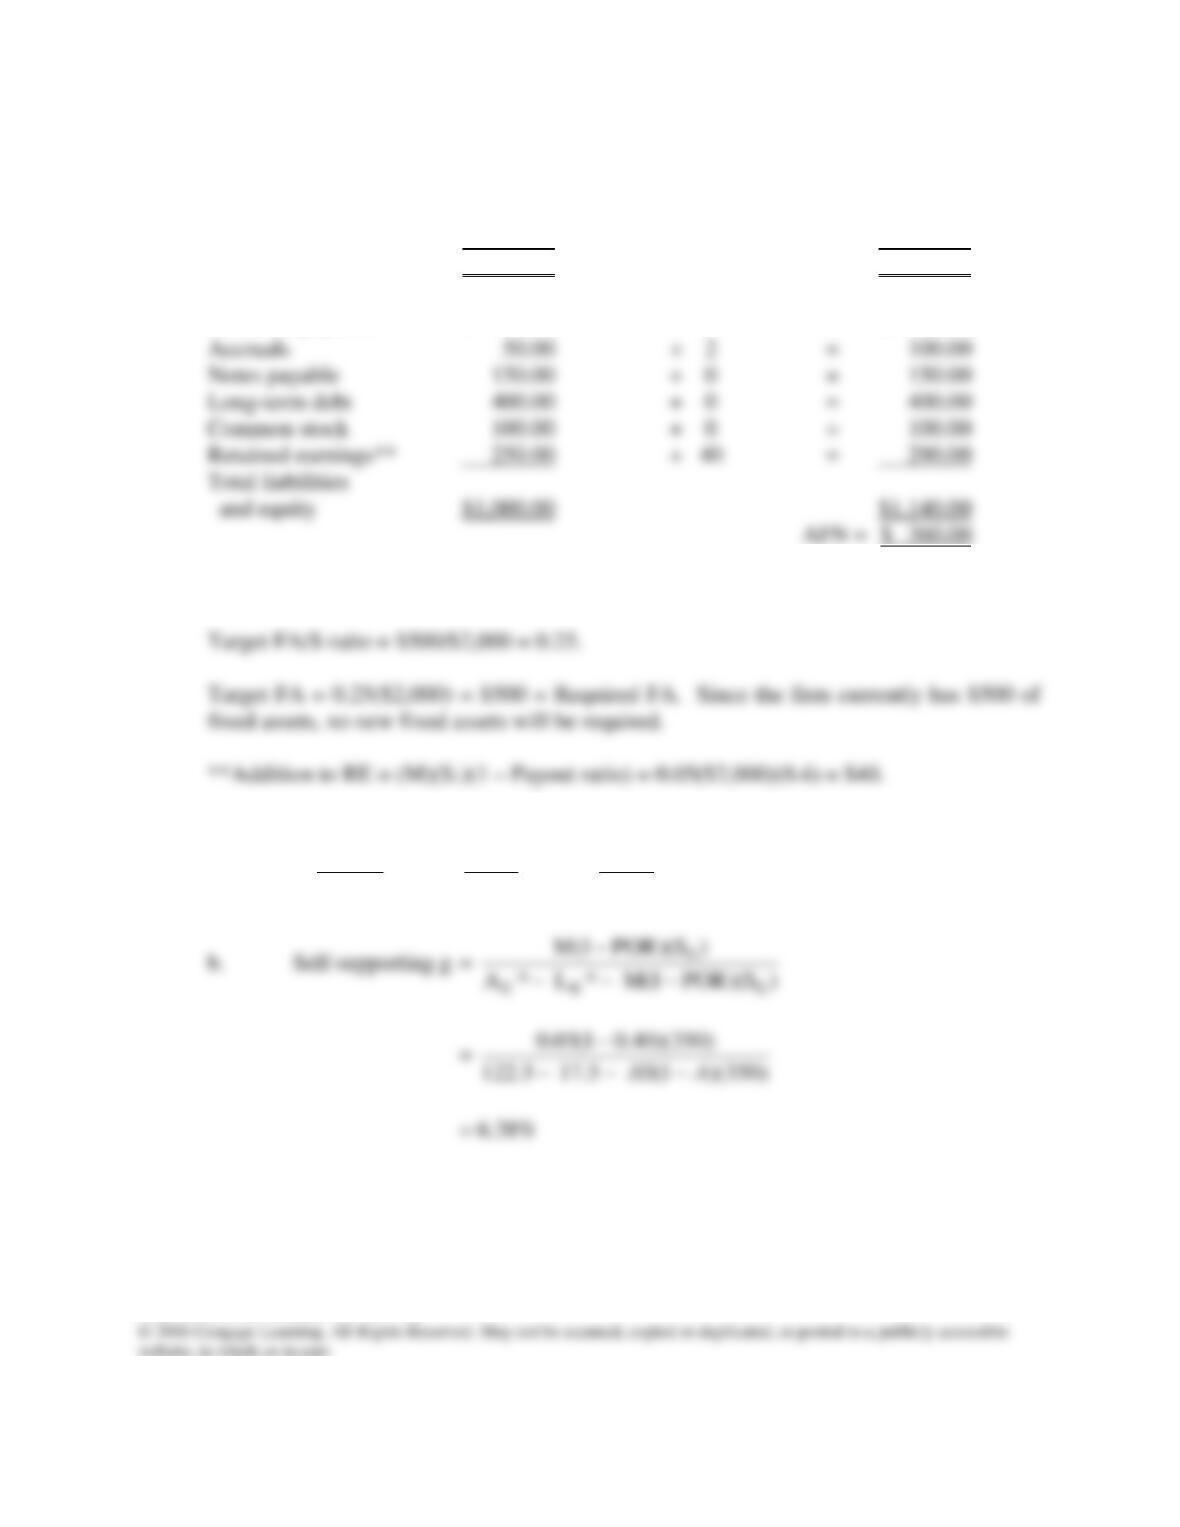
9-6 Cash $ 100.00 × 2.0 = $ 200.00
Accounts receivable 200.00 × 2.0 = 400.00
Inventories 200.00 × 2.0 = 400.00
Net fixed assets* 500.00 × 1.0 = 500.00
Total assets $1,000.00 $1,500.00
Accounts payable $ 50.00 × 2 = $ 100.00
*Capacity sales = Sales/0.5 = $1,000/0.5 = $2,000 with respect to existing fixed assets.
9-7 a. AFN = (A0*/S0)(∆S) – (L0*/S0)(∆S) – (M)(S1)(1 – payout)
=
350$
5.122$
($70) –
350$
5.17$
($70) –
350$
5.10$
($420)(0.6) = $13.44 million.
Answers and Solutions: 9 – 10
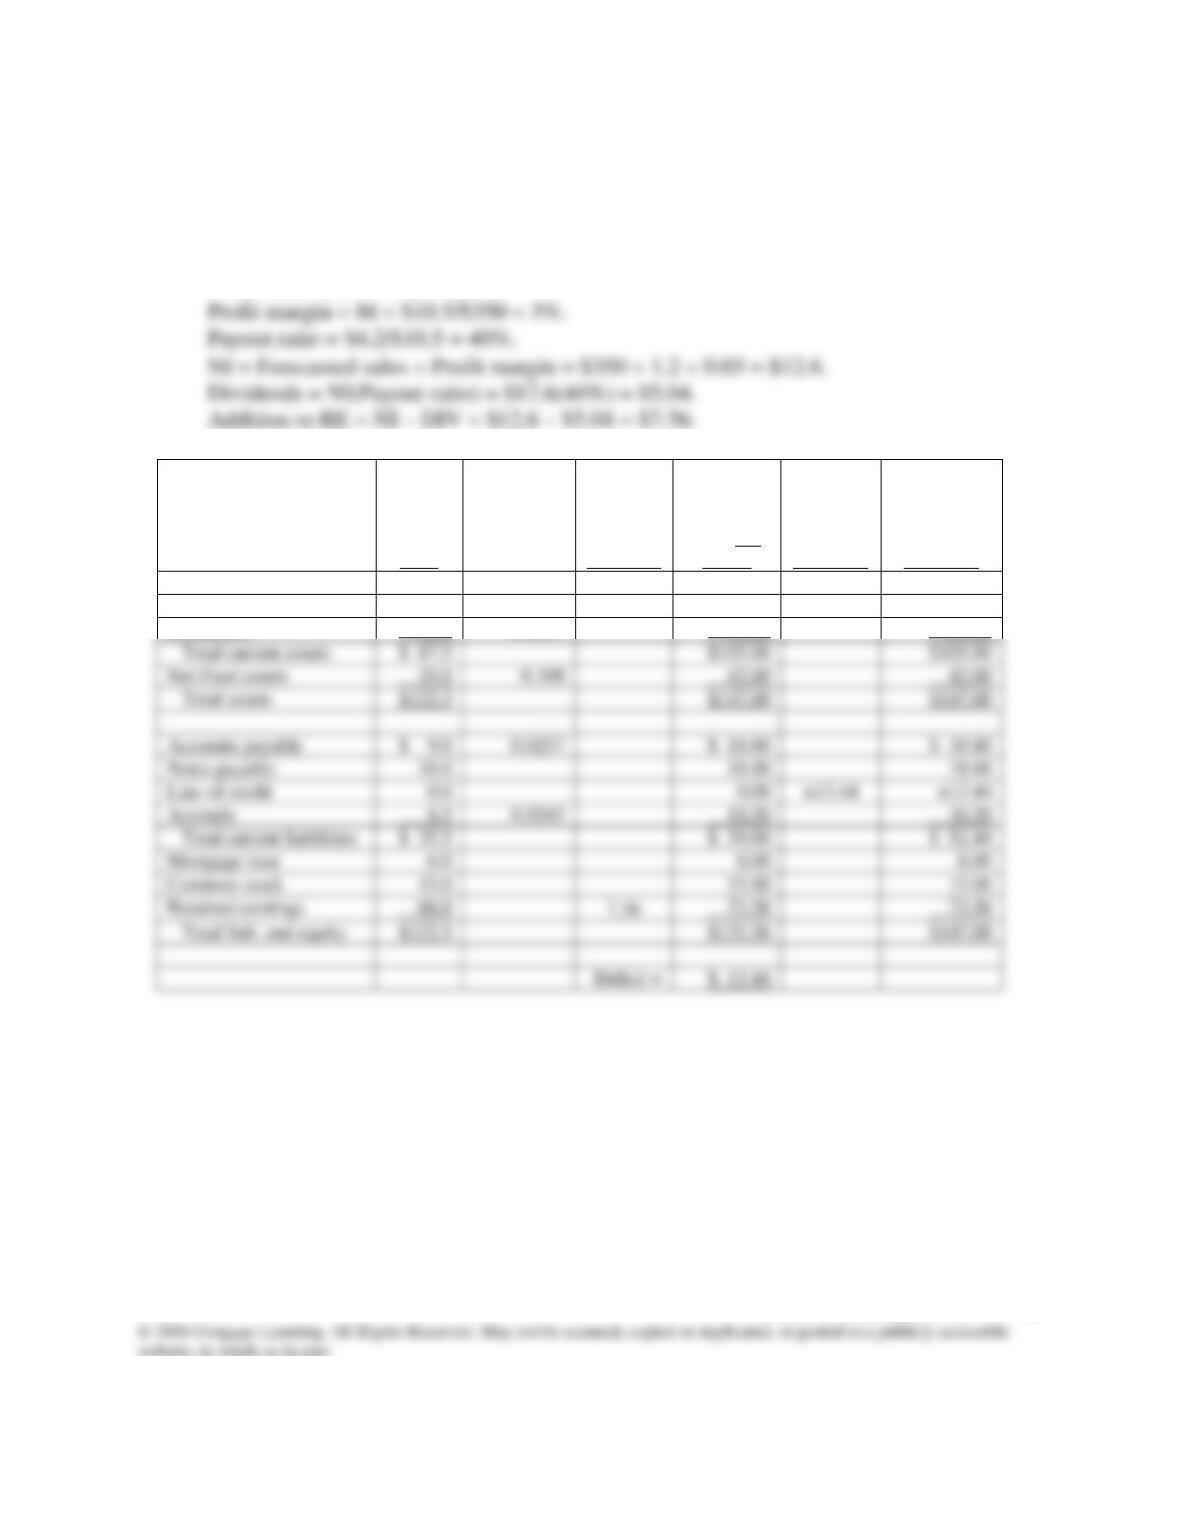
c. Upton Computers
Pro Forma Balance Sheet
December 31, 2016
(Millions of Dollars)
Forecasted sales = $420 million
2015
Forecast
Basis:
Percent of
forecasted
sales
Additions
2016 Pro
Forma
Financing
2016 Pro
Forma after
Financing
Cash
$ 3.5
0.0100
$ 4.20
$ 4.20
Receivables
26.0
0.0743
31.20
31.20
Inventories
58.0
0.1657
69.60
69.60
$ 87.5
$105.00
35.0
42.00
42.00
$147.00
Accounts payable
$ 9.0
0.0257
$ 10.80
$ 10.80
18.0
18.00
18.00
8.5
0.0243
10.20
10.20
$ 35.5
$ 39.00
$ 52.44
15.0
15.00
15.00
$147.00
$ 13.44
Answers and Solutions: 9 – 11

9-8 Stevens Textiles
Pro Forma Income Statement
December 31, 2016
(Thousands of Dollars)
a.
2016
Forecast 2016
2015 Basis Pro Forma
Sales $36,000 1.15 × Sales15 $41,400
Answers and Solutions: 9 – 12
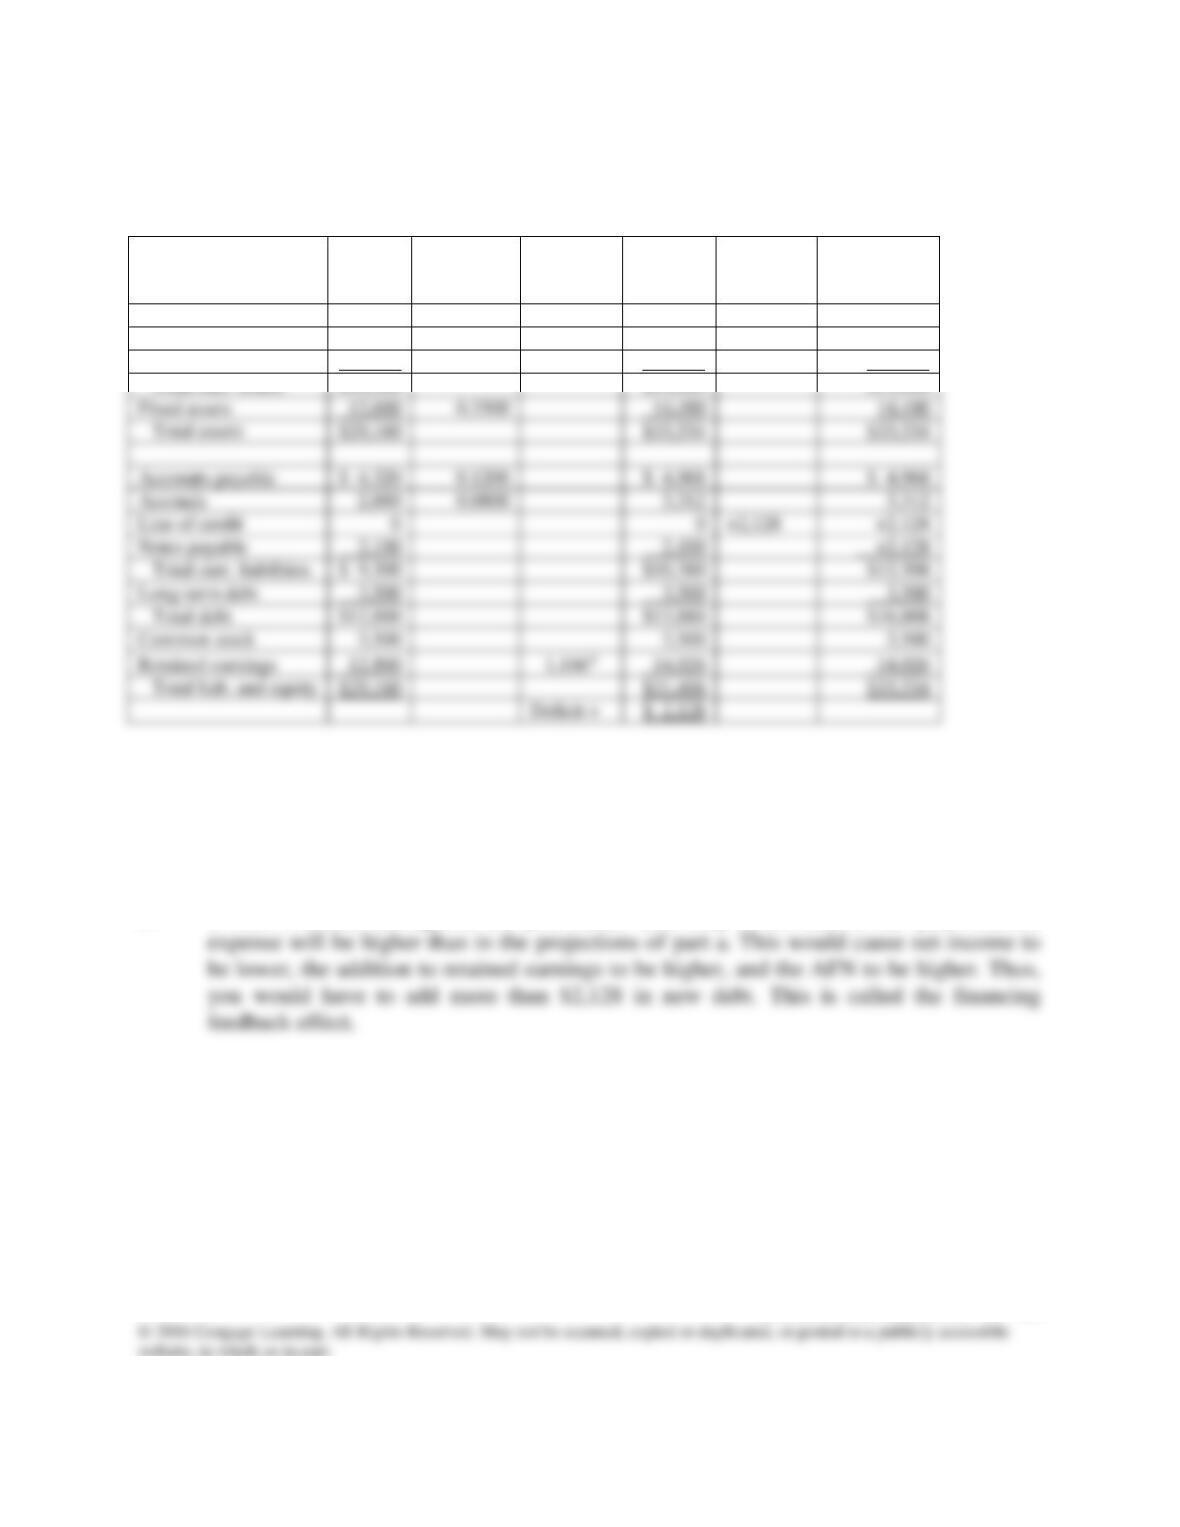
Stevens Textiles
Pro Forma Balance Sheet
December 31, 2016
(Thousands of Dollars)
2015
Forecast
Basis %
2016 Sales
Additions
2016 Pro
Forma
2016
Financing
2016 Pro
Forma after
Financing
Cash
$ 1,080
0.0300
$ 1,242
$ 1,242
Accts receivable
6,480
0.1800
7,452
7,452
Inventories
9,000
0.2500
10,350
10,350
*From income statement.
b. Line of credit = $2,128 (thousands of $).
c. If debt is added throughout the year rather than only at the end of the year, interest
Answers and Solutions: 9 – 13
Total curr. assets
Fixed assets
12,600
0.3500
14,490
Total assets
Accounts payable
$ 4,320
0.1200
$ 4,968
$ 4,968
2,880
0.0800
3,312
3,312
Line of credit
Notes payable
2,100
2,100
Total curr. liabilities
$ 9,300
3,500
3,500
3,500
Total debt
3,500
3,500
3,500
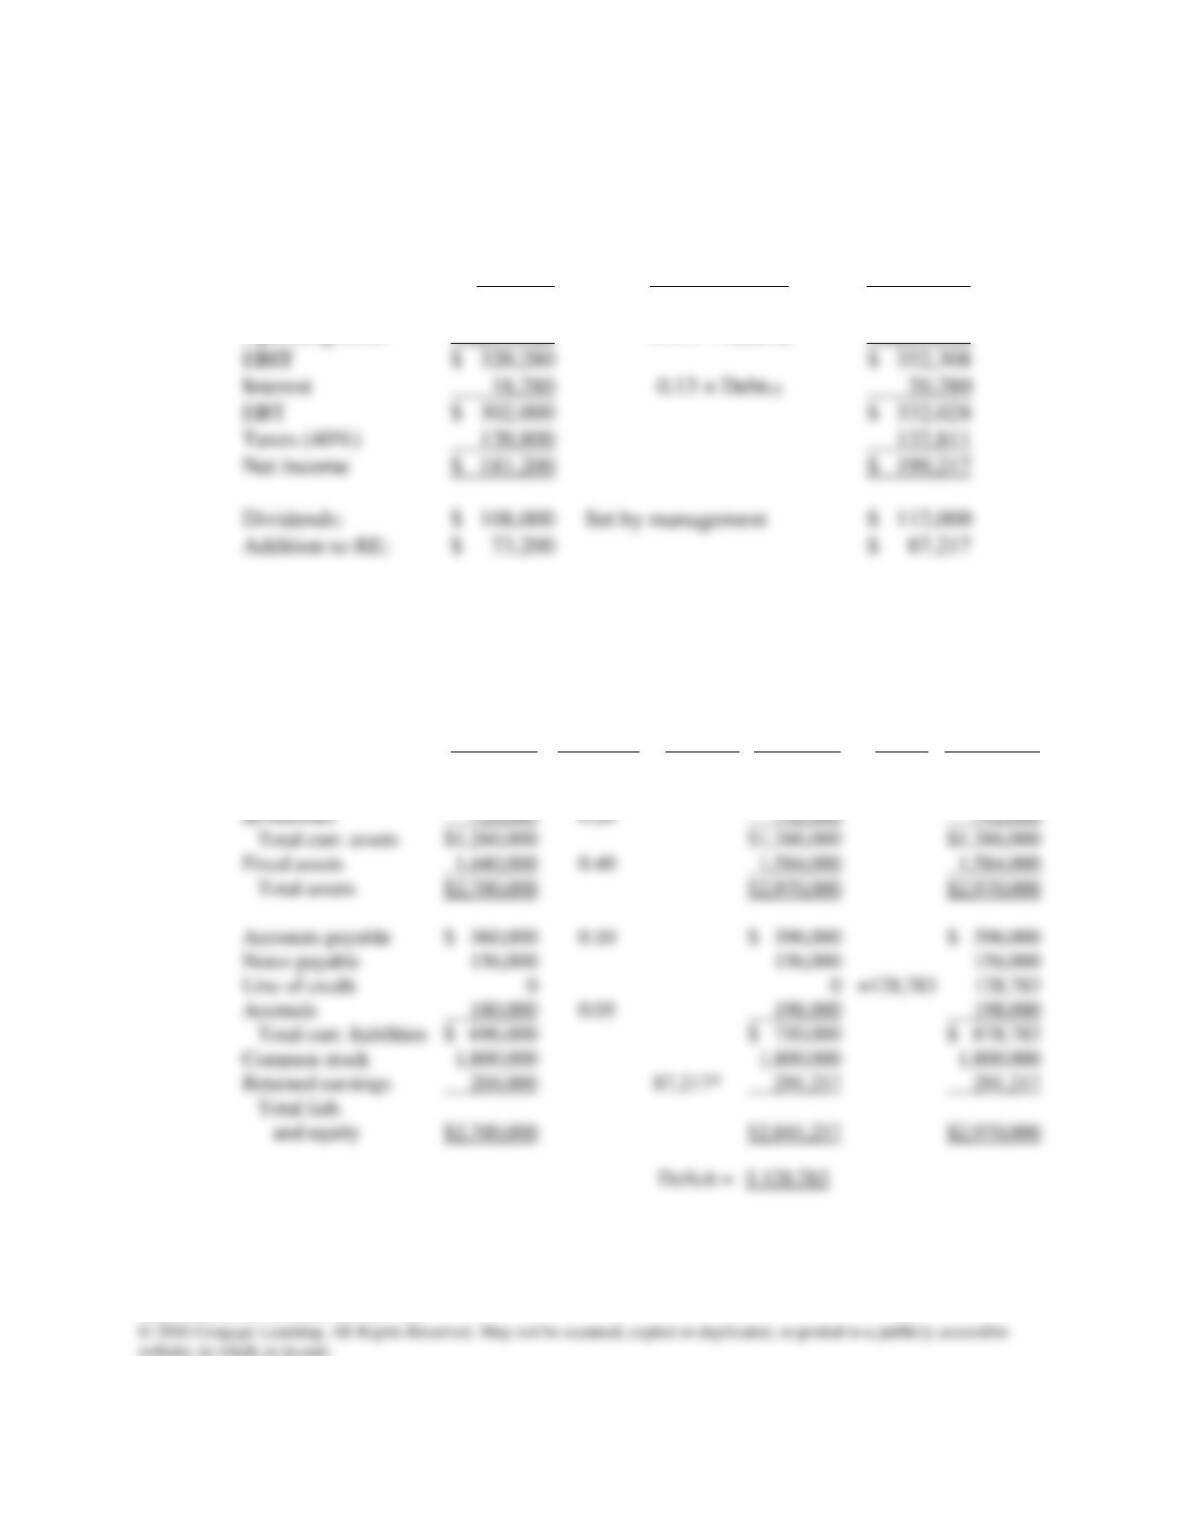
9-9 Garlington Technologies Inc.
Pro Forma Income Statement
December 31, 2016
Forecast Pro Forma
2015 Basis 2016
Sales $3,600,000 1.10 × Sales15 $3,960,000
Operating costs 3,279,720 0.911 × Sales16 3,607,692
Garlington Technologies Inc.
Pro Forma Balance Statement
December 31, 2016
Forecast
Basis % AFN With AFN
2015 2016 Sales Additions 2016 Effects 2016
Cash $ 180,000 0.05 $ 198,000 $ 198,000
Receivables 360,000 0.10 396,000 396,000
*See income statement.
Answers and Solutions: 9 – 14

SOLUTION TO SPREADSHEET PROBLEMS
9-10 The detailed solution is available in the file Ch09 P10 Build a Model Solution.xlsx at the
Answers and Solutions: 9 – 15