CHAPTER 8
EQUITY VALUATION
Answers to Questions
1. A fairly priced investment is one that gives a return that matches the risk. An overvalued
2. The top-down valuation process begins by examining the influence of the general
economy on all firms and the security markets. The next step is to analyze the various
3. The FCFE model forecasts cash flows that belong to the equity holders. These cash flows
are discounted using the cost of equity. The resulting value is the value of the equity. The
free cash flow in the FCFF model is the cash flow that is available to distribute to all
4. There is an important distinction between free cash flow to equity and net income. For
example, in order to calculate net income, depreciation is subtracted. Depreciation is not a
cash expense; it is an accounting entry. The result is that the cash flow generated by
5. The highest economic growth rate that can be used in the constant growth model is the
nominal growth rate, not the real growth rate. Nominal numbers include inflation. Real
6. The present value of the growth opportunity can be negative if value is destroyed by
8. The FCFE model and the FCFF model would result in the same value if certain
assumptions are made. One of the assumptions is the basis of the weighted average cost
9. Differences in P/E ratios can be attributed to differences in earnings growth, free cash
flow that is available for the equityholders, and risk of cash flows.
10. Advantages of relative valuation ratios:
– Easy to use in that you don’t have to build a model or make a series of assumptions.
– For a money manager with a mandate to be fully invested, relative value and not
absolute value (intrinsic value) is what matters.
CHAPTER 8
Answers to Problems
1. Earnings per share: last year $10.00
Dividends per share: last year $7.00
1(a). Because the last dividend payout ratio = $7.00/$10.00 = 70%, and assuming you maintain
the same payout ratio, then dividends per share at the end of the year is:
1(b). Earnings per share: last year $10.00
2. Earnings per share: next year $3.00
2(a). Growth = ROE x RR, so 5%=15% x RR, thus RR = 33.33%
Intrinsic value:
2(b). No growth value:
2(c). Growth = ROE x RR, so 3% = 15% x RR, thus RR = 20.0% and Payout Ratio = 80%
Forward P/E Multiple:
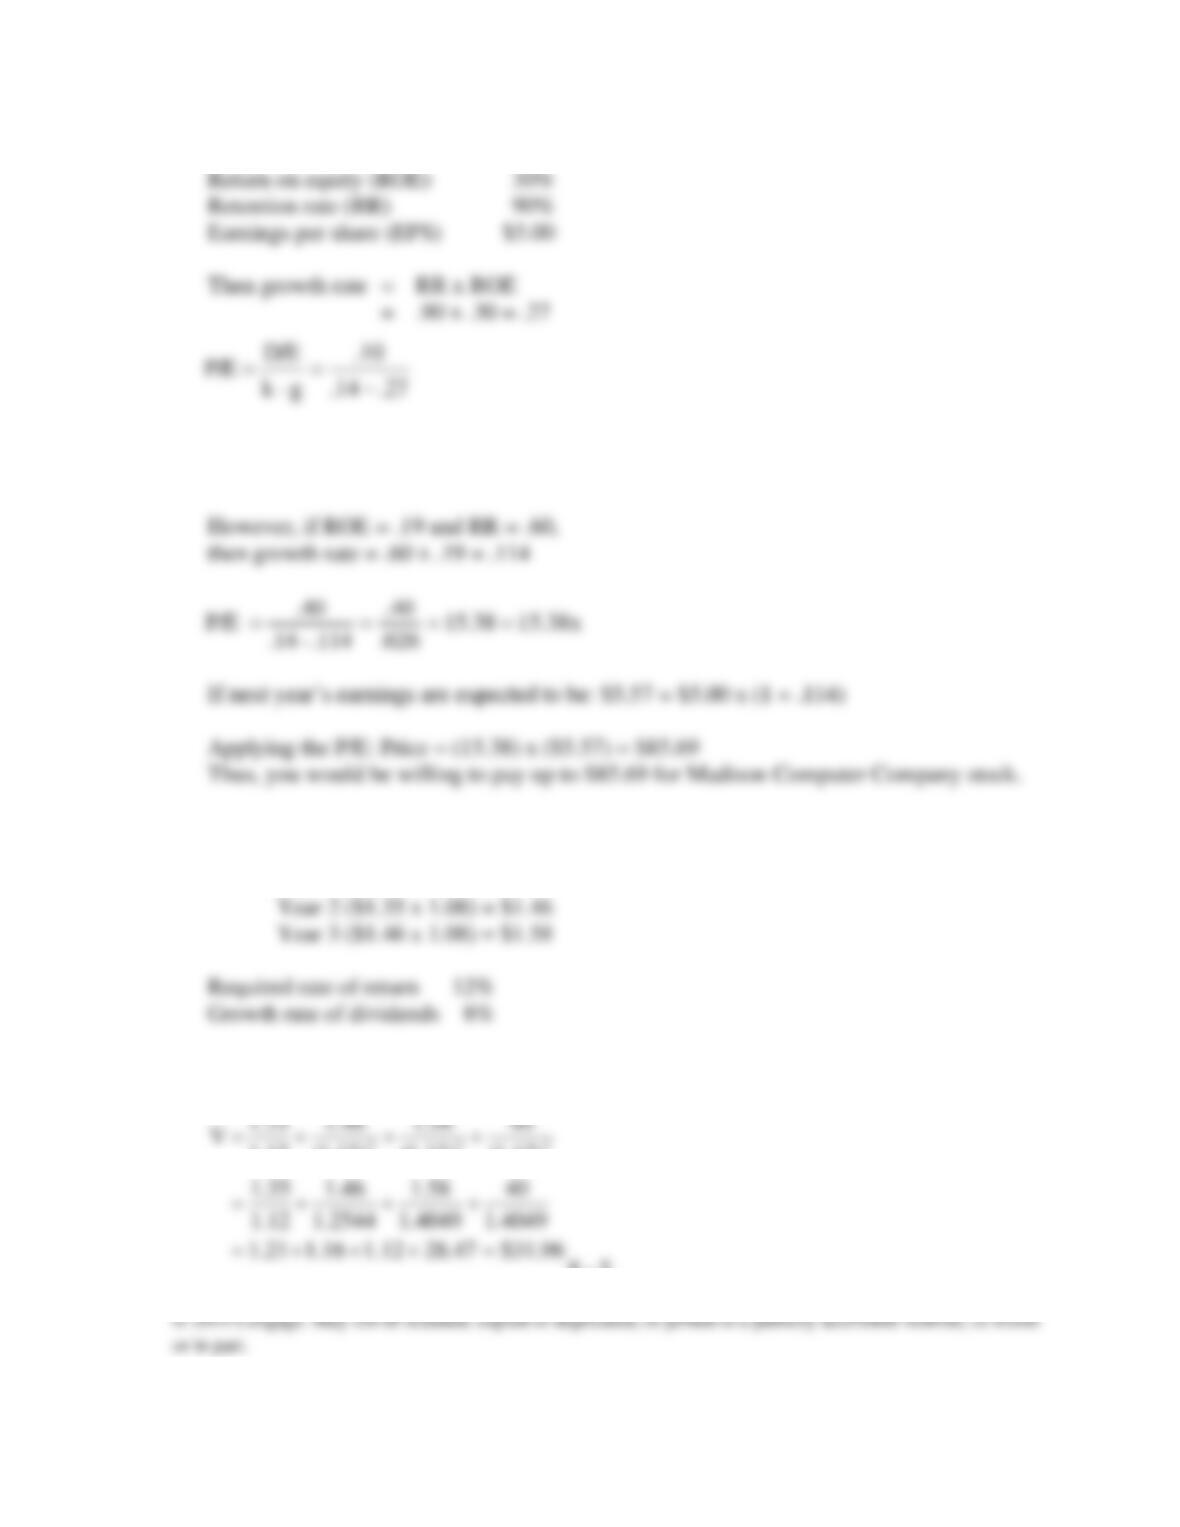
3. Dividend payout ratio 40%
3(a).
Growth rate = (Retention rate) x (Return on equity)
3(b).
Sustainable Growth rate = (Retention rate) x (Return on equity)
57.28$
07.
00.2
.05–.12
.3333)–(1 3.00
V ===
00.25$
.12
3.00
V ==
8 –
5
4. Required rate of return (k) 14%
Because the required rate of return (k) is less than the growth rate (g), the earnings
multiplier cannot be used (the answer is meaningless).
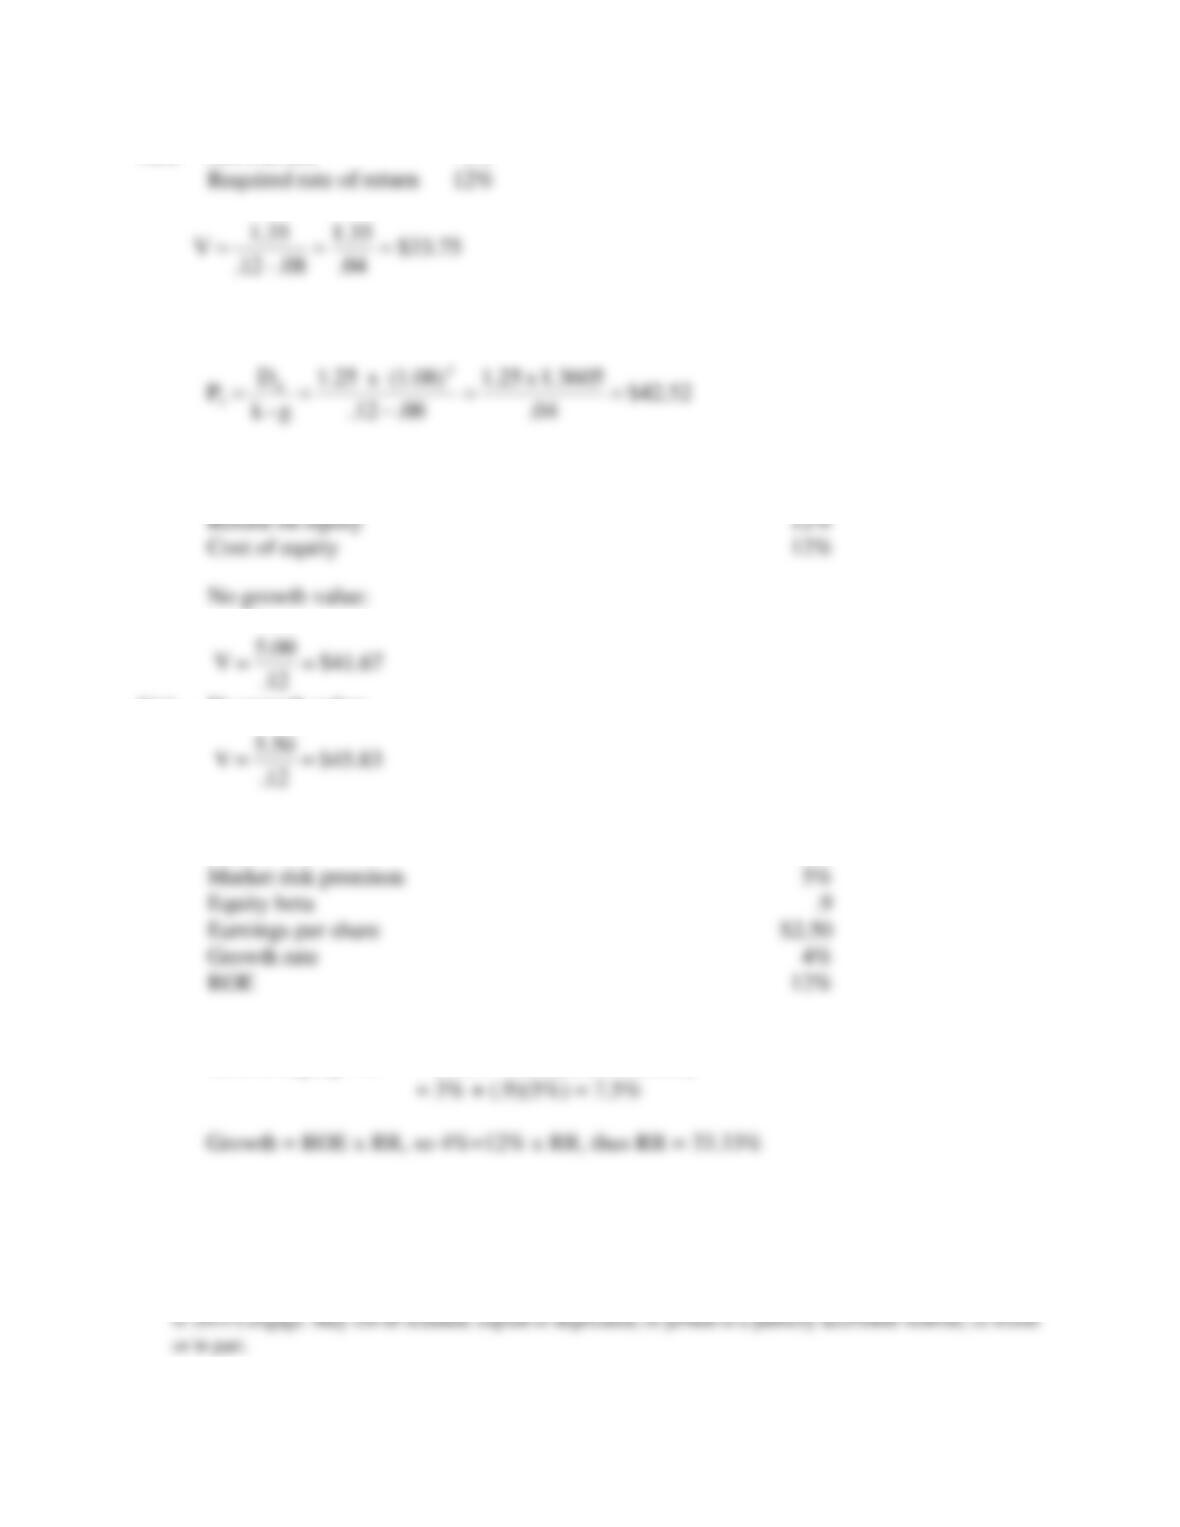
5(a). Projected dividends next three years:
Year 1 ($1.25 x 1.08) = $1.35
The present value of the stock is:
27.14.
10.
g –k
D/E
P/E −
==
96.31$47.2812.116.121.1
4049.1
40
4049.1
58.1
2544.1
46.1
12.1
35.1
)12.1(
40
)12.1(
58.1
)12.1(
46.1
1.12
1.35
V 332
=+++=
+++=
+++=
8 –
6
5(b). Growth rate 8%
5(c). Assuming all the above assumptions remain the same, the price at end of year 3 will be:
6. Earnings per share: last year $5.00
6(a). No growth value:
7. RFR 3%
7(a).
Cost of Equity = k = RFR + beta (Risk Premium)
75.33$
04.
35.1
.08–.12
1.35
V ===
52.42$
04.
1.3605 x 25.1
08.12.
(1.08) x 25.1
g –k
D
P 4
4
3==
−
==
67.41$
.12
5.00
V ==
83.45$
.12
5.50
V ==
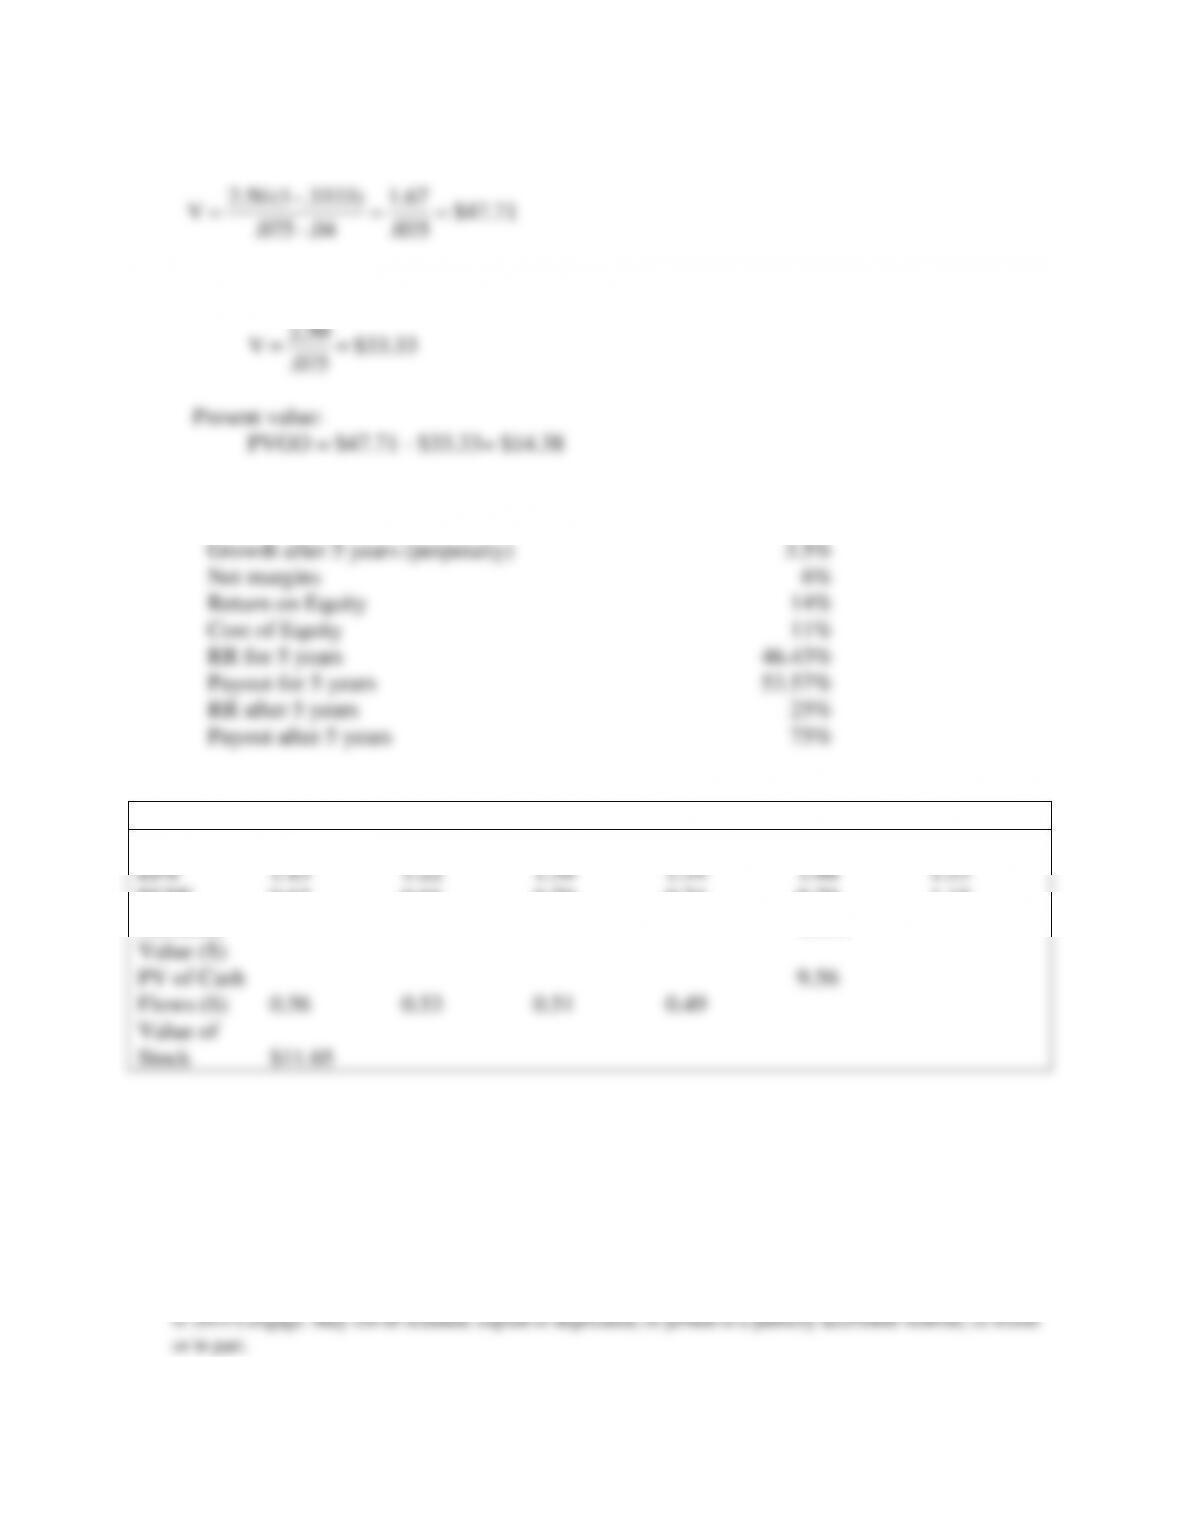
Intrinsic value:
7(b). No growth value:
8. Sales per share $18
Growth for 5 years 6.5% 6.5%
Year
1
2
3
4
5
6
Sales ($)
19.17
20.42
21.74
23.16
24.66
25.52
EPS
1.15
1.22
1.30
1.39
1.48
1.53
FCFE
0.62
0.66
0.70
0.74
0.79
1.15
Terminal
Value ($)
15.31
PV of Cash
Flows ($)
0.56
0.53
0.51
0.49
9.56
Value of
Stock
$11.65
71.47$
035.
67.1
.04–.075
.3333)–(1 2.50
V ===
33.33$
.075
2.50
V ==
8 –
8
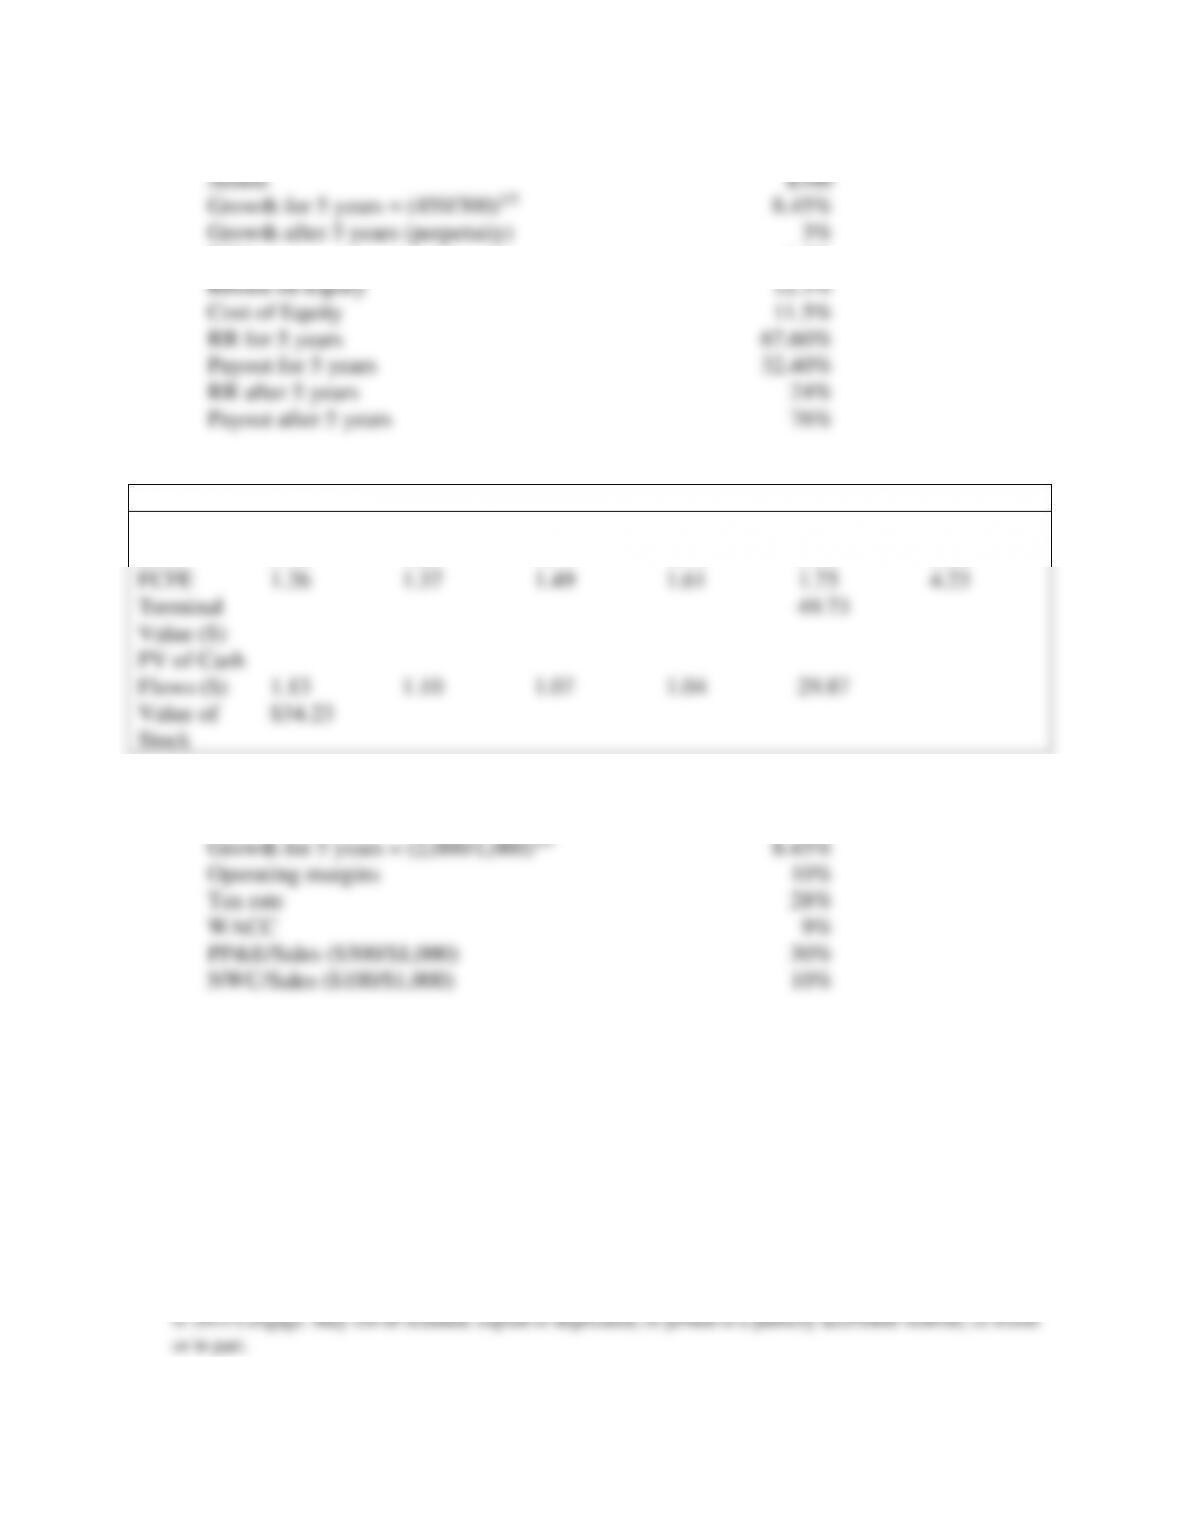
9.
ROA 1.2%
Year
1
2
3
4
5
6
Assets ($)
325.35
352.84
382.66
414.99
450.00
463.50
ROA
3.90
4.23
4.59
4.98
5.40
5.56
FCFE
1.26
1.37
1.49
1.61
1.75
4.23
Terminal
Value ($)
49.73
PV of Cash
Flows ($)
1.13
1.10
1.07
1.04
29.87
Value of
Stock
$34.23
10.
Sales (millions) $1000
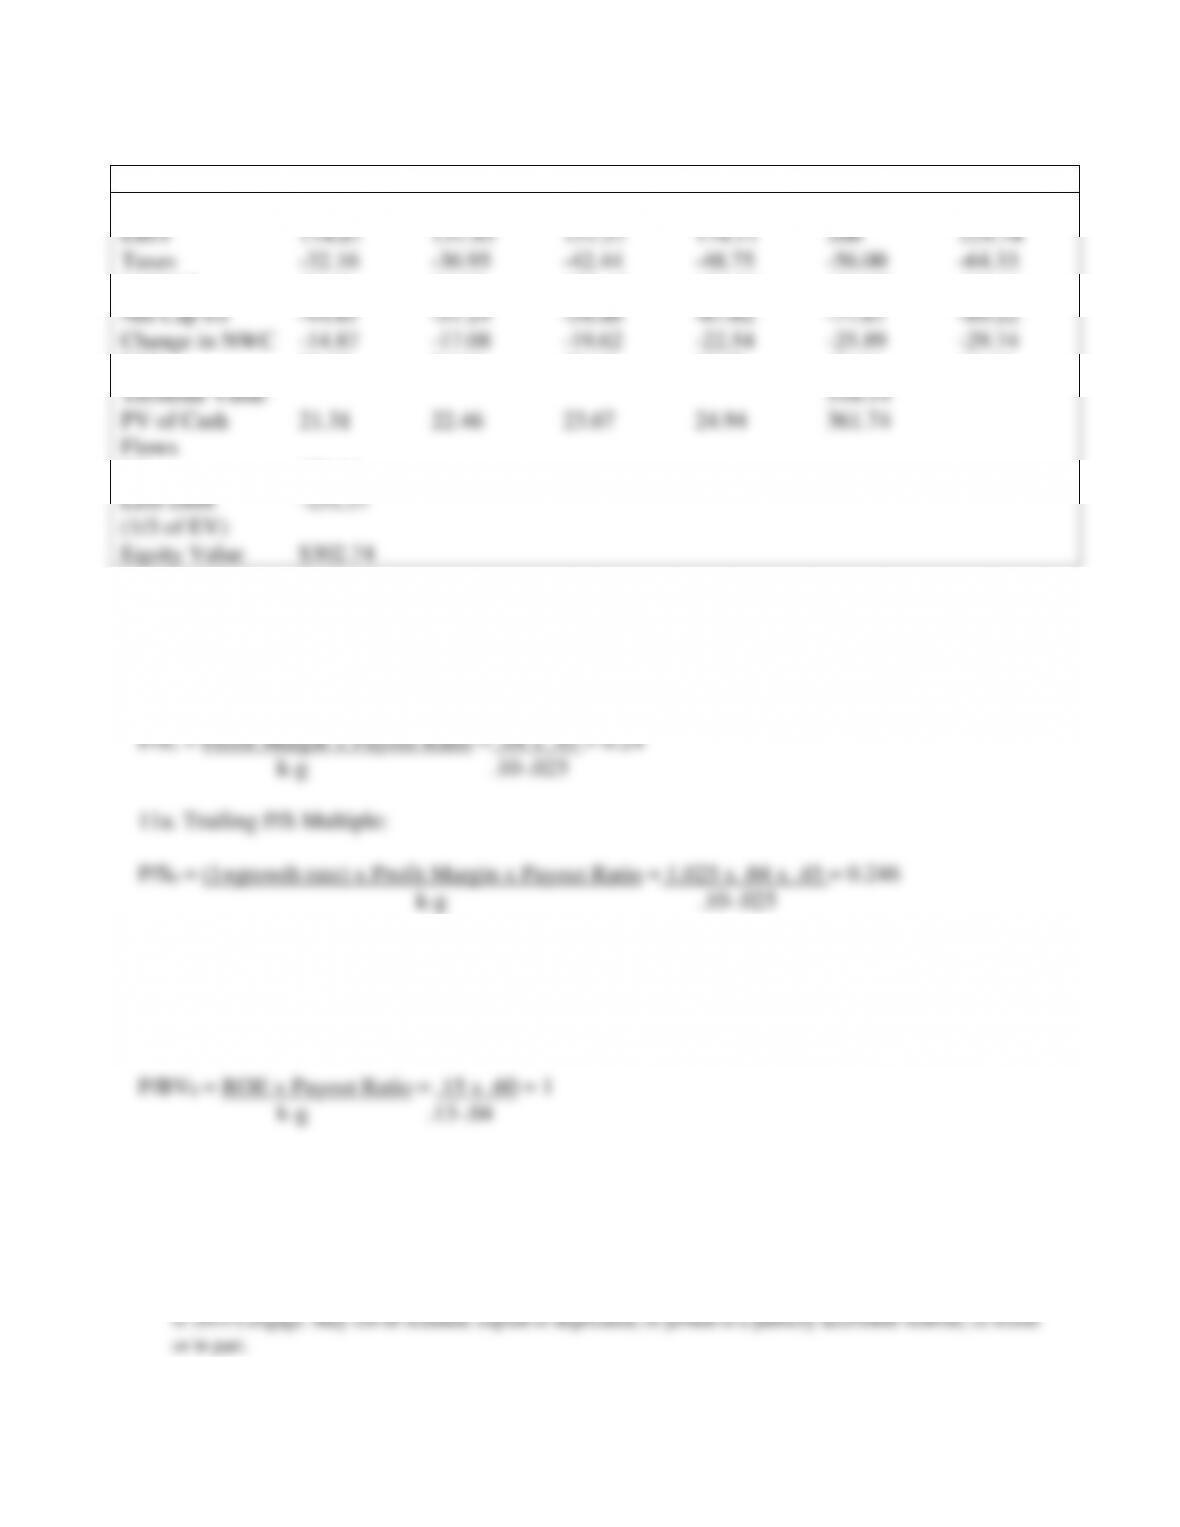
8 –
9
($ millions)
Year
1
2
3
4
5
6
Sales
1148.70
1319.51
1515.72
1741.11
2000
2297.40
EBIT
114.87
131.95
151.57
174.11
200
229.74
Taxes
-32.16
-36.95
-42.44
-48.75
-56.00
-64.33
NOPAT
82.71
95.00
109.13
125.36
144.00
165.41
Net Cap Ex
-44.61
-51.24
-58.86
-67.62
-77.67
-89.22
Change in NWC
-14.87
-17.08
-19.62
-22.54
-25.89
-29.74
FCF
23.23
26.68
30.65
35.20
40.44
46.45
Terminal Value
516.14
PV of Cash
Flows
21.31
22.46
23.67
24.94
361.74
EV
454.11
Less Debt
(1/3 of EV)
-151.37
Equity Value
$302.74
11.
11a. Forward P/S Multiple:
12.
12.a. The forward P/B Multiple is not forecast by analysts.
12b. Trailing P/B Multiple: