C08
Chapter 8 Spreadsheet Problem Solutions (C08)
1. There are a number of instructions with which you should be familiar
to use these computerized models. These instructions appear in a
2. A graph which shows the return and standard deviation of each
stock and the portfolio will be displayed if you click the worsheet labeled
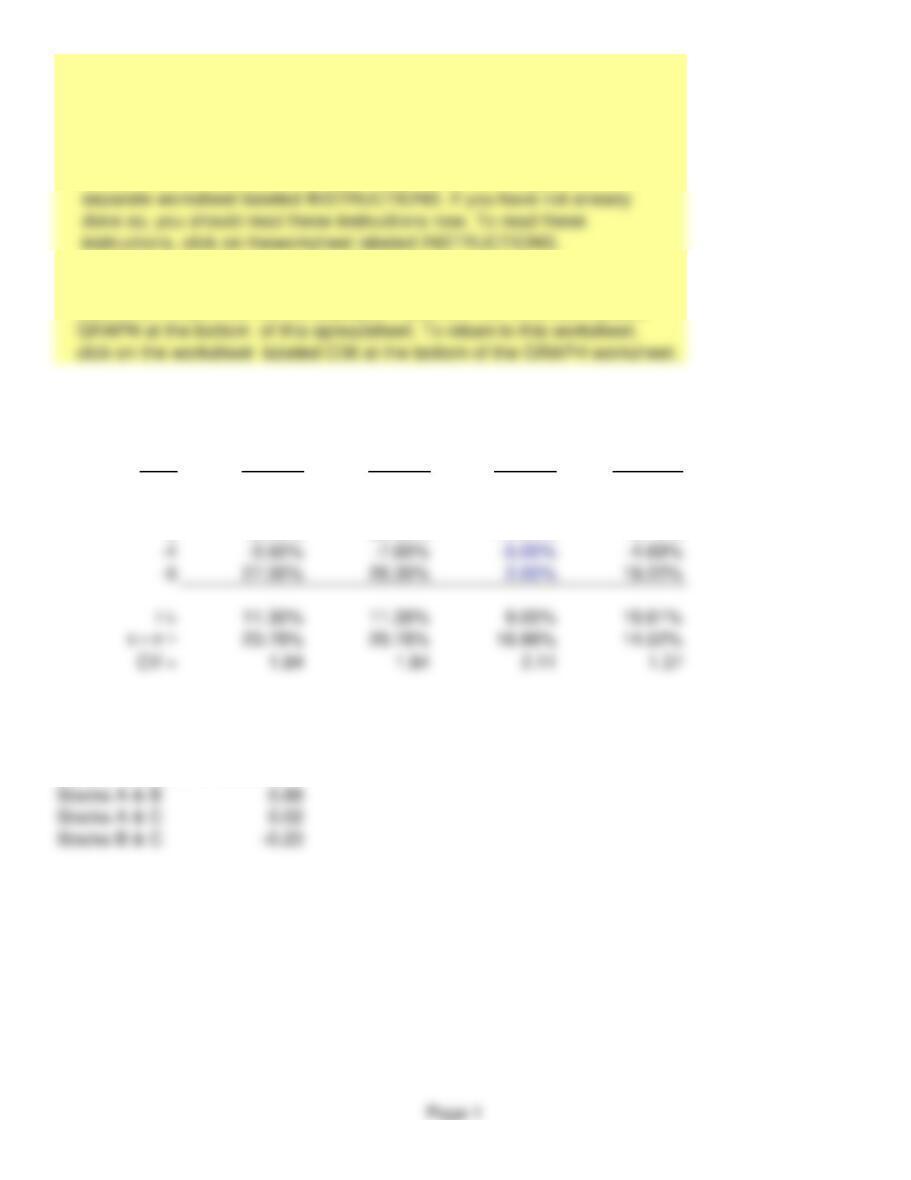
INPUT DATA: KEY OUTPUT:
Year Stock A Stock B Stock C Portfolio
-1 -18.00% -14.50% 25.00% -3.70%
-2 33.00% 21.80% 33.00% 28.52%
-3 15.00% 30.50% -10.00% 13.70%
Percent in: Stock A Stock B Stock C Portfolio
30.00% 40.00% 30.00% 100.00%
Correlation coefficients, ρ
Realized Rates of Return
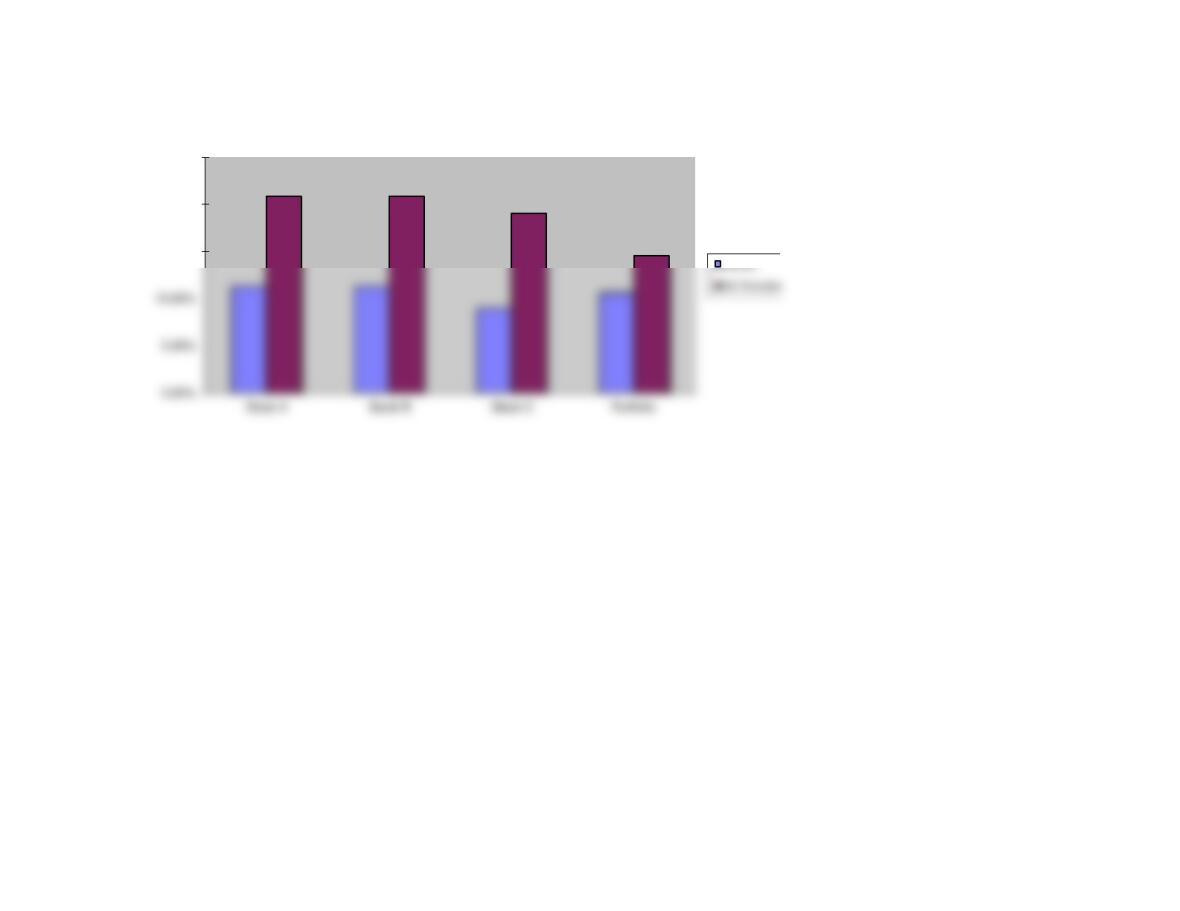
GRAPH
15.00%
20.00%
25.00%
Page 2
We have already entered the base case data for each model in this
file, and the models have performed the analysis for preceding parts
of the problem. You will need to enter the data for each of the
remaining parts of the problem–we indicate in each problem the parts
that should be done using the spreadsheet. However, there are several
points worth noting before you go into a model:
1. The input data are entered in specified cells in the INPUT DATA
section. When you change an input item, the model automatically
2. The key output data are displayed to the right of the INPUT DATA
3. Input data items that you can change are distinguished from the
4. All percentages must be entered as decimals. Dollars and other
numbers must be entered without dollar signs or commas.
5. Instructions and comments concerning specific models accompany
GENERAL INSTRUCTIONS FOR COMPUTERIZED PROBLEM SOLUTIONS