Introduction to Corporate Finance, Fourth Edition Booth, Cleary, Rakita
41. Section: 8.3 Expected Return and Risk for Portfolios
Learning Objective: 8.4
Difficulty: Basic
Solution:
42. Section: 8.3 Expected Return and Risk for Portfolios
Learning Objective: 8.4
Difficulty: Challenging
Solution:
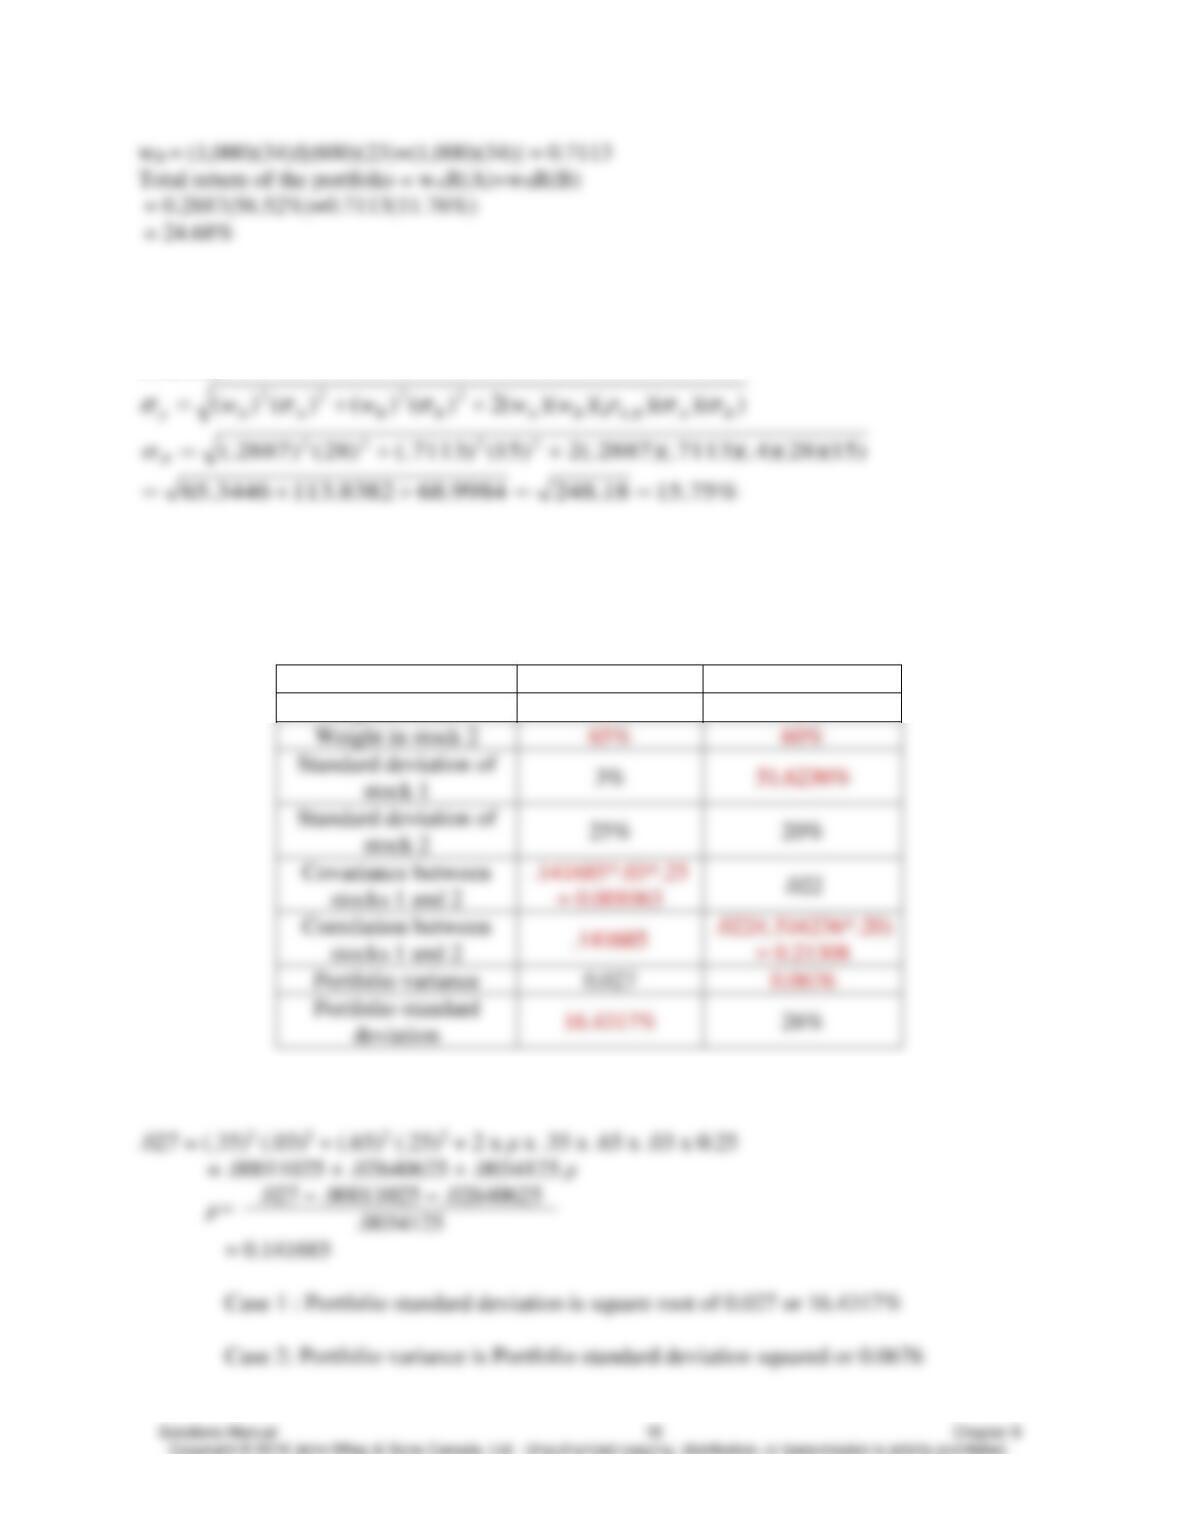
Case 1
Case 2
Weight in stock 1
35%
40%
Case 1: correlation between stocks 1 and 2

Introduction to Corporate Finance, Fourth Edition Booth, Cleary, Rakita
Case 2: standard deviation of stock 1
43. Section: 8.3 Expected Return and Risk for Portfolios
Learning Objective: 8.4
Difficulty: Challenging
Solution:
The total amount of cash you have to provide is $1,000. When you short sell ABC you will
44. Section: 8.3 Expected Return and Risk for Portfolios
Learning Objective: 8.4
Difficulty: Challenging
Solution
45. Section: 8.3 Expected Return and Risk for Portfolios
Learning Objective: 8.4
Difficulty: Challenging
Solution:

Introduction to Corporate Finance, Fourth Edition Booth, Cleary, Rakita
46. Section: 8.4 The Efficient Frontier
Learning Objective: 8.5
Level of difficulty: Challenging
Solution:
a. The correlation between the two stocks is –0.80
As both stocks have the same expected returns, no matter what weights are used the expected

Introduction to Corporate Finance, Fourth Edition Booth, Cleary, Rakita
2. Use the solver function in Excel.
b. The correlation between the two stocks is 0.80.
As the correlation is positive and the weights have to be positive, the minimum variance will be
47. Section: 8.4 The Efficient Frontier
Learning Objective: 8.5
Difficulty: Challenging
Solution:
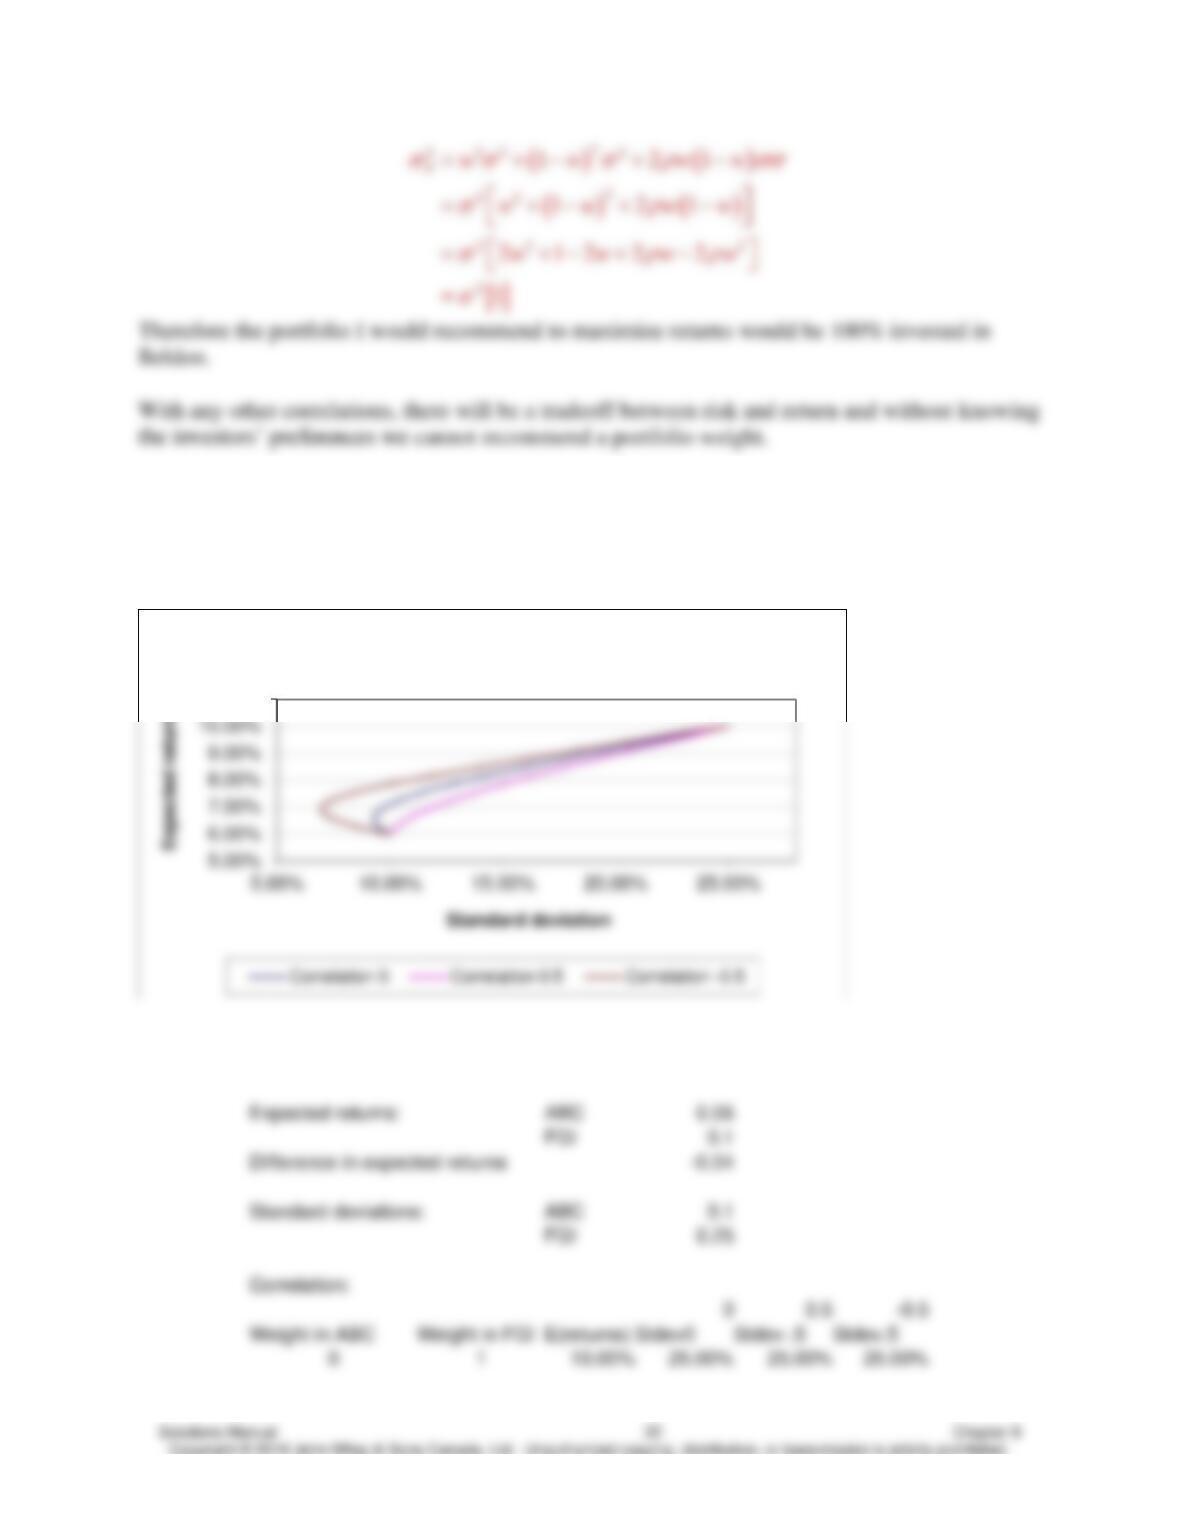
a. The correlation is 0.00
The two companies have the same standard deviation and zero correlation so no matter what
Introduction to Corporate Finance, Fourth Edition Booth, Cleary, Rakita
48. Section: 8.4 The Efficient Frontier
Learning Objective: 8.5
Difficulty: Challenging
Solution:
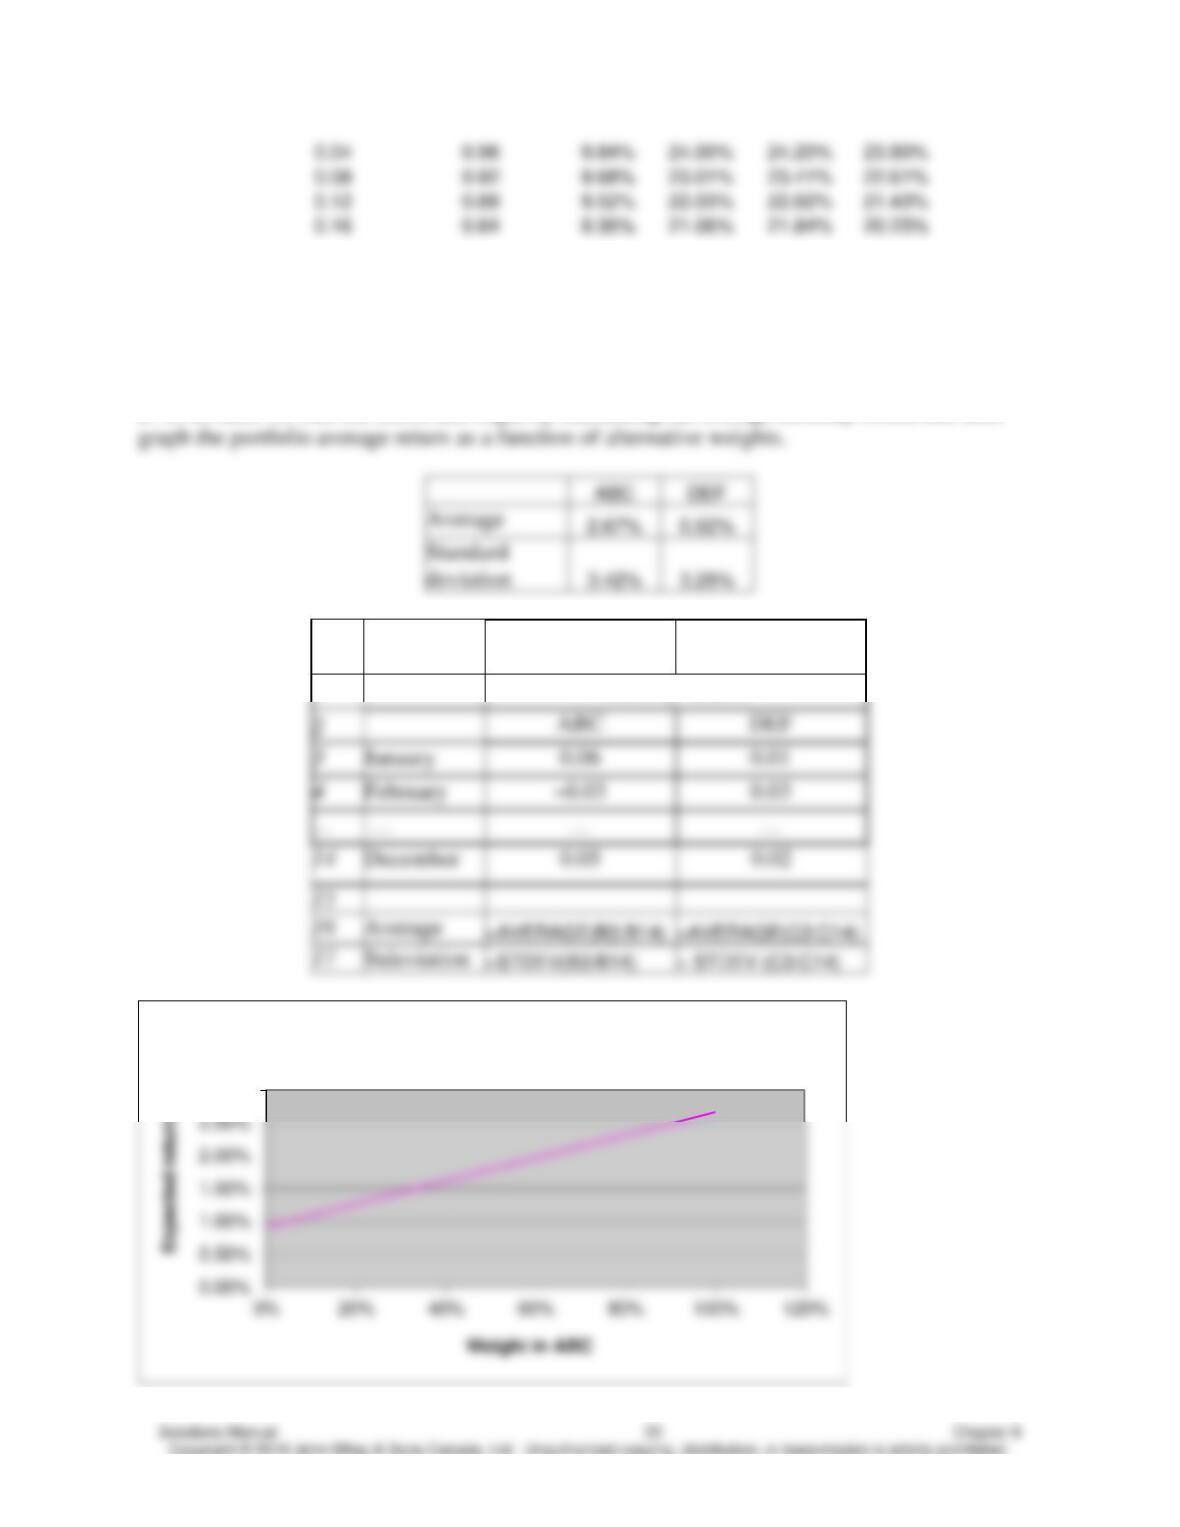
A sample of the data from Excel:
11.00%
Efficient frontier
Introduction to Corporate Finance, Fourth Edition Booth, Cleary, Rakita
49. Sections: 8.4 The Efficient Frontier
Learning Objective: 8.5
Difficulty: Challenging
Solution:
a. To do this, we will use Excel and begin by calculating the average monthly return and then
Row
/Col
A
B
C
1
Monthly returns
3.00%
Portfolio expected return
Introduction to Corporate Finance, Fourth Edition Booth, Cleary, Rakita
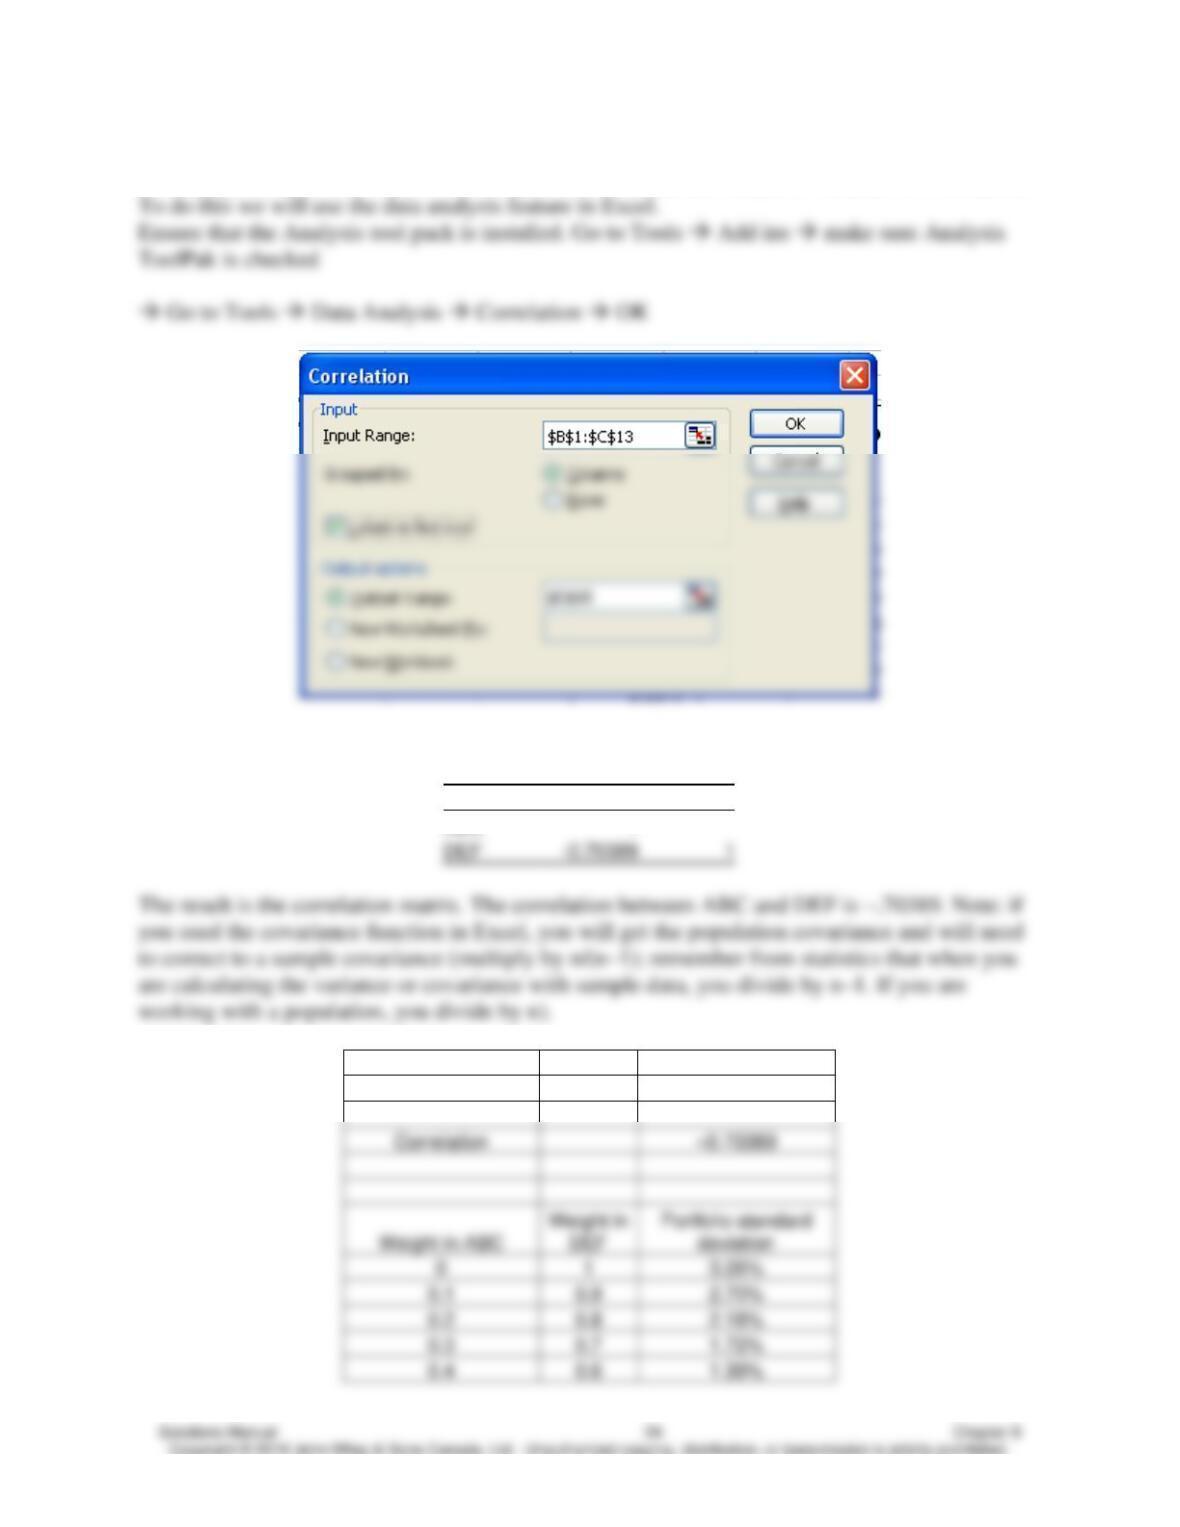
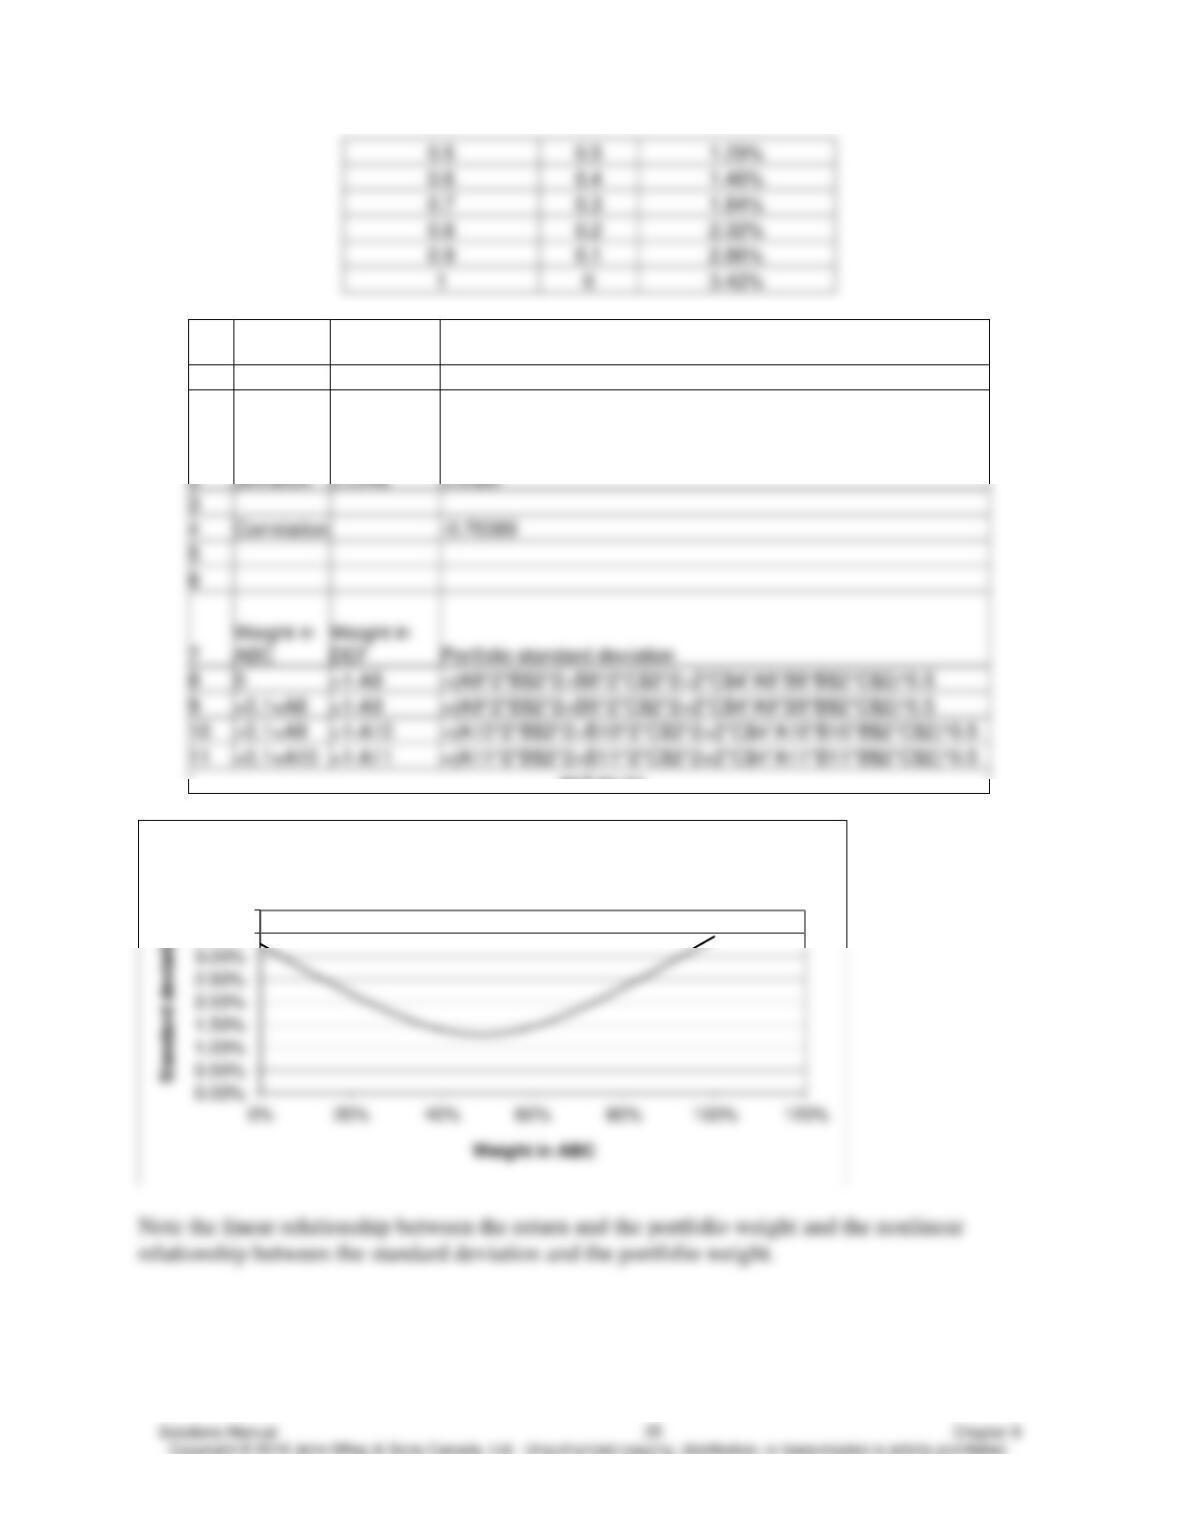
b. To graph the portfolio standard deviation we need either the sample covariance or correlation.
Click ok. The results are:
ABC
DEF
ABC
1
DEF
1
ABC
DEF
Standard deviation
3.42%
3.26%
3.26%
2.70%
2.18%
Introduction to Corporate Finance, Fourth Edition Booth, Cleary, Rakita
Row/
Col
A
B
C
1
ABC
DEF
2
deviation
0.0342
0.0326
3
4
Correlation
-0.70389
5
6
7
Portfolio standard deviation
8
0
=(A8^2*B$2^2+B8^2*C$2^2+2*C$4*A8*B8*B$2*C$2)^0.5
9
=0.1+A8
=(A9^2*B$2^2+B9^2*C$2^2+2*C$4*A9*B9*B$2*C$2)^0.5
=0.1+A9
=(A10^2*B$2^2+B10^2*C$2^2+2*C$4*A10*B10*B$2*C$2)^0.5
=0.1+A10
=(A11^2*B$2^2+B11^2*C$2^2+2*C$4*A11*B11*B$2*C$2)^0.5
Standard
… and so on
c.
3.50%
4.00%
Portfolio stdeviation
Introduction to Corporate Finance, Fourth Edition Booth, Cleary, Rakita
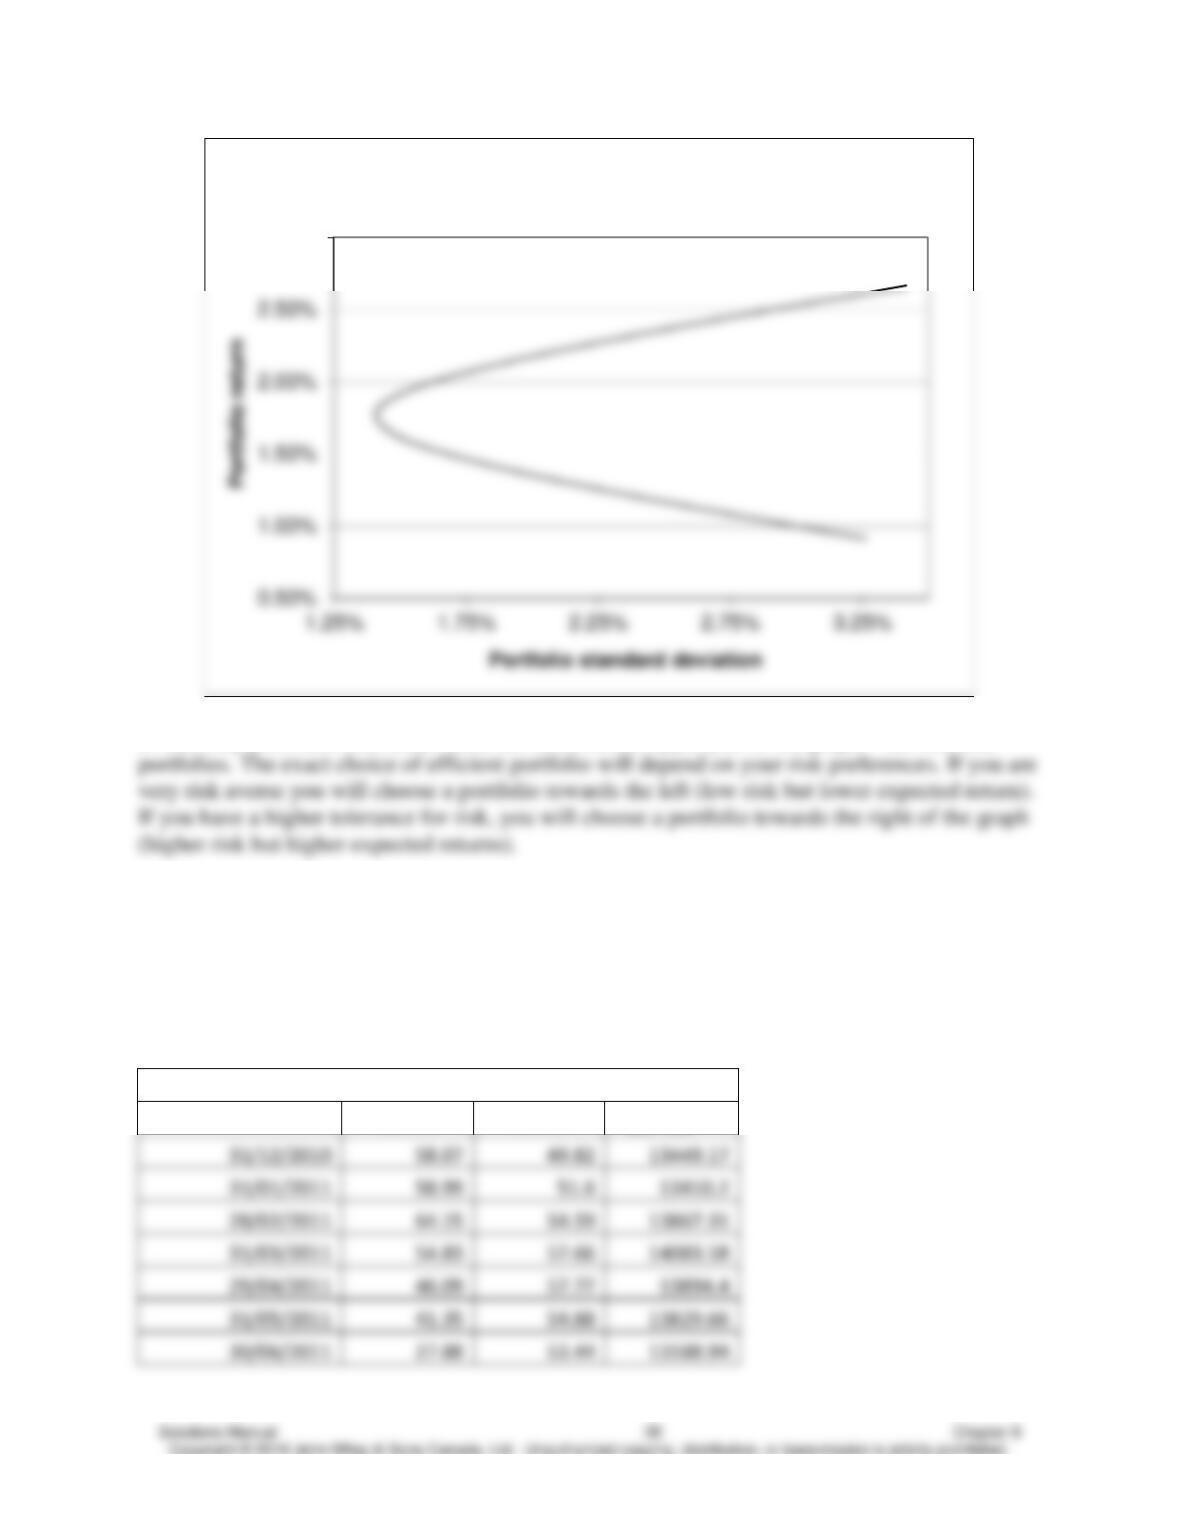
d. The only portfolios that make sense are those on the upper part of the graph—the efficient
50. Section: 8.4 The Efficient frontier
Learning Objective: 8.5
Difficulty: Challenging
Solution:
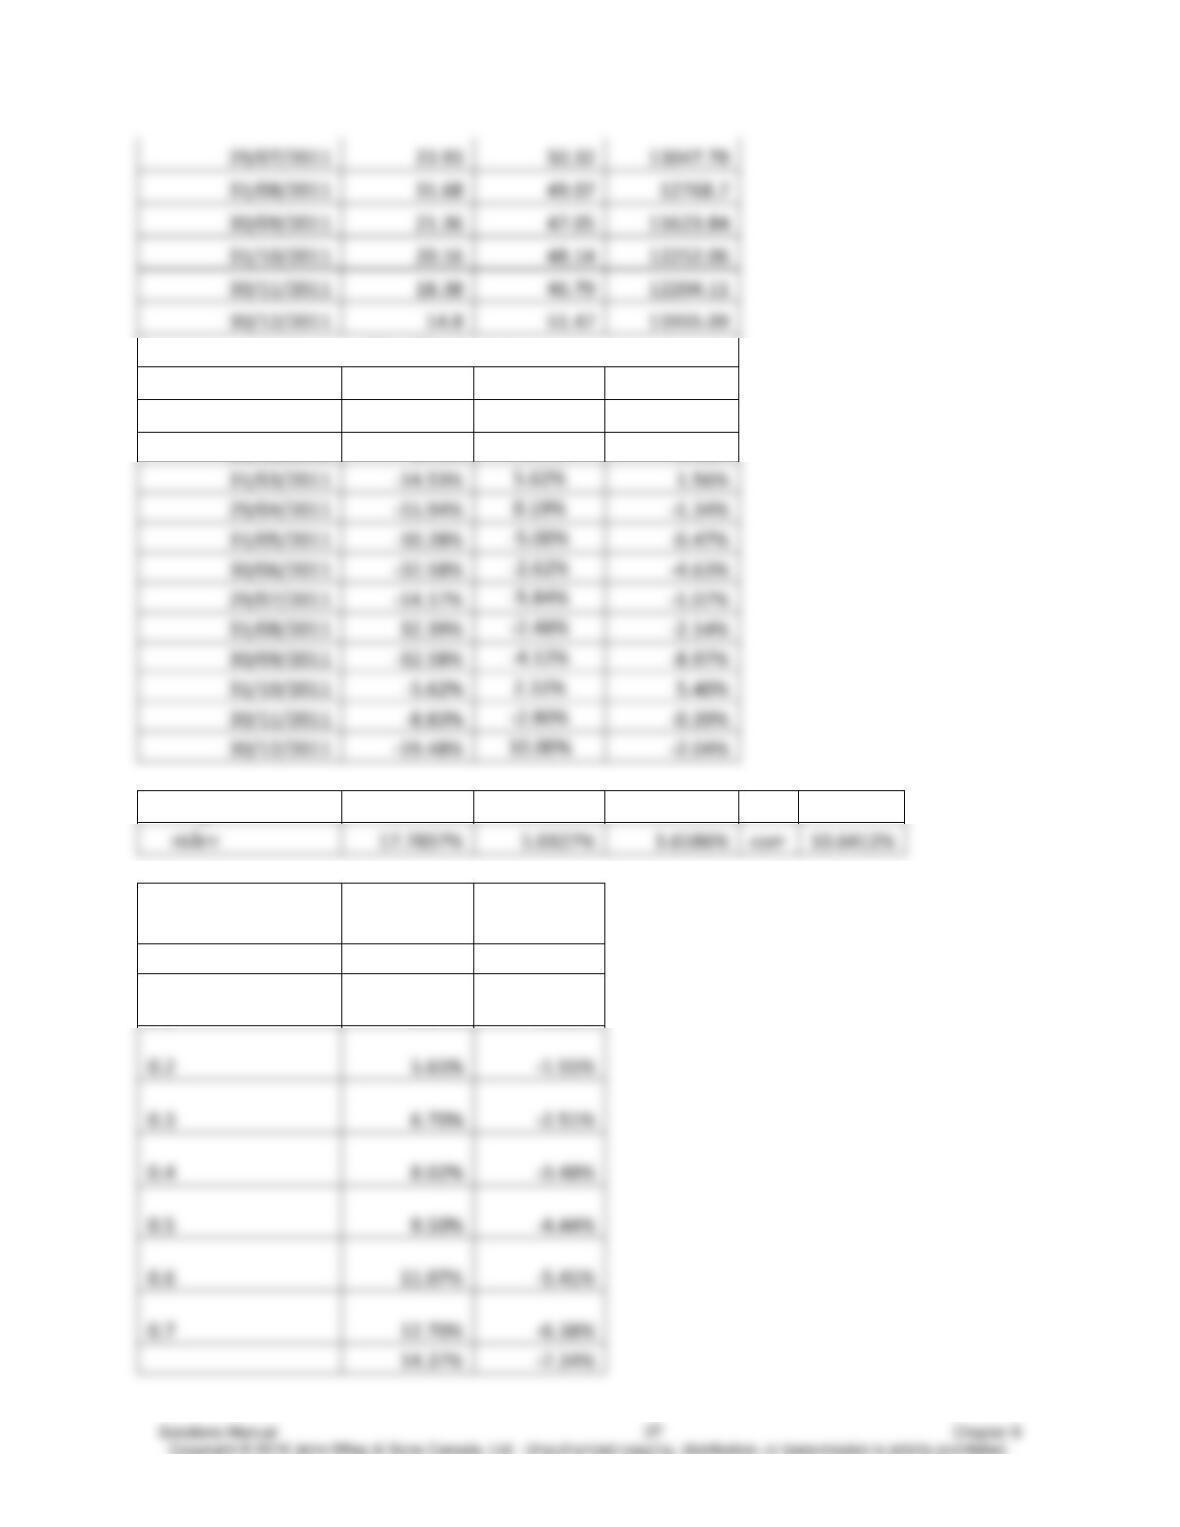
a. Using monthly data for these two companies from January 2011 to December 2011, graph
the relationship between risk and return.
Monthly adj prices
BB.TO
RY.TO
^GSPTSE
3.00%
Portfolio Risk/Return tradeoff
Introduction to Corporate Finance, Fourth Edition Booth, Cleary, Rakita
29/07/2011
13047.78
31/08/2011
30/09/2011
11623.84
31/10/2011
12252.06
30/11/2011
12204.11
30/12/2011
11955.09
Monthly returns
BB.TO
RY.TO
^GSPTSE
31/01/2011
1.58%
3.57%
-0.29%
28/02/2011
8.75%
5.79%
3.41%
31/03/2011
1.56%
29/04/2011
-1.34%
31/05/2011
-0.47%
30/06/2011
-4.63%
29/07/2011
-1.07%
31/08/2011
-2.14%
30/09/2011
-8.97%
31/10/2011
-5.62%
5.40%
30/11/2011
-8.83%
-0.39%
30/12/2011
-2.04%
Avg
-9.2733%
0.3859%
-0.9139%
stdev
5.0327%
corr
10.6412%
weight in BlackBerry
portfolio std
portfolio
exp ret
–
5.03%
0.39%
0.1
5.04%
-0.58%
0.2
5.65%
-1.55%
6.70%
-2.51%
0.4
8.02%
-3.48%
0.5
9.50%
-4.44%
0.6
-5.41%
-6.38%
-7.34%
Introduction to Corporate Finance, Fourth Edition Booth, Cleary, Rakita
b.
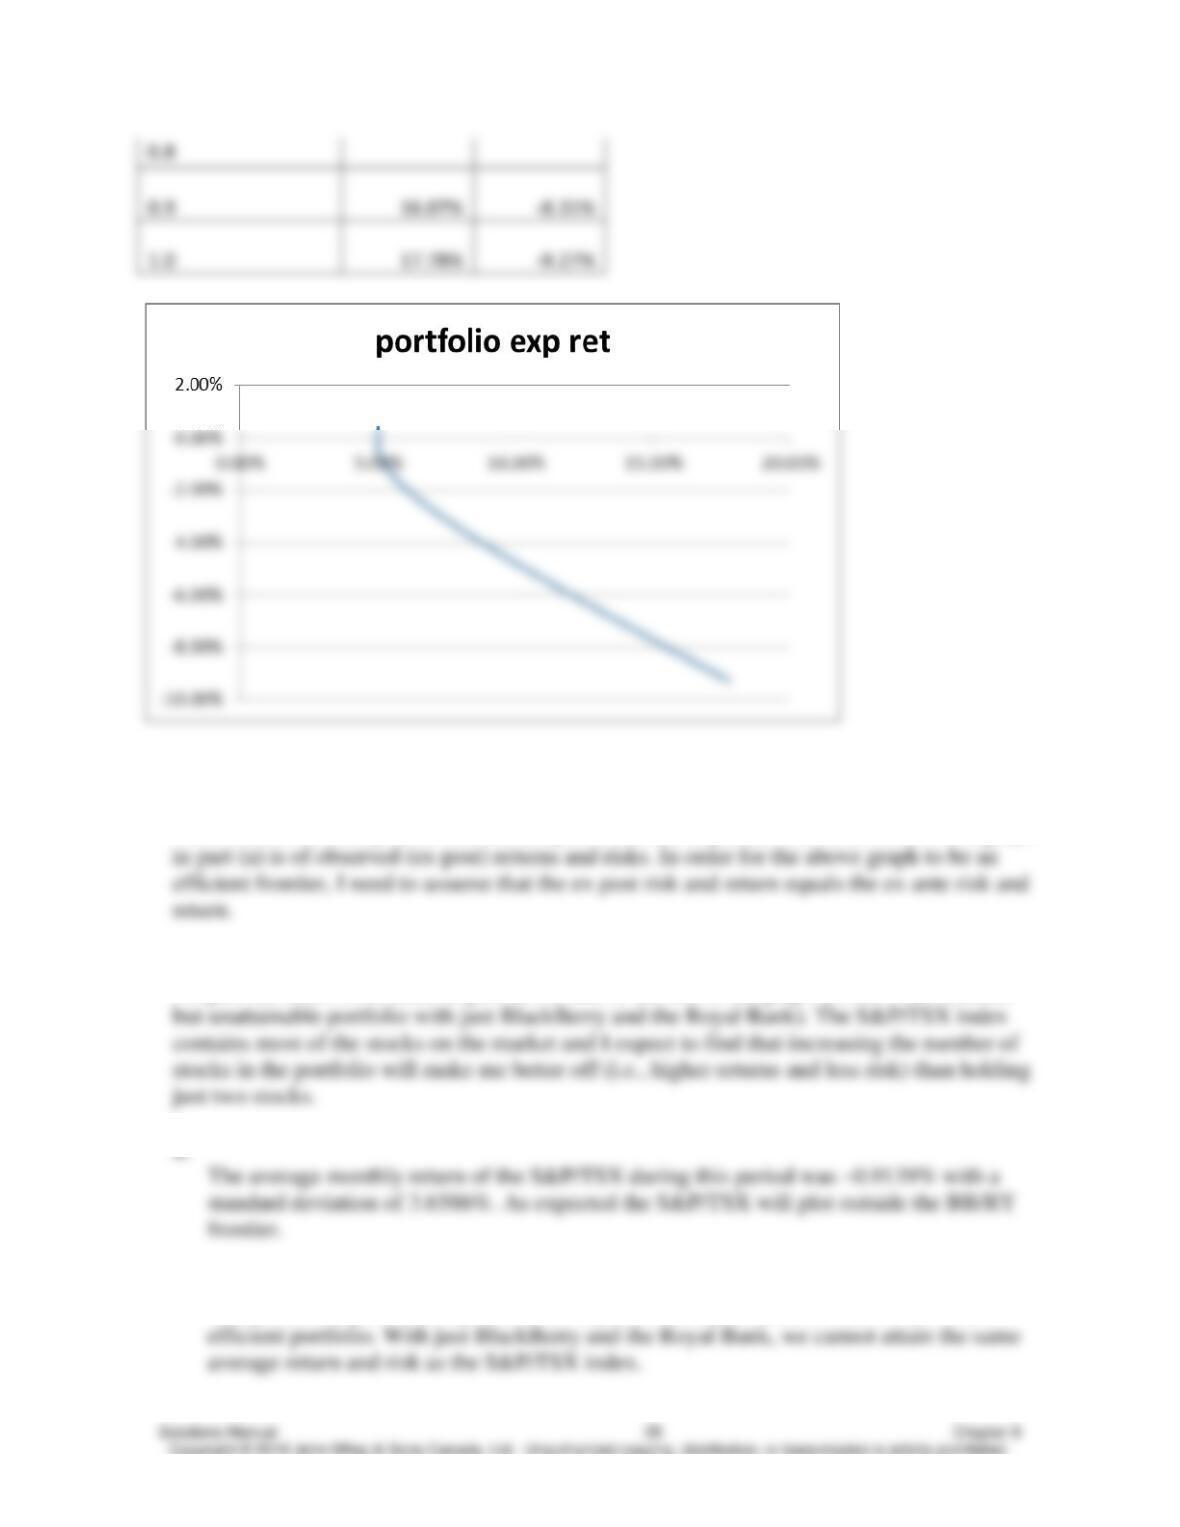
The efficient frontier plots the relationship between the expected returns and risks. The graph
c.
I expect the S&P/TSX index to plot above and to the left of the graph (i.e., it is an efficient
e.
Compared to a portfolio of just BlackBerry and the Royal Bank, the S&P/TSX is an

Introduction to Corporate Finance, Fourth Edition Booth, Cleary, Rakita
f.
As we add more stocks to the portfolio, I would expect the frontier to expand outwards. If
51. Section: 8.5 Diversification
Learning Objective: 8.6
Difficulty: Challenging
Solution:
a. Sample data from Excel:
Number of
stocks
Stdev of
portfolio
1
10.00%
2
3
4
5
6
7
8
9
The formulas used:
Row
/col
A
B
1
Number of
stocks
Stdev of portfolio
2
1
=(A2*(1/A2)^2*0.1^2)^0.5
3
=1+A2
=(A3*(1/A3)^2*0.1^2)^0.5
4
=1+A3
=(A4*(1/A4)^2*0.1^2)^0.5
5
=1+A4
=(A5*(1/A5)^2*0.1^2)^0.5
6
=1+A5
=(A6*(1/A6)^2*0.1^2)^0.5
7
=1+A6
=(A7*(1/A7)^2*0.1^2)^0.5
8
=1+A7
=(A8*(1/A8)^2*0.1^2)^0.5
9
=1+A8
=(A9*(1/A9)^2*0.1^2)^0.5
=1+A9
=(A10*(1/A10)^2*0.1^2)^0.5
=1+A10
=(A11*(1/A11)^2*0.1^2)^0.5
Introduction to Corporate Finance, Fourth Edition Booth, Cleary, Rakita
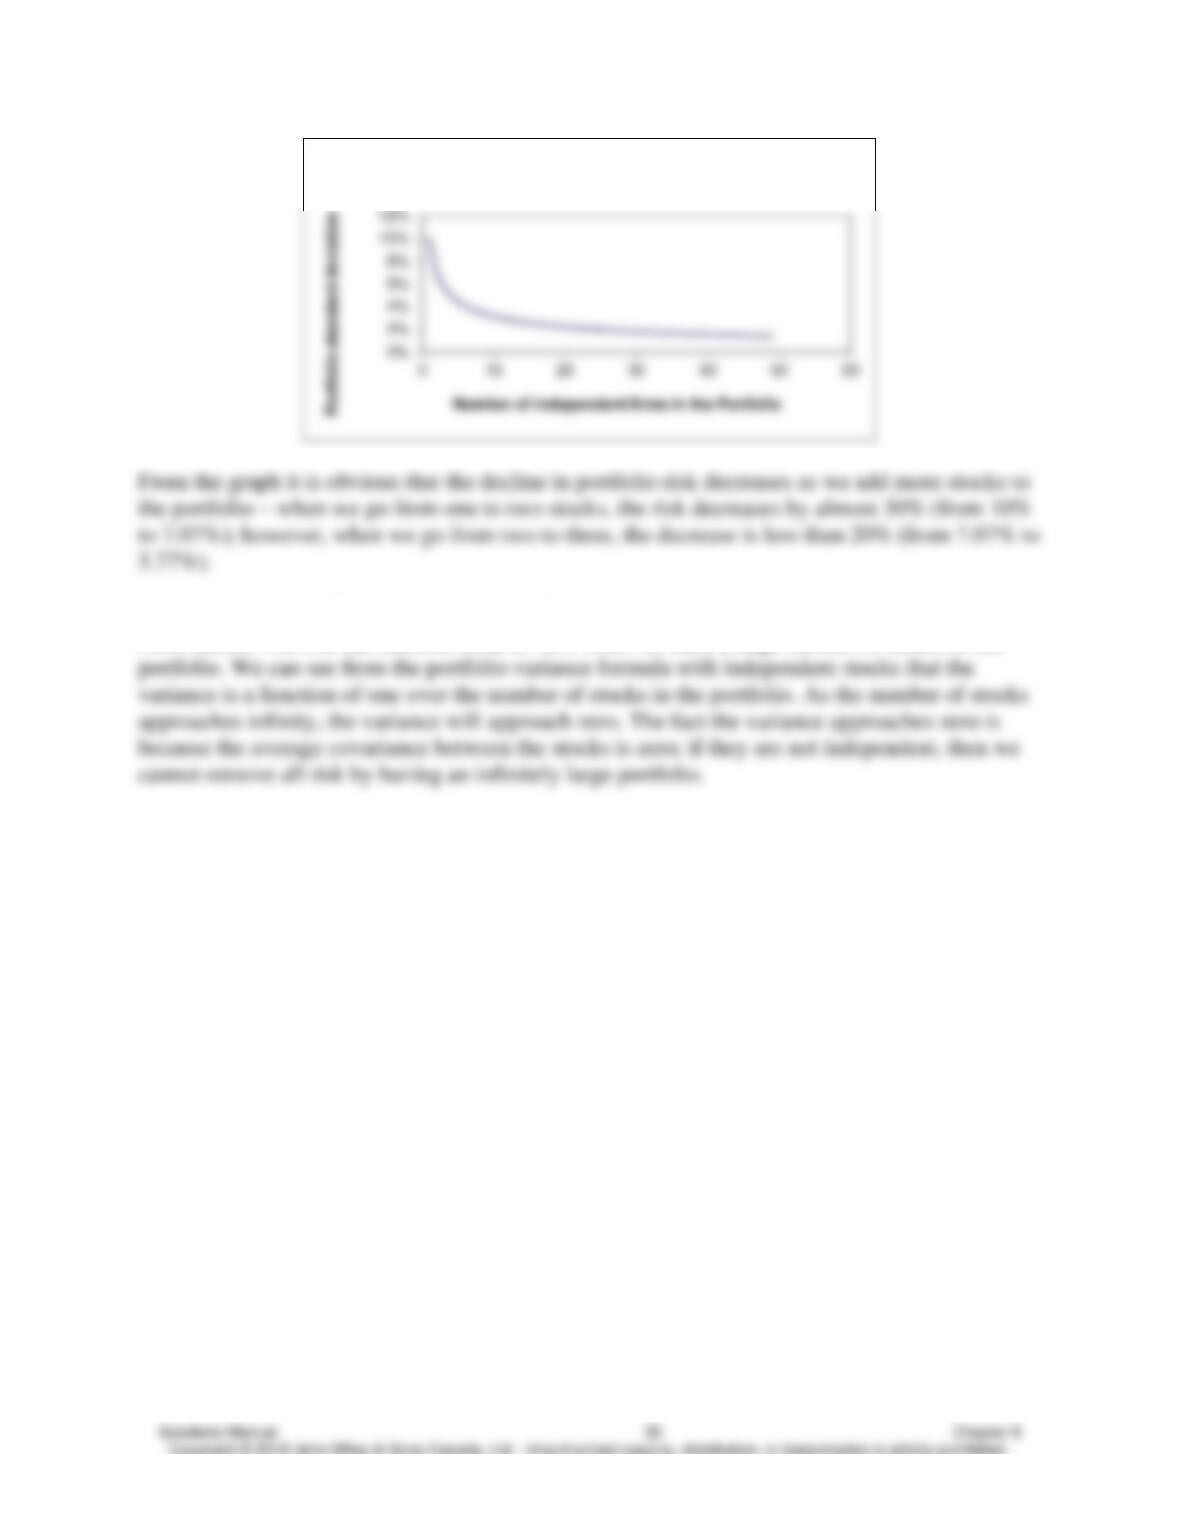
b. In this situation (all stocks independent), I expect the risk to continue to decline as we add
more stocks. The risk can become close to zero when we have a huge number of stocks in the
Impact on diversification of adding firms to portfolio

Introduction to Corporate Finance, Fourth Edition Booth, Cleary, Rakita
Answers to Concept Review Questions
8.1 Measuring Returns
Concept Review Questions
1. What is the difference between ex ante and ex post returns?
2. Why do the income and capital gains component of the total return differ between common
shares and bonds?
The yield on bonds is the return earned by buying the bond and holding it to maturity, so in this
3. Why is the GM return a better estimate of long run investment performance than the AM
return?
4. Why might a scenario-based estimate be more accurate for a short-run expected return
estimate than a historical AM estimate?
There are pros and cons of each method for determining expected rate of return. For short term
8.2 Measuring Risk
Concept Review Questions
1. Why is the range sometimes a poor measure of risk?
2. What is the difference between estimating a scenario-based (probability) estimate of risk
versus a historic data-based estimate of risk?
The scenario based standard deviation is ex ante since we are explicitly taking into account
3. Why would we sometimes want to use scenario based risk measures rather than the standard
deviation of actual returns over a long time period?

Introduction to Corporate Finance, Fourth Edition Booth, Cleary, Rakita
8.3 Expected Return and Risk for Portfolios
Concept Review Questions
1. Why is the expected return on a portfolio a weighted average of the expected returns of the
underlying securities?
A portfolio return is a weighted average of the returns of the underlying securities, thus the
2. Why is portfolio standard deviation not a weighted average of the standard deviations of the
underlying securities?
A portfolio’s standard deviation depends on weights, standard deviations, and correlations
3. What is the difference between the covariance and the correlation coefficient?
While covariance provides us with a useful measure of the relationship of the co-movements of
4. Why is all risk removed in a two-security portfolio if the securities are perfectly negatively
correlated?
5. Is the zero-risk portfolio described in Question 4 generally equally weighted in both
securities? Explain.
8.4 The Efficient Frontier
Concept Review Questions
1. How do you form the minimum variance frontier in the two-security case?
We can vary the weights in each security and determine the resulting portfolio expected returns

Introduction to Corporate Finance, Fourth Edition Booth, Cleary, Rakita
2. What assumptions about investors underlie Markowitz’s theories regarding efficient
portfolios?
• Investors are rational decision-makers.
3. Why is the efficient frontier bowed?
If the correlation between assets is 1, then the efficient frontier is a straight line. If the correlation
4. What is an unattainable portfolio, and what is a dominated portfolio?
Portfolios which lie below the efficient frontier are not attainable and dominated. It is
8.5 Diversification
Concept Review Questions
1. What is naïve diversification?
2. What is the difference between diversifiable and non-diversifiable risk?
The part of the total risk that is eliminated by diversification is the company-specific unique (or
3. Why is it logical to believe that international diversification will provide benefits to investors?