190 Instructor’s Manual
P7-3. Use the information below to estimate the expected return on the stock of Bieber Corpora-
tion.
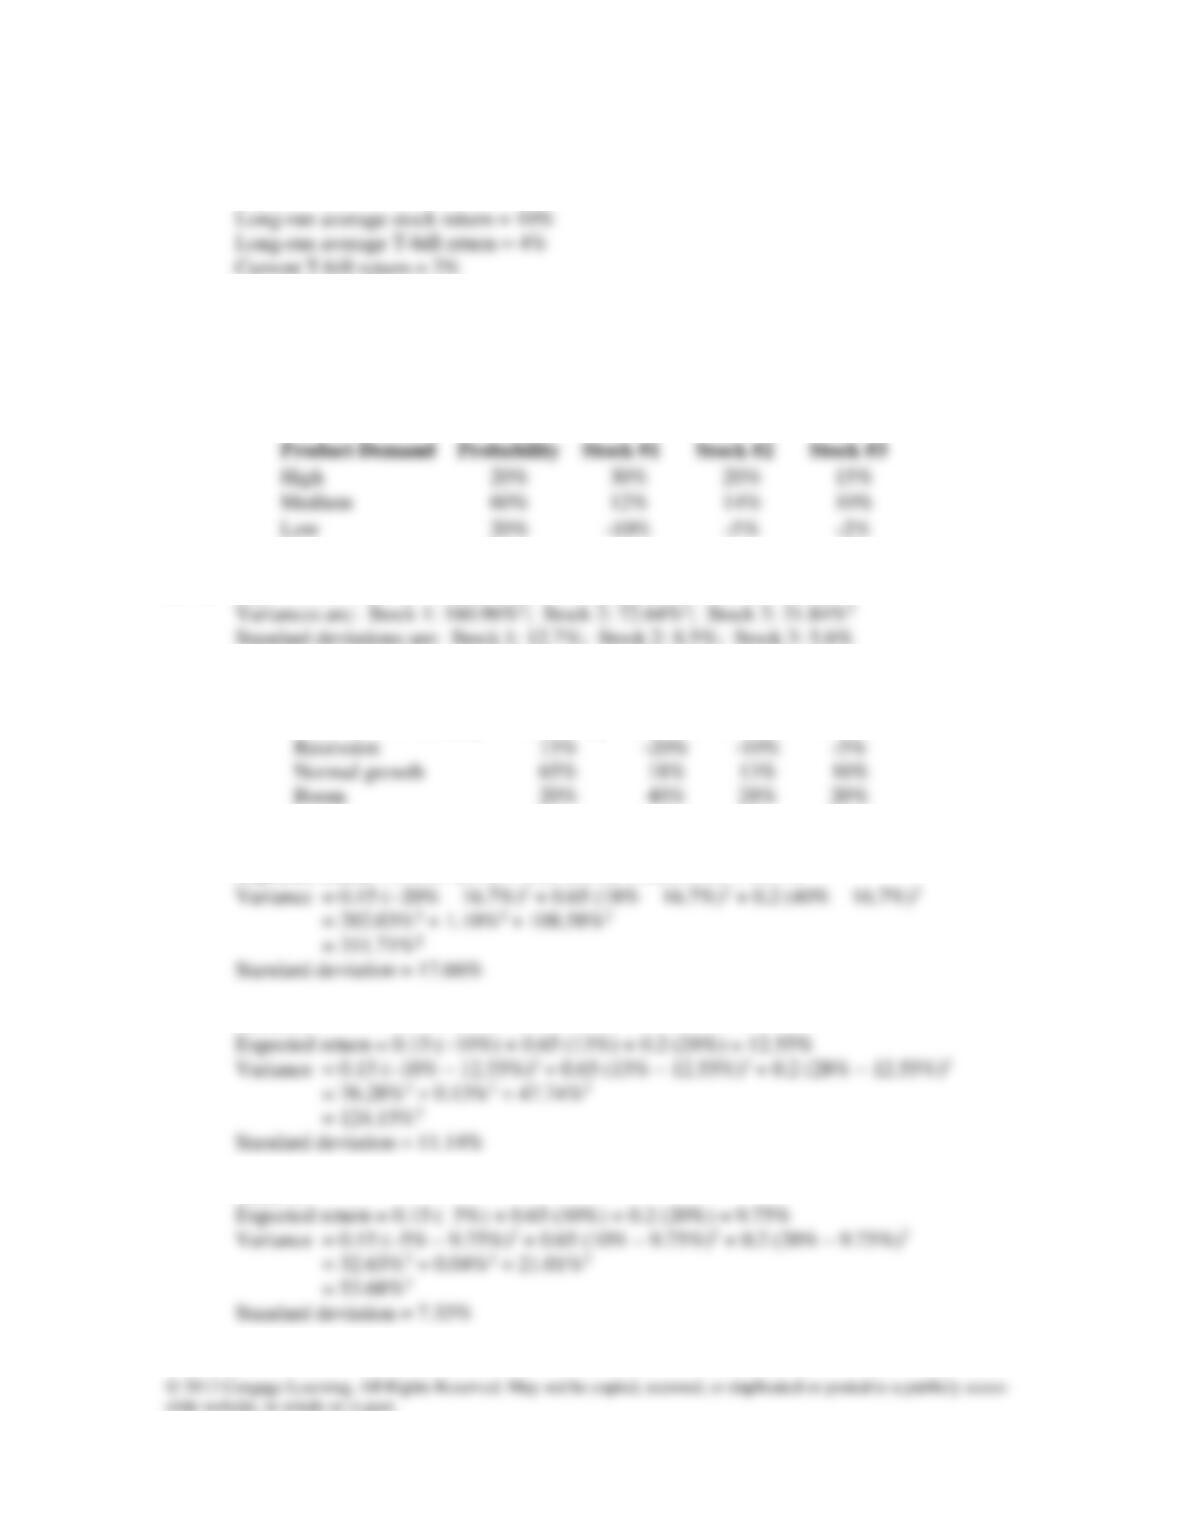
A7-3. The long-run risk premium on the stock is 6%, so add the current T-bill rate, 2%, to get
Hung’s expected return, 8%.
P7-4. Calculate the expected return, variance, and standard deviation for the stocks in the table
below.
A7-4. Expected returns are: Stock 1: 11.2%; Stock 2: 11.4%; Stock 3: 8.6%
P7-5. Calculate the expected return, variance, and standard deviation for each stock listed below.
State of the Economy
Probability
Stock A
Stock B
Stock C
A7-5. Stock A:
Expected return = 0.15 (−20%) + 0.65 (18%) + 0.2 (40%) = 16.7%
Stock B:
Stock C:
Chapter 7 Risk, Return, and the CAPM 191
P7-6. Refer to Figure 7.2 and answer the following questions.
a. What return would you expect on a stock with a beta of 2.0?
b. What return would you expect on a stock with a beta of 0.66?
c. What determines the slope of the line in Figure 7.2?
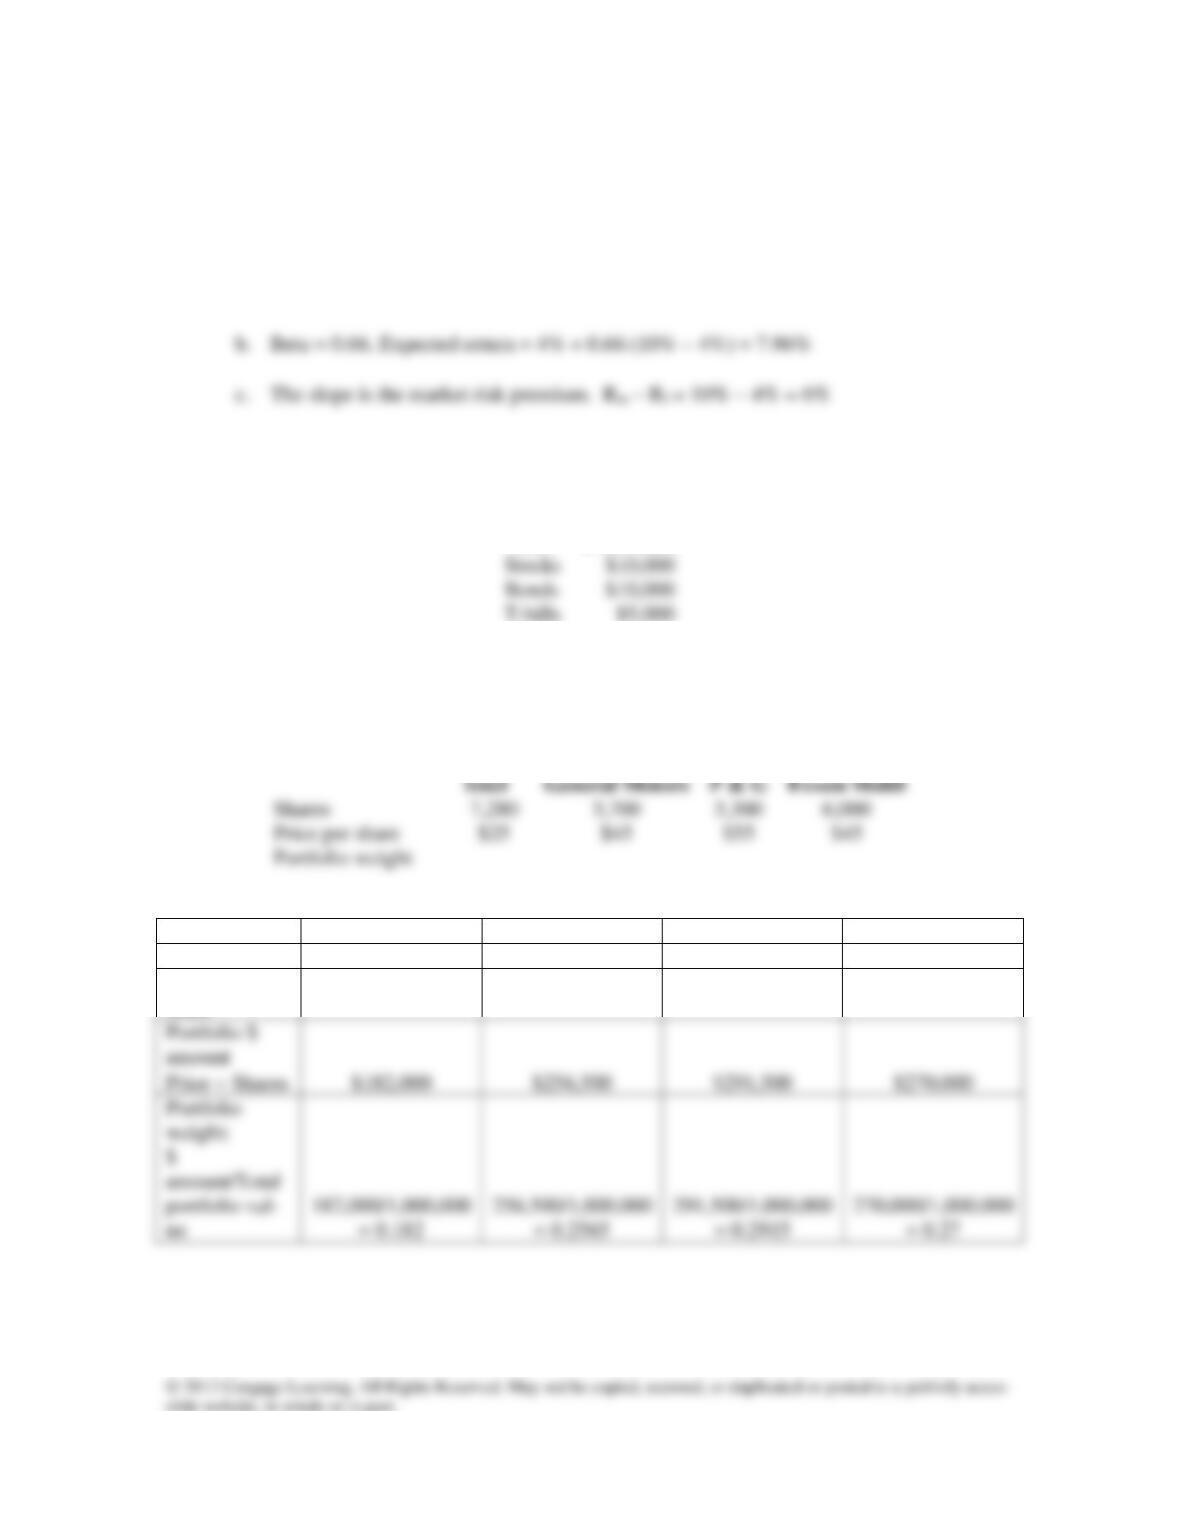
A7-6. a. Beta = 2, Expected return = 4% + 2 (10% − 4%) = 16%
Risk and Return for Portfolios
P7-7. Calculate the portfolio weights implied by the dollar investments in each of the asset clas-
ses below.
Asset
$ Invested
Stocks
Bonds
T-bills
A7-7. The weights are 40% each in stocks and bonds and 20% in T-bills.
P7-8. Wendi Deng recently inherited $1 million and has decided to invest it. Her portfolio con-
sists of the following positions in several stocks. Calculate the portfolio weights to fill in
the bottom row of the table.
Intel
General Motors
P & G
Exxon Mobil
Shares
Price per share
Portfolio weight
A7-8.
Intel
General Motors
P & G
Exxon Mobil
Shares
7,280
5,700
5,300
6,000
Price per
share
$25
$45
$55
$45
182,000/1,000,000
256,500/1,000,000
291,500/1,000,000
270,000/1,000,000
P7-9. Victoria Goldman is a financial advisor who manages money for high net worth individuals.
For a particular client, Victoria recommends the following portfolio of stocks.
192 Instructor’s Manual
Global Recording
Artists (GRA)
Soccer
Intl. (SI)
Liquid Oxygen
Corp. (LO)
Viva Mfg.
(VM)
Wannabe
Travel (WT)
Shares
8,000
9,000
7,000
10,500
4,000
$45
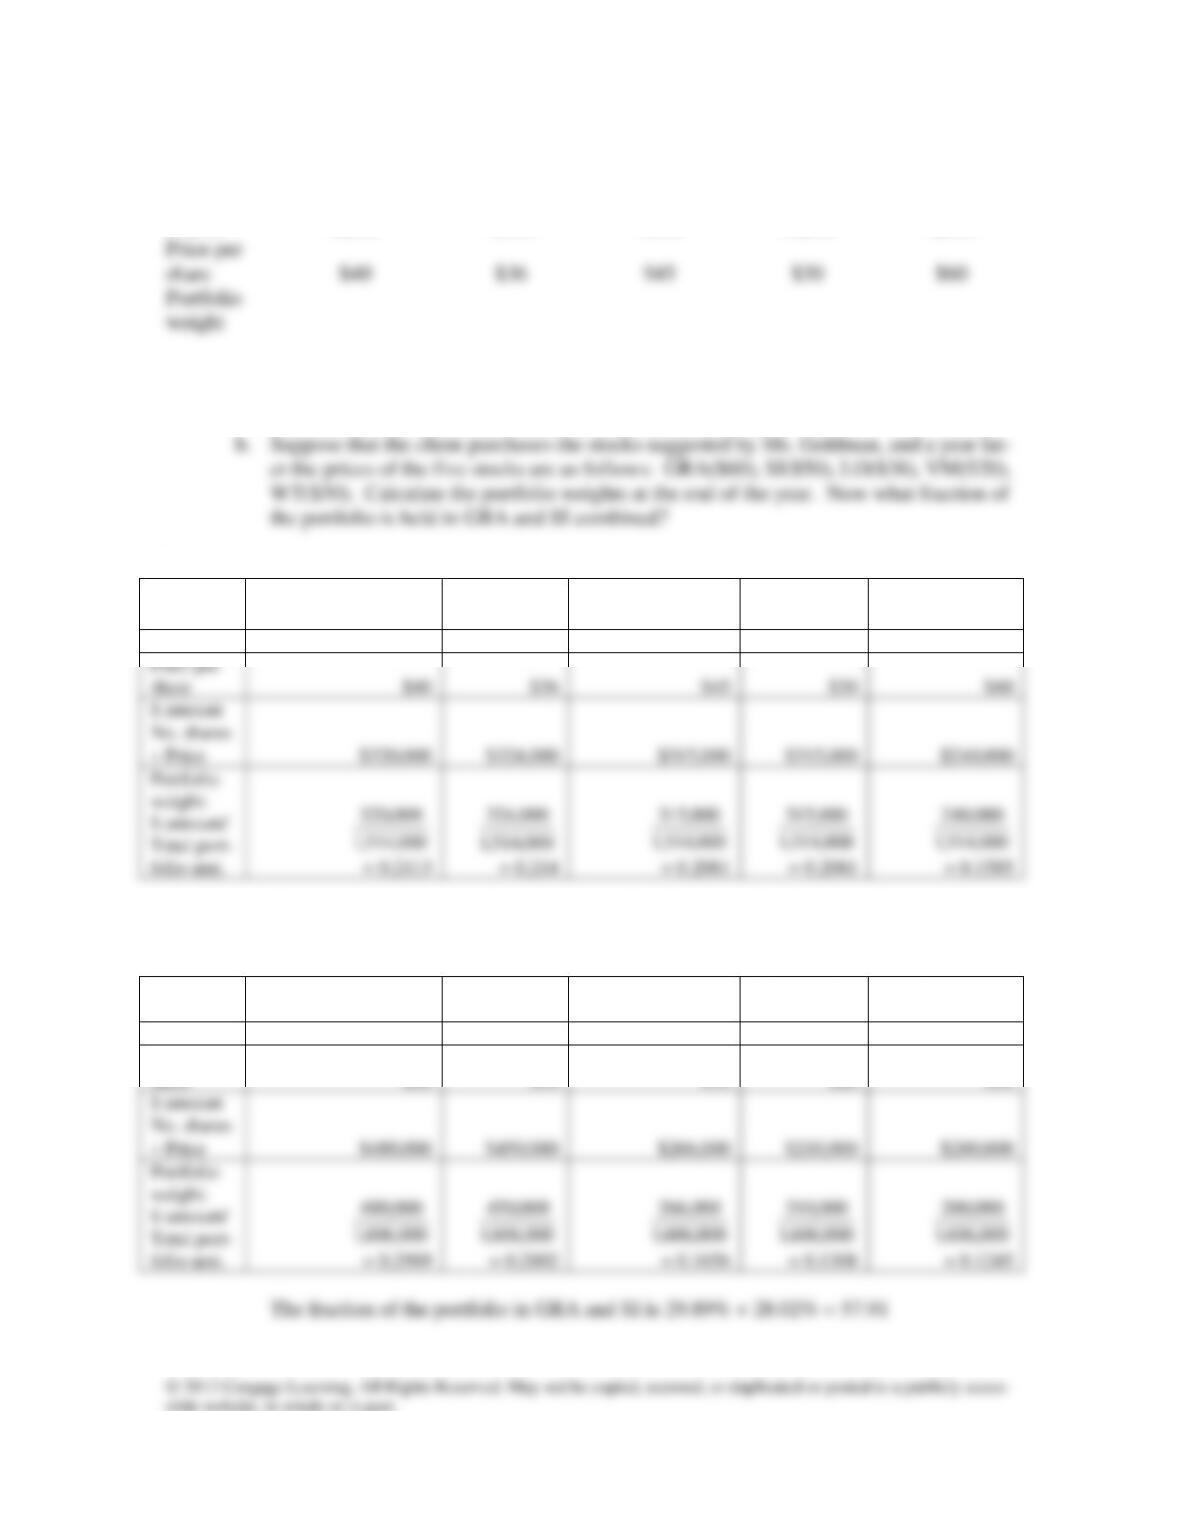
a. Calculate the portfolio weights implied by Ms. Goldman’s recommendations. What
fraction of the portfolio is invested in GRA and SI combined?
A7-9.
Global Recording
Artists (GRA)
Soccer Intl.
(SI)
Liquid Oxygen
Corp. (LO)
Viva Mfg.
(VM)
Wannabe Trav-
el (WT)
Shares
8,000
9,000
7,000
10,500
4,000
$40
$36
$45
$30
$60
= 0.2113
a. The fraction of the portfolio in GRA and SI is 21.13% + 21.4% = 42.53%
b. New portfolio weights:
Global Recording
Artists (GRA)
Soccer Intl.
(SI)
Liquid Oxygen
Corp. (LO)
Viva Mfg.
(VM)
Wannabe Trav-
el (WT)
Shares
8,000
9,000
7,000
10,500
4,000
Price per
share
$60
$50
$38
$20
$50
= 0.2989
Chapter 7 Risk, Return, and the CAPM 193
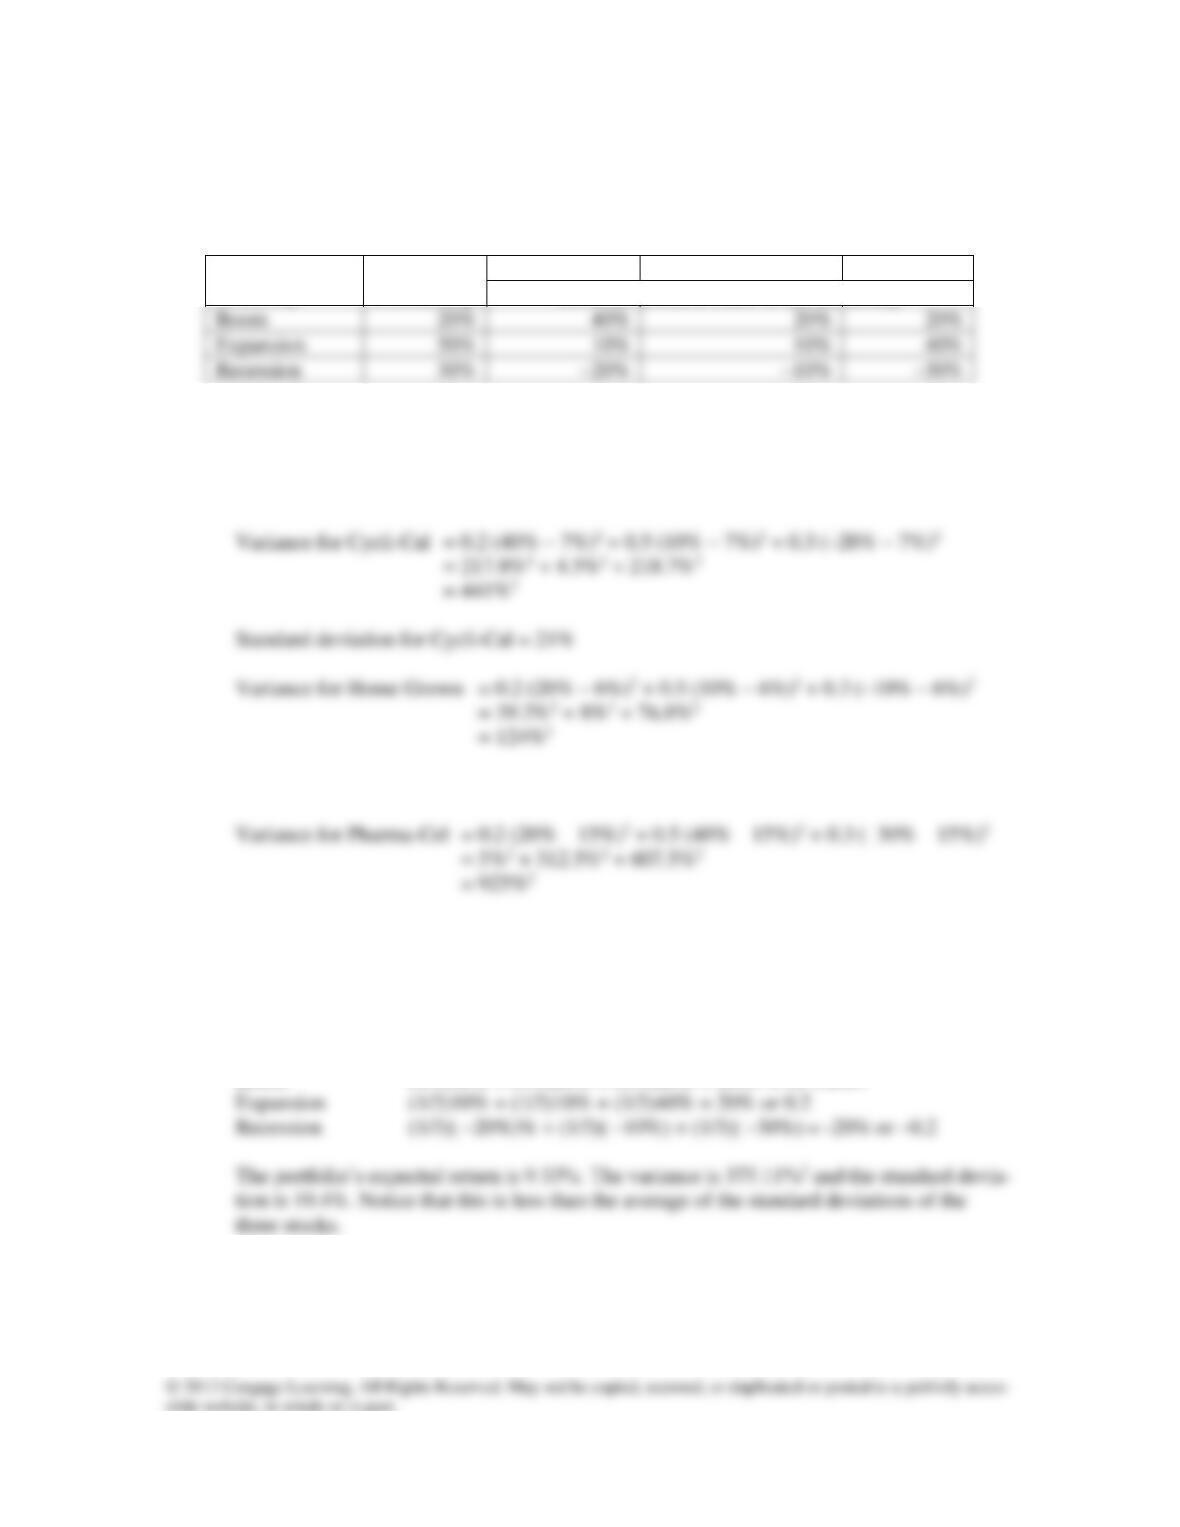
P7-10. Calculate the expected return, variance, and standard deviation for the stocks in the table
below. Next, form an equally weighted portfolio of all three stocks and calculate its mean,
variance, and standard deviation.
State of the
Economy
Probability
Cycli-Cal Inc.
Home Grown Crop.
Pharma-Cel
Returns in Each State of the Economy
A7-10. Expected return:
Cycli-Cal: 0.2 (40%) + 0.5 (10%) + 0.3 (–20%) = 7%
Home Grown: 0.2 (20%) + 0.5 (10%) + 0.3 (–10%) = 6%
Pharma-Cel: 0.2 (20%) + 0.5 (40%) + 0.3 (–30%) = 15%
Standard deviation for Home Grown = 11.1%
Standard deviation for Pharma-Cel = 30.4%
To calculate these statistics for the equally-weighted portfolio, we first must calculate the
portfolio’s return in each state of the economy. That’s fairly simple.
Economy Portfolio Return
Boom (1/3)40% + (1/3)20% + (1/3)20% = 26.67% or 0.2667
P7-11. You analyze the prospects of several companies and come to the following conclusions
about the expected return on each:
194 Instructor’s Manual
Stock Expected Return
Starbucks 18%
Sears 8%
A7-11. Total portfolio value = 4,000 + 6,000 + 12,000 + 3,000 = $25,000
P7-12. Calculate the expected return of the portfolio described in the accompanying table.
Stock
$ Invested
Expected Return
A
$40,000
10%
$25,000
12%
P7-13. Calculate the portfolio weights based on the dollar investments in the table below. Interpret
the negative sign on one investment. What is the size of the initial investment on which an
investor’s rate of return calculation should be based?
Stock
$ Invested
1
$10,000
2
A7-13. Weight for Stock 1: 10,000/10,000 = 1, or 100%
Weight for Stock 2: −5,000/10,000 = −0.5, or −50%
P7-14. Pete Pablo has $20,000 to invest. He is very optimistic about the prospects of two compa-
nies, 919 Brands Inc., and Diaries.com. However, Pete has a very pessimistic view of one
firm, a financial institution known as Lloyd Bank. The current market price of each stock
and Pete’s assessment of the expected return for each stock appear below.
Chapter 7 Risk, Return, and the CAPM 195
Stock
Price
Expected Return
919 Brands
$60
10%
Diaries.com
$80
14%
Lloyd Bank
$70
−8%
a. Pete decides to purchase 210 shares of 919 Brands and 180 shares of Diaries.com.
What is the expected return on this portfolio? Can Pete construct this portfolio with
the amount of money he has to invest?
b. If Pete sells short 100 shares of Lloyd Bank, how much additional money will he have
to invest in the other two stocks?
c. If Pete buys 210 shares of 919 Brands and 180 shares of Diaries.com, and he simulta-
neously short sells 100 shares of Lloyd Bank, what are the resulting portfolio weights
in each stock? (Hint: the weights must sum to one, but they need not all be positive).
d. What is the expected return on the portfolio described in part (c.)?
A7-14. a. Dollars invested in 919 Brands: 210 $60 = $12,600
P7-15. Shares in Springfield Nuclear Power Corp. (SNP) currently sell for $25. You believe that
the shares will be worth $30 in one year, and this implies that return you expect on these
shares is 20% (the company pays no dividends).
a. If you invest $10,000 by purchasing 400 shares, what the expected value of your hold-
ings next year?
b. Now suppose that you buy 400 shares of SNP, but you finance this purchase with
$5,000 of your own funds and $5,000 that you raise by selling short 100 shares of
Nader Insurance Inc. Nader Insurance shares currently sell for $50, but next year you
c. Suppose you buy 400 shares of SNP and finance them as described in part b. Howev-
er, at the end of the year SNP stock is worth $31. What was the percentage increase in
SNP stock? What is the rate of return on your portfolio (again, after you repurchase
Nader shares and return them to your broker)?
196 Instructor’s Manual
d. Finally, assume that at the end of one year, SNP shares have fallen to $24. What was
the rate of return on SNP stock for the year? What is the rate of return on your portfo-
lio?
e. What is the general lesson illustrated here? What is the impact of short selling on the
expected return and risk of your portfolio?
A7-15. a. 400 $30 = $12,000
P7-16. You are given the following data on several stocks:
State of
the Economy
Probability
Returns in Each State of the Economy
Gere
Mining
Reubenfeld
Films
DeLorean
Automotive
Boom
25%
40%
24%
−20%
Expansion
50%
12%
10%
12%
Recession
25%
−20%
−12%
40%
a. Calculate the expected return and standard deviation for each stock.
b. Calculate the expected return and standard deviation for a portfolio invested equally in
Gere Mining and Reubenfeld Films. How does the standard deviation of this portfolio
compare to a simple 50-50 weighted average of the standard deviations of the two
stocks?
c. Calculate the expected return and standard deviation for a portfolio invested equally in
Gere Mining and DeLorean Automative. How does the standard deviation of this port-
folio compare to a simple 50-50 weighted average of the standard deviations of the two
stocks?
d. Explain why your answers regarding the portfolio standard deviations are so different
in parts b and c.
A7-16. a. Gere: 0.25 (40%) + 0.5 (12%) + 0.25 (–20%) = 11%
Chapter 7 Risk, Return, and the CAPM 197
b. Expected portfolio return for Gere and Reubenfeld: .5 11% + .5 8% = 9.5%
Standard deviation is 17.04%. This is roughly equal to a 50-50 weighted average of
d. DeLorean is strongly negatively correlated with Gere and Reubenfeld (which are
P7-17. In an odd twist of fate, the return on the stock market has been exactly 1% in each of the
A7-17. The beta tells us how much, on average, a stock moves when the market moves by 1%.
Because the market’s move in all eight months was 1%, we can simply take the average of
the eight monthly stock returns, which is 1.5%. From that we can infer that the stock beta
is 1.5.
P7-18. Petro-Chem Inc. stock has a beta equal to 0.9. Digi-Media Corp.’s stock beta is 2.0. What
198 Instructor’s Manual
Putting It All Together: The CAPM
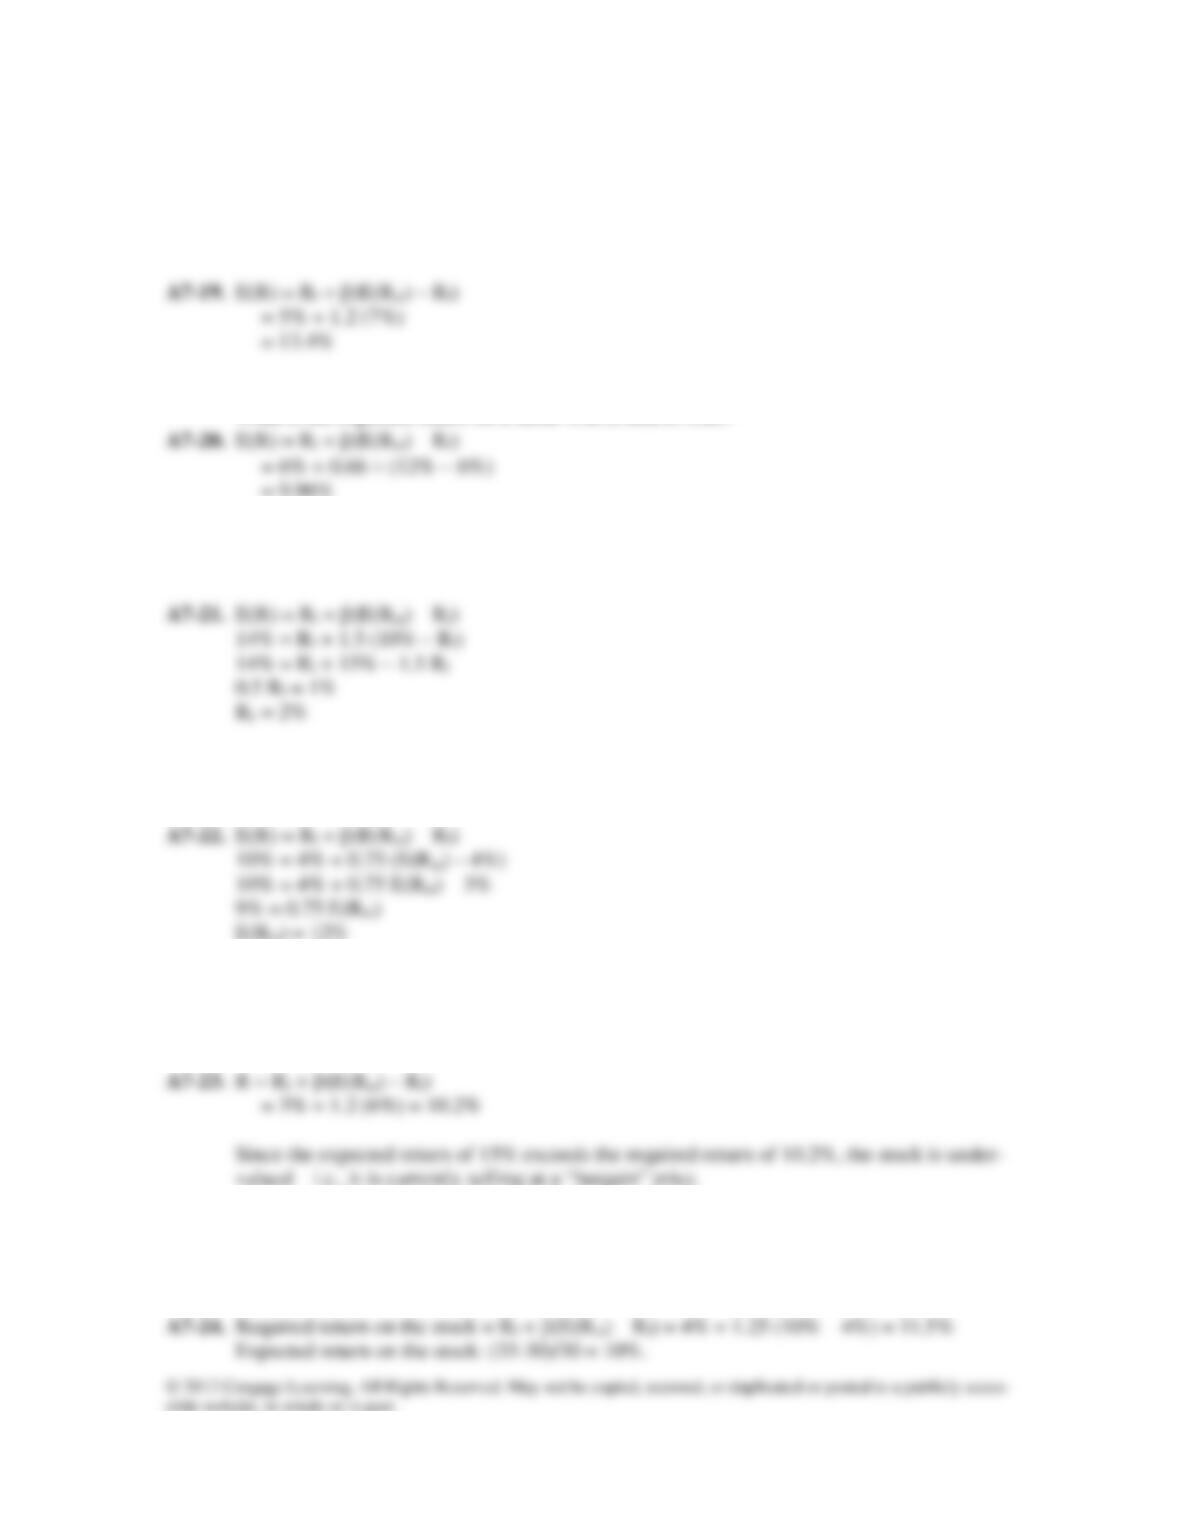
P7-19. The risk-free rate is currently 5%, and the expected risk premium on the market portfolio is
7%. What is the expected return on a stock with a beta of 1.2?
P7-20. The expected return on the market portfolio equals 12%. The current risk-free rate is 6%.
What is the expected return on a stock with a beta of 0.66?
= 9.96%
P7-21. The expected return on a particular stock is 14%. The stock’s beta is 1.5. What is the risk–
free rate if the expected return on the market portfolio equals 10%?
P7-22. If the risk-free rate equals 4% and a stock with a beta of 0.75 has an expected return of
10%, what is the expected return on the market portfolio?
P7-23. You believe that a particular stock has an expected return of 15%. The stock’s beta is 1.2,
the risk-free rate is 3%, and the expected market risk premium is 6%. Based on this, is
your view that the stock is overvalued or undervalued?
P7-24. A particular stock sells for $30. The stock’s beta is 1.25, the risk-free rate is 4%, and the
expected return on the market portfolio is 10%. If you forecast that the stock will be worth
$33 next year (assume no dividends), should you buy the stock or not?
Chapter 7 Risk, Return, and the CAPM 199
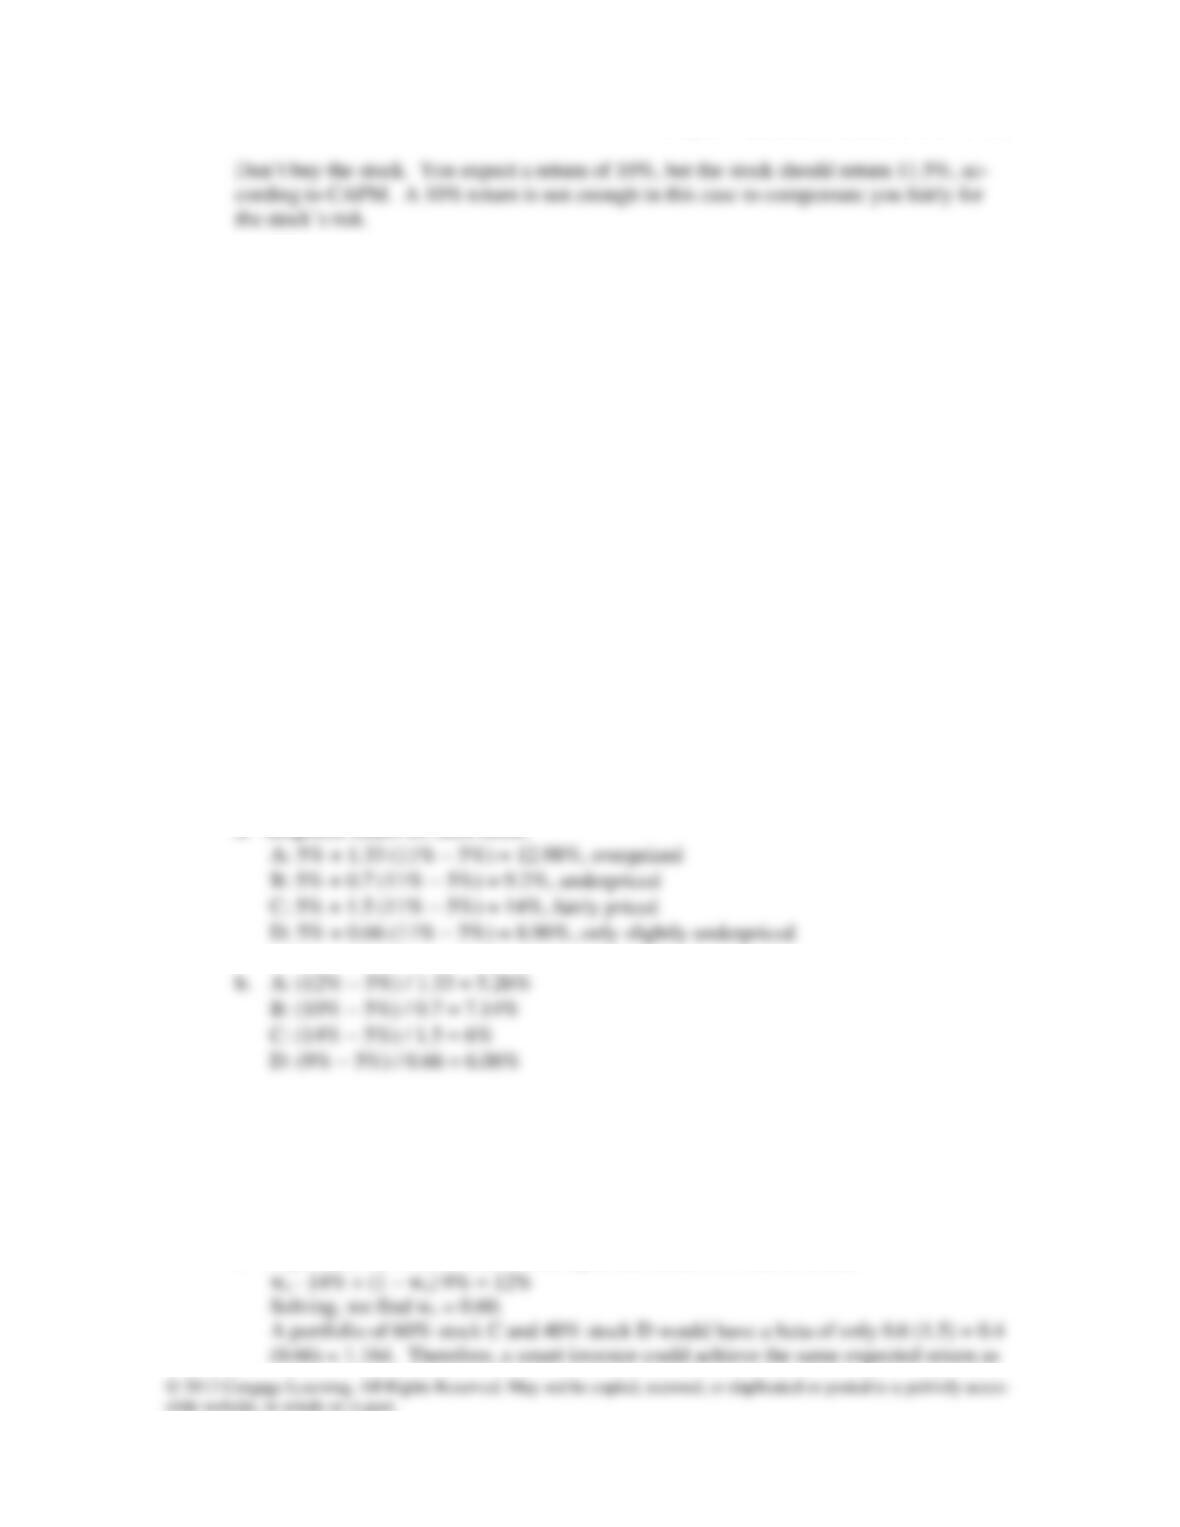
P7-25. Currently the risk-free rate equals 5% and the expected return on the market portfolio
equals 11%. An investment analyst provides you with the following information:
Stock
Beta
Expected Return
A
1.33
12%
B
0.70
10%
C
1.50
14%
D
0.66
9%
a. Indicate whether each stock is overpriced, underpriced, or correctly priced.
b. For each stock, subtract the risk-free rate from the stock’s expected return and divide
the result by the stock’s beta. For example, for asset A this calculation is (12% − 5%)
÷ 1.33. Provide an interpretation for these ratios. Which stock has the highest ratio
and which has the lowest?
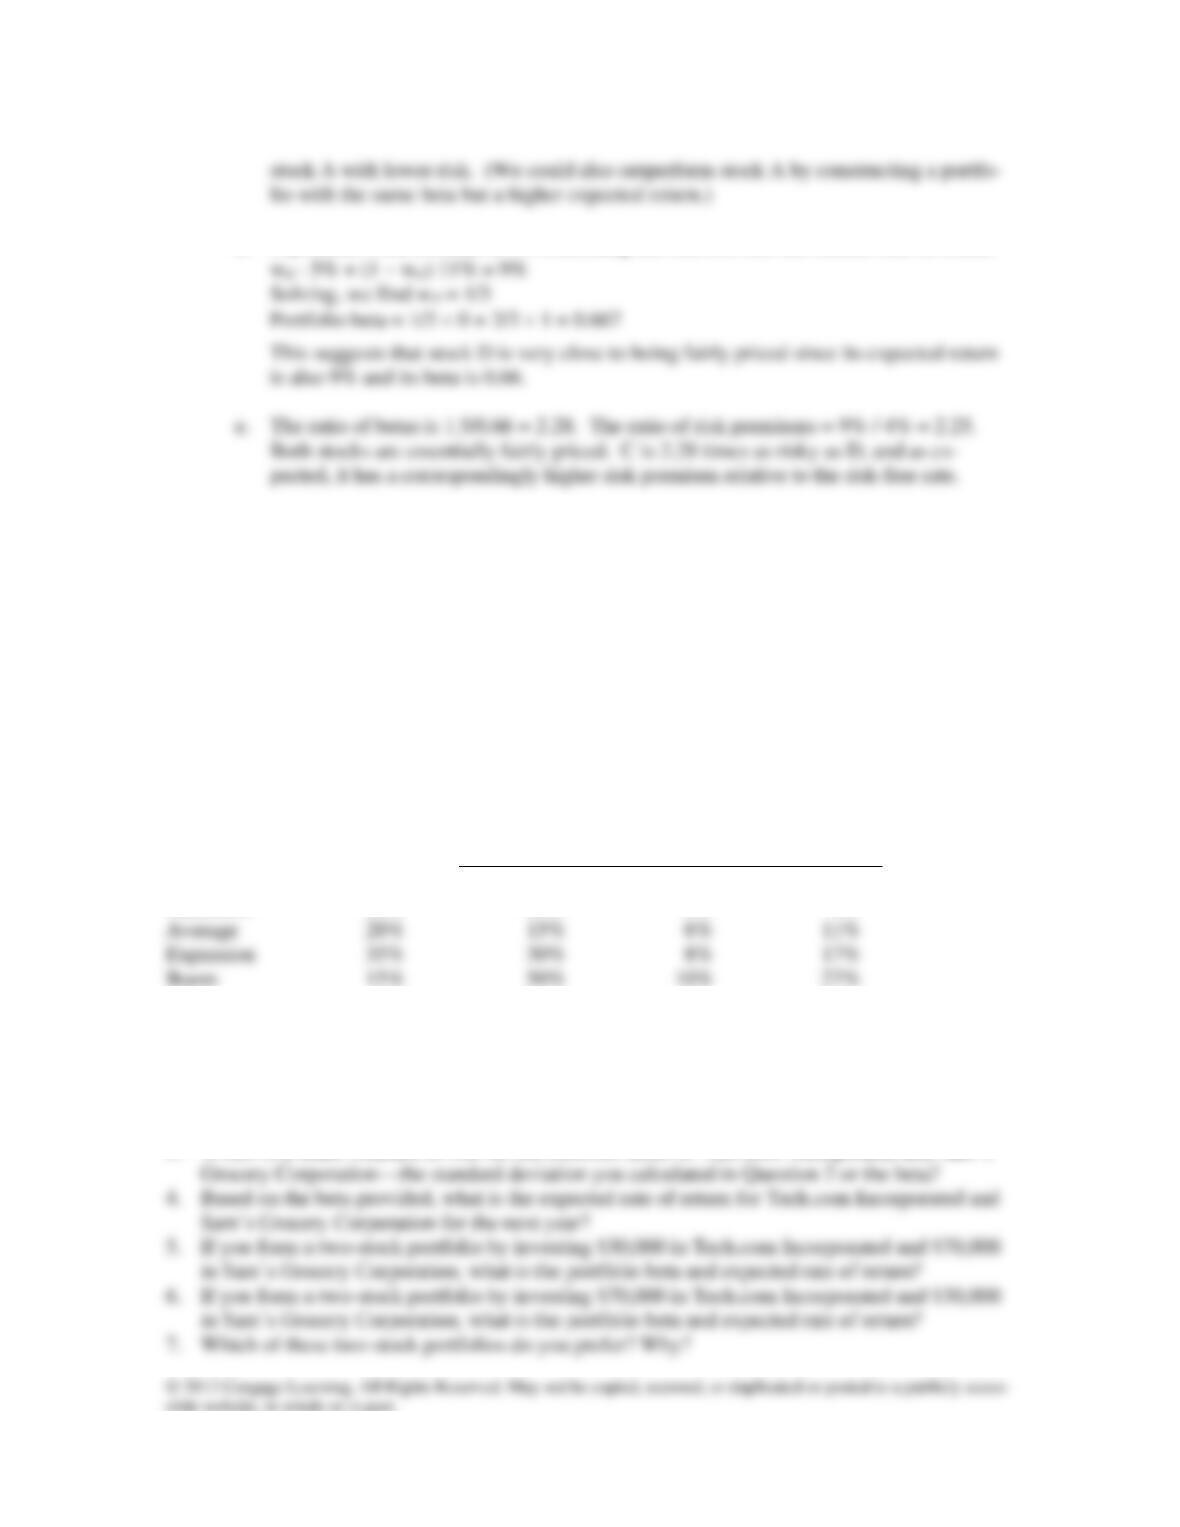
c. Show how a smart investor could construct a portfolio of stocks C and D that would
outperform stock A.
d. Construct a portfolio consisting of some combination of the market portfolio and the
risk-free asset such that the portfolio’s expected return equals 9%. What is the beta of
this portfolio? What does this say about stock D?
e. Divide the risk premium on stock C by the risk premium on stock D. Next, divide the
beta of stock C by the beta of stock D. Comment on what you find.
A7-25. Return for stock:
a. Required return for each stock:
These ratios compare the stock’s excess return (above the risk-free rate of 5%) to the
stock’s systematic risk as measured by beta. C, the fairly priced stock, has a ratio ex-
actly equal to the market risk premium of 6%. The overvalued stock has a ratio less
than the market risk premium and the underpriced stocks have ratios greater than the
market risk premium.
c. A portfolio of C and D that would equal the return of A can be found:
200 Instructor’s Manual
d. A portfolio with a return of 9% combining the risk free rate and market can be found:
THOMSON ONE Business School Edition: Because P7-26 and P7-27 are based on using a live
data base, answers will vary from moment to moment.
Answer to MiniCase
Risk, Return, and the Capital Asset Pricing Model
On your first day as an intern at Tri-Star Management Incorporated the CEO asks you to analyze the fol-
lowing information pertaining to two common stock investments, Tech.com Incorporated and Sam’s
Grocery Corporation. You are told that a one-year Treasury bill will have a rate of return of 5% over the
next year. Also, information from an investment advising service lists the current beta for Tech.com as
1.68 and for Sam’s Grocery as 0.52. You are provided a series of questions to guide your analysis.
Estimated Rate of Return .
Economy Probability Tech.com Sam’s Grocery S&P 500
Recession 30% –20% 5% – 4%
Assignment
1. Calculate the expected rate of return for Tech.com Incorporated, Sam’s Grocery Corporation,
and the S&P 500 Index.
2. Calculate the standard deviations of the estimated rates of return for Tech.com Incorporated,
Sam’s Grocery Corporation, and the S&P 500 Index.
3. Which is a better measure of risk for the common stock of Tech.com Incorporated and Sam’s
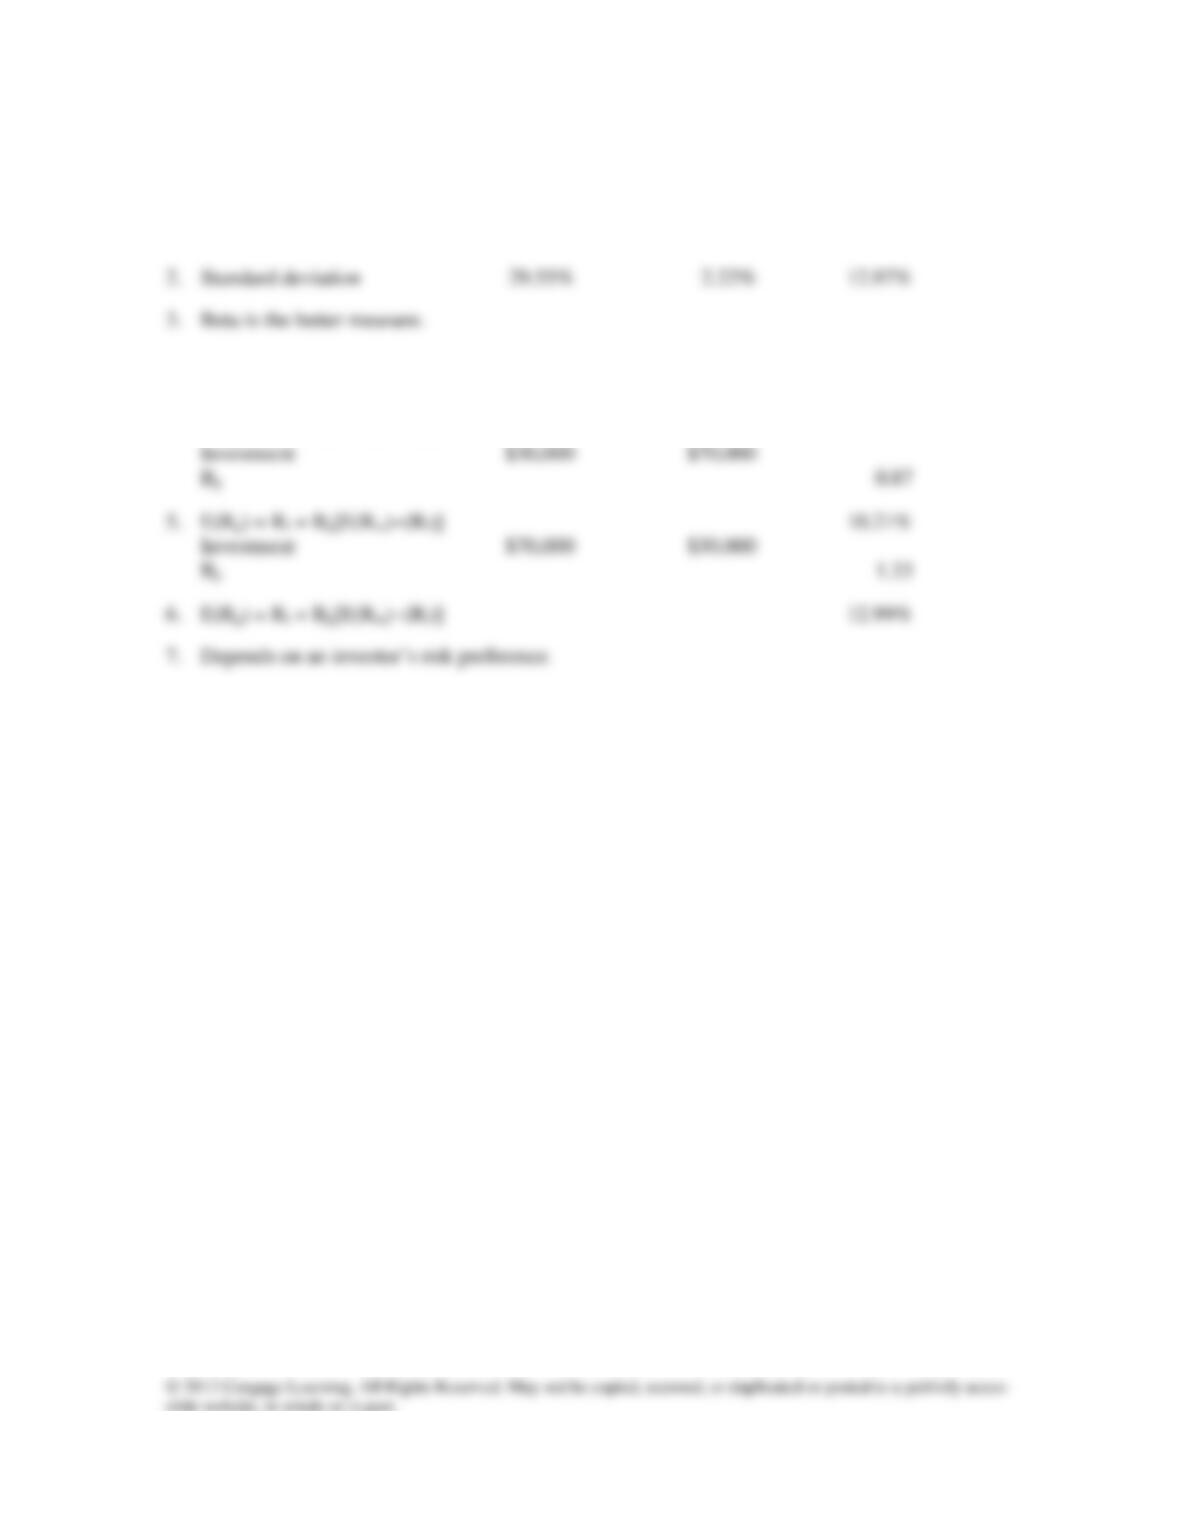
Chapter 7 Risk, Return, and the CAPM 201
Answers
Tech.com Sam’s Grocery S&P 500
1. Expected rate of return 15% 7% 11%
4. Beta 1.68 0.52
E(Ri) = Rf + Bi[E(Rm)−(Rf)] 15.08% 8.12%