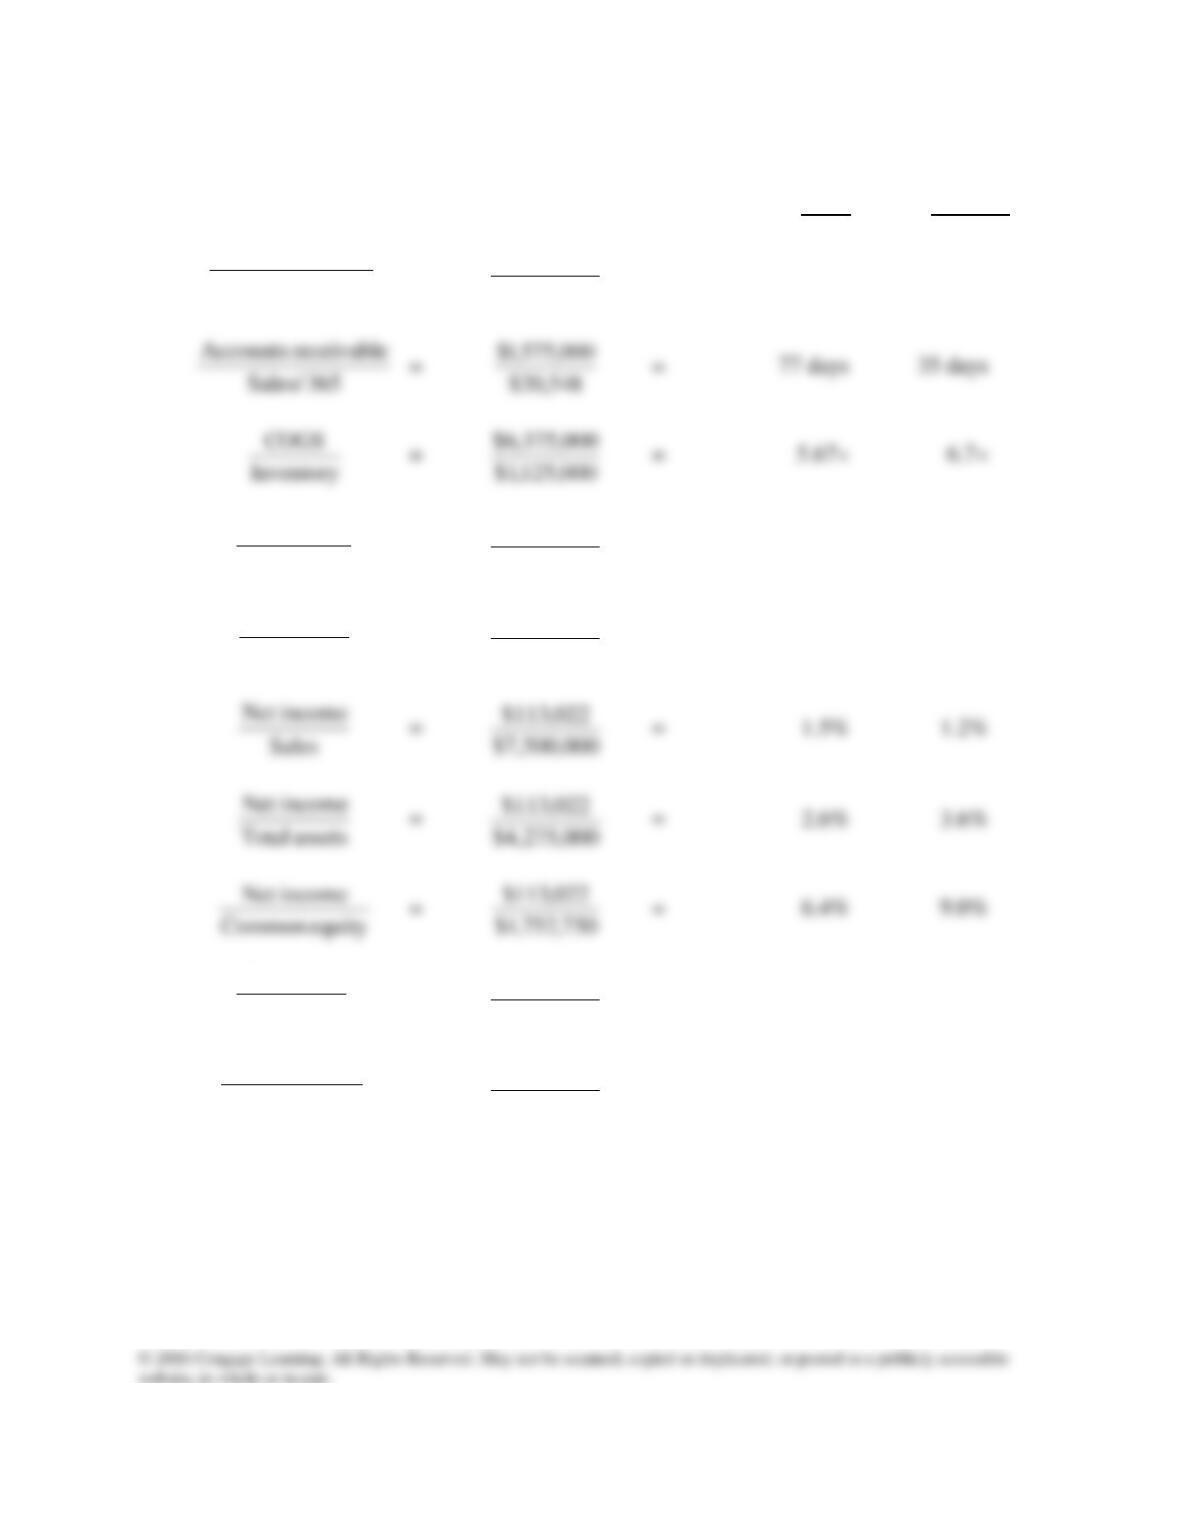
7-13 a. (Dollar amounts in thousands.)
Industry
Firm Average
Current assets
Current liabilities =
005,453,1$
,000925,2$
= 2.01× 2.0×
assets Fixed
Sales
=
000,350,1$
000,500,7$
= 5.56× 12.1×
assets Total
Sales
=
000,275,4$
000,500,7$
= 1.75× 3.0×
000,500,7$
assets Total
000,275,4$
Total debt
Total assets =
000,275,4$
384,395,1$
= 33% 30%
Total liabilities
Total assets =
000,
275,4$
250,522,2$
= 59% 60.0%
Answers and Solutions: 7 – 17
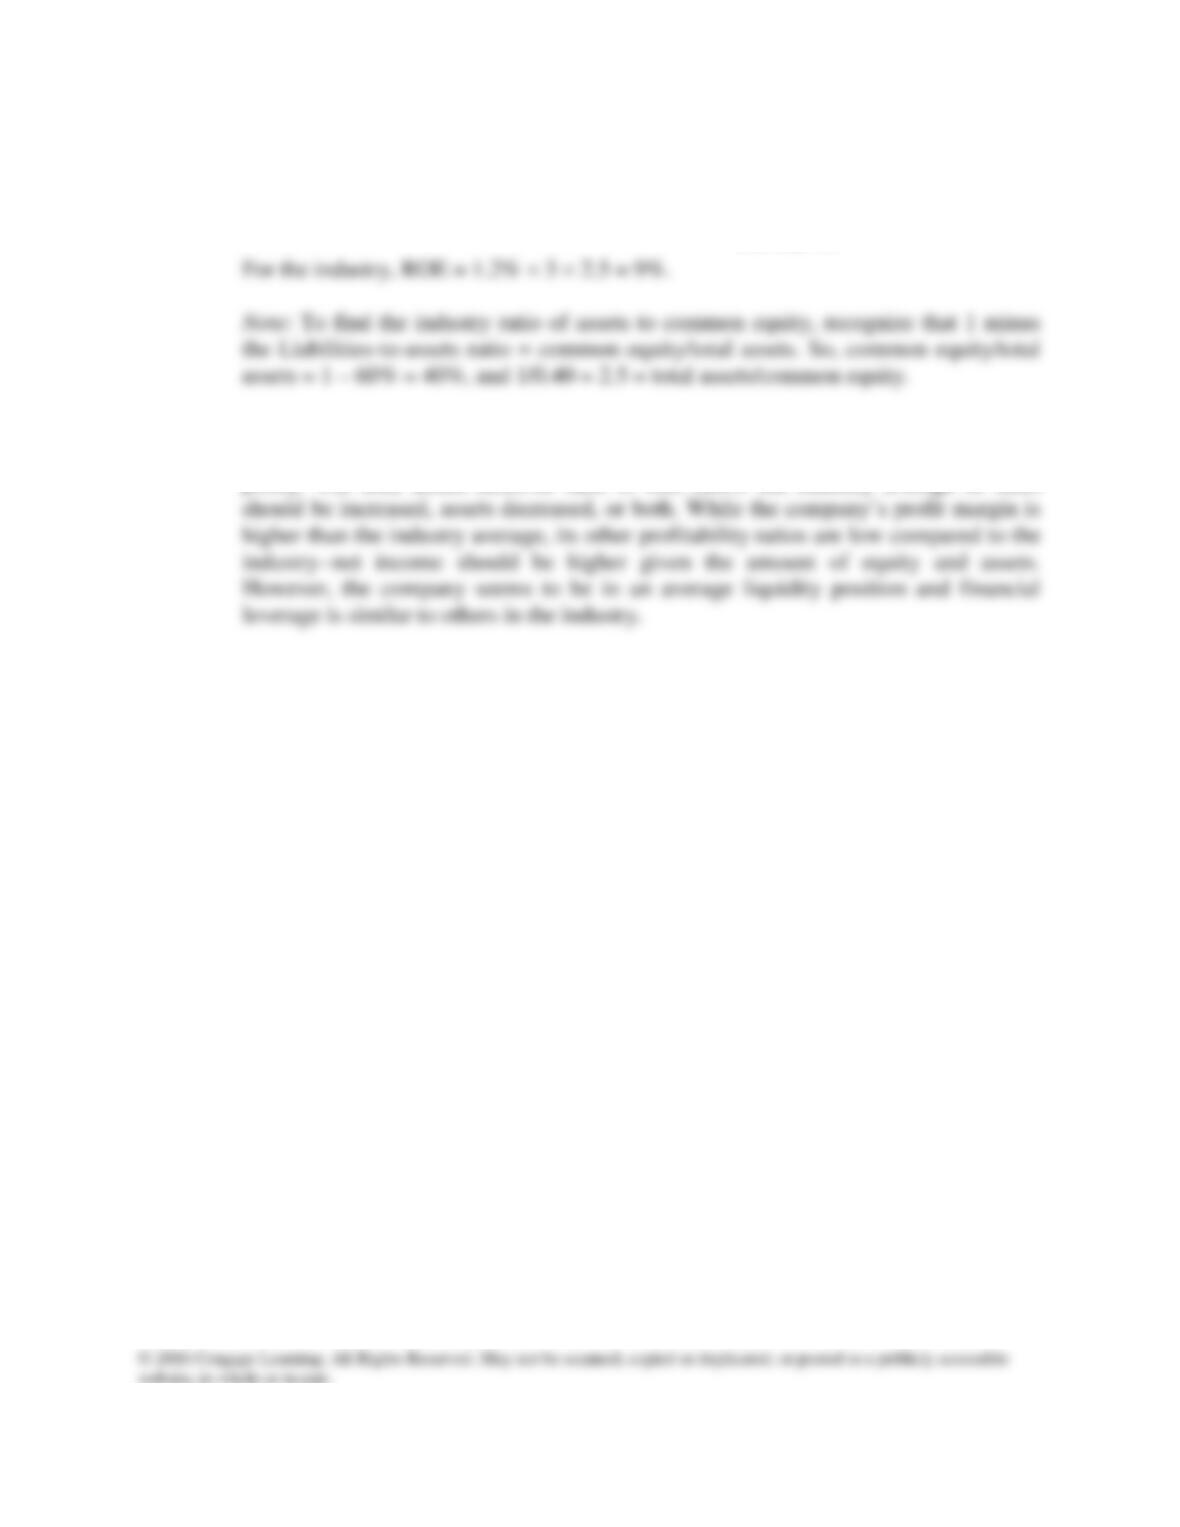
b. For the firm,
ROE = PM × T.A. turnover × EM = 1.51% × 1.75 ×
750,752,1$
000,275,4$
= 6.45%.
c. The firm’s days sales outstanding is more than twice as long as the industry average,
indicating that the firm should tighten credit or enforce a more stringent collection
policy. The total assets turnover ratio is well below the industry average so sales
Answers and Solutions: 7 – 18
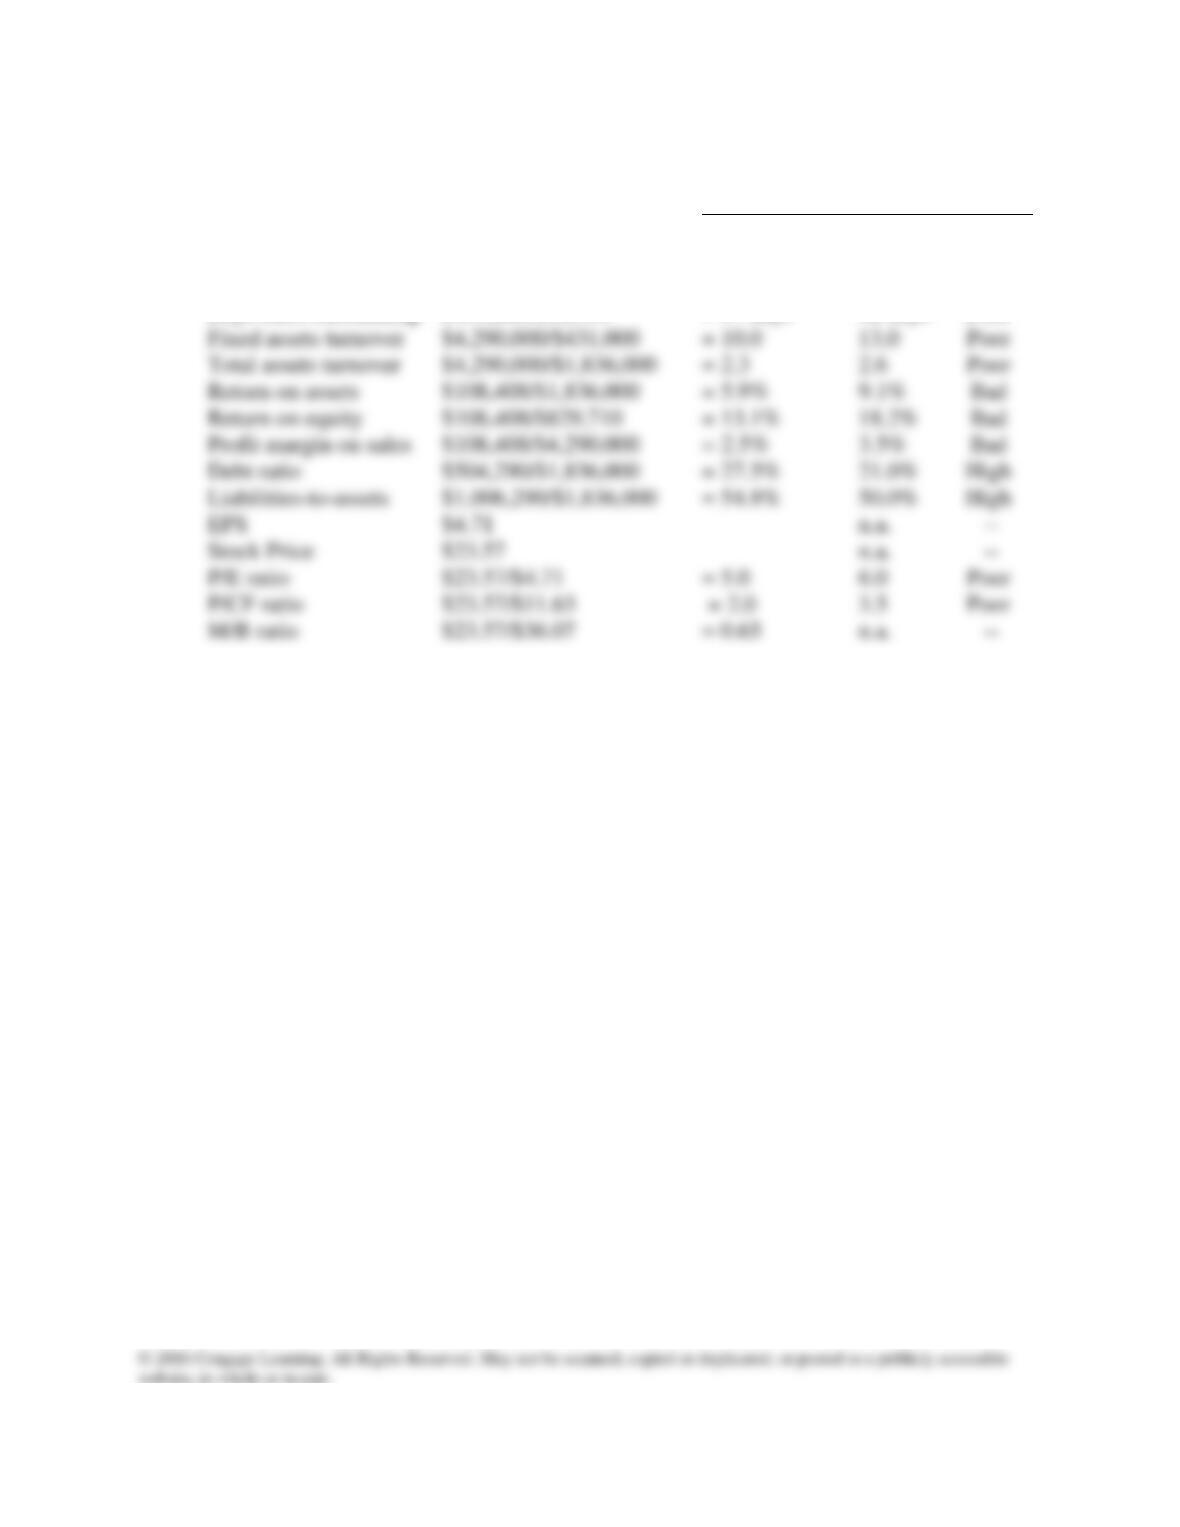
7-14 Here are the firm’s base case ratios and other data as compared to the industry:
Firm Industry Comment
Quick $511,000/$602,000 = 0.8 1.0 Weak
Current $1,405,000/$602,000 = 2.3 2.7 Weak
Inventory turnover $3,739,000/$894,000 = 4.2 7.0 Poor
Days sales outstanding $439,000/$11,753 = 37 days 32 days Poor
The firm appears to be badly managed—all of its ratios are worse than the industry
averages, and the result is low earnings, a low P/E, P/CF ratio, a low stock price, and a
low M/B ratio. The company needs to do something to improve.
Answers and Solutions: 7 – 19

SOLUTION TO SPREADSHEET PROBLEM
7-15 The detailed solution for the problem is available is in the file Ch07 P15 Build a Model
Answers and Solutions: 7 – 20
MINI CASE
The first part of the case, presented in Chapter 6, discussed the situation of Computron
Industries after an expansion program. A large loss occurred in 2015, rather than the
expected profit. As a result, its managers, directors, and investors are concerned about the
firm’s survival.
Jenny Cochran was brought in as assistant to Gary Meissner, Computron’s chairman,
Mini Case: 7 – 21
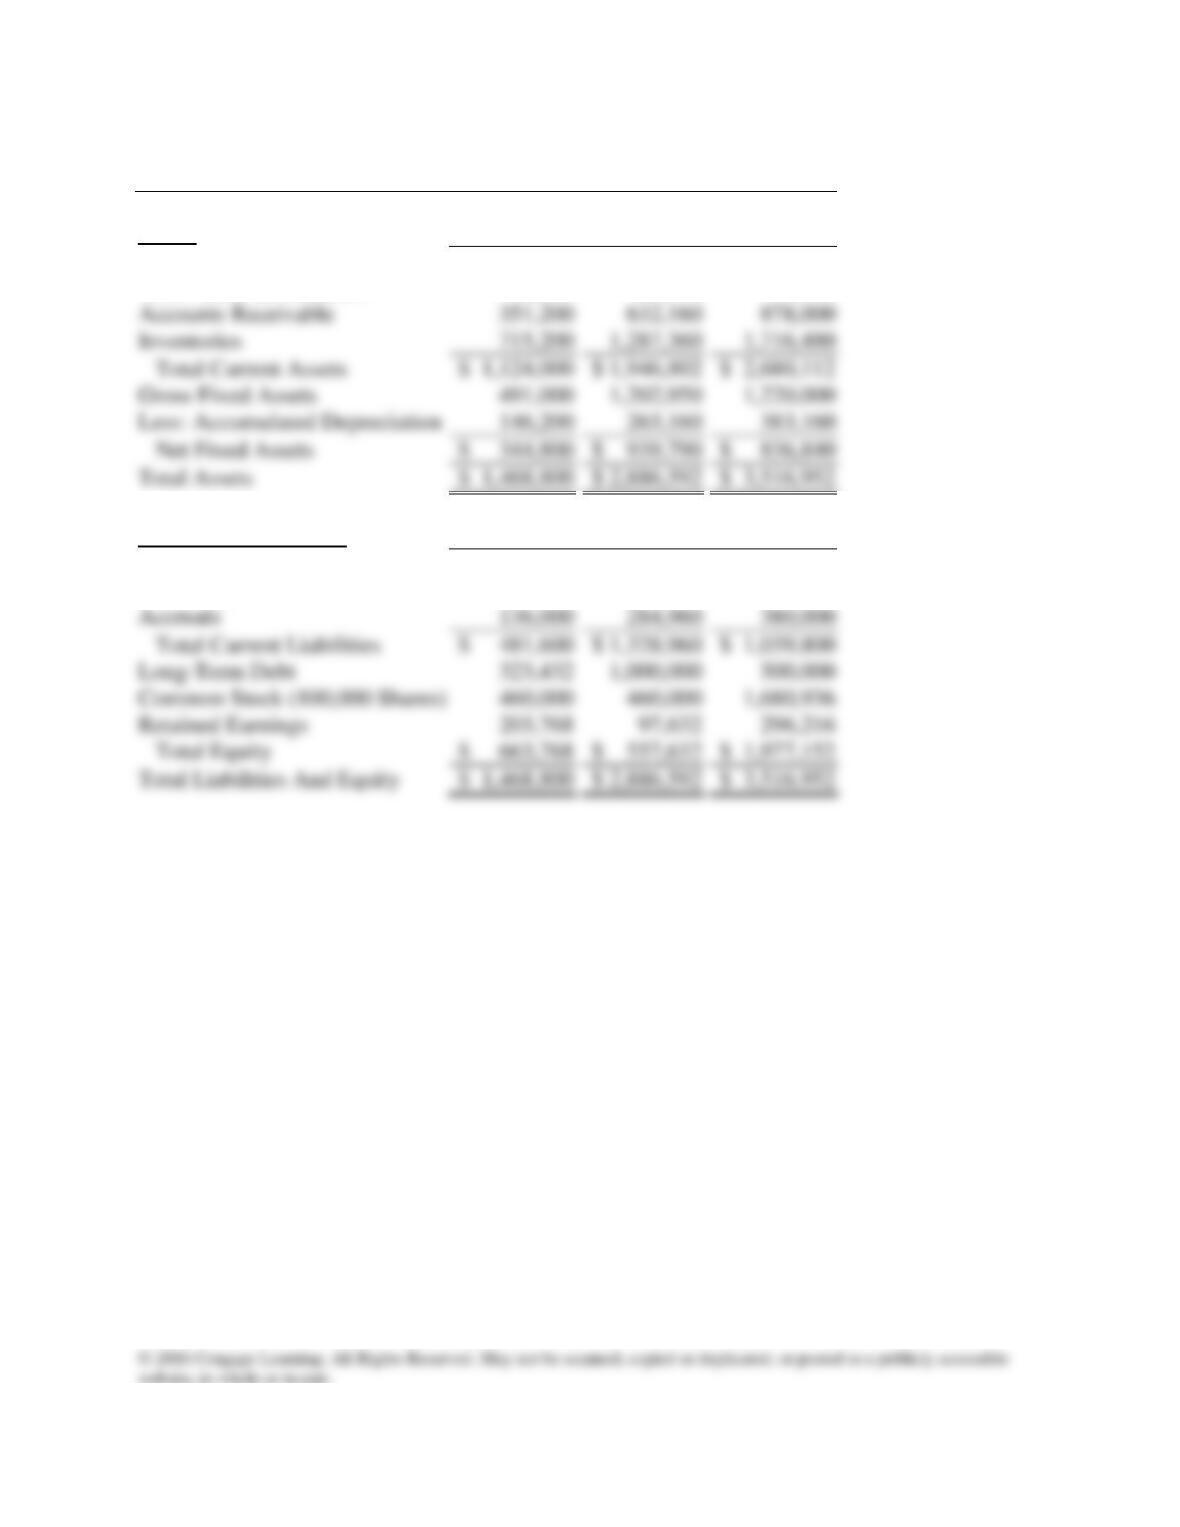
Balance Sheets
Assets
2014
2015
2016e
Cash
$ 9,000
$ 7,282
$ 14,000
Short-Term Investments.
48,600
20,000
71,632
Liabilities And Equity
2013
2014
2015e
Accounts Payable
$ 145,600
$ 324,000
$ 359,800
Notes Payable
200,000
720,000
300,000
Accruals
136,000
284,960
380,000
Total Current Liabilities
$ 481,600
$ 1,328,960
$ 1,039,800
323,432
500,000
Common Stock (100,000 Shares)
460,000
460,000
203,768
97,632
296,216
Total Equity
$ 663,768
$ 557,632
$ 1,977,152
$ 1,468,800
$ 2,886,592
$ 3,516,952
Mini Case: 7 – 22
351,200
632,160
878,000
Inventories
715,200
Total Current Assets
$ 1,124,000
$ 1,946,802
$ 2,680,112
491,000
146,200
263,160
383,160
Net Fixed Assets
$ 344,800
$ 939,790
$ 836,840
$ 1,468,800
$ 2,886,592
$ 3,516,952
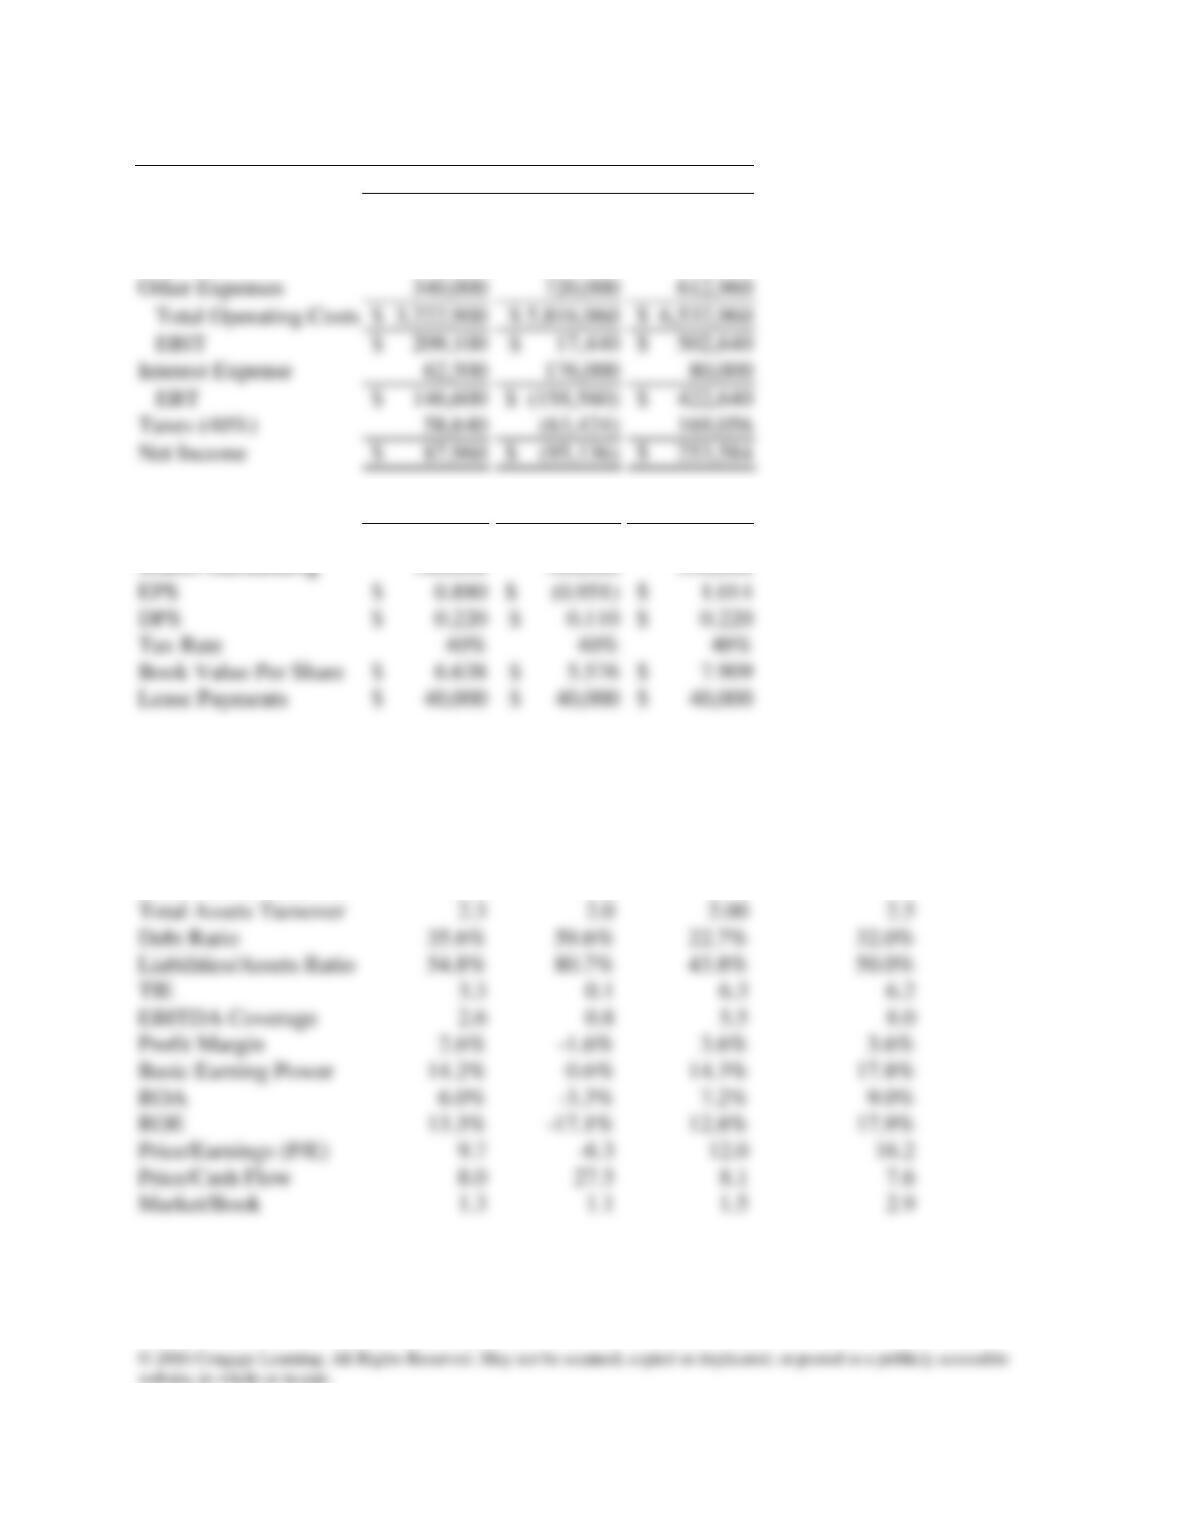
Income Statements
2014
2015
2016e
Sales
$ 3,432,000
$ 5,834,400
$ 7,035,600
COGS except depr.
2,864,000
4,980,000
5,800,000
Depreciation
18,900
116,960
120,000
Other Data
2014
2015
2016e
Stock Price
$ 8.50
$ 6.00
$ 12.17
Shares Outstanding
100,000
100,000
250,000
$ 0.880
$ (0.951)
$ 1.014
$ 0.220
$ 0.110
$ 0.220
Tax Rate
Book Value Per Share
$ 6.638
$ 5.576
$ 7.909
Lease Payments
$ 40,000
$ 40,000
$ 40,000
Ratio Analysis
2014
2015
2016e
Industry Average
Current
2.3
1.5
2.58
2.7
Quick
0.8
0.5
0.93
1.0
Inventory Turnover
4.0
4.0
3.45
6.1
Days Sales Outstanding
37.4
39.5
45.5
32.0
Fixed Assets Turnover
10.0
6.2
8.41
7.0
Total Assets Turnover
2.3
2.0
2.00
2.5
Debt Ratio
3.3
0.1
6.3
6.2
EBITDA Coverage
2.6
0.8
5.5
8.0
Profit Margin
Basic Earning Power
Price/Earnings (P/E)
9.7
12.0
16.2
Price/Cash Flow
8.0
8.1
7.6
Market/Book
1.3
1.1
1.5
2.9
Mini Case: 7 – 23
Other Expenses
340,000
720,000
612,960
Total Operating Costs
$ 3,222,900
$ 5,816,960
$ 6,532,960
EBIT
$ 209,100
$ 17,440
$ 502,640
Interest Expense
62,500
176,000
80,000
EBT
$ 146,600
$ (158,560)
$ 422,640
Taxes (40%)
58,640
169,056
$ 87,960
$ (95,136)
$ 253,584
a. Why are ratios useful? What three groups use ratio analysis and for what
reasons?
Answer: Ratios facilitate comparison of (1) one company over time and (2) one company
b. Calculate the 2016 current and quick ratios based on the projected balance sheet
and income statement data. What can you say about the company’s liquidity
position in 2014, 2015, and as projected for 2016? We often think of ratios as
being useful (1) to managers to help run the business, (2) to bankers for credit
analysis, and (3) to stockholders for stock valuation. Would these different types
of analysts have an equal interest in the liquidity ratios?
Answer: Current Ratio16 = Current Assets/Current Liabilities
Mini Case: 7 – 24
c. Calculate the 2016 inventory turnover, days sales outstanding (DSO), fixed
assets turnover, and total assets turnover. How does Computron’s utilization of
assets stack up against other firms in its industry?
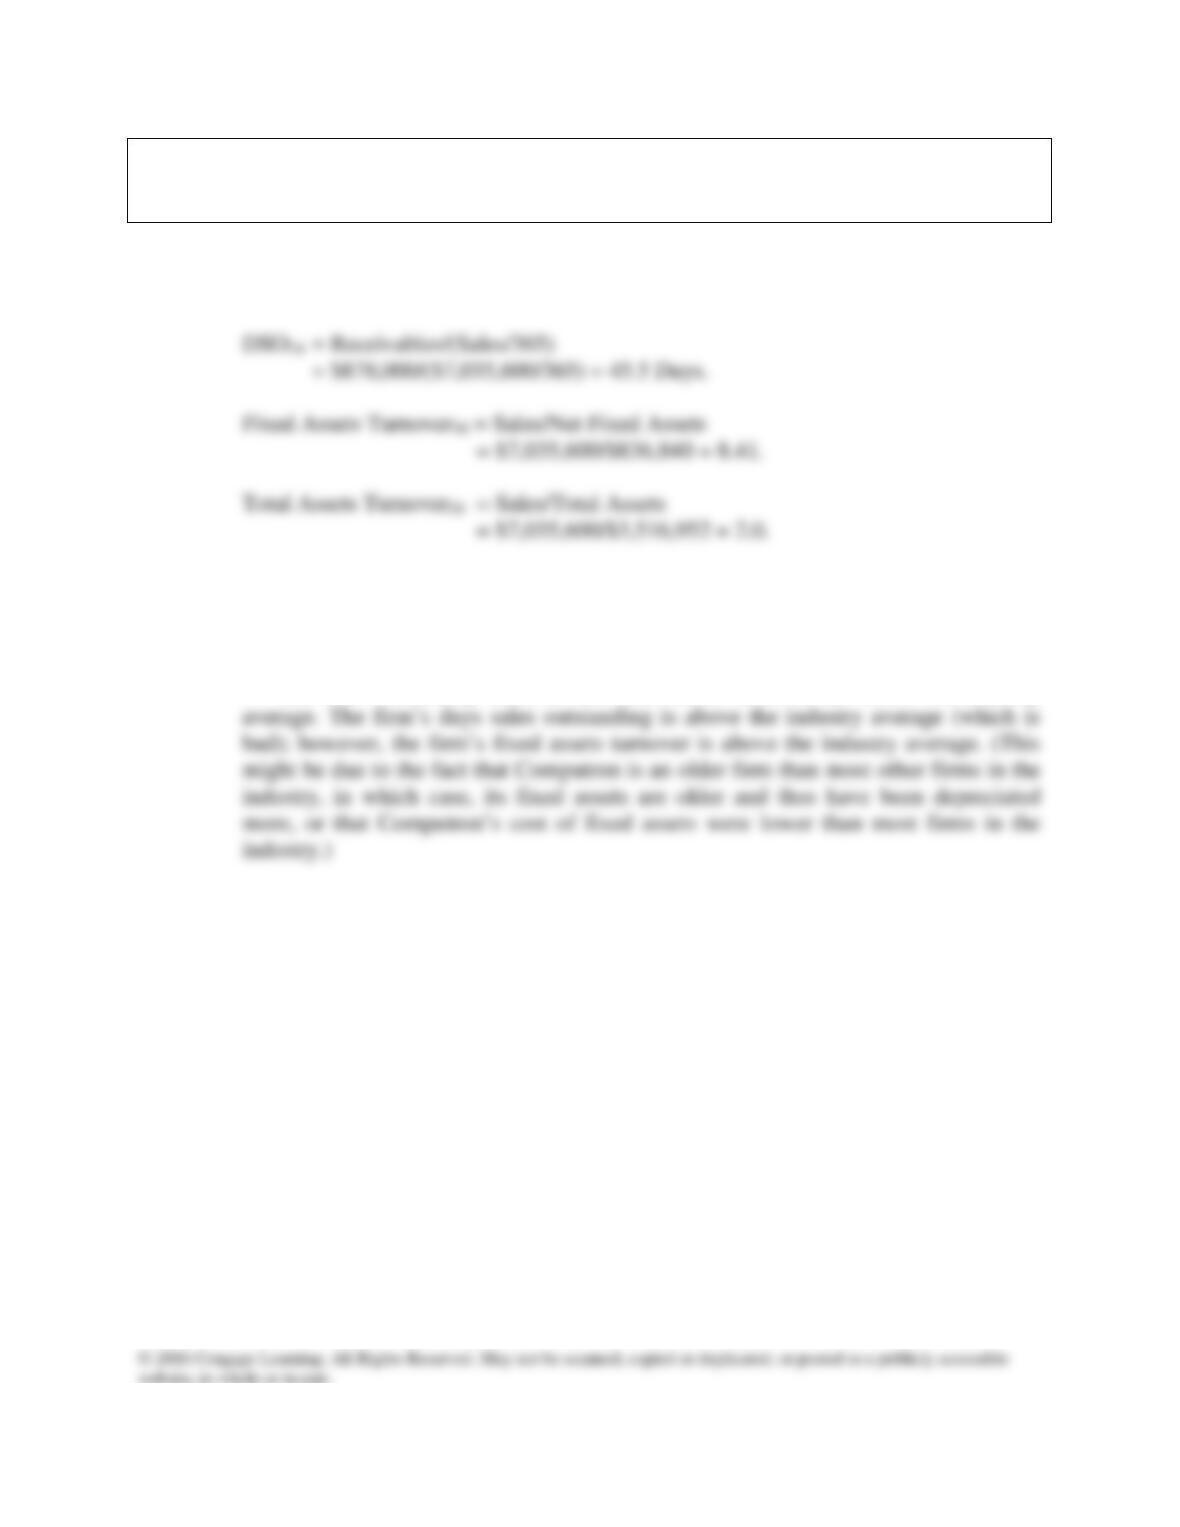
Answer: Inventory Turnover16 = COGS/Inventory
= ($5,800,000 + $120,000)/$1,716,480= 3.45.
The firm’s inventory turnover ratio has declined, while its days sales outstanding
has been steadily increasing. While the firm’s fixed assets turnover ratio is below its
2014 level, it is above the 2015 level. The firm’s total assets turnover ratio is below
its 2014 level and equal to its 2015 level.
The firm’s inventory turnover and total assets turnover are below the industry
Mini Case: 7 – 25
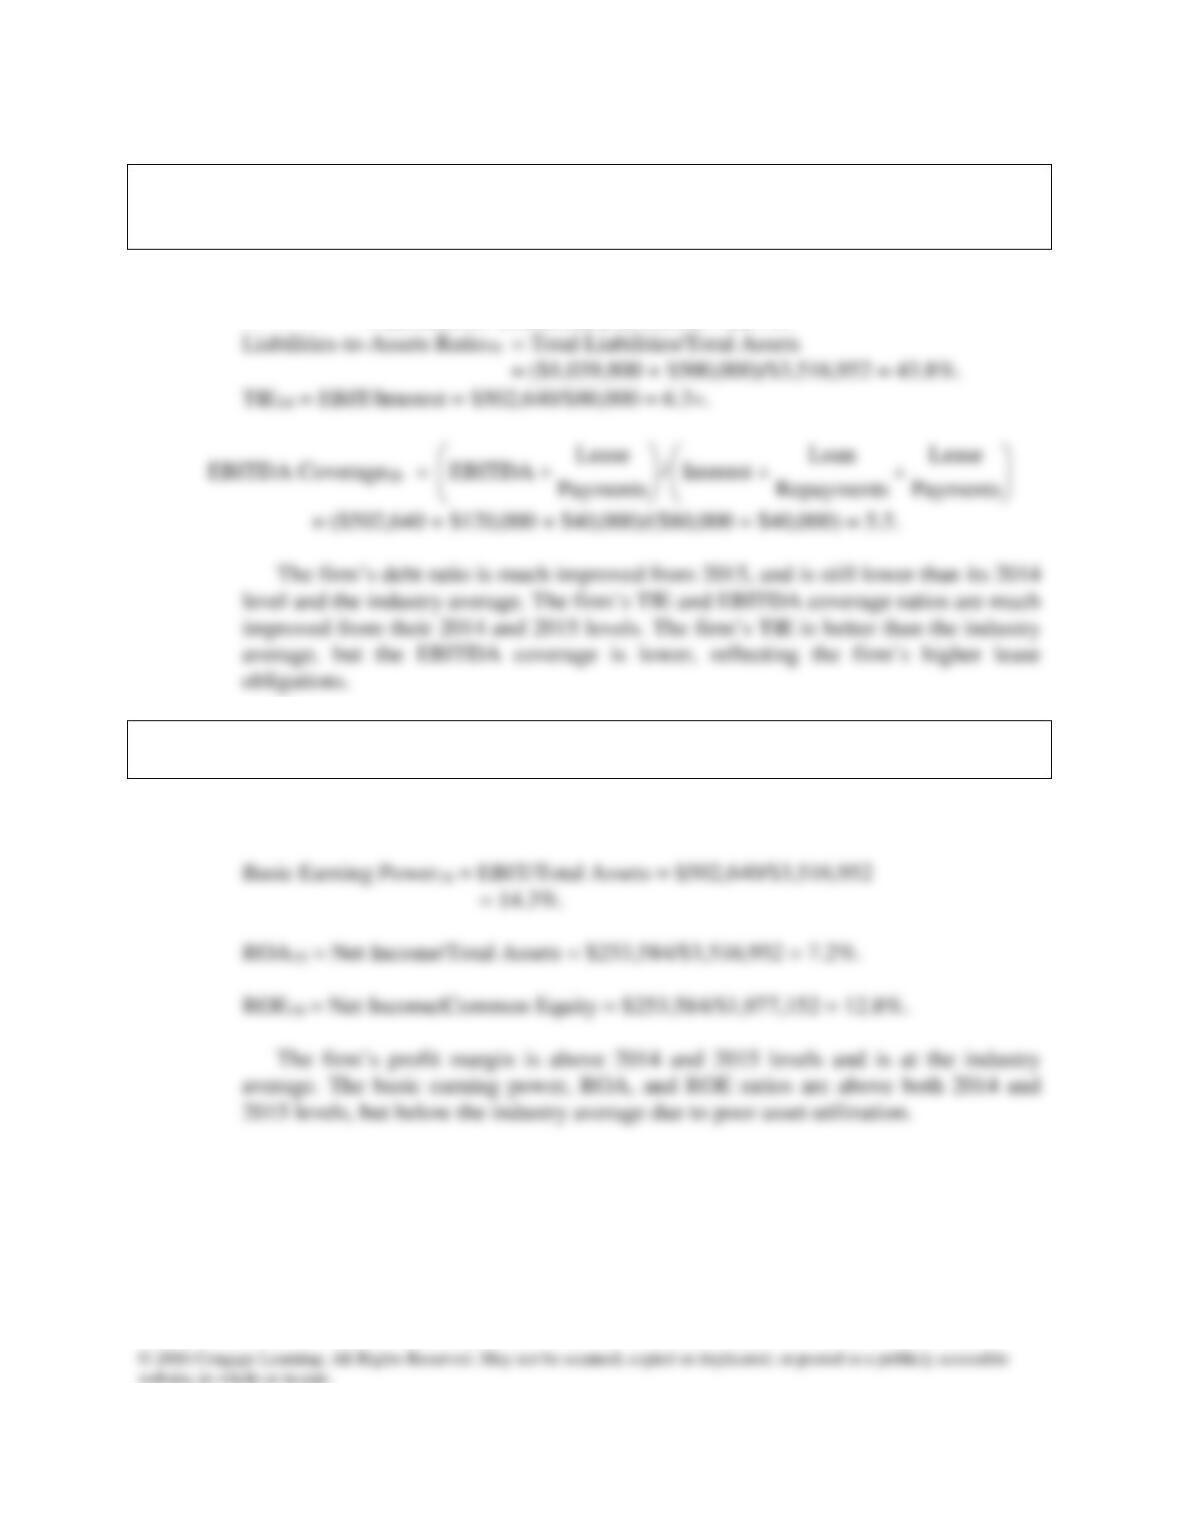
d. Calculate the 2016 debt ratio, liabilities–to–assets ratio, times–interest–earned,
and EBITDA coverage ratios. How does Computron compare with the industry
with respect to financial leverage? What can you conclude from these ratios?
Answer: Debt Ratio16 = Total Debt/Total Assets
= ($300,000+ $500,000)/$3,516,952 = 22.7%.
e. Calculate the 2016 profit margin, basic earning power (BEP), return on assets
(ROA), and return on equity (ROE). What can you say about these ratios?
Answer: Profit Margin16 = Net Income/Sales = $253,584/$7,035,600 = 3.6%.
Mini Case: 7 – 26
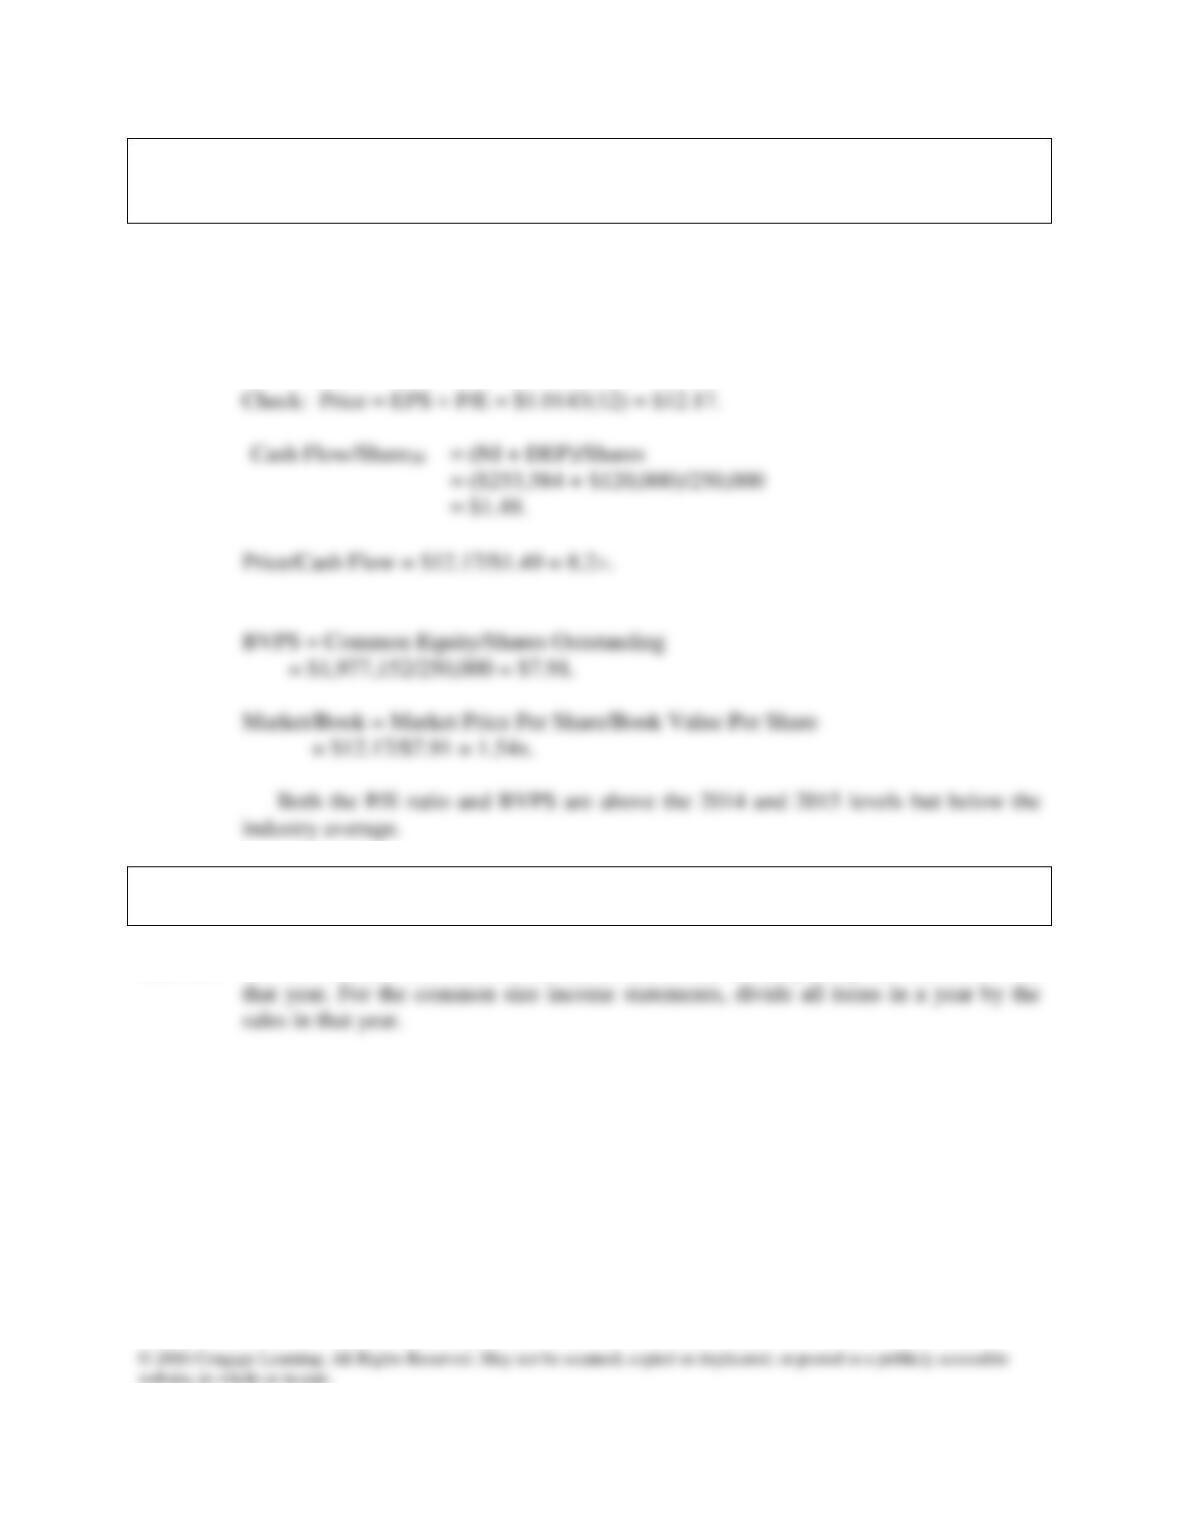
f. Calculate the 2016 price/earnings ratio, price/cash flow ratios, and market/book
ratio. Do these ratios indicate that investors are expected to have a high or low
opinion of the company?
Answer: EPS = Net Income/Shares Outstanding = $253,584/250,000 = $1.0143.
Price/Earnings16 = Price Per Share/Earnings Per Share
= $12.17/$1.0143 = 12.0×.
g. Perform a common size analysis and percent change analysis. What do these
analyses tell you about Computron?
Answer: For the common size balance sheets, divide all items in a year by the total assets for
Mini Case: 7 – 27
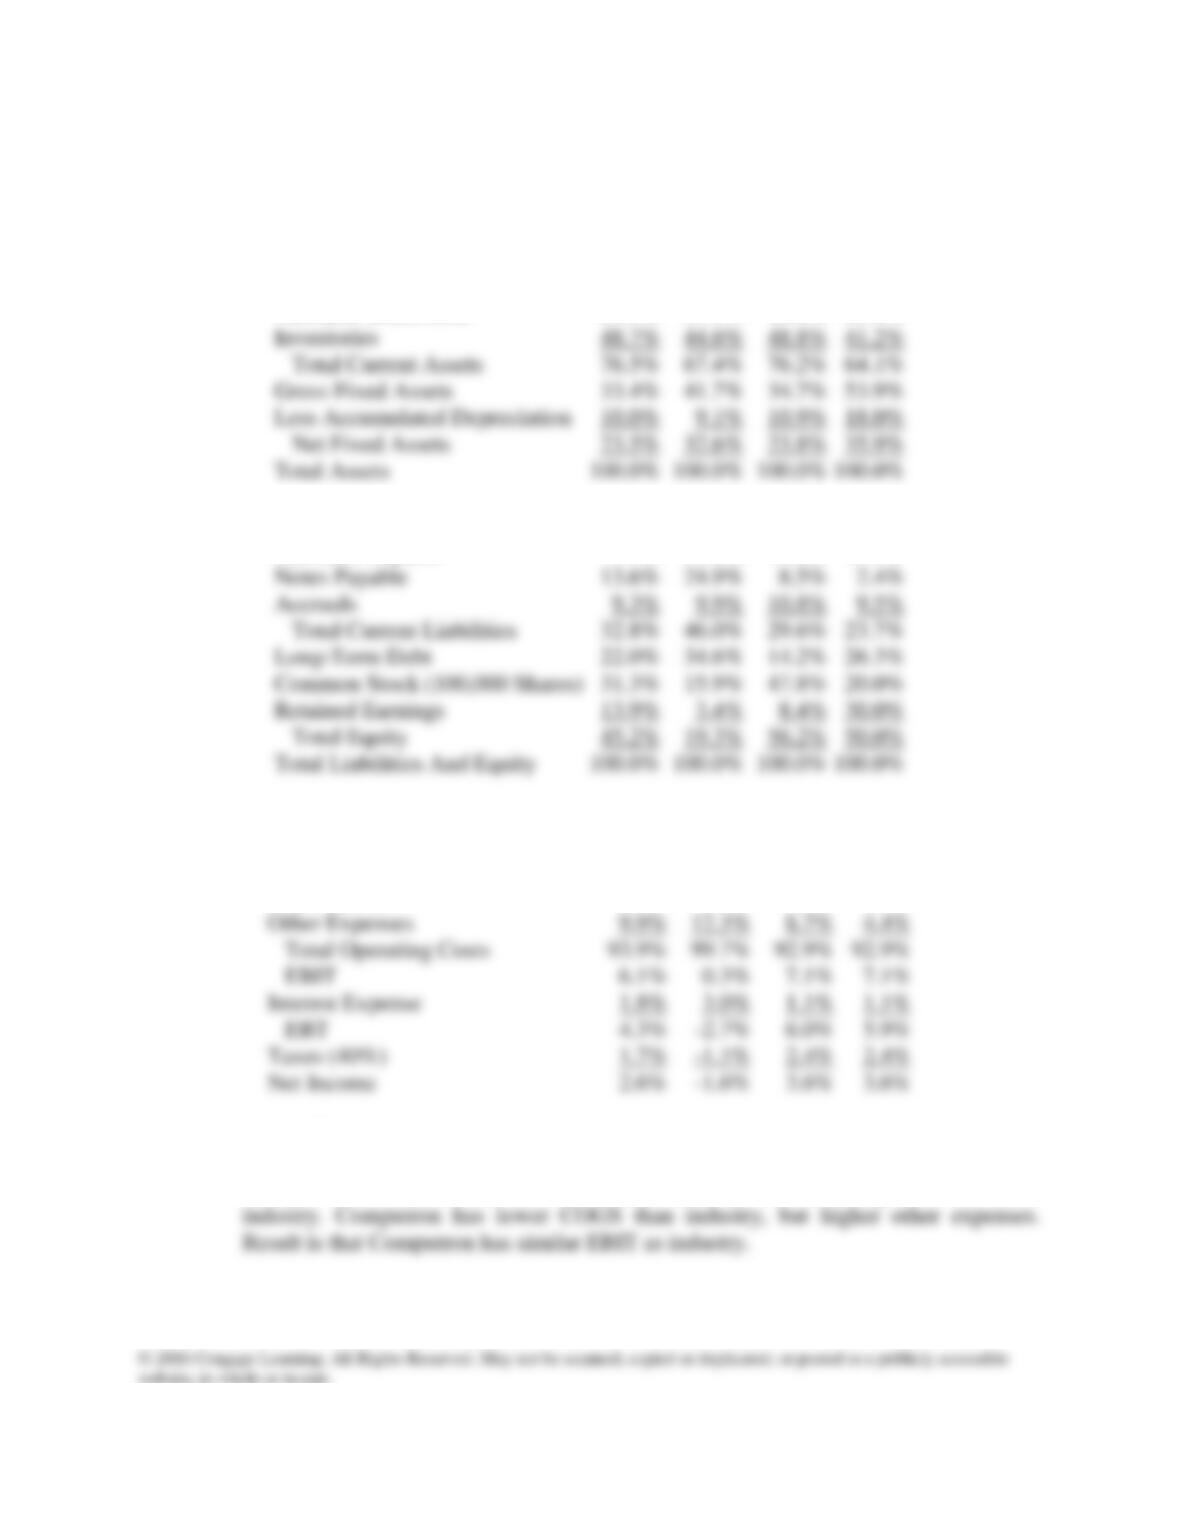
Common Size Balance Sheets
Assets
2014
2015
2016e
Ind.
Cash
0.6%
0.3%
0.4%
0.3%
Short Term Investments
3.3%
0.7%
2.0%
0.3%
Accounts Receivable
23.9%
21.9%
25.0%
22.4%
Liabilities And Equity
2014
2015
2016e
Ind.
Accounts Payable
9.9%
11.2%
10.2%
11.9%
Notes Payable
13.6%
24.9%
8.5%
2.4%
Accruals
9.3%
9.9%
10.8%
9.5%
Total Current Liabilities
32.8%
46.0%
29.6%
23.7%
22.0%
34.6%
14.2%
26.3%
Common Stock (100,000 Shares)
31.3%
15.9%
47.8%
20.0%
Retained Earnings
13.9%
3.4%
8.4%
30.0%
Total Equity
45.2%
19.3%
56.2%
50.0%
100.0%
100.0%
100.0%
100.0%
Common Size Income Statement
2014
2015
2016e
Ind.
Sales
100.0%
100.0%
100.0%
100.0%
Cost Of Goods Sold
83.4%
85.4%
82.4%
84.5%
Depreciation
0.6%
2.0%
1.7%
4.0%
Other Expenses
9.9%
12.3%
8.7%
4.4%
Total Operating Costs
93.9%
99.7%
92.9%
92.9%
EBIT
6.1%
0.3%
7.1%
7.1%
Interest Expense
1.8%
3.0%
1.1%
1.1%
EBT
4.3%
6.0%
5.9%
Taxes (40%)
1.7%
2.4%
2.4%
2.6%
3.6%
3.6%
Computron has higher proportion of inventory and current assets than
industry. Computron has slightly more equity (which means less debt) than industry.
Computron has more short-term debt than industry, but less long–term debt than
Mini Case: 7 – 28
Inventories
48.7%
44.6%
48.8%
41.2%
Total Current Assets
76.5%
67.4%
76.2%
64.1%
33.4%
41.7%
34.7%
53.9%
10.0%
9.1%
10.9%
18.0%
Net Fixed Assets
23.5%
32.6%
23.8%
35.9%
100.0%
100.0%
100.0%
100.0%
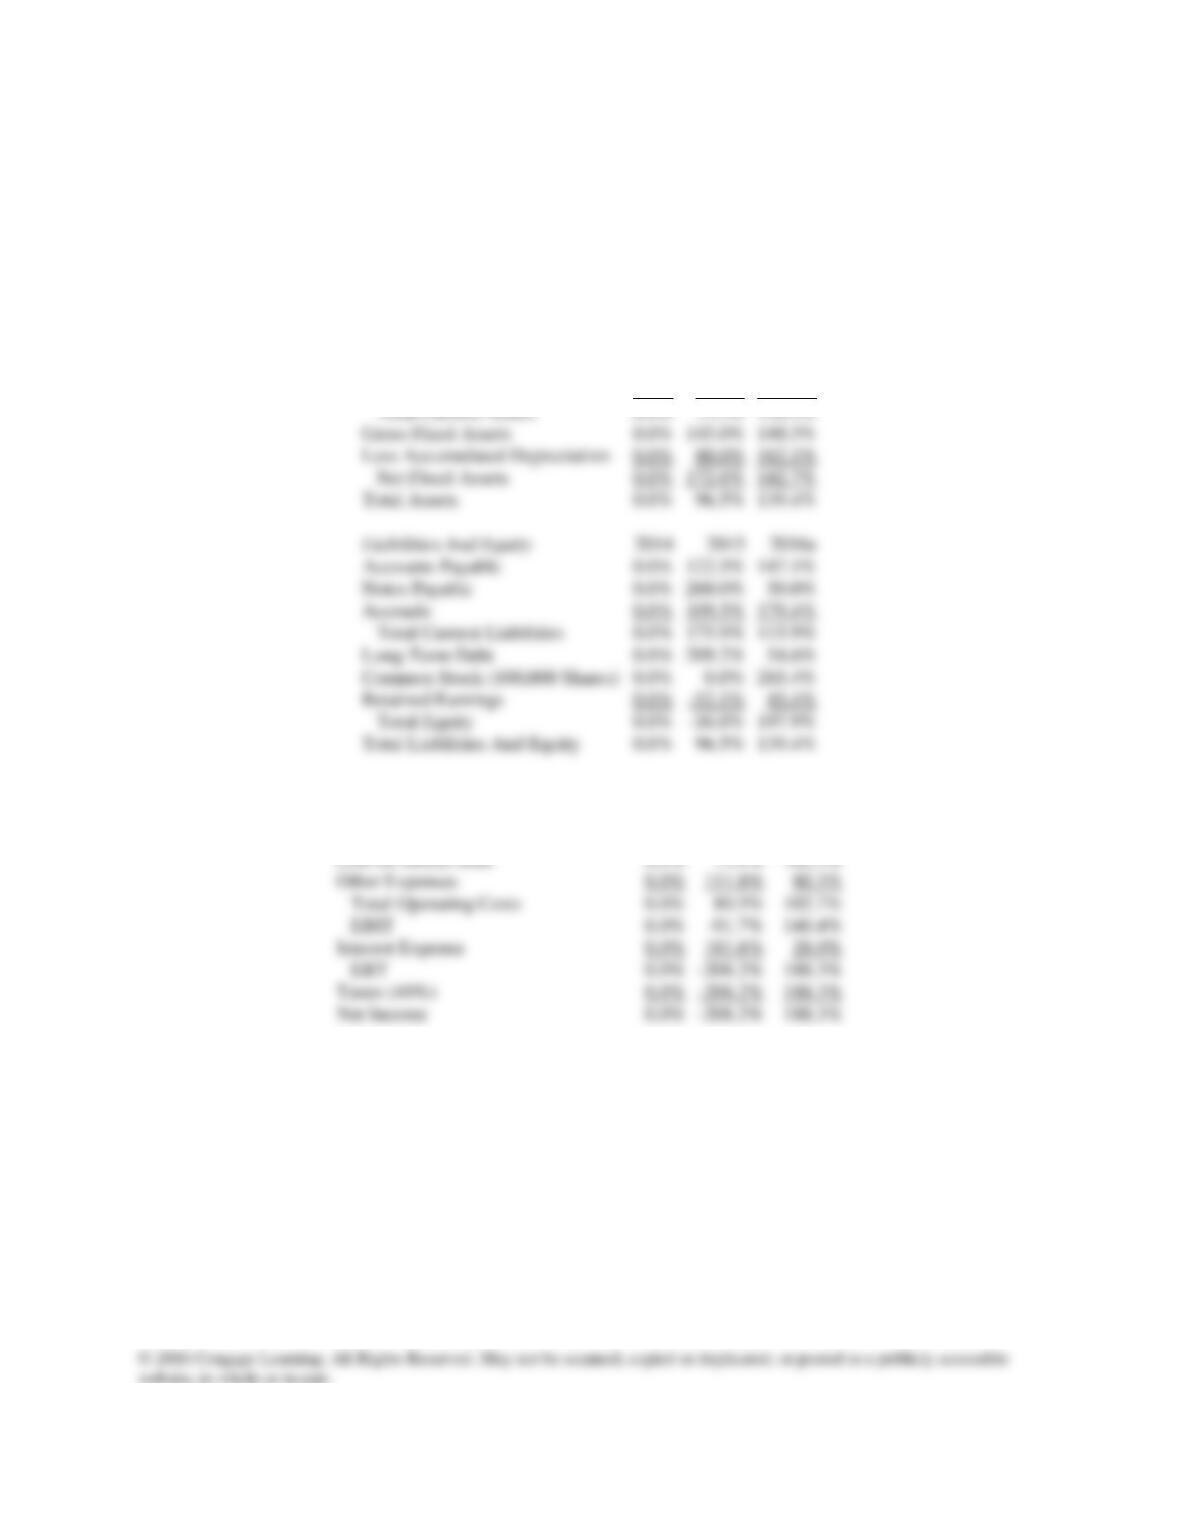
For the percent change analysis, divide all items in a row by the value in the first
year of the analysis.
Percent Change Balance Sheets
Assets
2014
2015
2016e
Cash
0.0%
–19.1%
55.6%
Short Term Investments
0.0%
–58.8%
47.4%
Accounts Receivable
0.0%
80.0%
150.0%
Inventories
0.0%
80.0%
140.0%
Percent Change Income Statement
2014
2015
2016e
Sales
0.0%
70.0%
105.0%
Depreciation
0.0%
518.8%
534.9%
0.0%
73.9%
102.5%
Other Expenses
0.0%
80.3%
0.0%
80.5%
102.7%
0.0%
140.4%
Interest Expense
0.0%
28.0%
0.0%
188.3%
Taxes (40%)
0.0%
188.3%
Net Income
0.0%
188.3%
We see that 2016 sales are projected to grow 105% from 2014, and that NI is
projected to grow 188% from 2015. So Computron is projected to become more
profitable. We see that total assets are projected to grow at a rate of 139%, while
sales are projected to grow at a rate of only 105%. So asset utilization remains a
problem.
Mini Case: 7 – 29
0.0%
73.2%
138.4%
0.0%
Less Accumulated Depreciation
0.0%
80.0%
162.1%
0.0%
172.6%
142.7%
0.0%
96.5%
139.4%
2014
0.0%
Notes Payable
0.0%
260.0%
50.0%
Accruals
0.0%
109.5%
179.4%
0.0%
175.9%
115.9%
Long–Term Debt
0.0%
209.2%
54.6%
0.0%
Retained Earnings
0.0%
–52.1%
45.4%
0.0%
–16.0%
197.9%
0.0%
96.5%
139.4%
h. Use the extended Du Pont equation to provide a summary and overview of
Computron’s financial condition as projected for 2016. What are the firm’s
major strengths and weaknesses?
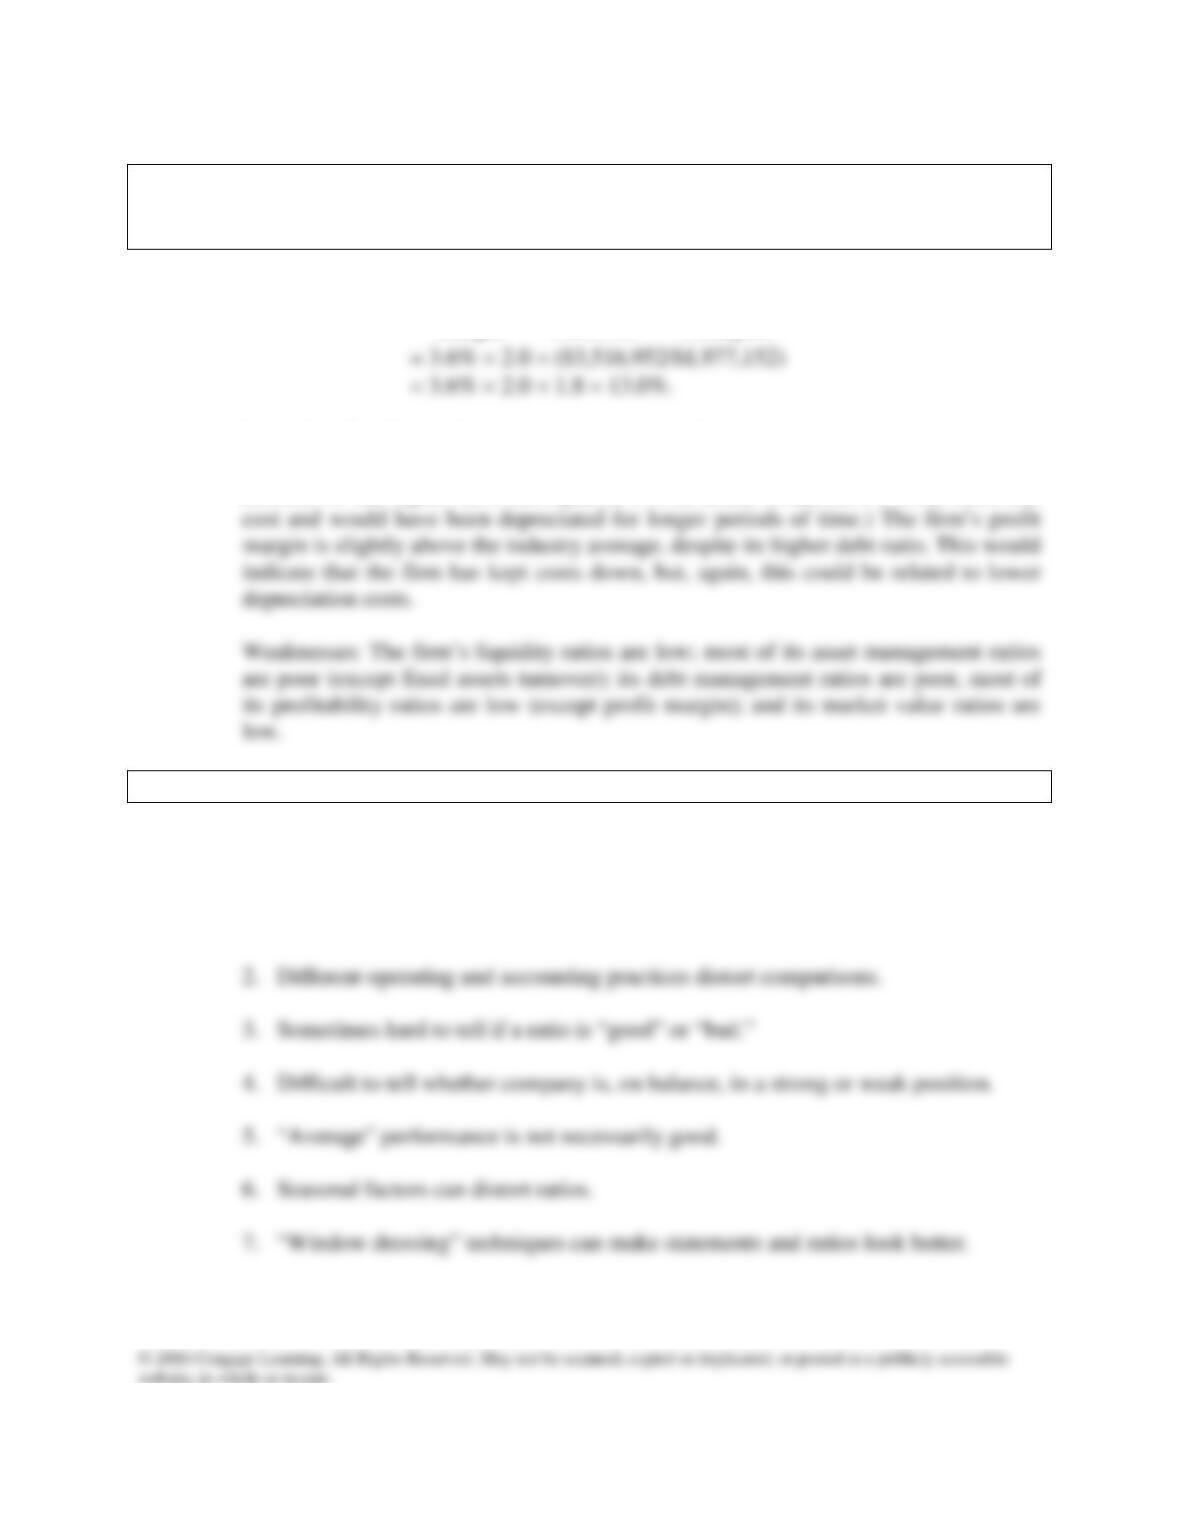
Answer: Du Pont Equation =
Margin
Profit
×
Turnover
Assets Total
×
Multiplier
Equity
Strengths: The firm’s fixed assets turnover was above the industry average. However,
if the firm’s assets were older than other firms in its industry this could possibly
account for the higher ratio. (Computron’s fixed assets would have a lower historical
i. What are some potential problems and limitations of financial ratio analysis?
Answer: Some potential problems are listed below:
1. Comparison with industry averages is difficult if the firm operates many different
divisions.
Mini Case: 7 – 30
j. What are some qualitative factors analysts should consider when evaluating a
company’s likely future financial performance?
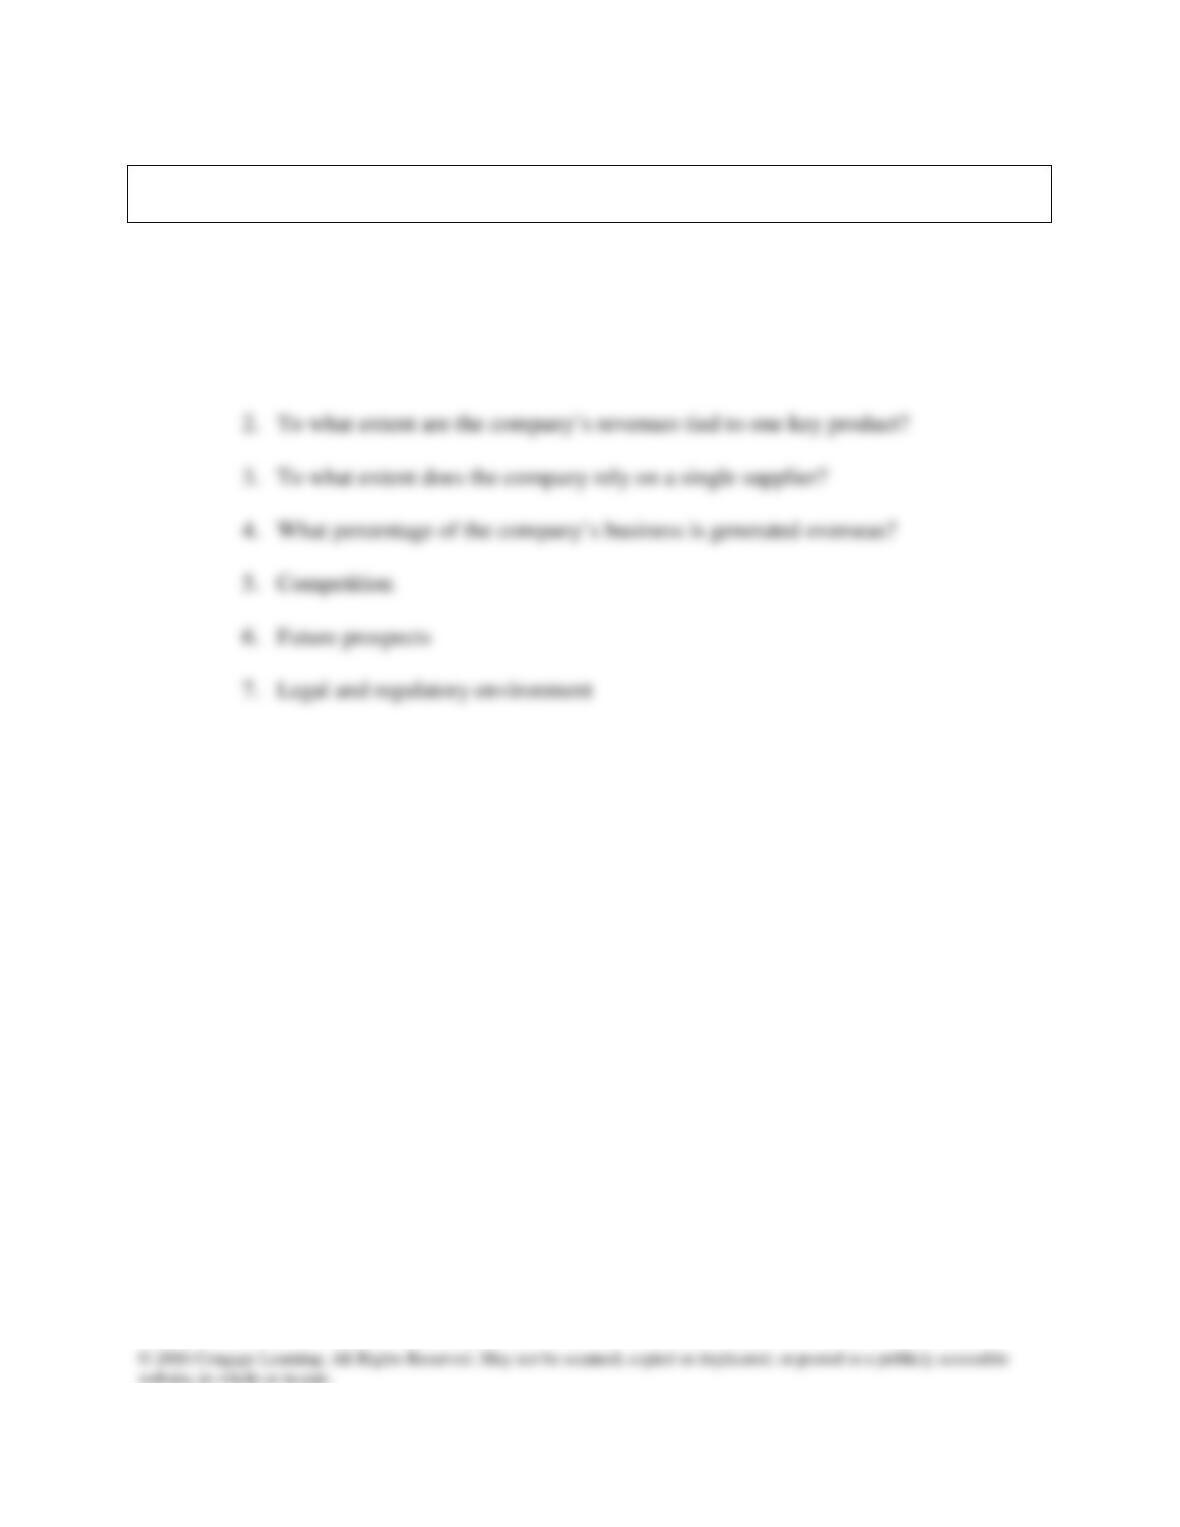
Answer: Top analysts recognize that certain qualitative factors must be considered when
evaluating a company. These factors, as summarized by the American Association Of
Individual Investors (AAII), are as follows:
1. Are the company’s revenues tied to one key customer?
Mini Case: 7 – 31