
Chapter 7
Analysis of Financial Statements
ANSWERS TO BEGINNING-OF–CHAPTER QUESTIONS
The answers to these questions are all contained in the BOC Excel model for this chapter, where
they are illustrated with actual data and the ratios are calculated.
Answers and Solutions: 7 – 1
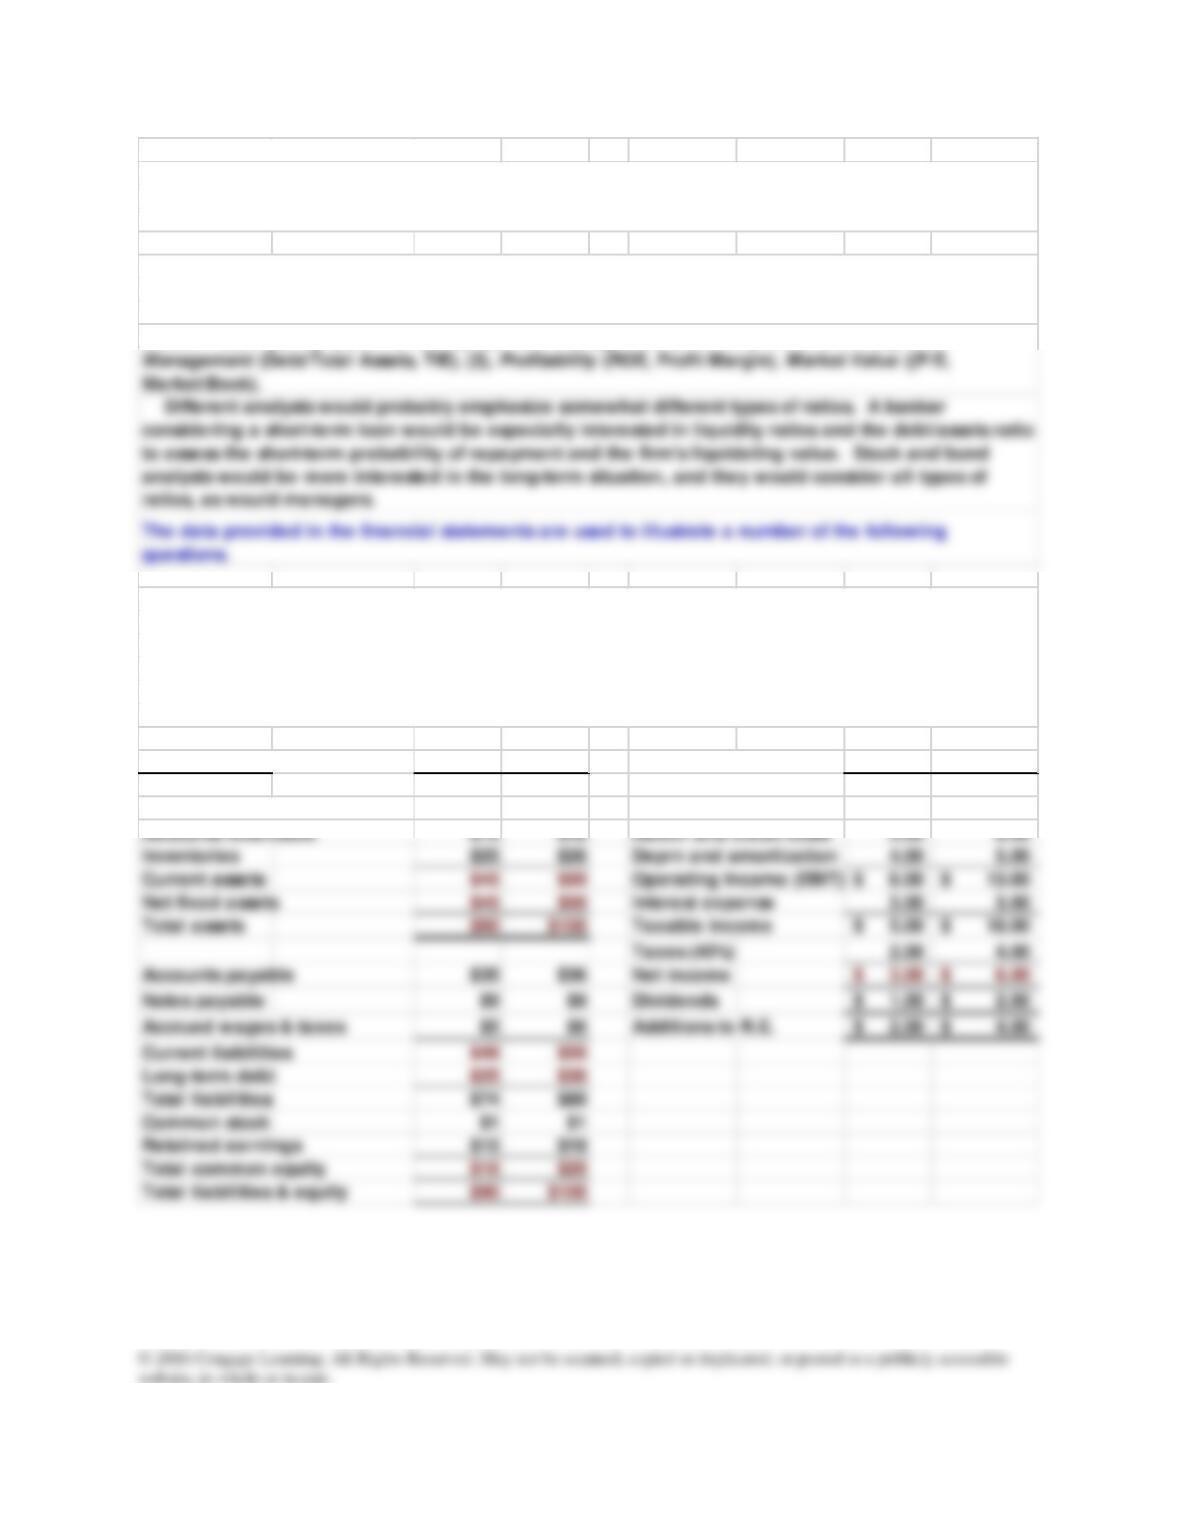
Worksheet for Chapter 7 BOC Questions 1/1/2014
Balance Sheets 2014 2015 Income Statements 2014 2015
Cash in bank $5 $6 Sales (net of discounts) 90.00$ 100.00$
Marketable securities $5 $6
Cost of goods sold (COGS
73.00 76.00
We like to answer the Chapter 7 questions by going through the following model, which also helps
students become more familiar with Excel. Note that the data used in this file are the same as for ‘the
Chapter 6 BOC questions.
Answer: (1) Liquidity (Current, Quick), (2) Asset M anagement (Inventory Turnover, DSO), Debt
1. Why are financial ratios used? Name five categories of ratios, and then list several ratios in each
category. Would a bank loan officer, a bond analyst, a stock analyst, and a manager be likely to put
the same emphasis and interpretation on each ratio?
2. Suppose Company X has the data shown in the following financial statements. Answer the
following questions, giving numbers if all the required data are available or in general terms if the
necessary data are not available. Note that additional data are provided in the chapter BOC model. (a)
What is X’s DSO? If the industry average DSO is 30 days, and if X could reduce its accounts receivable
to the point where its DSO became 50 without affecting its sales or operating costs, how would this
affect: (b) Its free cash flow? (c) Its ROE? (d) Its debt ratio? (e) Its TIE ratio? (f) Its Loan/EBITDA ratio?
Answers and Solutions: 7 – 2
Operating Income (EBIT)
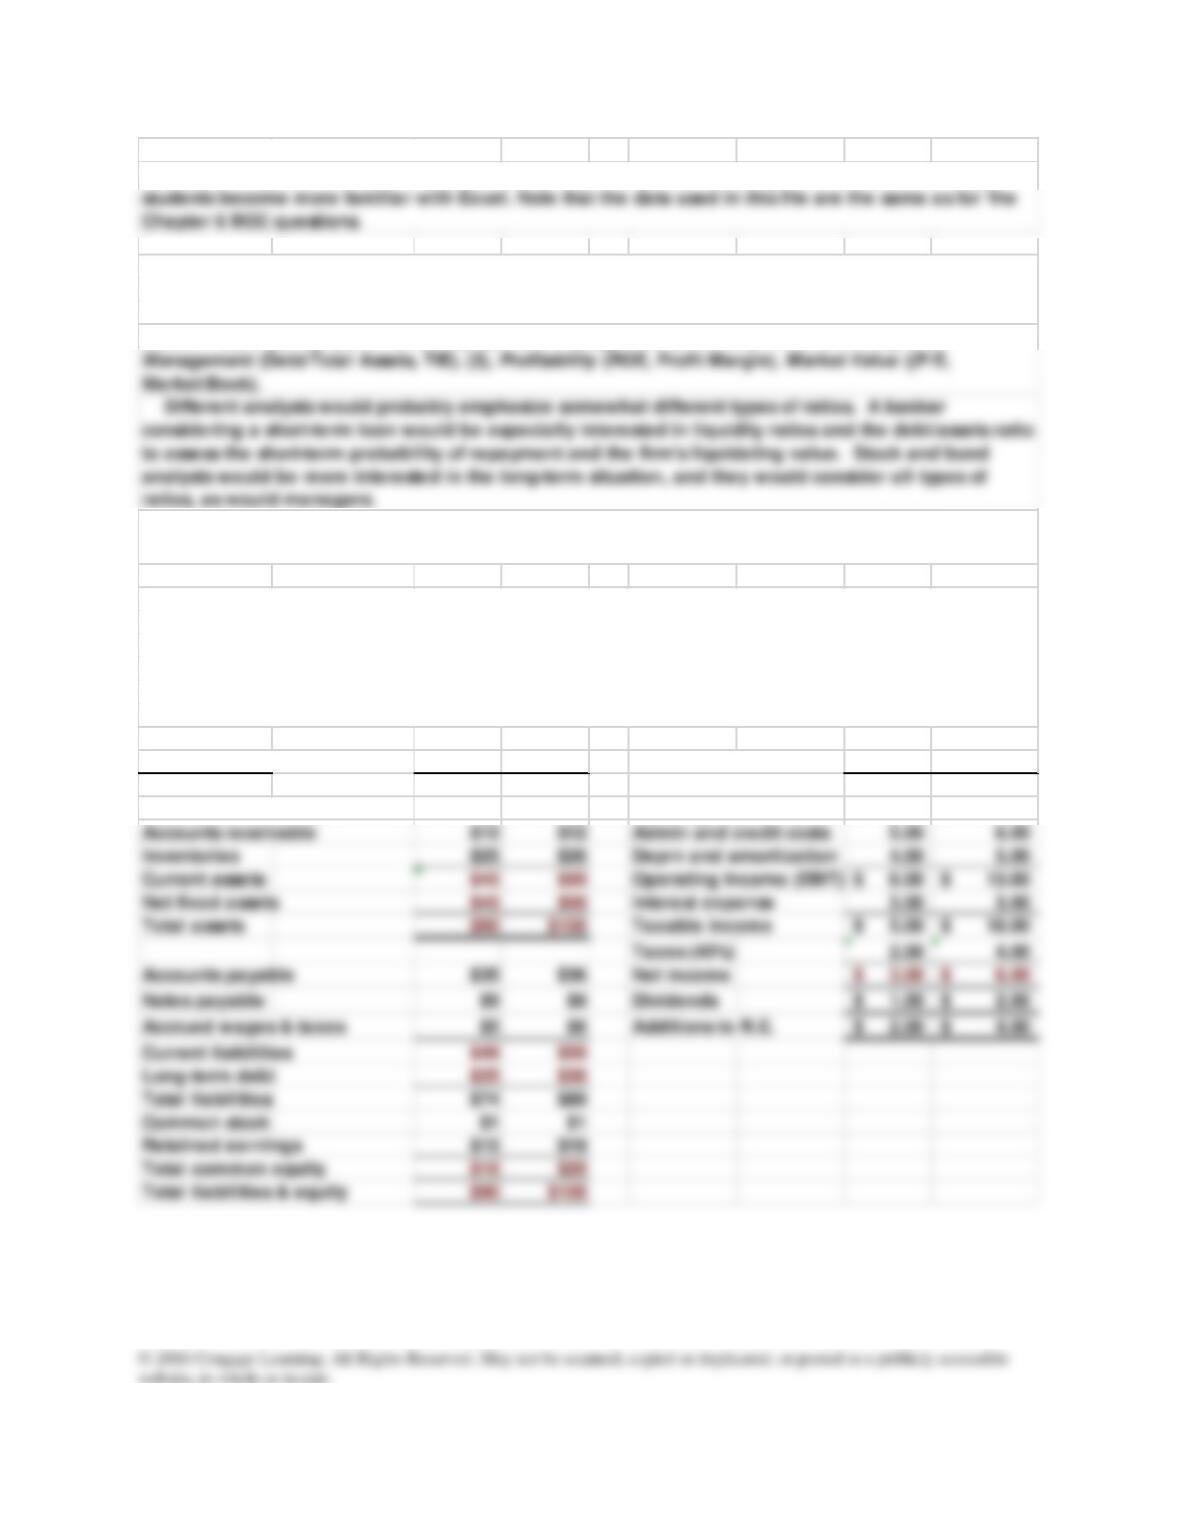
Worksheet for Chapter 7 BOC Questions 1/1/2014
Balance Sheets 2014 2015 Income Statements 2014 2015
Cash in bank $5 $6 Sales (net of discounts) 90.00$ 100.00$
Marketable securities $5 $6
Cost of goods sold (COGS
73.00 76.00
We like to answer the Chapter 8 questions by going through the following model, which also helps
Answer: (1) Liquidity (Current, Quick), (2) Asset M anagement (Inventory Turnover, DSO), Debt
1. Why are financial ratios used? Name five categories of ratios, and then list several ratios in each
category. Would a bank loan officer, a bond analyst, a stock analyst, and a manager be likely to put
the same emphasis and interpretation on each ratio?
2. Suppose Company X has the data shown in the following financial statements. Answer the
following questions, giving numbers if all the required data are available or in general terms if the
necessary data are not available. Note that additional data are provided in the chapter BOC model. (a)
What is X’s DSO? If the industry average DSO is 30 days, and if X could reduce its accounts receivable
to the point where its DSO became 50 without affecting its sales or operating costs, how would this
affect: (b) Its free cash flow? (c) Its ROE? (d) Its debt ratio? (e) Its TIE ratio? (f) Its Loan/EBITDA ratio?
The data provided in the financial statements are used to illustrate a number of the following
questions.
Answers and Solutions: 7 – 3
Operating Income (EBIT)
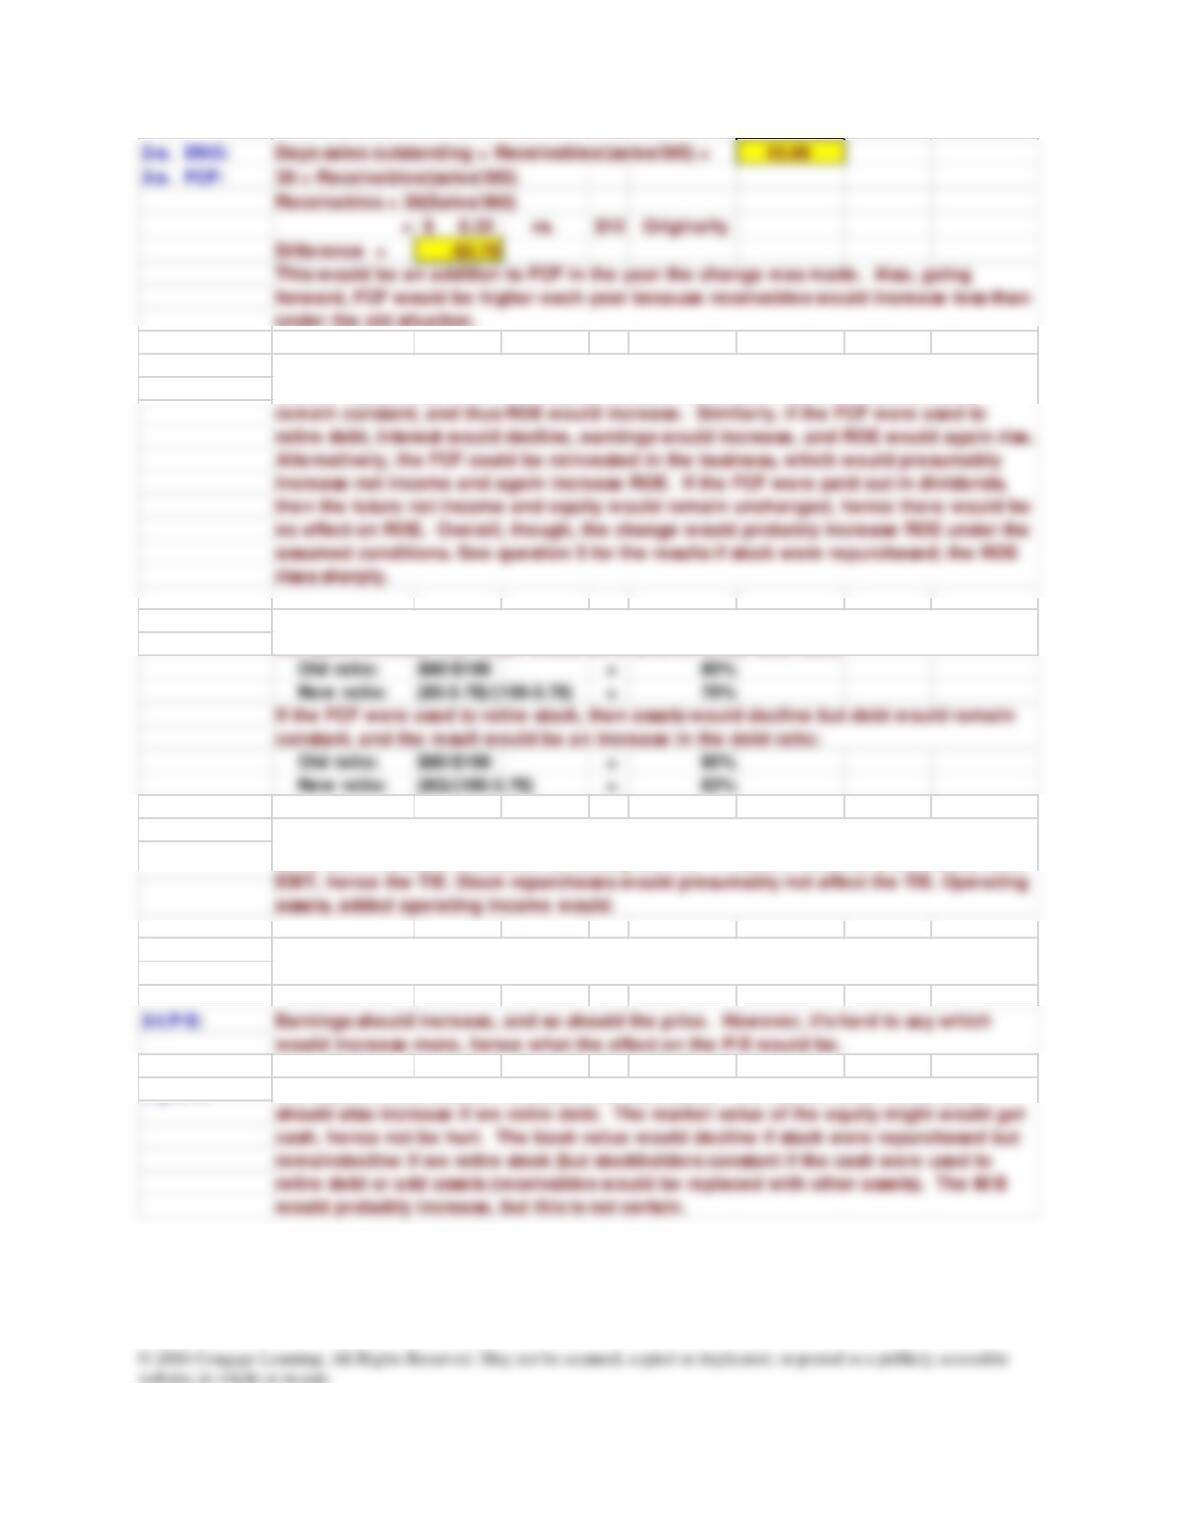
If the FCF were used to retire stock, then assets would decline but debt would remain
constant, and the result would be an increase in the debt ratio:
Earnings should increase, and so should the price. However, it’s hard to say which
2-b. ROE:
2-c.D/A:
2-d.TIE:
2-e.
Loan/EBITDA:
2–g.M/B:
If the FCF were used to retire debt, then the assets and the debt would both decline by
the same amount. The result would be a decline in the debt ratio:
The effect on the TIE ratio would depend on how the FCF was used. If used to retire
debt, then interest would decline, raising the TIE. If used to increase presumably raise
assumed conditions. See question 5 for the results if stock were repurchased; the ROE
The effect on the ROE would depend on what was done with the extra FCF. If it were
used to repurchase stock, then equity would decline, earnings would presumably
under the old situation.
The effects here would be similar to the ones in 2-e. Retiring debt and purchasing
assets would lower the ratio, and retiring stock would not affect it.
The market value should increase if we add assets. The market value of the stock
Answers and Solutions: 7 – 4
would probably increase, but this is not certain.
3. How do managers, bankers, and security analysts use (a) trend analysis, (b) benchmarking,
(c) percent change analysis, and common size analysis?
5-a.
If sales were seasonal, then inventories, receivables, payables, and accrual would vary
4. Explain how ratio analysis in general, and the DuPont System in particular, can be used by
managers to help maximize their firms’ stock prices. Use the data in Question 2 to illustrate the Du
Pont equation.
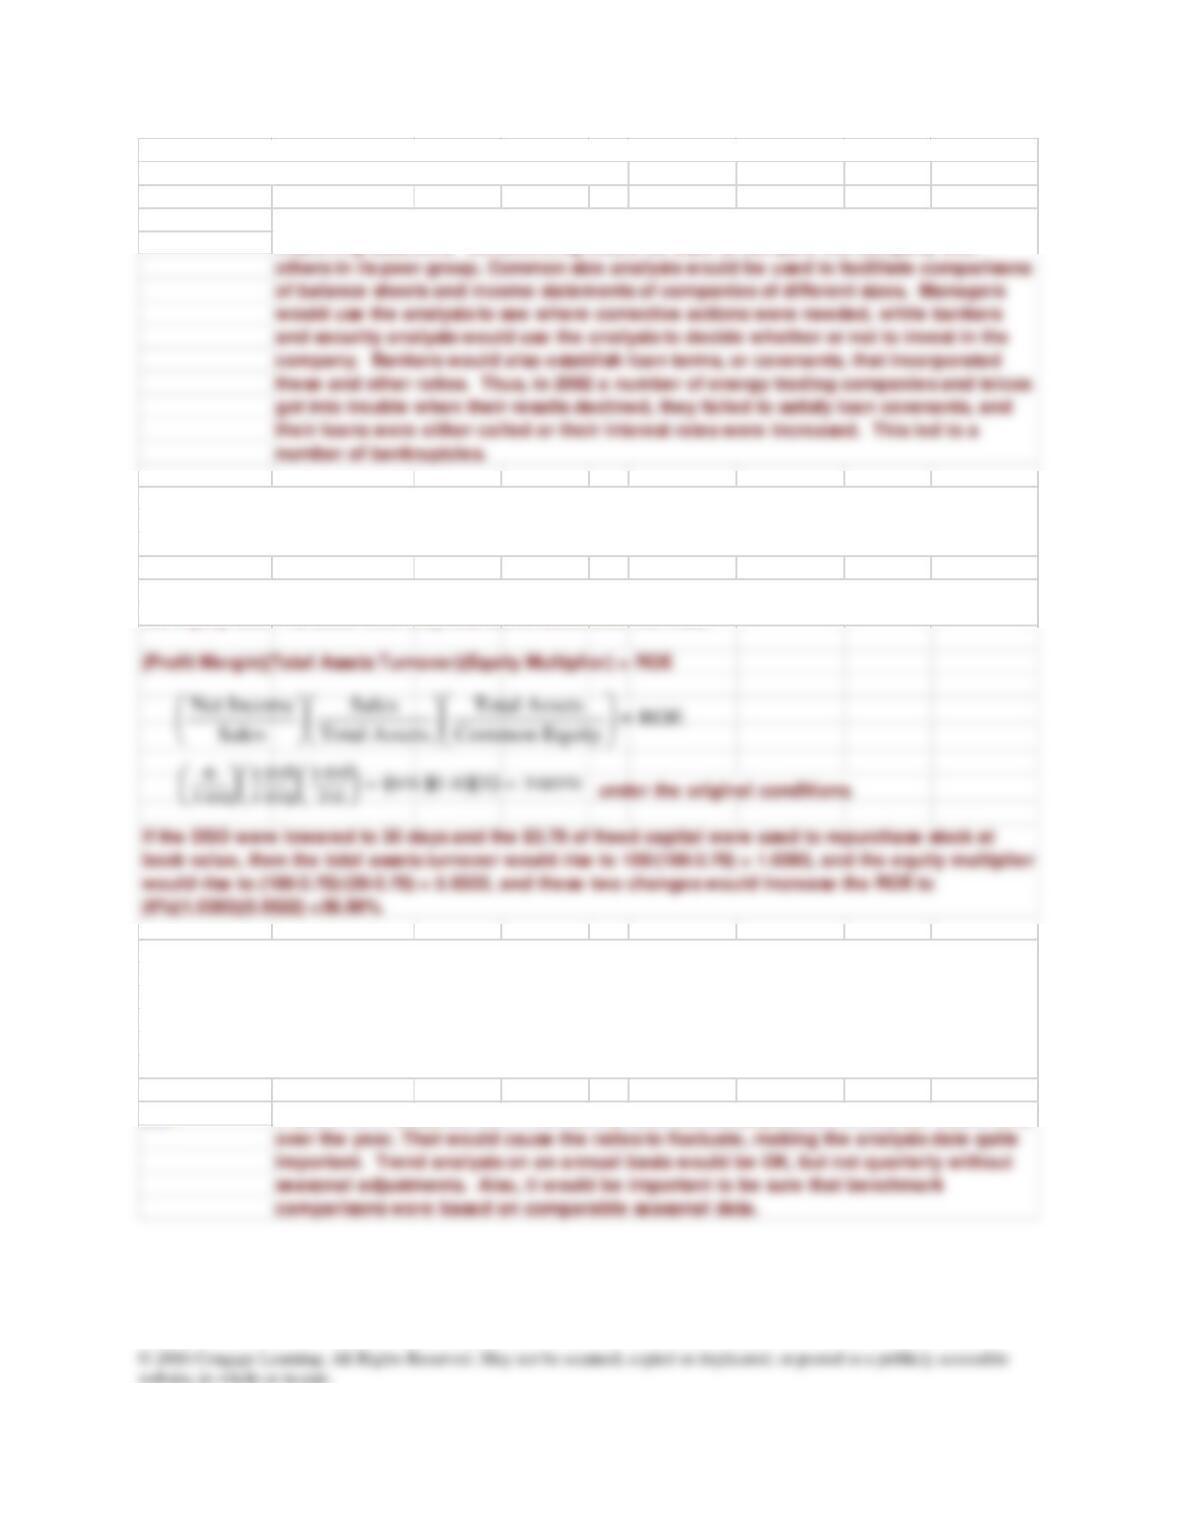
The DuPont system ties together three key ratios—the profit margin, the total assets turnover ratio, and
the equity ratio—to show how they interact to determine the ROE:
Trend analysis is used to detect trends, which could show improving or deteriorating or
improving situations. Benchmrking would be used to compare the company with
5. How would each of the following factors affect ratio analysis: (a) The firm’s sales are highly
seasonal. (b) The firm uses some type of window dressing. (c) The firm issues more debt and uses to
proceeds to repurchase stock. (d) The firm leases more of its fixed assets than most firms in its industry.
(e) In an effort to stimulate sales, the firm eases its credit policy by offering 60 day credit terms rather
than the current 30 day terms. Answer these questions in words; do not attempt to quantify your
answer, but explain how one might use sensitivity analysis to help quantify the answers.
Answers and Solutions: 7 – 5
5-b.
5-c.
5-d.
5-e.
If a firm leases assets rather than buying and owning them, then its assets will be low
Extending the credit terms from 30 to 60 days would probably more than double the
amount of receivables reported on the balance sheet. If sales were constant, then
6. How might one establish norms (or target values) for the financial ratios of a company that is just
being started? Where might data for this purpose be obtained? Could this type information be used to
help determine how much capital a new company would require?
One would look at other companies in the industry to get an idea of comparable companies‘ ratios. It
might be necessary to adjust for size and other factors, but some sort of comparison would surely be
used.
This would change many of the ratios, including the debt ratio, theTIE, the ROE, and so
forth. The effects could (and would) be simulated using the Excel model.
Window dressing involves making temporary changes toward the end of an accounting
period to make the balance sheet look better on the statement date. Mutual funds often
sell losing stock, and purchase ones that have gone up, to make it look like they have
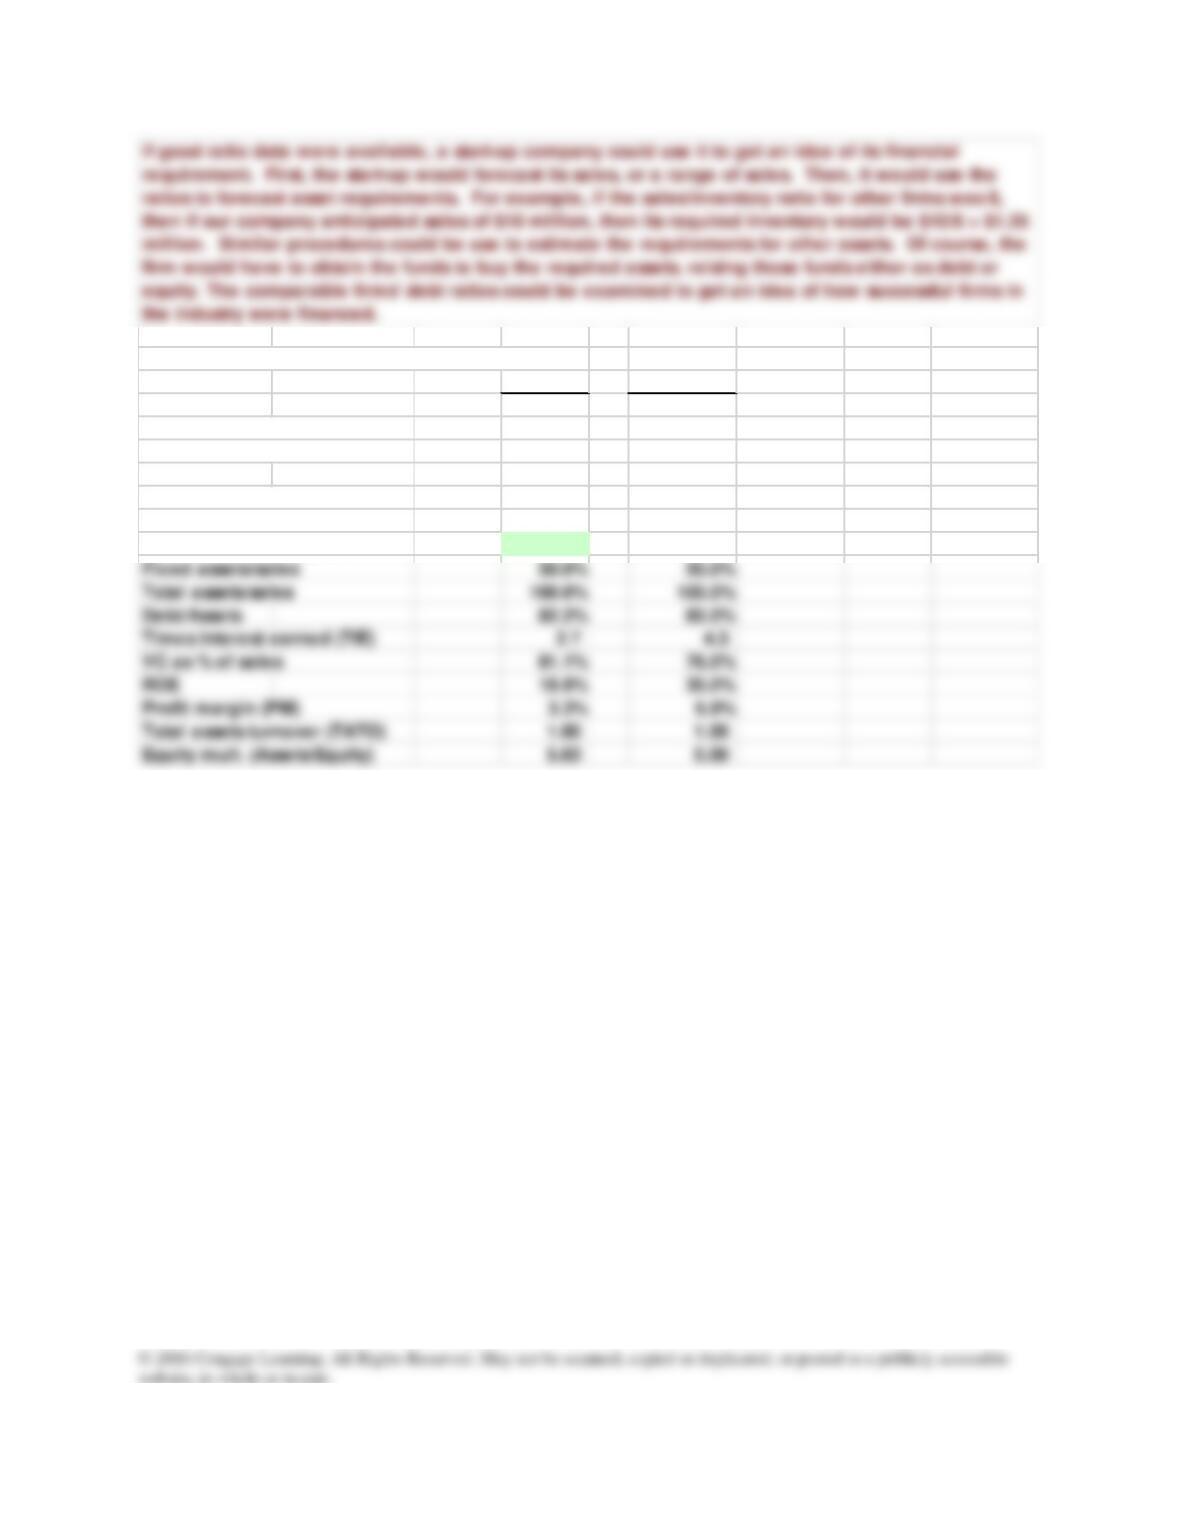
EXTRA: NOT IN THE MODEL, BUT RELATED TO IT.
Ratio Analysis 2014 2015
Current Ratio 0.9 1.0
Receivables/sales 11.1% 12.0%
DSO (365-day basis) 40.6 43.8
Inventory/sales 27.8% 26.0%
Inv Conv Period (365–day basis) 101.4 94.9
Pay Def Period (365-day basis) 175.0 172.9
Cash Conversion Cycle (33.1) (34.2)
Answers and Solutions: 7 – 7
ANSWERS TO END-OF-CHAPTER QUESTIONS
7-1 a. A liquidity ratio is a ratio that shows the relationship of a firm’s cash and other
current assets to its current liabilities. The current ratio is found by dividing current
b. Asset management ratios are a set of ratios that measure how effectively a firm is
managing its assets. The inventory turnover ratio is COGS divided by inventories.
c. Financial leverage ratios measure the use of debt financing. The debt ratio is the ratio
of total debt, which usually is the sum of notes payable and long-term bonds, to total
assets, it measures the percentage of assets financed by debtholders. The debt-to–
d. Profitability ratios are a group of ratios, which show the combined effects of liquidity,
asset management, and debt on operations. The profit margin on sales, calculated by
Answers and Solutions: 7 – 8
e. Market value ratios relate the firm’s stock price to its earnings and book value per
share. The price/earnings ratio is calculated by dividing price per share by earnings
per share—this shows how much investors are willing to pay per dollar of reported
f. Trend analysis is an analysis of a firm’s financial ratios over time. It is used to
estimate the likelihood of improvement or deterioration in its financial situation.
g. The Du Pont equation is a formula, which shows that the rate of return on assets can
be found as the product of the profit margin times the total assets turnover. Window
dressing is a technique employed by firms to make their financial statements look
7-2 The emphasis of the various types of analysts is by no means uniform nor should it be.
Management is interested in all types of ratios for two reasons. First, the ratios point out
weaknesses that should be strengthened; second, management recognizes that the other
7-3 Given that sales have not changed, a decrease in the total assets turnover means that the
company’s assets have increased. Also, the fact that the fixed assets turnover ratio
7-4 Differences in the amounts of assets necessary to generate a dollar of sales cause asset
turnover ratios to vary among industries. For example, a steel company needs a greater
7-5 a. Cash, receivables, and inventories, as well as current liabilities, vary over the year for
firms with seasonal sales patterns. Therefore, those ratios that examine balance sheet
figures will vary unless averages (monthly ones are best) are used.
b. Common equity is determined at a point in time, say December 31, 2014. Profits are
earned over time, say during 2014. If a firm is growing rapidly, year-end equity will
7-6 Firms within the same industry may employ different accounting techniques, which make
it difficult to compare financial ratios. More fundamentally, comparisons may be
SOLUTIONS TO END-OF-CHAPTER PROBLEMS
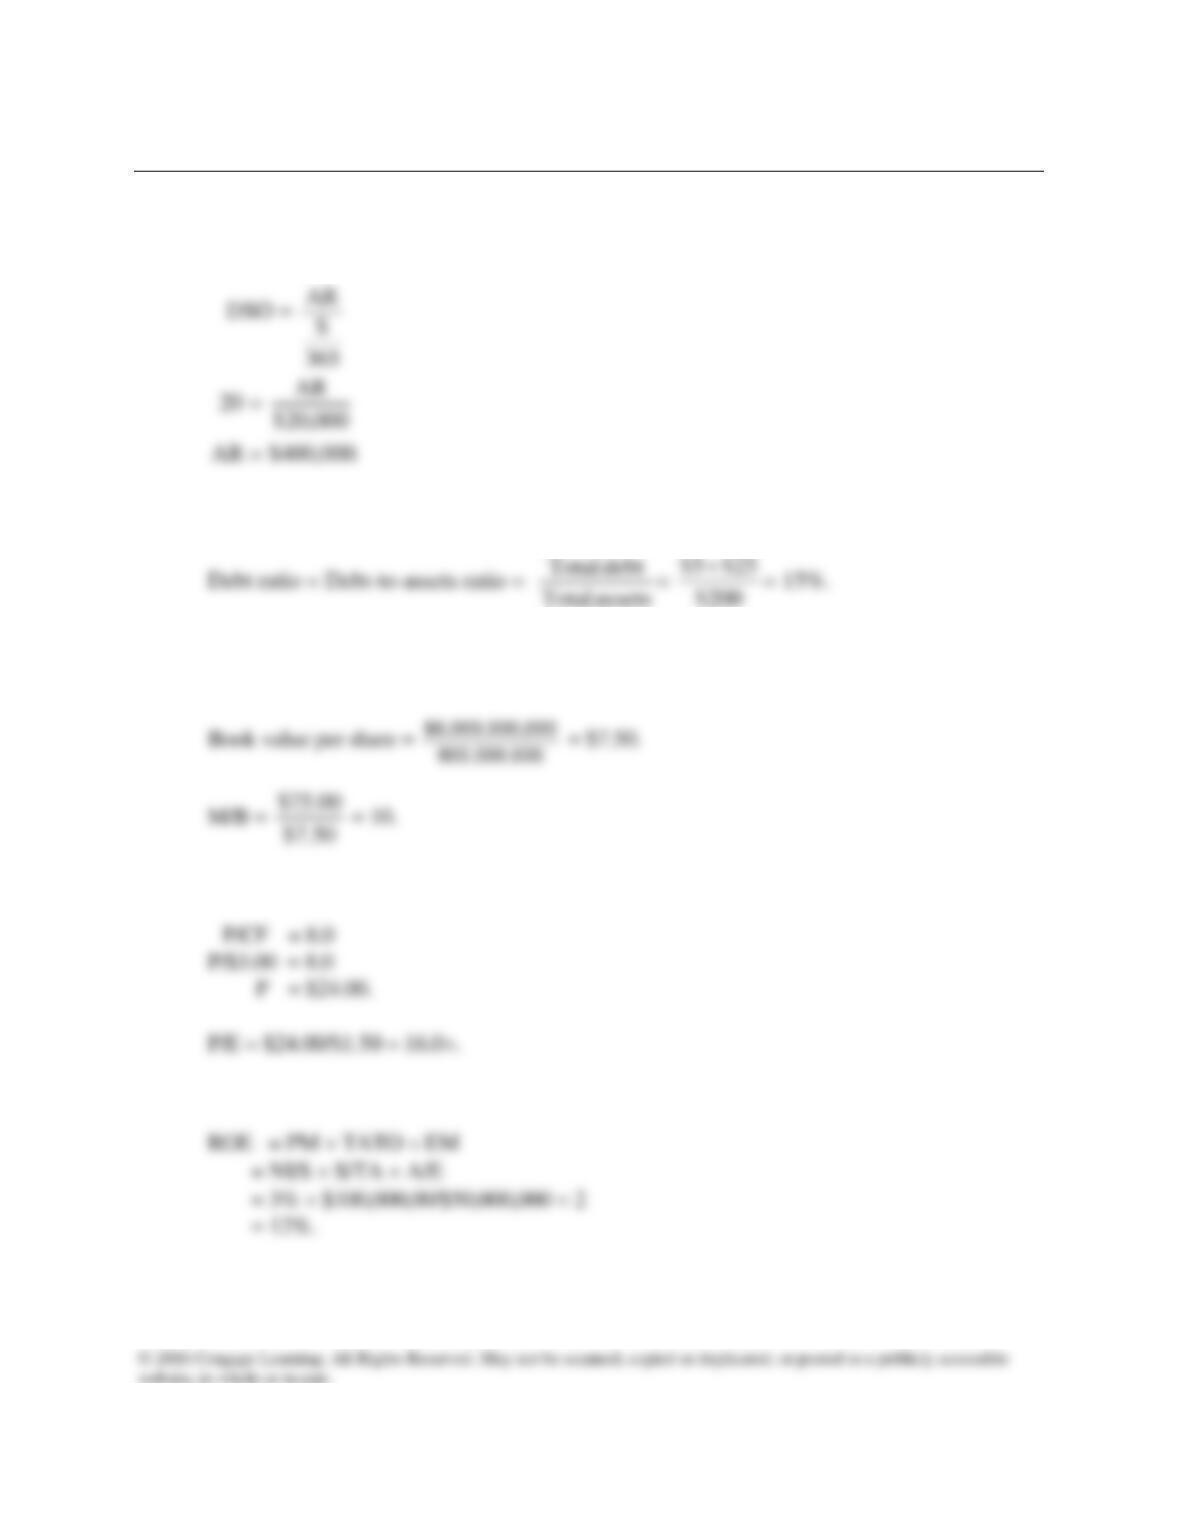
7-1 DSO = 20 days; ADS = $20,000; AR = ?
7-2 TA = $200 million, notes payable =$5 million, and LT debt = $25 million.
7-3 TA = $10,000,000,000; CL = $1,000,000,000; LT debt = $3,000,000,000; CE =
$6,000,000,000; Shares outstanding = 800,000,000; P0 = $75; M/B = ?
7-4 EPS = $1.50; CFPS = $3.00; P/CF = 8.0×; P/E = ?
7-5 PM = 3%; EM = 2.0; Sales = $100,000,000; Assets = $50,000,000; ROE = ?
Answers and Solutions: 7 – 11
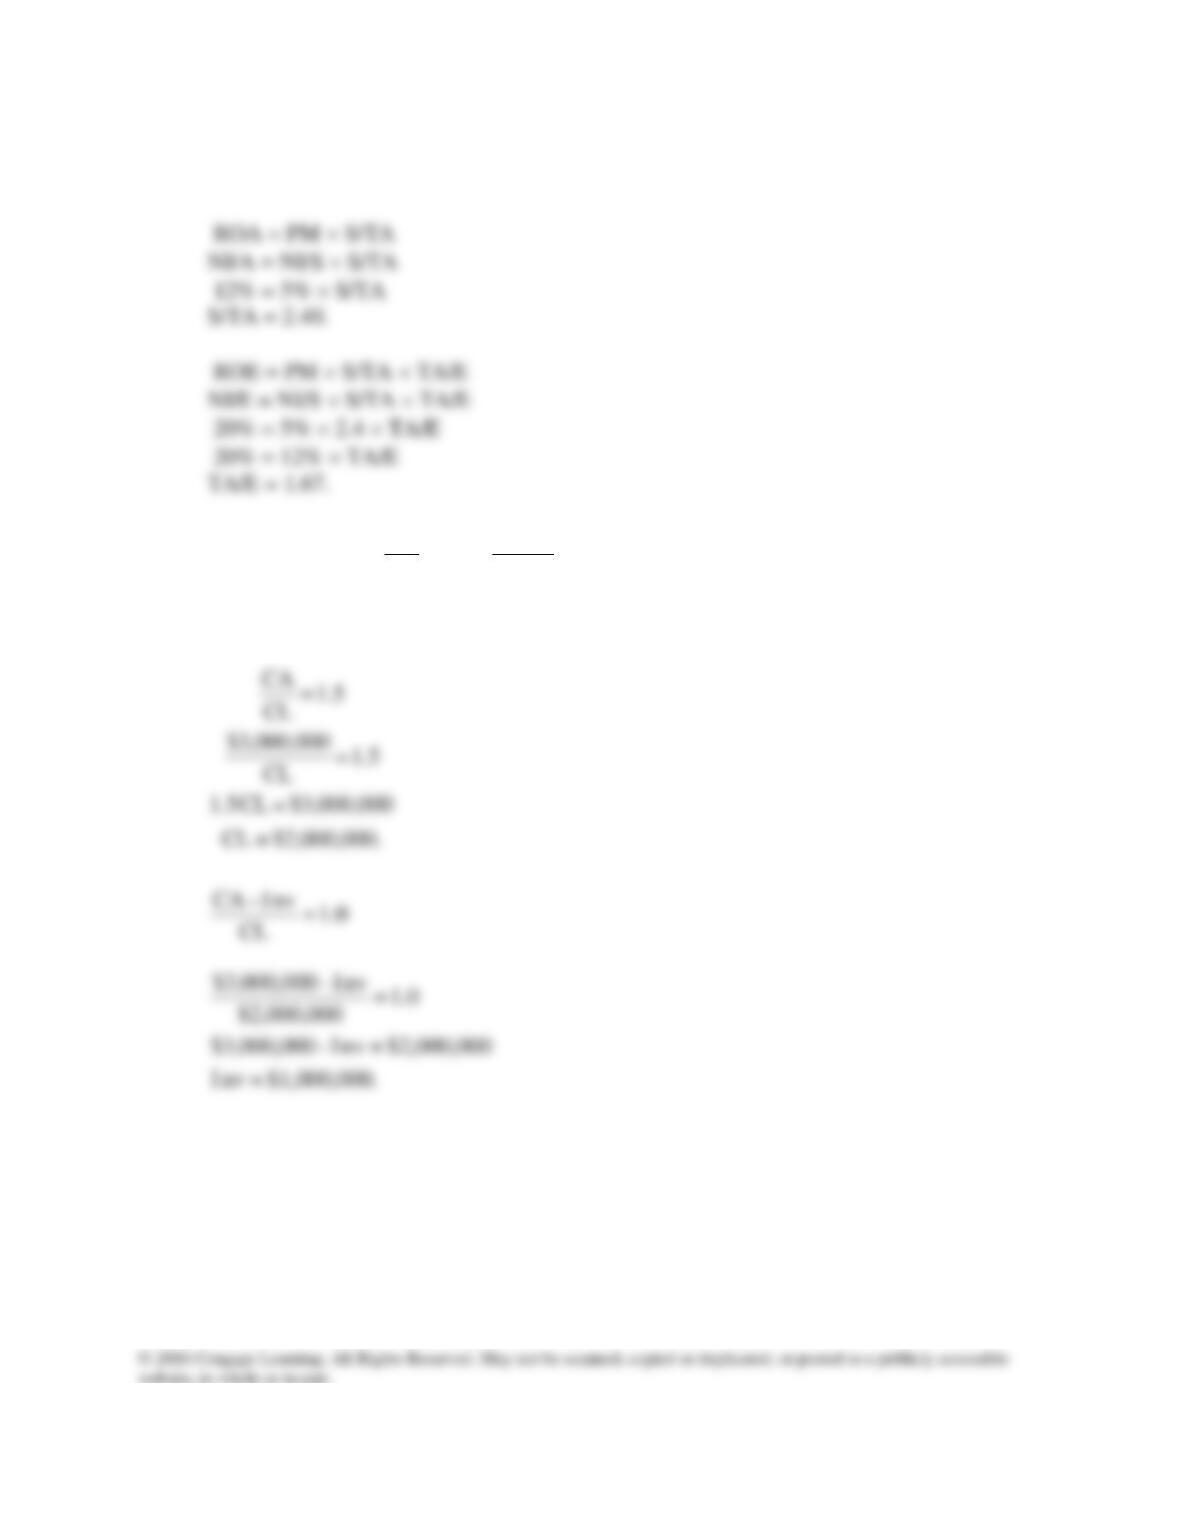
7-6 ROA = 12%; PM = 5%; ROE = 20%; S/TA = ?; A/E = ?
ROA = NI/A; PM = NI/S; ROE = NI/E
7-7 CA = $3,000,000;
CL
CA
= 1.5;
CL
I – CA
= 1.0;
CL = ?; I = ?
Answers and Solutions: 7 – 12
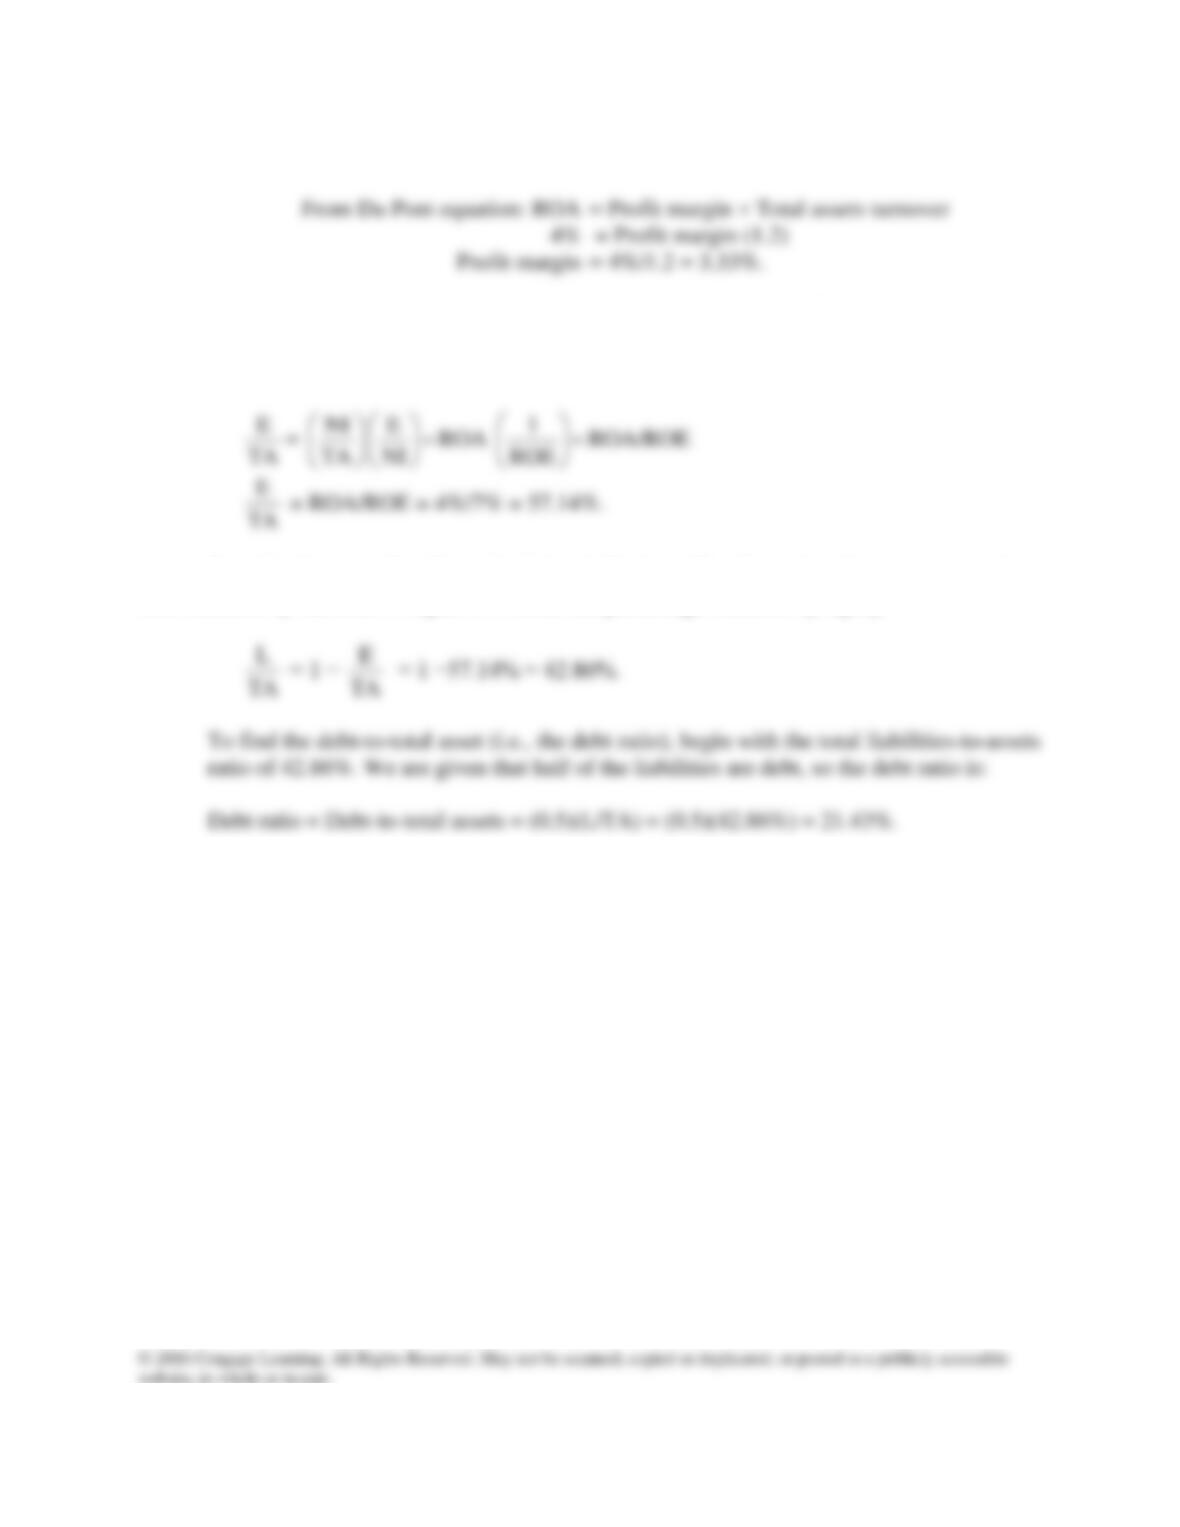
7-8 We are given ROA = 4%, ROE = 7%, and TAT = Sales/Total assets = 1.2×.
We can also calculate the company’s liabilities–to–assets (L/TA) ratio in a similar
manner, given the facts of the problem. We are given ROA = NI/TA and ROE= NI/E. We
begin by finding the percentage of assets financed by equity, E/TA:
By definition, L + E = Total liabilities & Equity = TA. Therefore, the percentage of the
firm financed by liabilities is equal to 1 minus the percentage financed by equity:
Answers and Solutions: 7 – 13
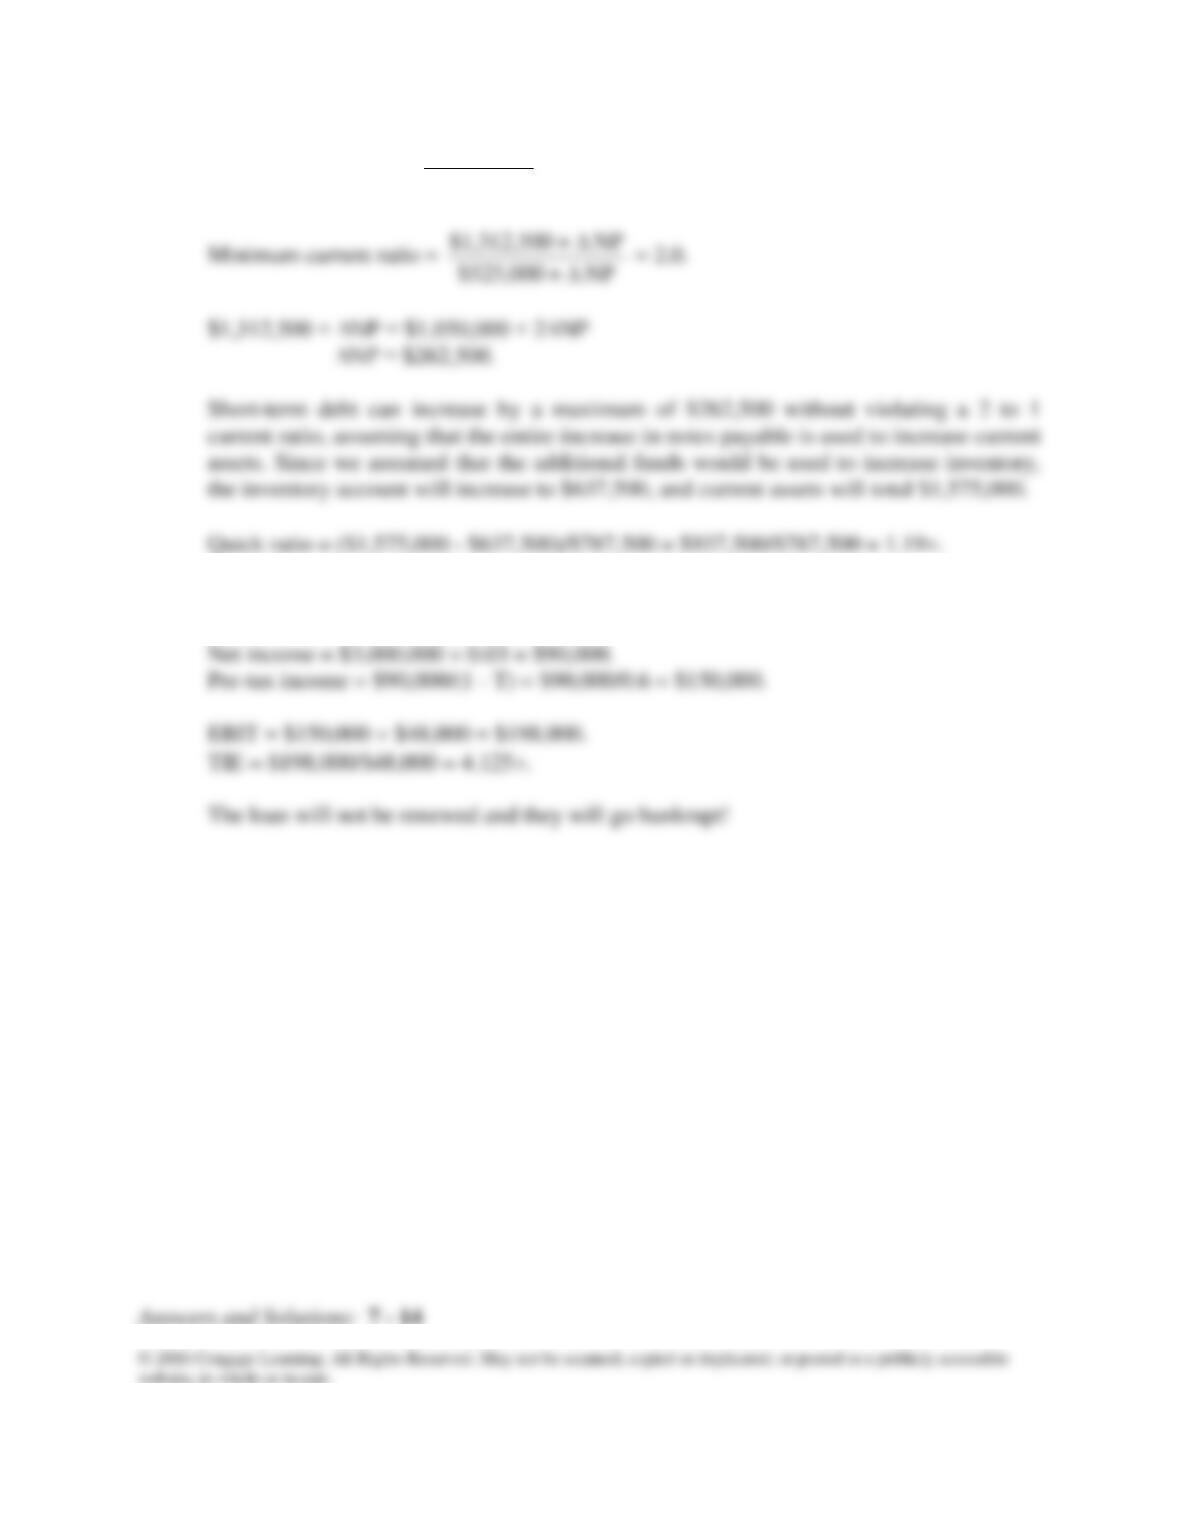
7-9 Present current ratio =
$525,000
$1,312,500
= 2.5.
7-10 TIE = EBIT/INT, so find EBIT and INT.
Interest = $600,000 × 0.08 = $48,000.
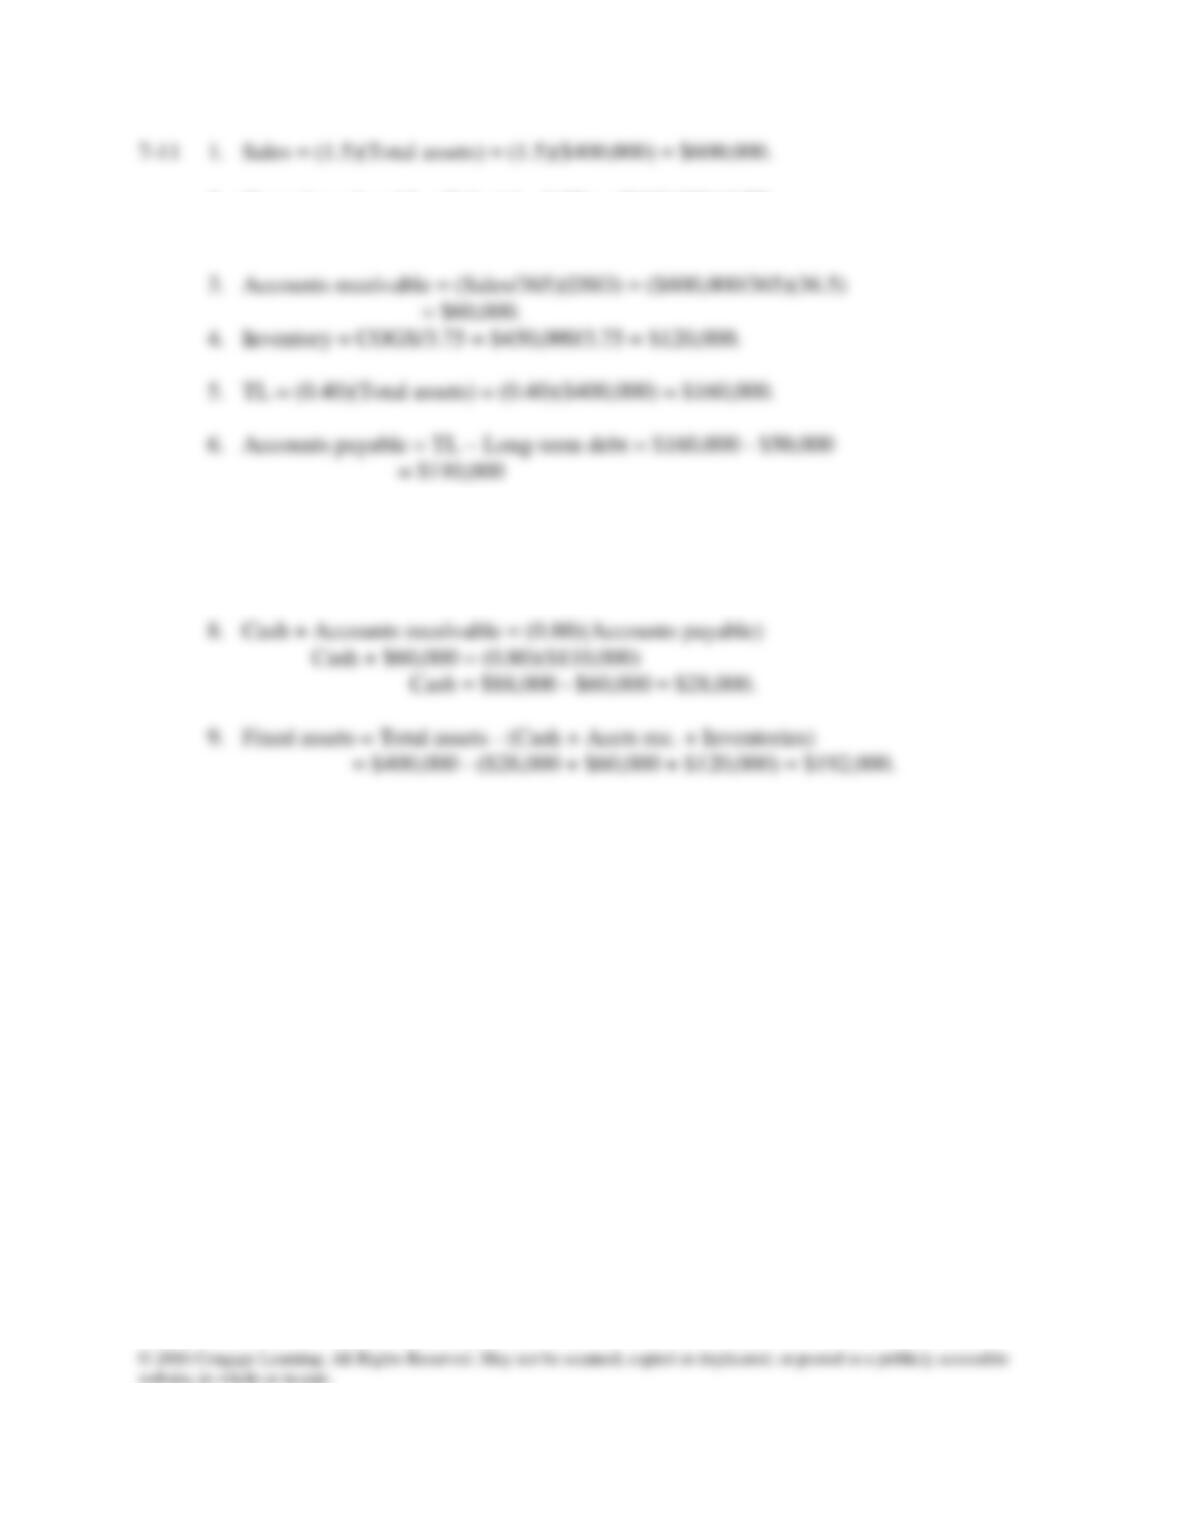
2. Cost of goods sold = (Sales)(1 – 0.25) = ($600,000)(0.75)
= $450,000.
7. Common stock =Total liabilities
and equity – TL – Retained earnings
= $400,000 – $160,000 – $100,000 = $140,000.
Answers and Solutions: 7 – 15
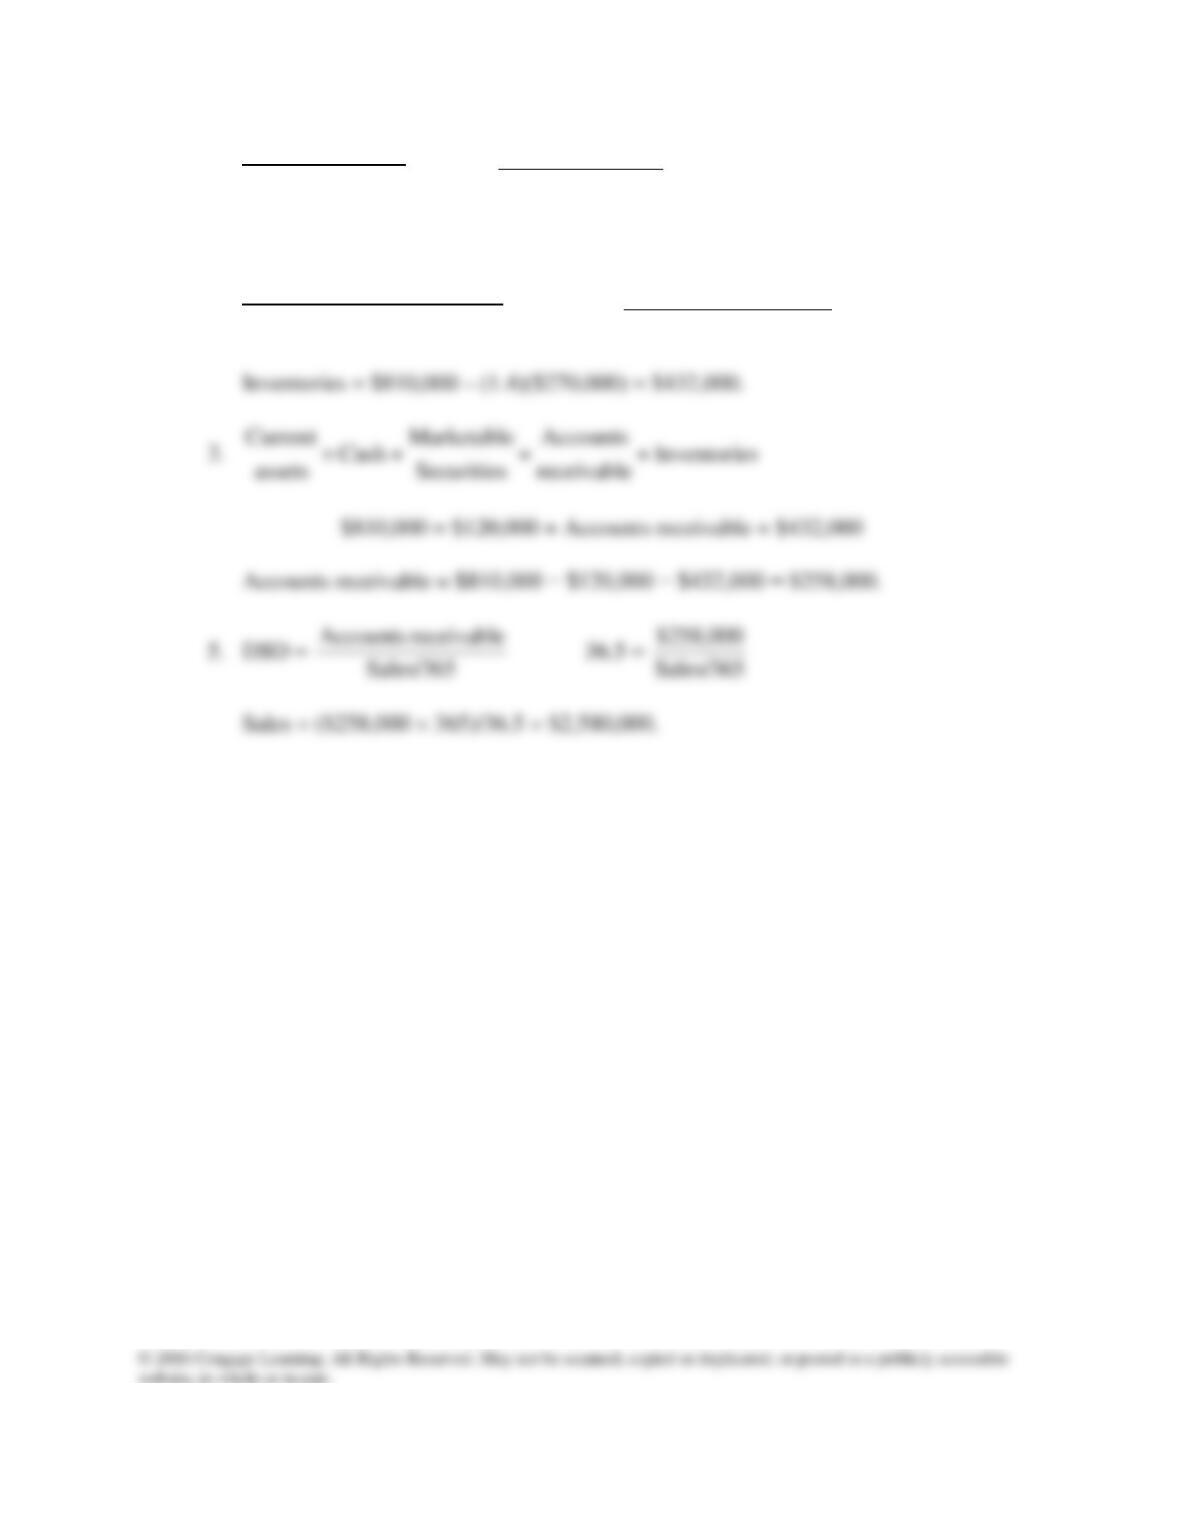
7-12 1. Current assets
Current liabilities = 3.0×
sliabilitieCurrent
$810,000
= 3.0×
Current liabilities = $810,000/3 = $270,000.
2. Current assets − Inventories
Current liabilities = 1.4×
$270,000
sInventorie – $810,000
= 1.4×
Answers and Solutions: 7 – 16