
178
Chapter 7 Risk, Return, and the Capital Asset Pricing Model
Chapter Overview
Opening Focus Discussion Questions
1. Goldman analysts were recommending that investors put their money in high beta stocks.
This chapter discusses:
7-1. Expected Returns
7-2. Risk and Return for Portfolios
Technology
1. Smart Concepts show how short selling affects the risk/return profile of a portfolio.
3. Smart Ideas Video shows William Sharpe of Stanford University speaking about CAPM risk
and investors aversion to doing badly in bad times..
5. Smart Practices Video introduces Todd Richter, Managing Director of Bank of America Se-
curities, discussing market efficiency and his belief that markets are not always efficient.
6. Smart Concepts Animation explains the meaning and implications of market efficiency.
Lecture Guide
This chapter takes up where Chapter 6 left off. Chapter 7 introduces beta, the relevant measure of
risk. If investors only are concerned about systematic risk, and beta measures this risk, then there

7.1 Expected Returns
7.1a Historical Approach for Estimating Expected Returns
There is a great deal of information available concerning historical returns, and a great deal of de-
bate about whether stock returns will continue to be as high as they have been in the past century.
7.1b Probabilistic Approach for Estimating Expected Returns
Explain that the market as a whole makes forecasts for the future. Those expectations, or the prob-
7.1c Risk-based Approach
A second method for estimating expected returns is a risk-based approach. This assumes that in-
vestors hold diversified portfolios and, therefore, only systematic risk – risk that affects the entire
market – is relevant. Students should understand the statement that the market only rewards sys-
tematic risk, or that only systematic risk is priced. Investors expect to be rewarded for taking on

180 Instructor’s Manual
Instead, most mutual funds fail to make excess returns, particularly after taking
transactions costs and fund fees into account.
Fig. 7.1A Scatter Plot of Monthly Returns on Saks Inc. vs. The S&P 500 Stock Index
Fig. 7.1B Scatter Plot of Monthly Returns on ConAgra vs. The S&P 500 Stock Index
Fig. 7.1C Scatter Plot of Monthly Returns On a Portfolio Equally Invested in Saks and
ConAgra
The difference between scatter plots for the two firms is highly visible. Data points for the Saks
Inc. are more concentrated, and it is easy to see an upward sloping pattern to the points. As ex-
Fig. 7.2 Beta and Expected Returns
This is a graphical representation of the Capital Asset Pricing Model. Note the assumptions of the
CAPM:
• There are no transactions costs or taxes
7.2 Risk and Return for Portfolios
7.2a Portfolio Expected Returns
Most investors do not hold just a single security – they hold a portfolio of securities. Port-
folio beta is simply a weighted average of the securities in the portfolio. Note that while a typical

Chapter 7 Risk, Return, and the CAPM 181
7.2b Portfolio Risk
Relevant, or market, portfolio risk is much easier to compute than portfolio standard deviation.
While portfolio total risk, as measured by standard deviation or variance, is not a weighted average,
portfolio beta is a weighted average of the betas of the individual securities in the portfolio. An
individual stock beta may not be accurate because it depends on the time period, whether any sub-
7.3 Pulling It All Together: The CAPM
The CAPM is derived from the Security Market Line and is the best place to start to give them a
Security Market Line and CAPM
This section presents the equation for the security market line. Note that the x axis inter-
cept is the risk free rate. The slope of the line is the expected return on the market minus the risk
free rate. This is called the equity risk premium and is the reward that investors expect to take on
negative in the past.
CAPM is an extensively-studied model, and for the most part has been found to work well
enough. Point out to students the five testable assumptions of CAPM:
• Return should increase with risk
182 Instructor’s Manual
The first three have been empirically verified, but the slope is not as steep as CAPM predicts,
and the intercept is a little higher than CAPM predicts. This doesn’t mean CAPM doesn’t work; it
just isn’t perfect and is still widely used in practice in spite of its shortcomings.
It is true that for some stocks, average return has not depended on beta at certain times.
For example, there was a period of time when Apple Computer was financially distressed. Its beta
was computed at that time as 0.2, seemingly very low risk. At the same time IBM had a beta of
1.1. Looking at betas alone, you would conclude that Apple was a much safer investment than
The Security Market Line
Note that equilibrium means that all stocks are fairly priced. If all information were available to all
investors, stocks would always be fairly priced. There are tens of thousands of analysts studying
stocks and working to identify which ones to buy and which ones to sell. Their work helps return
mispriced securities to equilibrium.
Students should be familiar with the terminology concerning securities and the Security Market
Line:
• Overvalued or over priced. Although it is a little counterintuitive, these securities lie below the
SML. As investors identify these securities as overpriced (not returning as much as they
• Fairly priced. These securities return exactly what they should, given their risk level.
• Student Interaction: Students can take a “quiz” on the SML – in other words, hold a dis-
cussion on some of the main take aways concerning the Capital Asset Pricing Model. Ask
students the following discussion questions:
1. What is the return on a Treasury bill? The risk free rate
2. What is the required return on a stock with a variance of 25%? Who knows – the relevant
measure of risk is beta, not standard deviation or variance.
Chapter 7 Risk, Return, and the CAPM 183
6. Why is the CAPM called a pricing model when it only yields the required return on an as-
set? This return will be used in later chapters as the discount rate (or as a component in the
7.4 Are Stock Returns Predictable?
Many empirical studies have found that financial markets are largely efficient. For the
most part, publicly available information is incorporated into stock prices. This means that it is
very difficult to profit from undervalued securities using publicly available information. It is pos-
Risk, Return, and The CAPM
This chapter presents key concepts that will continue to be used in future chapters. Stu-
dents will take the principles learned here and apply them to a variety of situations, all requiring a
risk assessment.
Enrichment Exercises
1. Ask students to pick a company and download stock prices and index data (Yahoo! Finance is
a good source for this.) They should then compute total risk by converting their price series in-
to a return series by calculating returnt = (Pt – Pt-1)/Pt-1. Calculate the mean, standard deviation
Answers to Concept Review Questions
1. The difference between an asset’s expected return and its actual return is that the expected re-
turn is a best guess of what the actual return will be, but of course there is no guarantee that ac-
2. The historical approach begins with an estimate of the historical risk premium on a particular
asset. To that an analyst could add the current return on a risk-free instrument like a Treasury
bill to arrive at an estimate of expected return. This approach assumes that the historical risk

184 Instructor’s Manual
3. Both beta and expected returns are driven by systematic risk. Standard deviation measures both
4. The risk-based approach is the best approach for estimating a stock’s expected return for sev-
eral reasons. The historical approach is valid only to the extent that the future distribution of
returns is similar to the historical distribution. The probabilistic approach is difficult to imple-
5. The weight given to a particular stock in a particular stock in a portfolio can exceed 100 % if
leverage is involved. If, for example, an investor short sells a stock, they are borrowing money,
6. The standard deviation of an asset is a measure of its total risk which comprises both unsys-
tematic risk and systematic risk. The standard deviation of a portfolio is typically less than the
7. Three factors that influence a stock’s expected return according to the CAPM are the risk-free
rate, the beta, and the market risk premium.
8. A stock with no systematic risk has a beta of zero. From the equation of the Security Market
9. Competition for information makes the market efficient. It is the actions of traders who are try-
10. The CAPM is designed to establish a link between the risk of an asset and its expected return.
We expect that assets with higher betas will, on average, earn higher returns than assets with
Chapter 7 Risk, Return, and the CAPM 185
Answers to Self-Test Problems
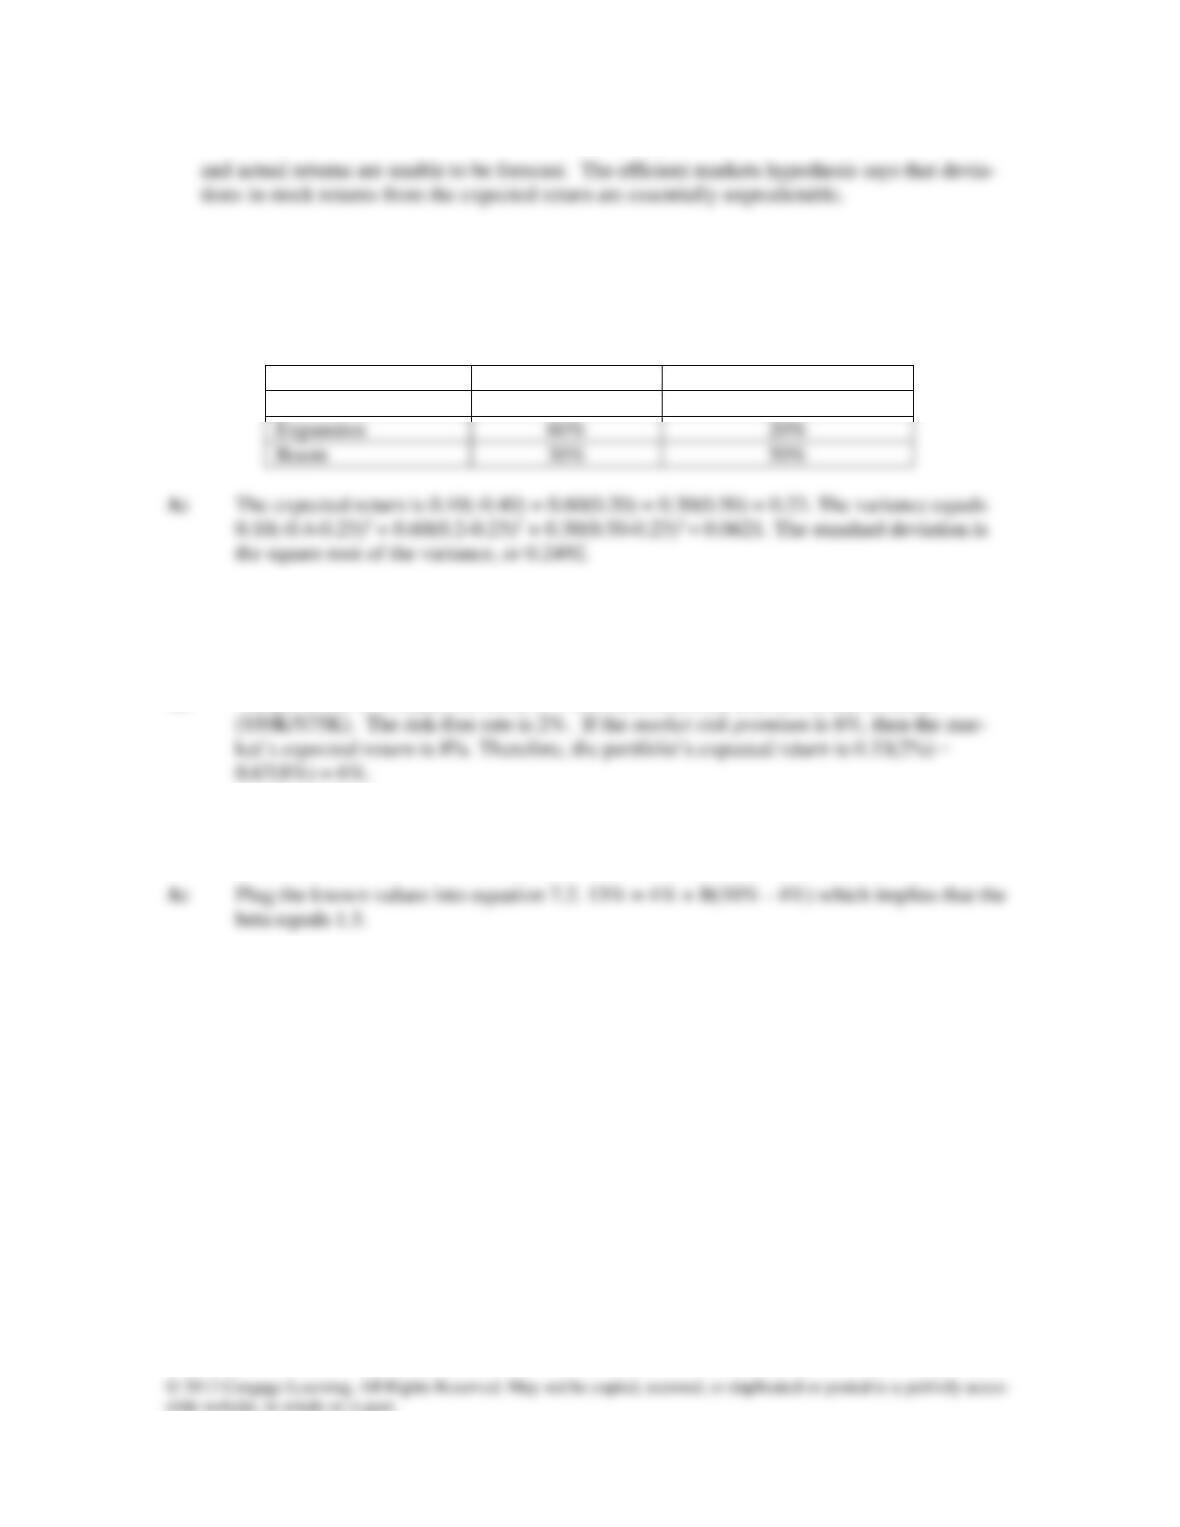
ST7-1. Calculate the mean, variance, and standard deviations for a stock with the probability dis-
tribution outlined in the following table:
Outcome
Probability
Stock Return
Recession
10%
-40%
ST7-2. You invest $25,000 in T-bills and $50,000 in the market portfolio. If the risk-free rate
equals 2% and the expected market risk premium is 6%, what is the expected return on
your portfolio?
A: The portfolio is invested one-third in T-bills ($25K/$75K) and two-thirds in stocks
ST7-3. The risk-free rate equals 4% and the expected return on the market is 10%. If a stock’s ex-
pected return is 13 %, what is the stock’s beta?
Answers to End-of-Chapter Questions
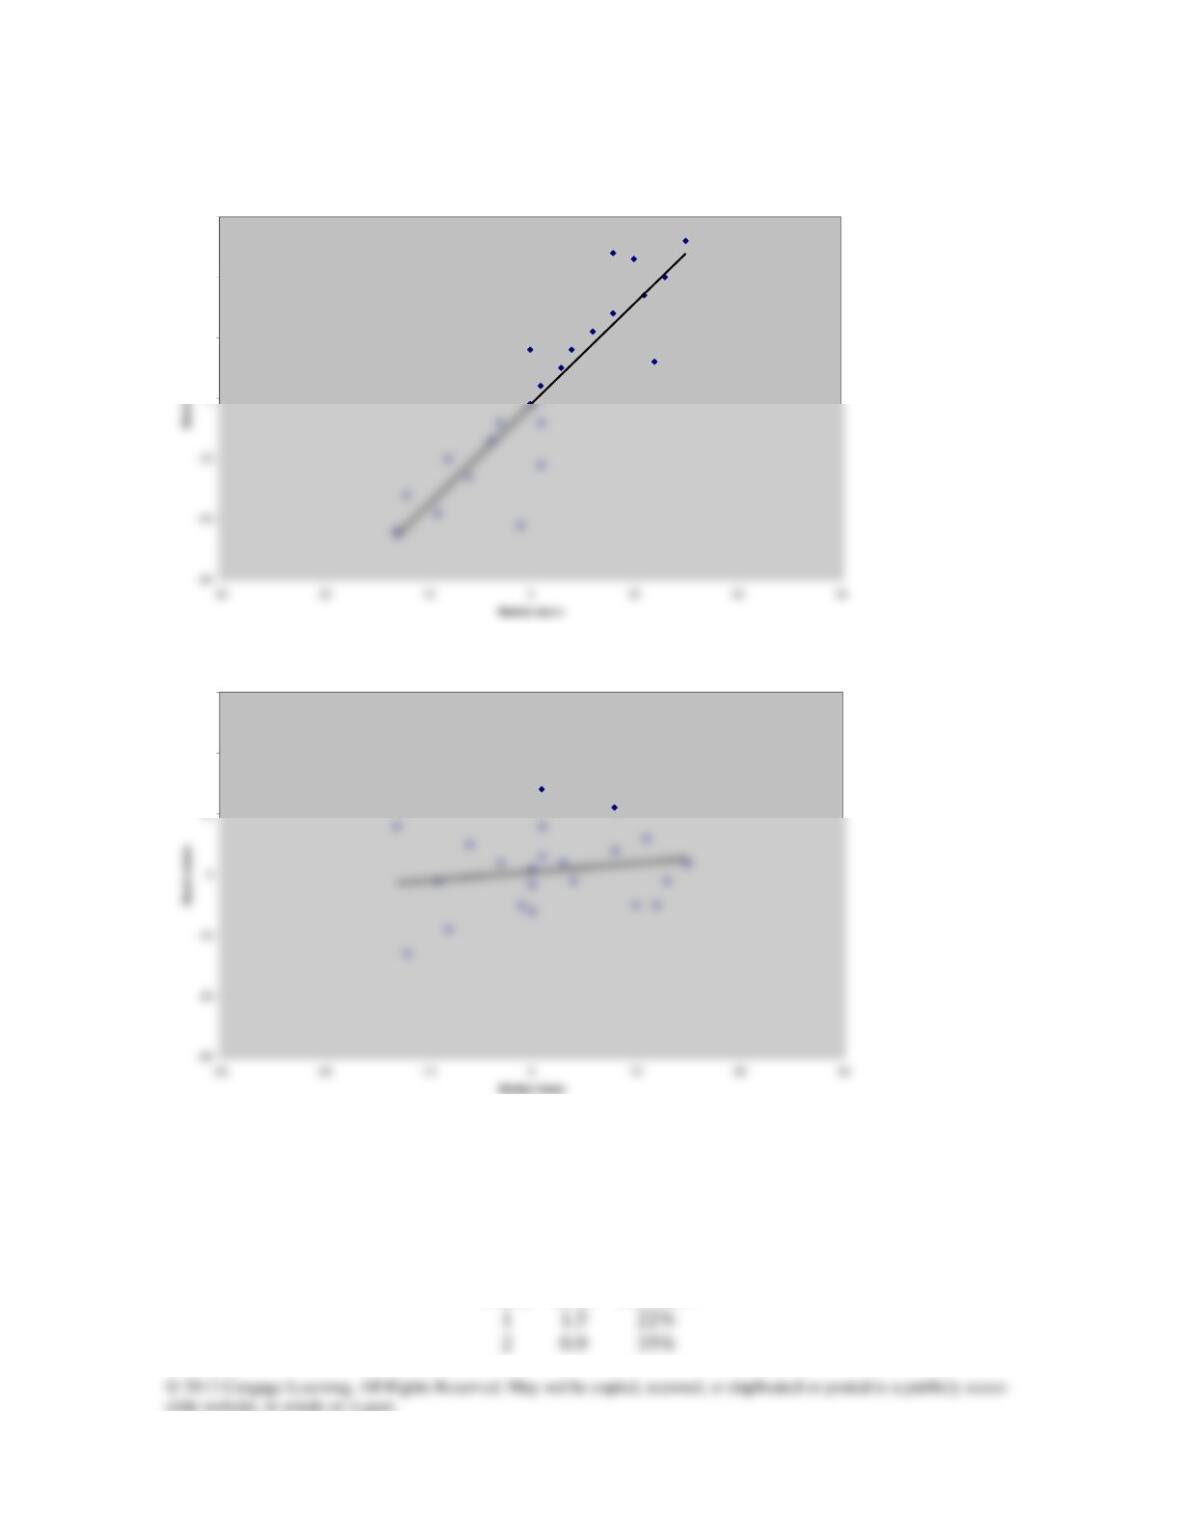
Q7–1. Based on the graphs below, which stock has more systematic risk, and which stock has
more unsystematic risk?
186 Instructor’s Manual
Stock #1
0
10
20
30
Stock #2
20
30
A7-1. The trend line is steeper for stock #1, so it is more sensitive to market movements and has
higher systematic risk. Most of the points cluster tightly around the line for stock #1, but
not so for stock #2. Most of stock #2’s risk is unsystematic.
Q7–2. The table below shows the expected return and standard deviation for two stocks. Is the
pattern shown in the table possible?
Stock
Beta
Std. Dev.

Chapter 7 Risk, Return, and the CAPM 187
A7-2. Yes, this is possible. A stock with a high beta might have a higher or lower standard devia-
tion than a stock with a low beta. The standard deviation is made up of both systematic and
Q7–3. Which type of company do you think will have a higher beta: a fast-food chain or a cruise-
ship firm?
A7-3. Cruises are luxuries, and cruise purchases are probably more sensitive to economic condi-
Q7–4. Is the data in the following table believable?
Stock
Std. Dev.
1
40%
2
60%
50-50 Portfolio
50%
A7-4. It is possible but not very likely that the portfolio’s standard deviation would equal the
Q7–5. How can investors hold a portfolio with a weight of more than 100 % in a particular asset?
A7-5. This requires taking a short position, or borrowing another asset. The portfolio weight on
the borrowed asset becomes negative, and the other weight can exceed one.
Q7–6. According to the Capital Asset Pricing Model, is the following data possible? Explain your
answer.
Asset
Return
Std. Dev.
#2
2%
20%
A7-6. Yes, this is possible. The first asset is the risk-free asset with a 4% return an no standard
Q7–7. Stock A has a beta of 1.5, and stock B has a beta of 1.0. Determine whether each of the
statements below is true or false.
188 Instructor’s Manual
b. Stock A has a higher expected return than Stock B.
c. The expected return on Stock A is 50 percent higher than the expected return on B.
Q7–8. If an asset lies above the security market line, is it overpriced or underpriced? Explain why.
A7-8. Underpriced. A stock above the SML offers an expected return that is “too high” given its
Q7–9. A stock has a beta equal to 1.0. Is the standard deviation of the stock equal to the standard
deviation of the market?
A7-9. No. The stock may have a high (low) degree of diversifiable risk, which is part of its
standard deviation, but not part of its beta. Because the stock has both systematic and un-
Q7-10. If stock prices move unpredictably, does this mean that investing in stocks is just gam-
bling? Why or why not?
A7-10. No. Stocks move randomly around a long-term trend in the sense the higher-risk stocks
earn higher returns, but year-to-year returns are essentially random.
A7-11. An efficient market will recognize the talent of a firm’s managers and price that into the
shares. That is, other things being equal, the stock price will be higher for firms with better
Solutions to End-of-Chapter Problems
Expected Returns
P7-1. a. Suppose that, over the long run, the risk-premium on stocks relative to Treasury bills
has been 7.6 % in the United States. Suppose also that the current Treasury bill yield
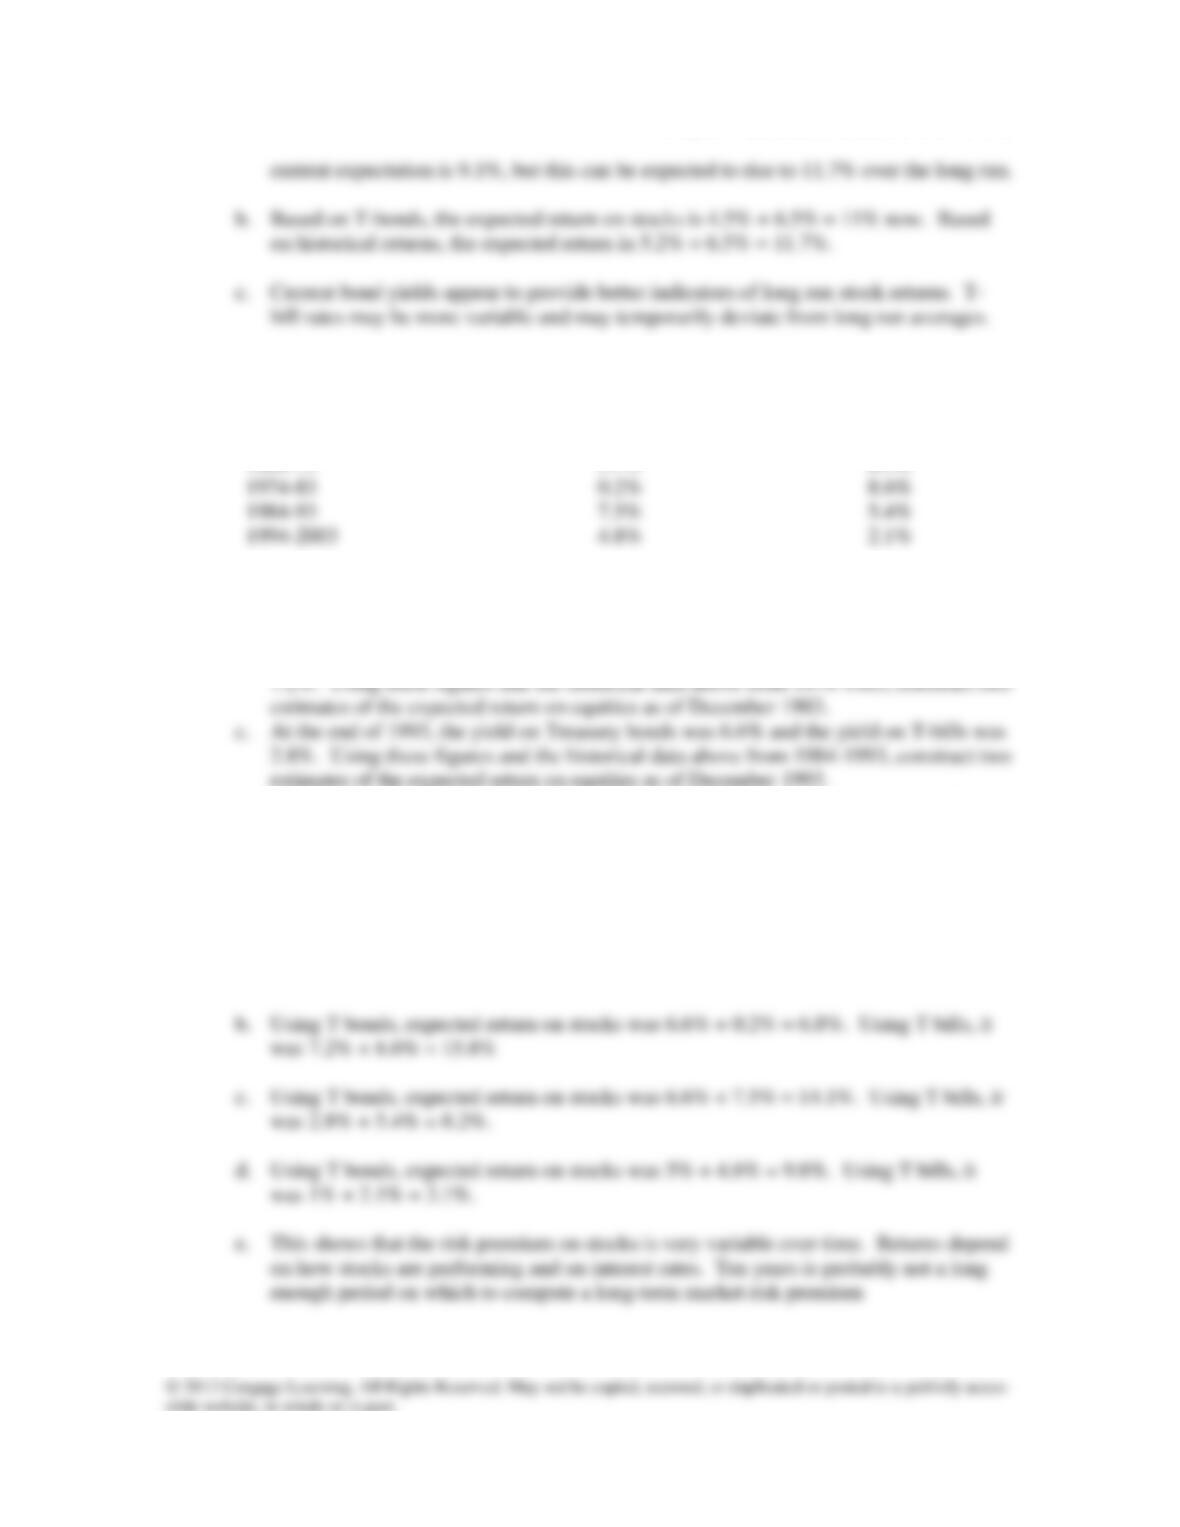
A7-1. a. Based on T-bills, the expected return on stocks is 1.5% + 7.6% = 9.1%. Based on his-
torical T-bill yields, the expected return is 4.1% + 7.6% = 11.7%. In other words, the
Chapter 7 Risk, Return, and the CAPM 189
P7-2. The table below shows the difference in returns between stocks and Treasury bills and the
difference between stocks and Treasury bonds at 10-year intervals.
Stocks vs. Bonds
Stocks vs. Bills
1964-73
3.7%
8.3%
1974-83
1984-93
a. At the end of 1973, the yield on Treasury bonds was 6.6% and the yield on T-bills was
7.2%. Using these figures and the historical data above from 1964-1973, construct two
estimates of the expected return on equities as of December 1973.
b. At the end of 1983, the yield on Treasury bonds was 6.6% and the yield on T-bills was
estimates of the expected return on equities as of December 1993.
d. At the end of 2003, the yield on Treasury bonds was 5.0% and the yield on T-bills was
1.0%. Using these figures and the historical data above from 1994-2003, construct two
estimates of the expected return on equities as of December 2003.
e. What lessons do you learn from this exercise? How much do your estimates of the ex-
pected return on equities vary over time, and why do they vary?
A7-2. a. Using T bonds, expected return on stocks was 6.6% + 3.7% = 10.3%. Using T bills, it
was 7.2% + 8.3% = 15.5%.